Embed Size (px)
Citation preview
Impacts of land-use land cover and urban canopies on Meteorology and Air Quality from
WRF modelling
Manju Mohan, Professor
Centre for Atmospheric Sciences, Indian Institute of Technology Delhi,
Hauz Khas, New Delhi, India email: [email protected]
25-27 May 2017
Urban Meteorology and Climate Conference; ANCST-CityU Sponsored Conference at City University Hongkong
Prof M Mohan IIT Delhi, India
Overview
• Introduction
• Case studies about impact of LULC on weather and Air Quality
• Field Campaigns over Delhi
• WRF-Modelling including landuse landcover and urban canopies
• Conclusions
2 Urban Meteorology and Climate Conference;Hongkong; 25-27 May 2017
Prof M Mohan IIT Delhi, India
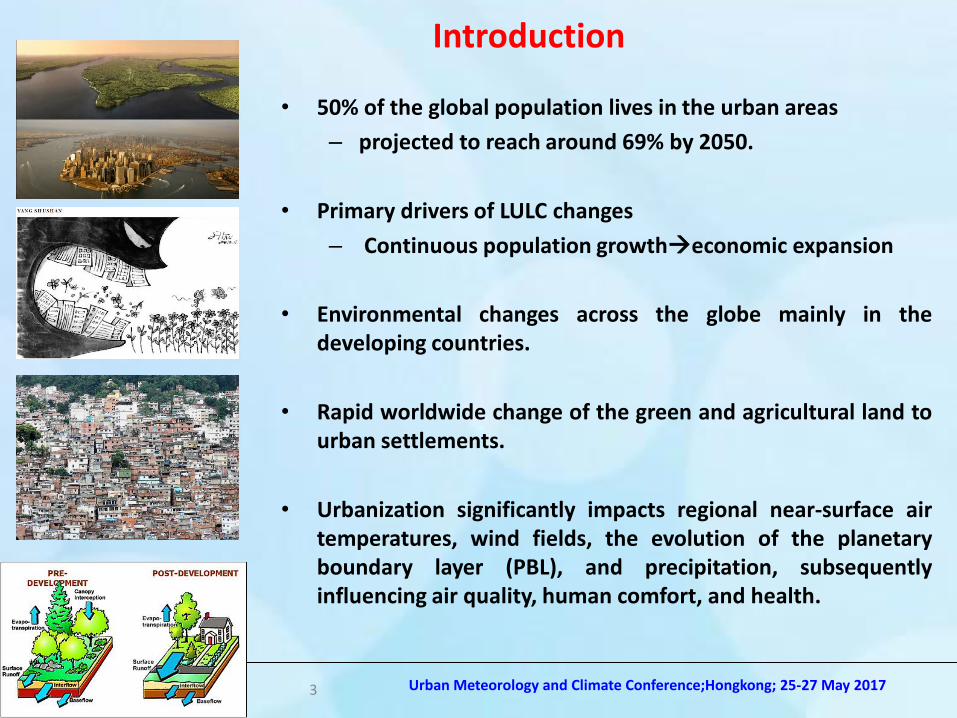
• 50% of the global population lives in the urban areas
– projected to reach around 69% by 2050.
• Primary drivers of LULC changes
– Continuous population growtheconomic expansion
• Environmental changes across the globe mainly in the developing countries.
• Rapid worldwide change of the green and agricultural land to urban settlements.
• Urbanization significantly impacts regional near-surface air temperatures, wind fields, the evolution of the planetary boundary layer (PBL), and precipitation, subsequently influencing air quality, human comfort, and health.
Introduction
3 Urban Meteorology and Climate Conference;Hongkong; 25-27 May 2017
Prof M Mohan IIT Delhi, India
Role of land use/land cover
• Fluxes of energy, momentum, water, heat are parametrized in NWP models as functions of
– Surface albedo
– Surface moisture availability
– Surface emissivity
– Surface roughness
– Surface thermal inertia
Which are specified for a given LULC.
• Thus, Land use/cover determines inputs to be used by land surface models which compute land-atmosphere fluxes.
Introduction (contd..)
4 Urban Meteorology and Climate Conference;Hongkong; 25-27 May 2017
Prof M Mohan IIT Delhi, India
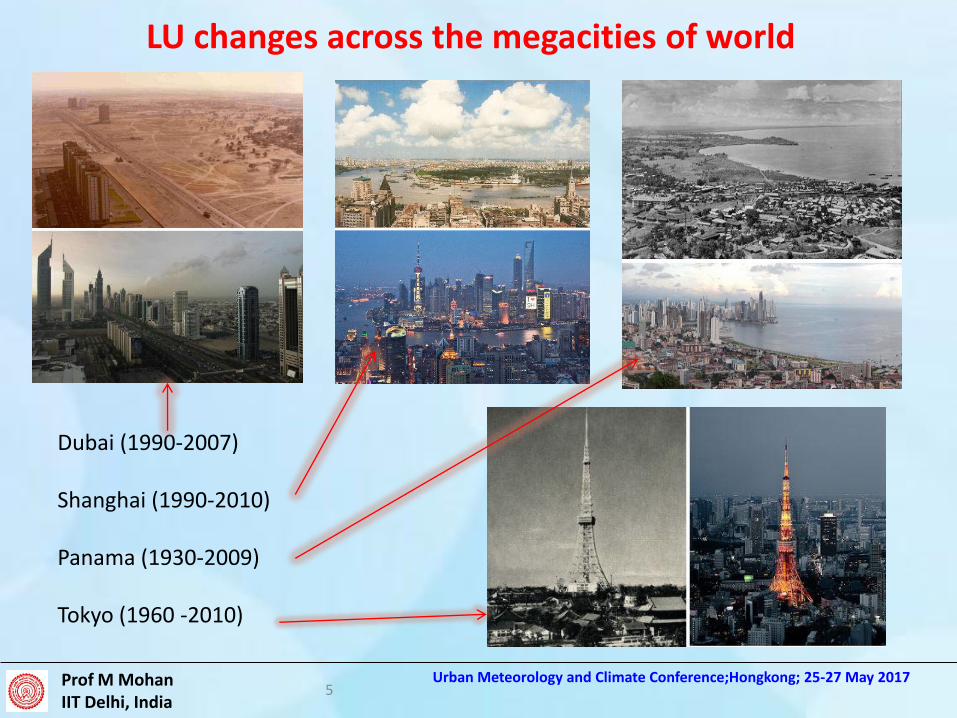
LU changes across the megacities of world
Dubai (1990-2007) Shanghai (1990-2010) Panama (1930-2009) Tokyo (1960 -2010)
5 Urban Meteorology and Climate Conference;Hongkong; 25-27 May 2017
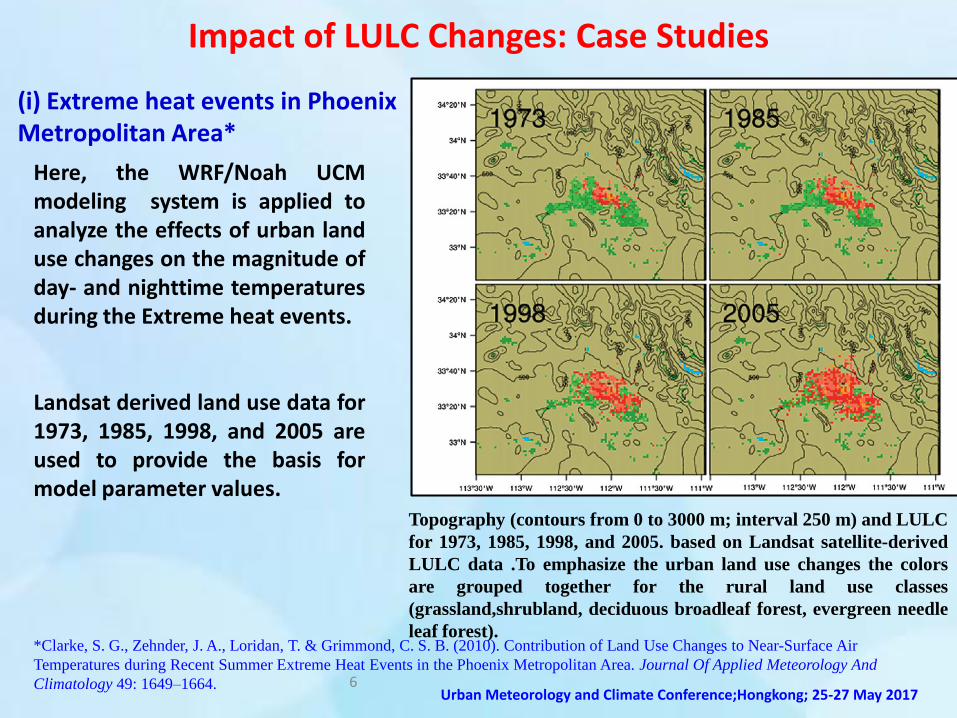
Topography (contours from 0 to 3000 m; interval 250 m) and LULC
for 1973, 1985, 1998, and 2005. based on Landsat satellite-derived
LULC data .To emphasize the urban land use changes the colors
are grouped together for the rural land use classes
(grassland,shrubland, deciduous broadleaf forest, evergreen needle
leaf forest).
Impact of LULC Changes: Case Studies
*Clarke, S. G., Zehnder, J. A., Loridan, T. & Grimmond, C. S. B. (2010). Contribution of Land Use Changes to Near-Surface Air
Temperatures during Recent Summer Extreme Heat Events in the Phoenix Metropolitan Area. Journal Of Applied Meteorology And
Climatology 49: 1649–1664.
Here, the WRF/Noah UCM modeling system is applied to analyze the effects of urban land use changes on the magnitude of day- and nighttime temperatures during the Extreme heat events. Landsat derived land use data for 1973, 1985, 1998, and 2005 are used to provide the basis for model parameter values.
(i) Extreme heat events in Phoenix Metropolitan Area*
6 Urban Meteorology and Climate Conference;Hongkong; 25-27 May 2017
Prof M Mohan IIT Delhi, India
Clarke et al, (2010). Journal Of Applied Meteorology And Climatology 49: 1649–1664.
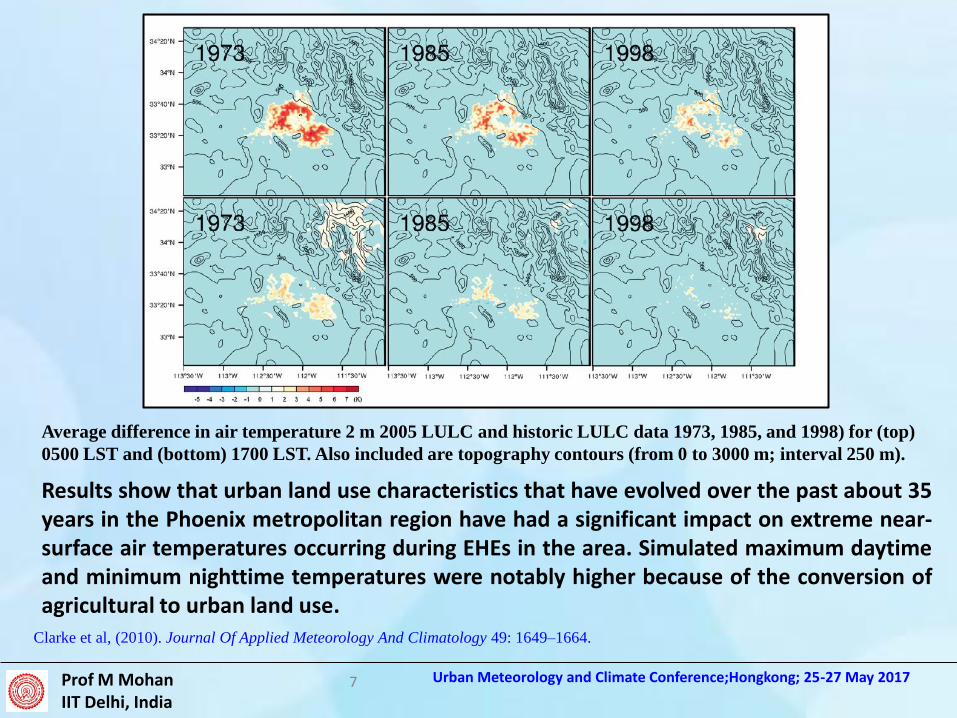
Average difference in air temperature 2 m 2005 LULC and historic LULC data 1973, 1985, and 1998) for (top)
0500 LST and (bottom) 1700 LST. Also included are topography contours (from 0 to 3000 m; interval 250 m).
Results show that urban land use characteristics that have evolved over the past about 35 years in the Phoenix metropolitan region have had a significant impact on extreme near-surface air temperatures occurring during EHEs in the area. Simulated maximum daytime and minimum nighttime temperatures were notably higher because of the conversion of agricultural to urban land use.
7 Urban Meteorology and Climate Conference;Hongkong; 25-27 May 2017
*Xuemei, W., Fei, C., Zhiyong, W., Zhang, M., Tewari, M., Guenther, A. & Wiedinmyer, C. (2009). Impacts of Weather Conditions Modified
by Urban Expansion on Surface Ozone: Comparison between the Pearl River Delta and Yangtze River Delta Regions. Advances In Atmospheric
Sciences, 26(5): 962–972
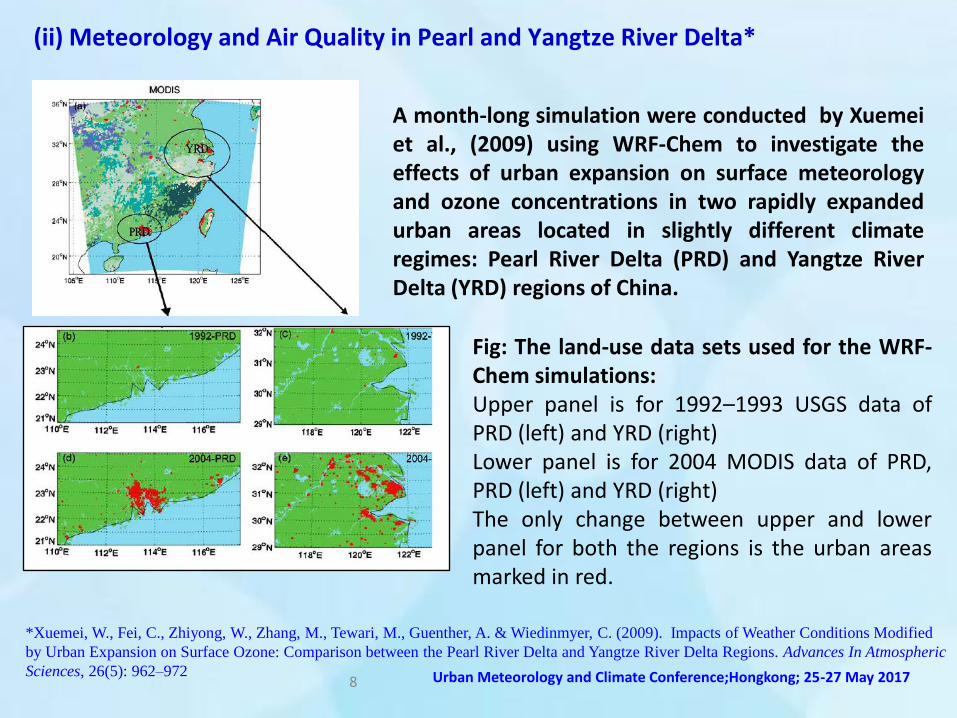
A month-long simulation were conducted by Xuemei et al., (2009) using WRF-Chem to investigate the effects of urban expansion on surface meteorology and ozone concentrations in two rapidly expanded urban areas located in slightly different climate regimes: Pearl River Delta (PRD) and Yangtze River Delta (YRD) regions of China.
Fig: The land-use data sets used for the WRF-Chem simulations: Upper panel is for 1992–1993 USGS data of PRD (left) and YRD (right) Lower panel is for 2004 MODIS data of PRD, PRD (left) and YRD (right) The only change between upper and lower panel for both the regions is the urban areas marked in red.
(ii) Meteorology and Air Quality in Pearl and Yangtze River Delta*
8 Urban Meteorology and Climate Conference;Hongkong; 25-27 May 2017
Prof M Mohan IIT Delhi, India
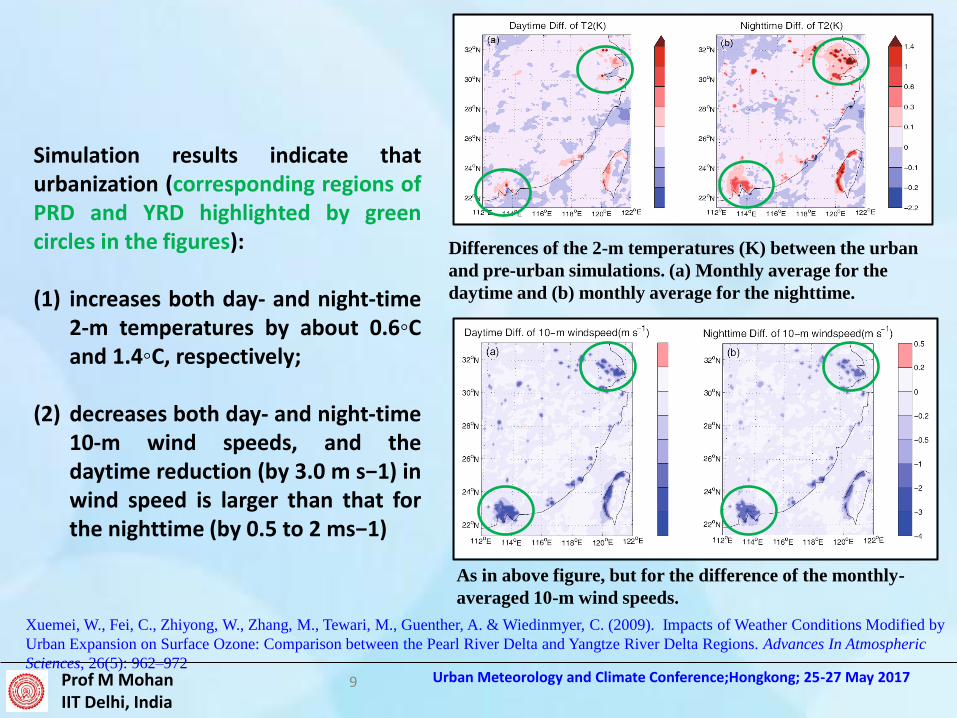
Differences of the 2-m temperatures (K) between the urban
and pre-urban simulations. (a) Monthly average for the
daytime and (b) monthly average for the nighttime.
As in above figure, but for the difference of the monthly-
averaged 10-m wind speeds.
Xuemei, W., Fei, C., Zhiyong, W., Zhang, M., Tewari, M., Guenther, A. & Wiedinmyer, C. (2009). Impacts of Weather Conditions Modified by
Urban Expansion on Surface Ozone: Comparison between the Pearl River Delta and Yangtze River Delta Regions. Advances In Atmospheric
Sciences, 26(5): 962–972
Simulation results indicate that urbanization (corresponding regions of PRD and YRD highlighted by green circles in the figures):
(1) increases both day- and night-time
2-m temperatures by about 0.6◦C and 1.4◦C, respectively;
(2) decreases both day- and night-time 10-m wind speeds, and the daytime reduction (by 3.0 m s−1) in wind speed is larger than that for the nighttime (by 0.5 to 2 ms−1)
9 Urban Meteorology and Climate Conference;Hongkong; 25-27 May 2017
Prof M Mohan IIT Delhi, India
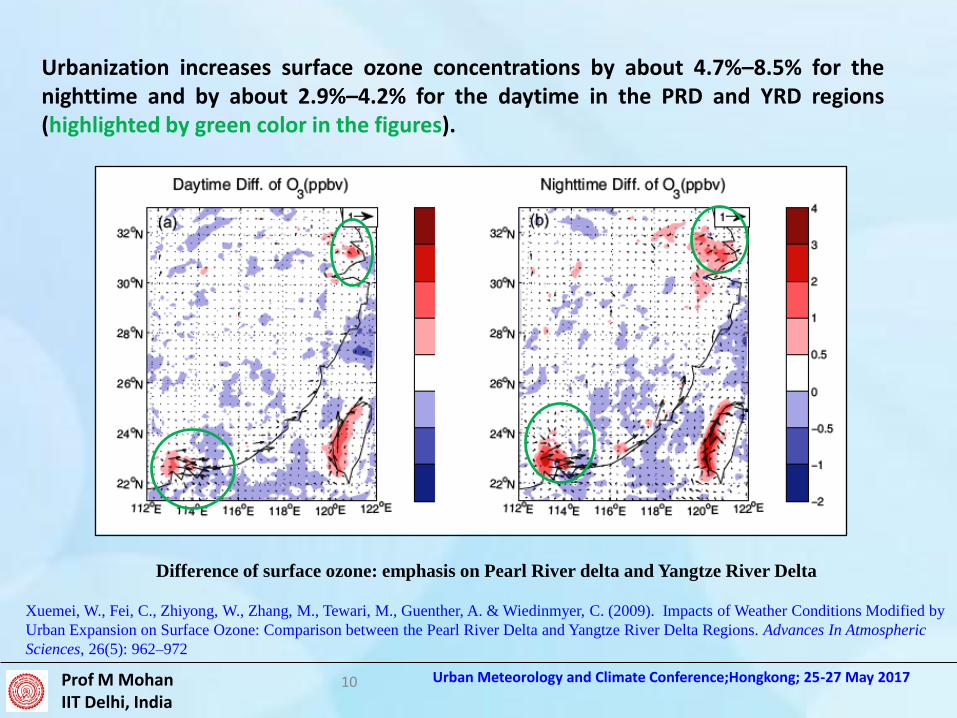
Difference of surface ozone: emphasis on Pearl River delta and Yangtze River Delta
Xuemei, W., Fei, C., Zhiyong, W., Zhang, M., Tewari, M., Guenther, A. & Wiedinmyer, C. (2009). Impacts of Weather Conditions Modified by
Urban Expansion on Surface Ozone: Comparison between the Pearl River Delta and Yangtze River Delta Regions. Advances In Atmospheric
Sciences, 26(5): 962–972
Urbanization increases surface ozone concentrations by about 4.7%–8.5% for the nighttime and by about 2.9%–4.2% for the daytime in the PRD and YRD regions (highlighted by green color in the figures).
10 Urban Meteorology and Climate Conference;Hongkong; 25-27 May 2017
Prof M Mohan IIT Delhi, India
(1) WRF/Chem model validation for Ozone
Gupta and Mohan; Atmos. Environ., (2015), 122, 220-229
11 Urban Meteorology and Climate Conference;Hongkong; 25-27 May 2017
Prof M Mohan IIT Delhi, India
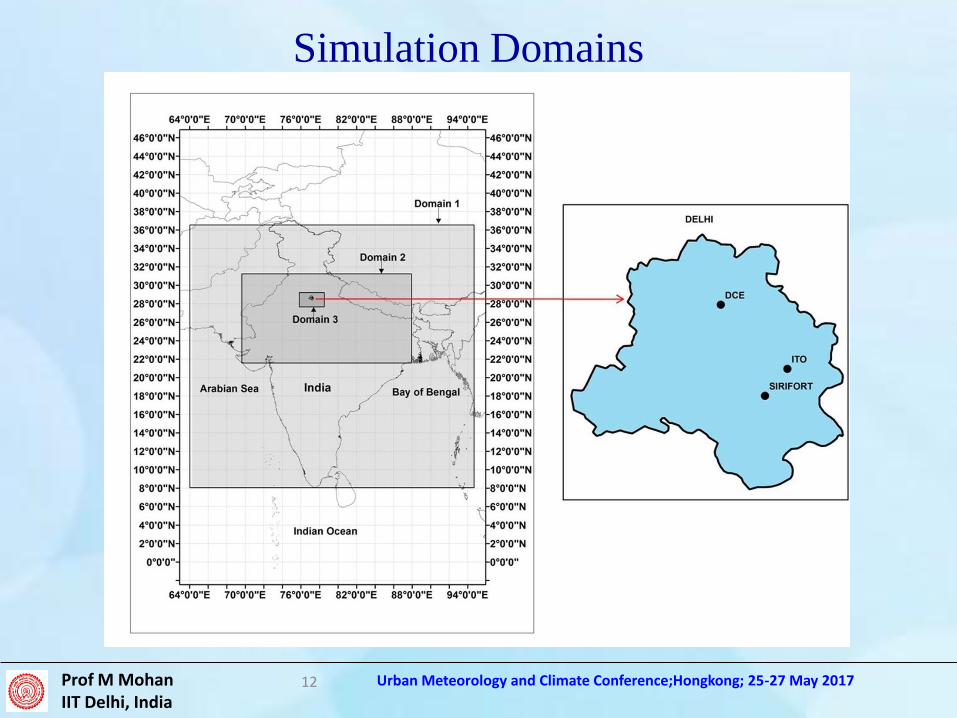
Simulation Domains
12 Urban Meteorology and Climate Conference;Hongkong; 25-27 May 2017
Prof M Mohan IIT Delhi, India
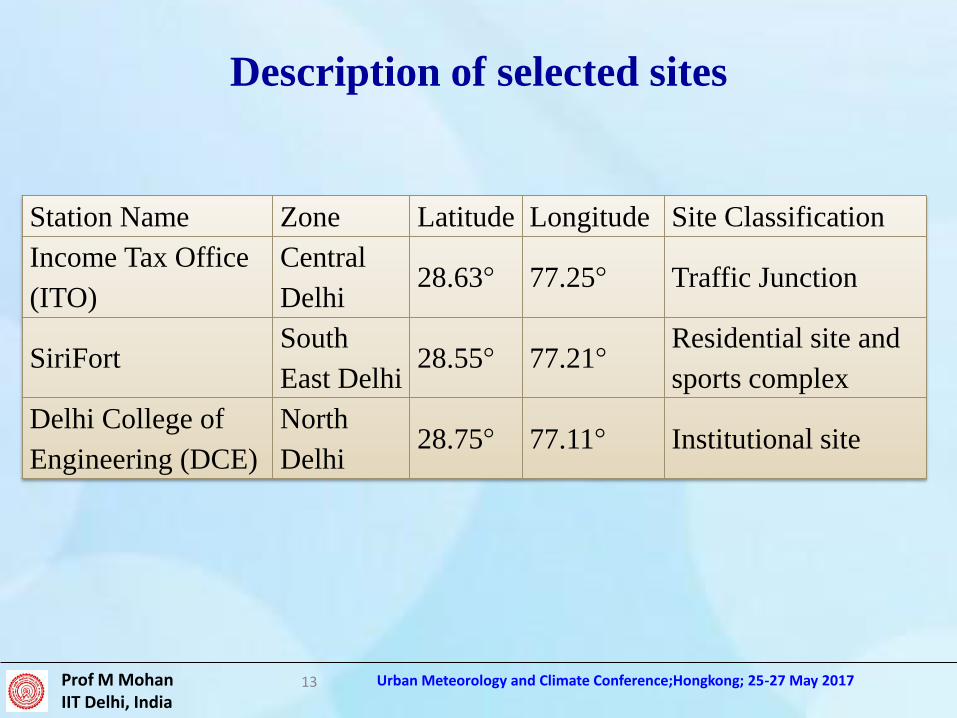
Description of selected sites
Station Name Zone Latitude Longitude Site Classification
Income Tax Office
(ITO)
Central
Delhi 28.63° 77.25° Traffic Junction
SiriFort South
East Delhi 28.55° 77.21°
Residential site and
sports complex
Delhi College of
Engineering (DCE)
North
Delhi 28.75° 77.11° Institutional site
13 Urban Meteorology and Climate Conference;Hongkong; 25-27 May 2017
Prof M Mohan IIT Delhi, India
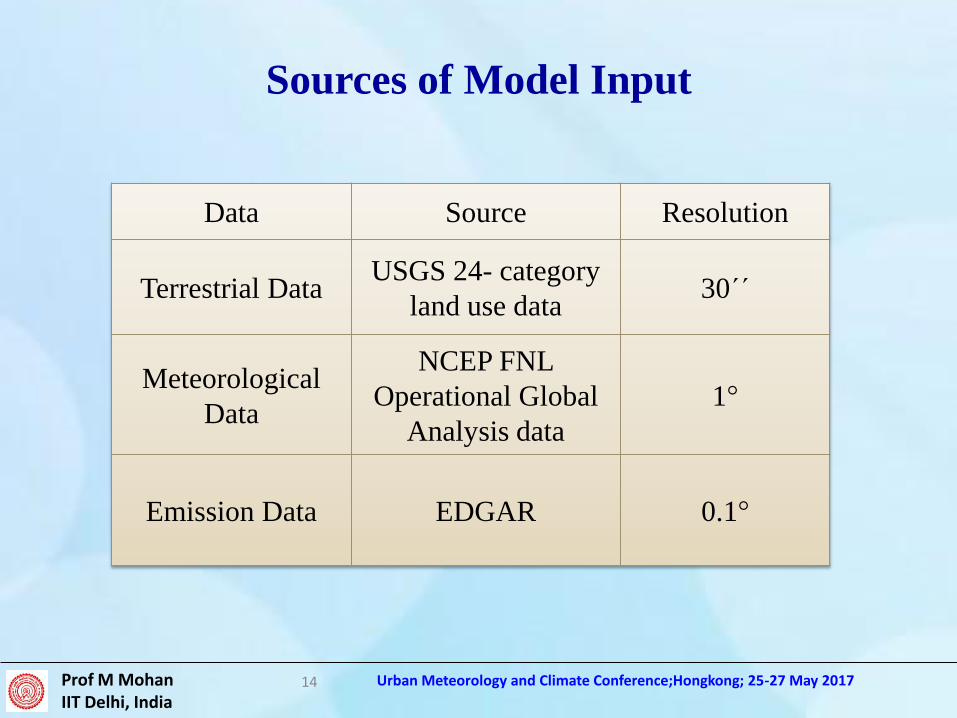
Sources of Model Input
Data Source Resolution
Terrestrial Data USGS 24- category
land use data 30´´
Meteorological
Data
NCEP FNL
Operational Global
Analysis data
1°
Emission Data EDGAR 0.1°
14 Urban Meteorology and Climate Conference;Hongkong; 25-27 May 2017
Prof M Mohan IIT Delhi, India
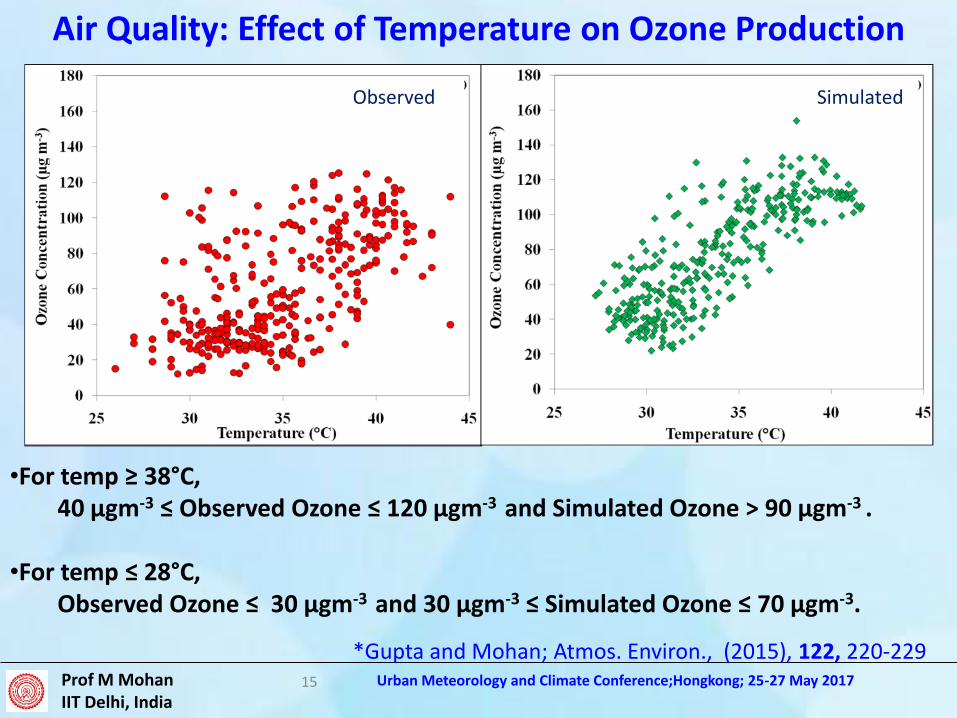
Air Quality: Effect of Temperature on Ozone Production
Observed Simulated
•For temp ≥ 38°C, 40 µgm-3 ≤ Observed Ozone ≤ 120 µgm-3 and Simulated Ozone > 90 µgm-3 .
•For temp ≤ 28°C,
Observed Ozone ≤ 30 µgm-3 and 30 µgm-3 ≤ Simulated Ozone ≤ 70 µgm-3.
*Gupta and Mohan; Atmos. Environ., (2015), 122, 220-229 15 Urban Meteorology and Climate Conference;Hongkong; 25-27 May 2017
Prof M Mohan IIT Delhi, India
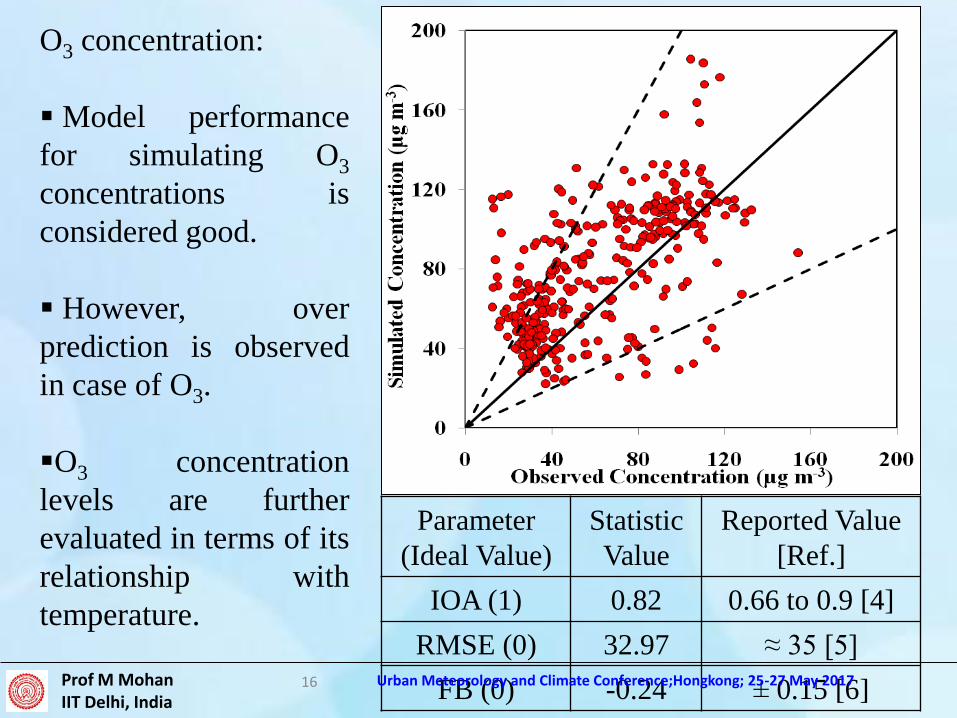
Parameter
(Ideal Value)
Statistic
Value
Reported Value
[Ref.]
IOA (1) 0.82 0.66 to 0.9 [4]
RMSE (0) 32.97 ≈ 35 [5]
FB (0) -0.24 ± 0.15 [6]
O3 concentration:
Model performance
for simulating O3
concentrations is
considered good.
However, over
prediction is observed
in case of O3.
O3 concentration
levels are further
evaluated in terms of its
relationship with
temperature.
16 Urban Meteorology and Climate Conference;Hongkong; 25-27 May 2017
Prof M Mohan IIT Delhi, India
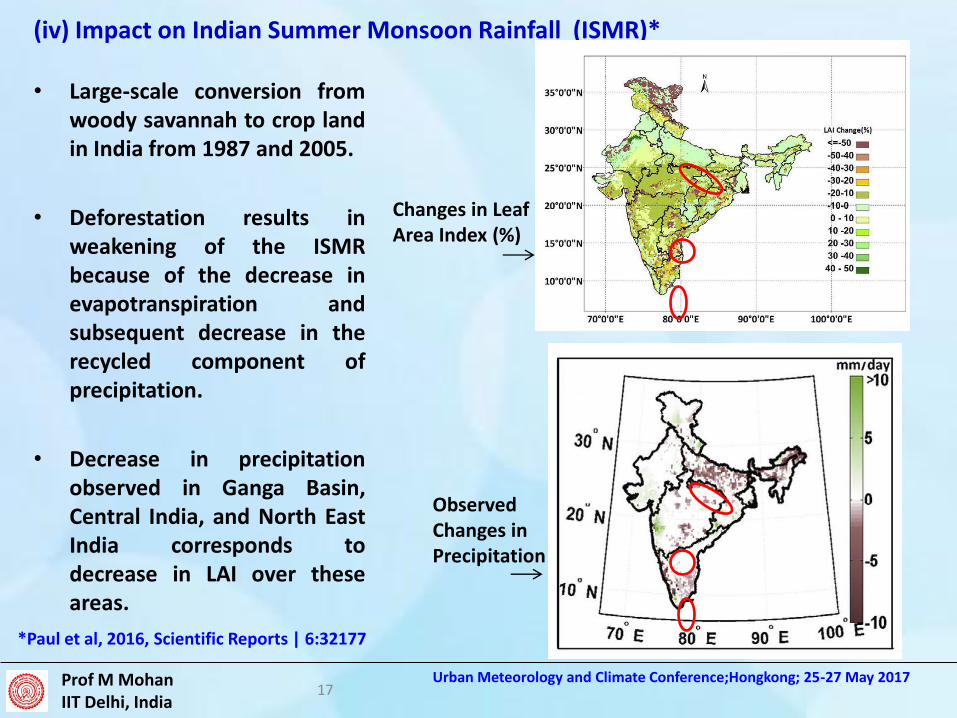
(iv) Impact on Indian Summer Monsoon Rainfall (ISMR)*
• Large-scale conversion from woody savannah to crop land in India from 1987 and 2005.
• Deforestation results in weakening of the ISMR because of the decrease in evapotranspiration and subsequent decrease in the recycled component of precipitation.
• Decrease in precipitation observed in Ganga Basin, Central India, and North East India corresponds to decrease in LAI over these areas.
*Paul et al, 2016, Scientific Reports | 6:32177
Changes in Leaf Area Index (%)
Observed Changes in Precipitation
17 Urban Meteorology and Climate Conference;Hongkong; 25-27 May 2017
Prof M Mohan IIT Delhi, India
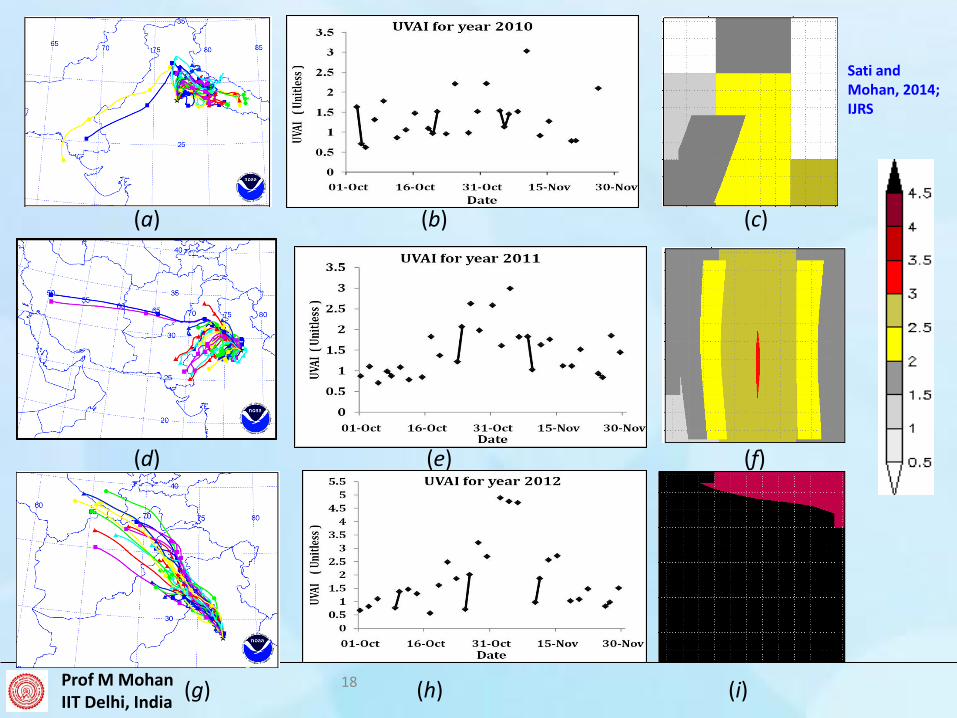
(a) (b) (c)
(d) (e) (f)
(g) (h) (i)
Sati and Mohan, 2014; IJRS
18
Prof M Mohan IIT Delhi, India
LULC Changes and Impacts Case Study: Delhi
19 Urban Meteorology and Climate Conference;Hongkong; 25-27 May 2017
Prof M Mohan IIT Delhi, India
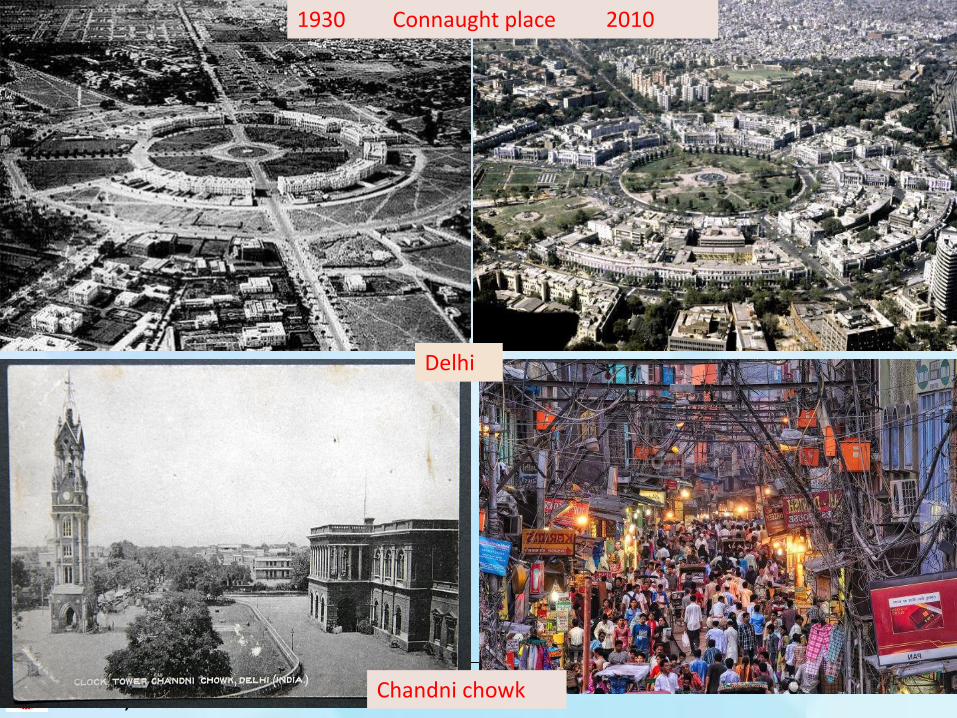
1930 Connaught place 2010
Chandni chowk
Delhi
20
Prof M Mohan IIT Delhi, India
IPCC has recognized* connections between urbanization and the development of UHI in several cities of the world including Delhi . The report includes above studies in Delhi which have explored this relationship
– Dynamics of Urbanization and LULC (Mohan et al, 2011): shows there has been significant change in LULC which is expected to have led to changes in temperatures (ISRO, RESPOND Project; 2007-2010).
– Urban Heat Island and Temperature Trends (Mohan et al, 2011) wherein some signatures of heat island effect were obtained to relate urbanisation with change in temperature trends (ISRO, RESPOND Project; 2007-2010).
– UHI based on ambient and satellite derived temperatures (Mohan et al, 2012) in which systematic field campaign was carried out to estimate existing UHI effect (Indo-Japanese Cooperative Project on Heat Island Effect 2008-2015).
*IPCC WGII AR5 Chapter 8, 2014
21 Urban Meteorology and Climate Conference;Hongkong; 25-27 May 2017
Prof M Mohan IIT Delhi, India
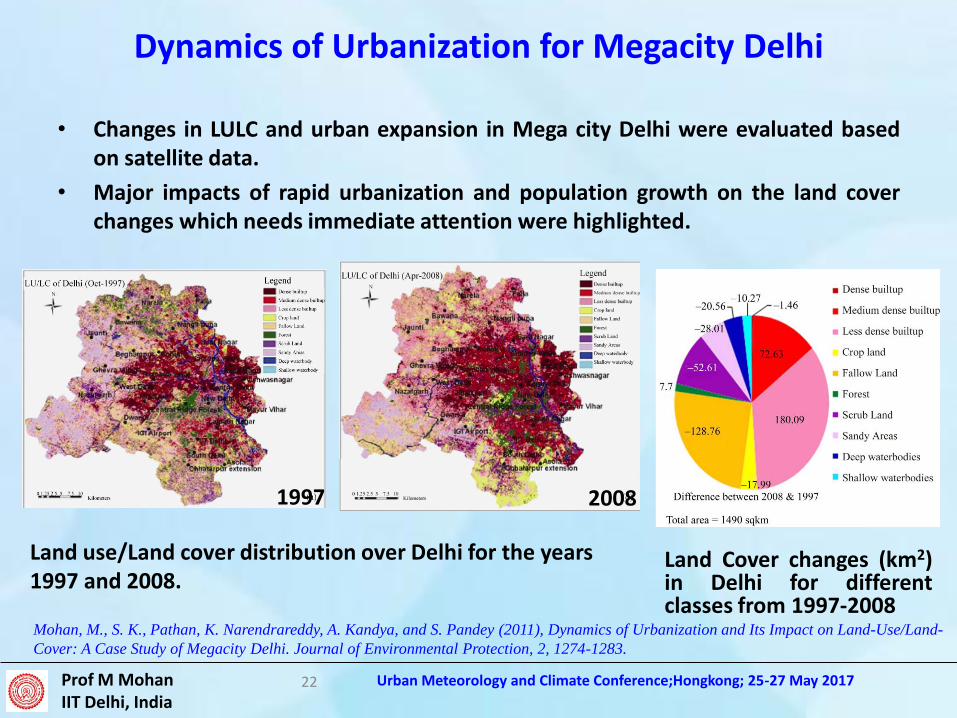
Dynamics of Urbanization for Megacity Delhi
• Changes in LULC and urban expansion in Mega city Delhi were evaluated based on satellite data.
• Major impacts of rapid urbanization and population growth on the land cover changes which needs immediate attention were highlighted.
Land Cover changes (km2) in Delhi for different classes from 1997-2008
Mohan, M., S. K., Pathan, K. Narendrareddy, A. Kandya, and S. Pandey (2011), Dynamics of Urbanization and Its Impact on Land-Use/Land-
Cover: A Case Study of Megacity Delhi. Journal of Environmental Protection, 2, 1274-1283.
Land use/Land cover distribution over Delhi for the years 1997 and 2008.
1997 2008
22 Urban Meteorology and Climate Conference;Hongkong; 25-27 May 2017
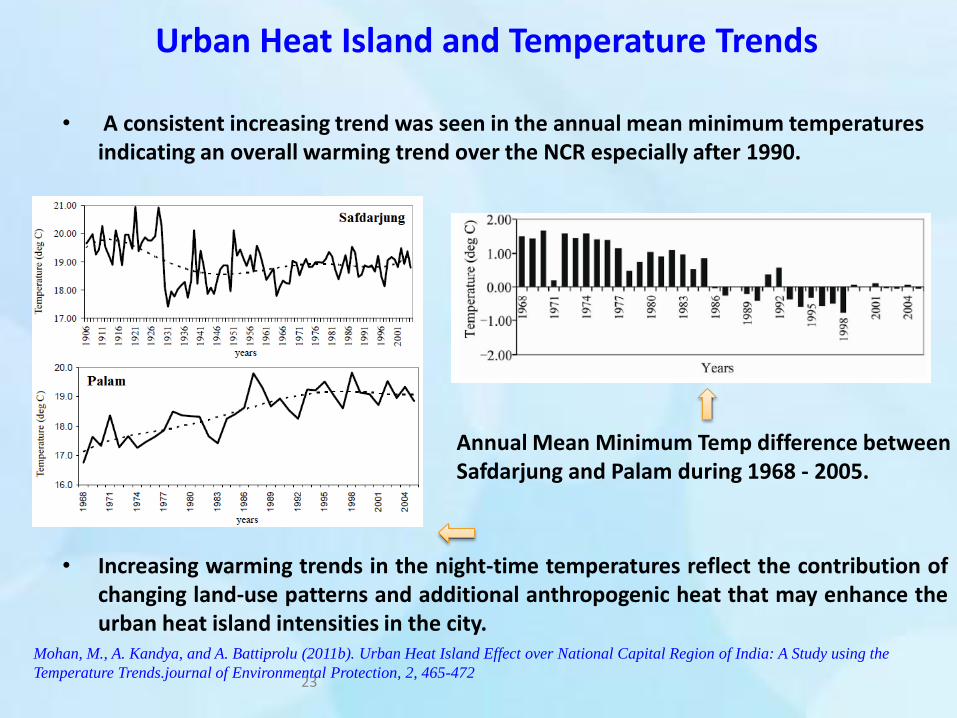
Urban Heat Island and Temperature Trends
• A consistent increasing trend was seen in the annual mean minimum temperatures indicating an overall warming trend over the NCR especially after 1990.
• Increasing warming trends in the night-time temperatures reflect the contribution of changing land-use patterns and additional anthropogenic heat that may enhance the urban heat island intensities in the city.
Annual Mean Minimum Temp difference between Safdarjung and Palam during 1968 - 2005.
Mohan, M., A. Kandya, and A. Battiprolu (2011b). Urban Heat Island Effect over National Capital Region of India: A Study using the
Temperature Trends.journal of Environmental Protection, 2, 465-472 23
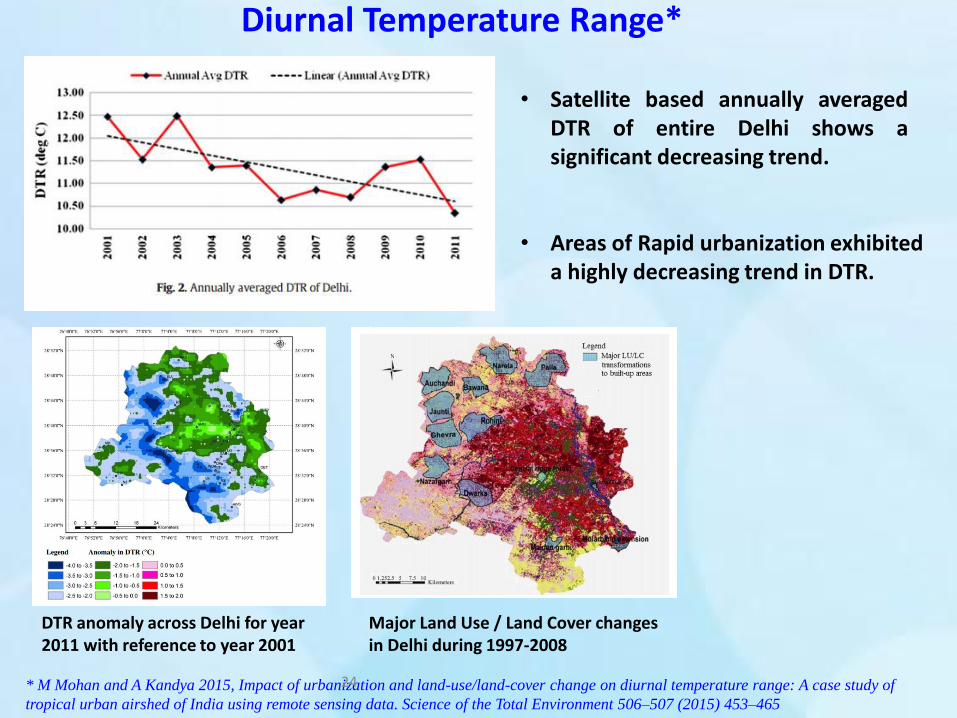
* M Mohan and A Kandya 2015, Impact of urbanization and land-use/land-cover change on diurnal temperature range: A case study of
tropical urban airshed of India using remote sensing data. Science of the Total Environment 506–507 (2015) 453–465
Diurnal Temperature Range*
• Satellite based annually averaged DTR of entire Delhi shows a significant decreasing trend.
• Areas of Rapid urbanization exhibited
a highly decreasing trend in DTR.
DTR anomaly across Delhi for year 2011 with reference to year 2001
Major Land Use / Land Cover changes in Delhi during 1997-2008
24
Prof M Mohan IIT Delhi, India
Analysis of LULC Impacts using WRF Modelling System
25 Urban Meteorology and Climate Conference;Hongkong; 25-27 May 2017
Prof M Mohan IIT Delhi, India
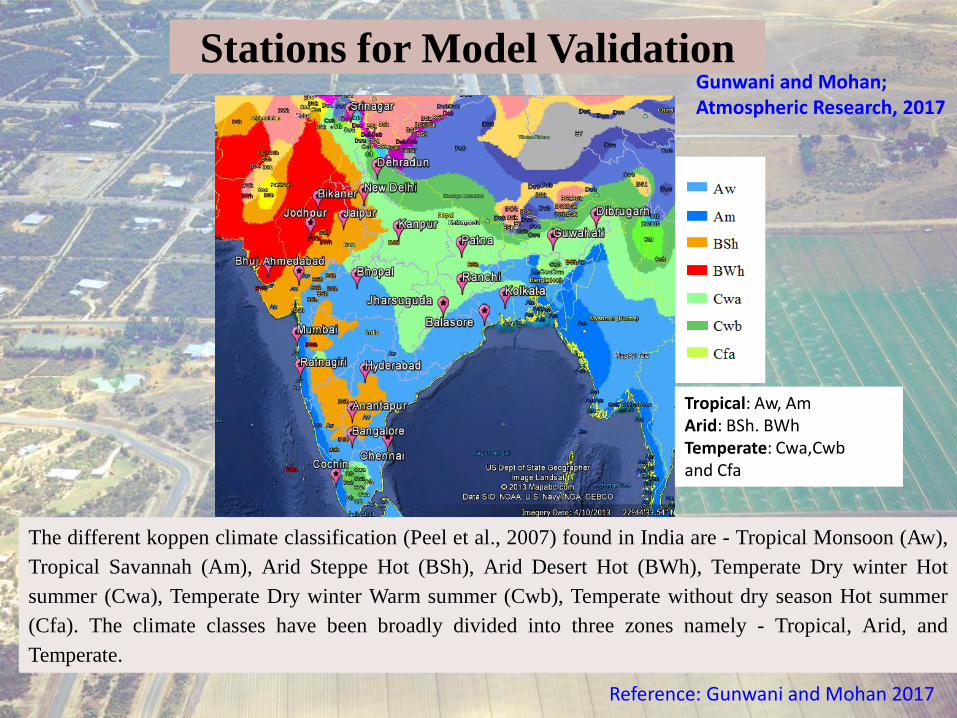
Stations for Model Validation
The different koppen climate classification (Peel et al., 2007) found in India are - Tropical Monsoon (Aw),
Tropical Savannah (Am), Arid Steppe Hot (BSh), Arid Desert Hot (BWh), Temperate Dry winter Hot
summer (Cwa), Temperate Dry winter Warm summer (Cwb), Temperate without dry season Hot summer
(Cfa). The climate classes have been broadly divided into three zones namely - Tropical, Arid, and
Temperate.
Tropical: Aw, Am Arid: BSh. BWh Temperate: Cwa,Cwb and Cfa
Reference: Gunwani and Mohan 2017
Gunwani and Mohan; Atmospheric Research, 2017
Prof M Mohan IIT Delhi, India
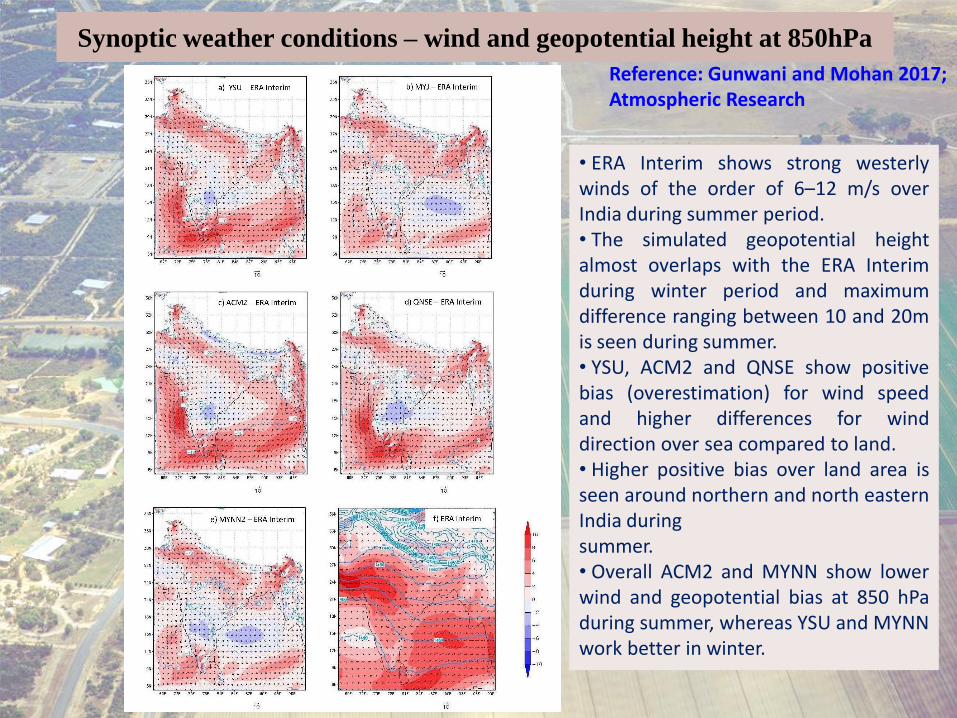
Synoptic weather conditions – wind and geopotential height at 850hPa
• ERA Interim shows strong westerly winds of the order of 6–12 m/s over India during summer period. • The simulated geopotential height almost overlaps with the ERA Interim during winter period and maximum difference ranging between 10 and 20m is seen during summer. • YSU, ACM2 and QNSE show positive bias (overestimation) for wind speed and higher differences for wind direction over sea compared to land. • Higher positive bias over land area is seen around northern and north eastern India during summer. • Overall ACM2 and MYNN show lower wind and geopotential bias at 850 hPa during summer, whereas YSU and MYNN work better in winter.
Reference: Gunwani and Mohan 2017; Atmospheric Research
Prof M Mohan IIT Delhi, India
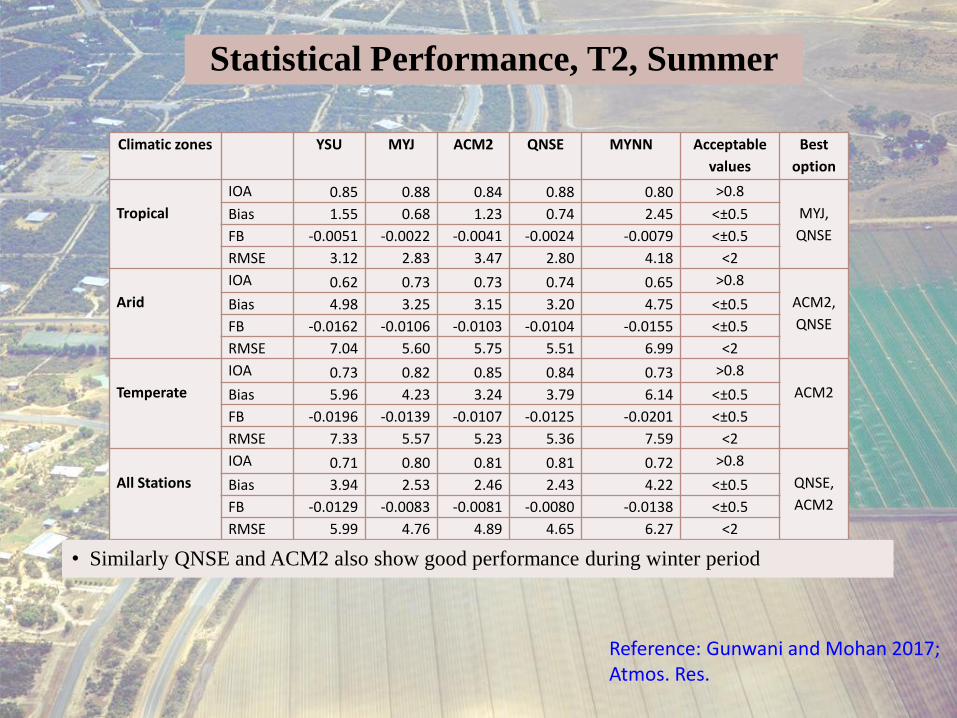
Statistical Performance, T2, Summer
Climatic zones YSU MYJ ACM2 QNSE MYNN Acceptable
values
Best
option
Tropical
IOA 0.85 0.88 0.84 0.88 0.80 >0.8
MYJ,
QNSE
Bias 1.55 0.68 1.23 0.74 2.45 <±0.5
FB -0.0051 -0.0022 -0.0041 -0.0024 -0.0079 <±0.5
RMSE 3.12 2.83 3.47 2.80 4.18 <2
Arid
IOA 0.62 0.73 0.73 0.74 0.65 >0.8
ACM2,
QNSE Bias 4.98 3.25 3.15 3.20 4.75 <±0.5
FB -0.0162 -0.0106 -0.0103 -0.0104 -0.0155 <±0.5
RMSE 7.04 5.60 5.75 5.51 6.99 <2
Temperate
IOA 0.73 0.82 0.85 0.84 0.73 >0.8
ACM2 Bias 5.96 4.23 3.24 3.79 6.14 <±0.5
FB -0.0196 -0.0139 -0.0107 -0.0125 -0.0201 <±0.5
RMSE 7.33 5.57 5.23 5.36 7.59 <2
All Stations
IOA 0.71 0.80 0.81 0.81 0.72 >0.8
QNSE,
ACM2 Bias 3.94 2.53 2.46 2.43 4.22 <±0.5
FB -0.0129 -0.0083 -0.0081 -0.0080 -0.0138 <±0.5
RMSE 5.99 4.76 4.89 4.65 6.27 <2
• Similarly QNSE and ACM2 also show good performance during winter period
Reference: Gunwani and Mohan 2017; Atmos. Res.
Prof M Mohan IIT Delhi, India
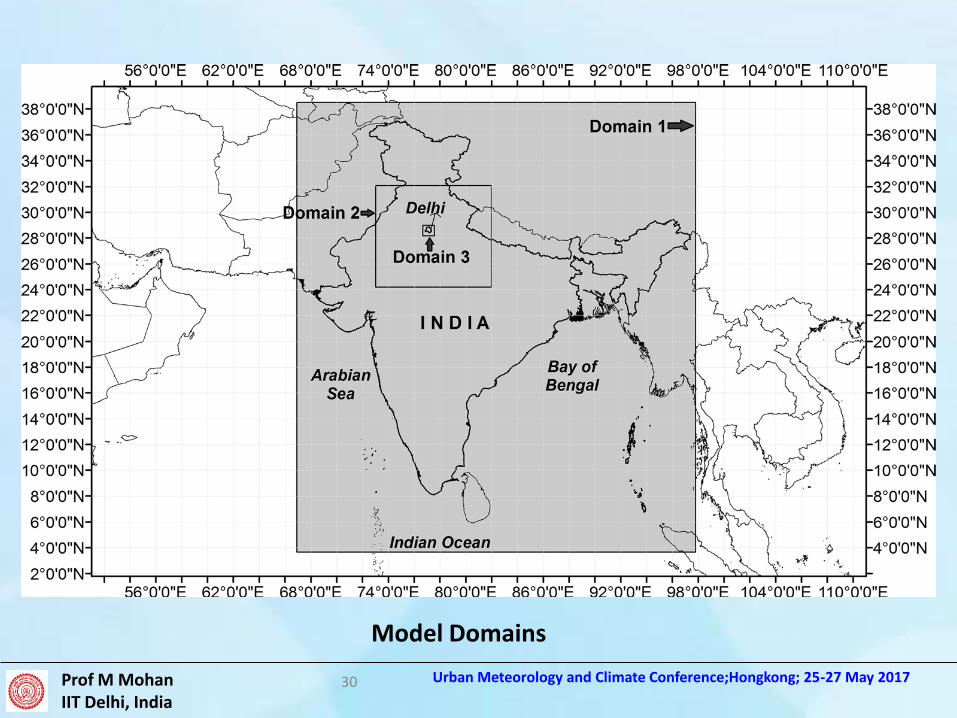
Simulation Details
• Simulations over the study area of Delhi were carried out using WRF modeling system (v 3.5).
• Simulation Details
– Time Period: 5 Mar 2010 0000 UTC – 11 Mar 0000 UTC
– Analysis: 6 Mar 2010 0600 UTC – 11 Mar 0000 UTC
– No. of Domains: 3 ; Resolution: 18 km, 6km, 2km
• Physical Schemes (Mohan and Bhati, 2011, Advances in Meteorology)
– Microphysics: Lin
– NOAH LSM
– ACM 2 Boundary Layer
– Kain Fritsch cumulus parametrisation
29 Urban Meteorology and Climate Conference;Hongkong; 25-27 May 2017
Prof M Mohan IIT Delhi, India
Model Domains
30 Urban Meteorology and Climate Conference;Hongkong; 25-27 May 2017
Prof M Mohan IIT Delhi, India
LULC Categories
• The built-in USGS 24 category land-use data in WRF is based on AVHRR satellite data spanning April 1992 through March 1993 using a resolution of ~ 1 km (Schicker, 2011; Sertel et al, 2009).
• Major differences, specially in terms of urban land cover, have been observed in USGS data and present LULC.
• Present study is aimed at analyzing impact of change in input land cover on model outputs such as air temperature and land surface temperature.
• MODIS IGBP is a 20 category land use data based on MODIS satellite data collected during years 2001-2005.
• Urban areas are more dominant in MODIS data.
31 Urban Meteorology and Climate Conference;Hongkong; 25-27 May 2017
Prof M Mohan IIT Delhi, India
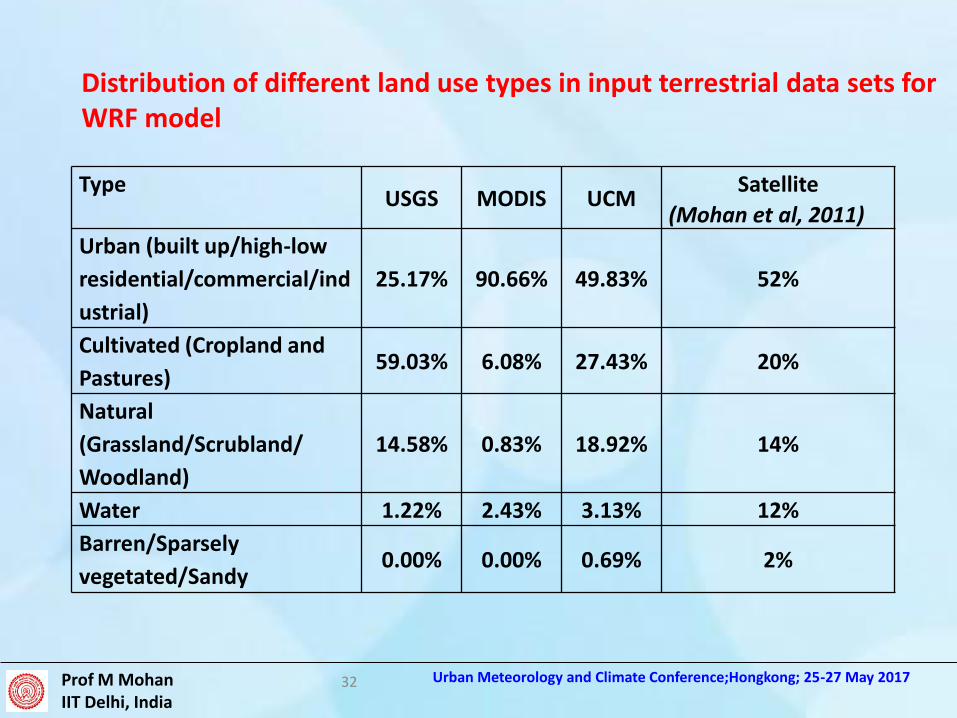
Type USGS MODIS UCM
Satellite
(Mohan et al, 2011)
Urban (built up/high-low
residential/commercial/ind
ustrial)
25.17% 90.66% 49.83% 52%
Cultivated (Cropland and
Pastures) 59.03% 6.08% 27.43% 20%
Natural
(Grassland/Scrubland/
Woodland)
14.58% 0.83% 18.92% 14%
Water 1.22% 2.43% 3.13% 12%
Barren/Sparsely
vegetated/Sandy 0.00% 0.00% 0.69% 2%
Distribution of different land use types in input terrestrial data sets for WRF model
32 Urban Meteorology and Climate Conference;Hongkong; 25-27 May 2017
Prof M Mohan IIT Delhi, India
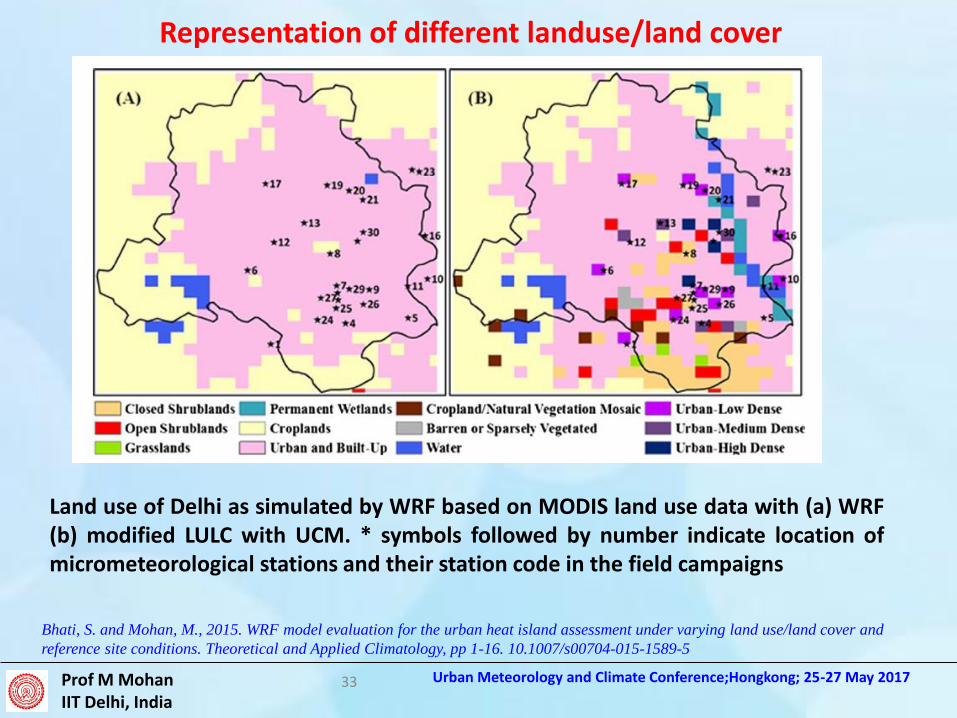
Representation of different landuse/land cover
Land use of Delhi as simulated by WRF based on MODIS land use data with (a) WRF (b) modified LULC with UCM. * symbols followed by number indicate location of micrometeorological stations and their station code in the field campaigns
Bhati, S. and Mohan, M., 2015. WRF model evaluation for the urban heat island assessment under varying land use/land cover and
reference site conditions. Theoretical and Applied Climatology, pp 1-16. 10.1007/s00704-015-1589-5
33 Urban Meteorology and Climate Conference;Hongkong; 25-27 May 2017
Prof M Mohan IIT Delhi, India
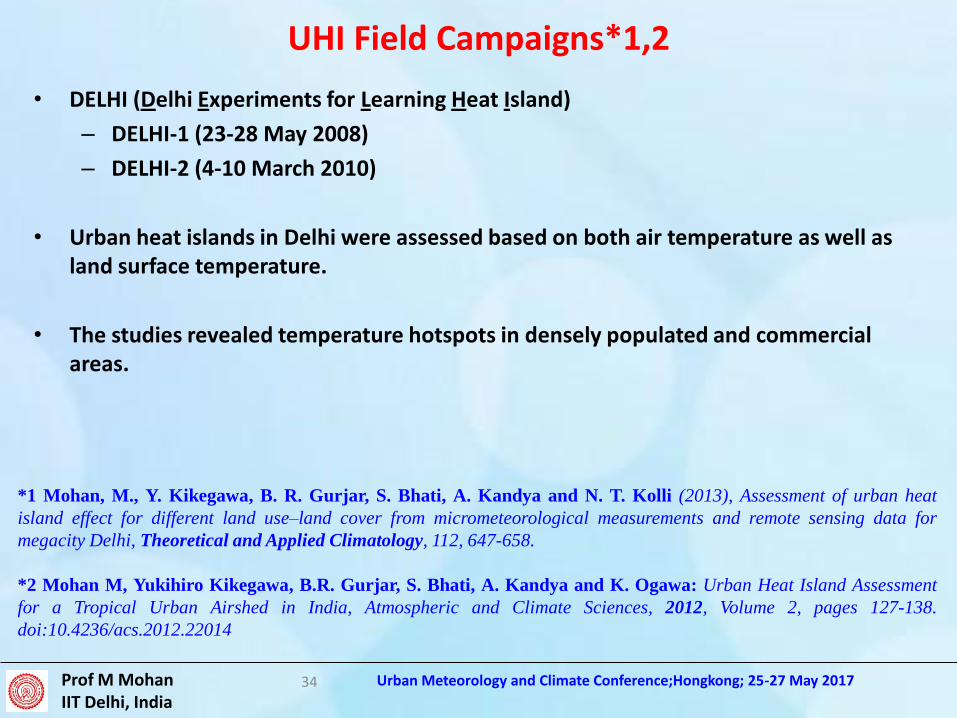
UHI Field Campaigns*1,2
• DELHI (Delhi Experiments for Learning Heat Island)
– DELHI-1 (23-28 May 2008)
– DELHI-2 (4-10 March 2010)
• Urban heat islands in Delhi were assessed based on both air temperature as well as land surface temperature.
• The studies revealed temperature hotspots in densely populated and commercial areas.
*1 Mohan, M., Y. Kikegawa, B. R. Gurjar, S. Bhati, A. Kandya and N. T. Kolli (2013), Assessment of urban heat
island effect for different land use–land cover from micrometeorological measurements and remote sensing data for
megacity Delhi, Theoretical and Applied Climatology, 112, 647-658.
*2 Mohan M, Yukihiro Kikegawa, B.R. Gurjar, S. Bhati, A. Kandya and K. Ogawa: Urban Heat Island Assessment
for a Tropical Urban Airshed in India, Atmospheric and Climate Sciences, 2012, Volume 2, pages 127-138.
doi:10.4236/acs.2012.22014
34 Urban Meteorology and Climate Conference;Hongkong; 25-27 May 2017
Prof M Mohan IIT Delhi, India
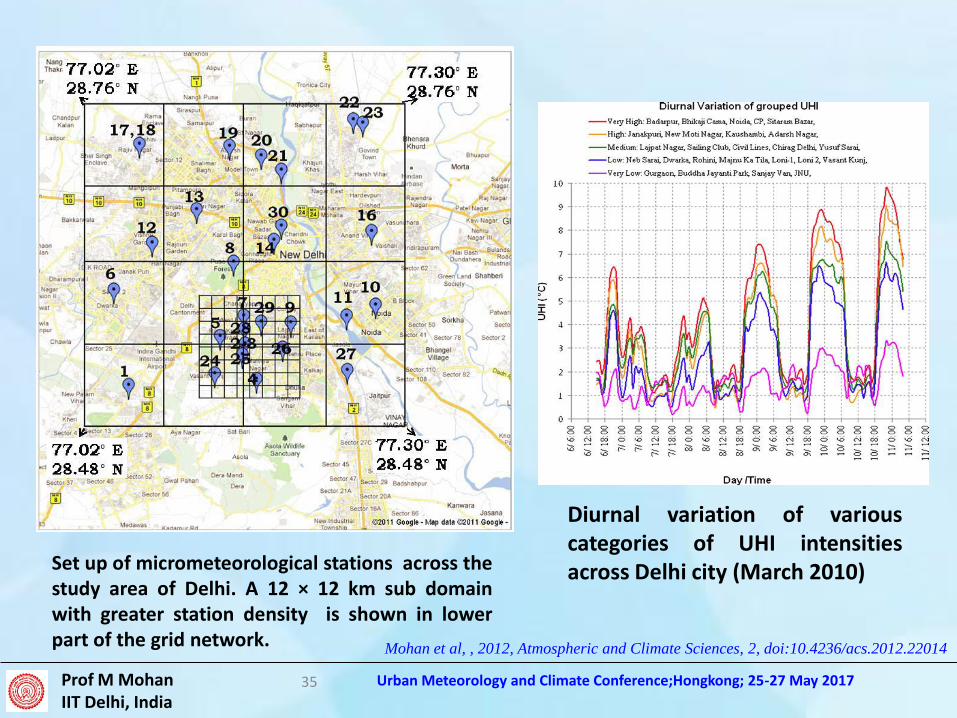
Mohan et al, , 2012, Atmospheric and Climate Sciences, 2, doi:10.4236/acs.2012.22014
Diurnal variation of various categories of UHI intensities across Delhi city (March 2010) Set up of micrometeorological stations across the
study area of Delhi. A 12 × 12 km sub domain with greater station density is shown in lower part of the grid network.
35 Urban Meteorology and Climate Conference;Hongkong; 25-27 May 2017
Prof M Mohan IIT Delhi, India
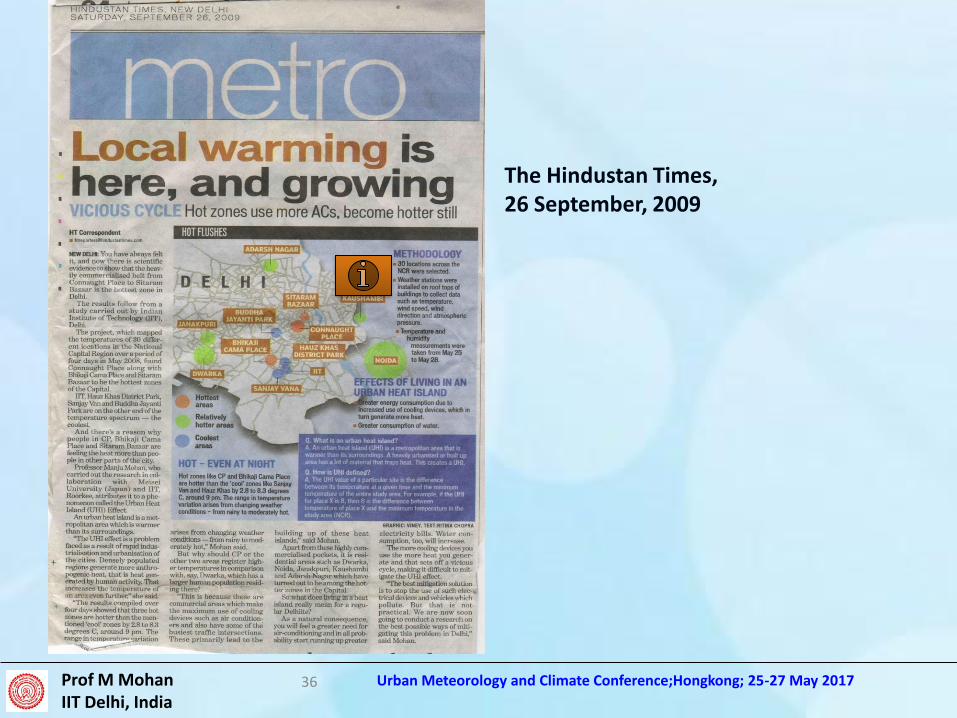
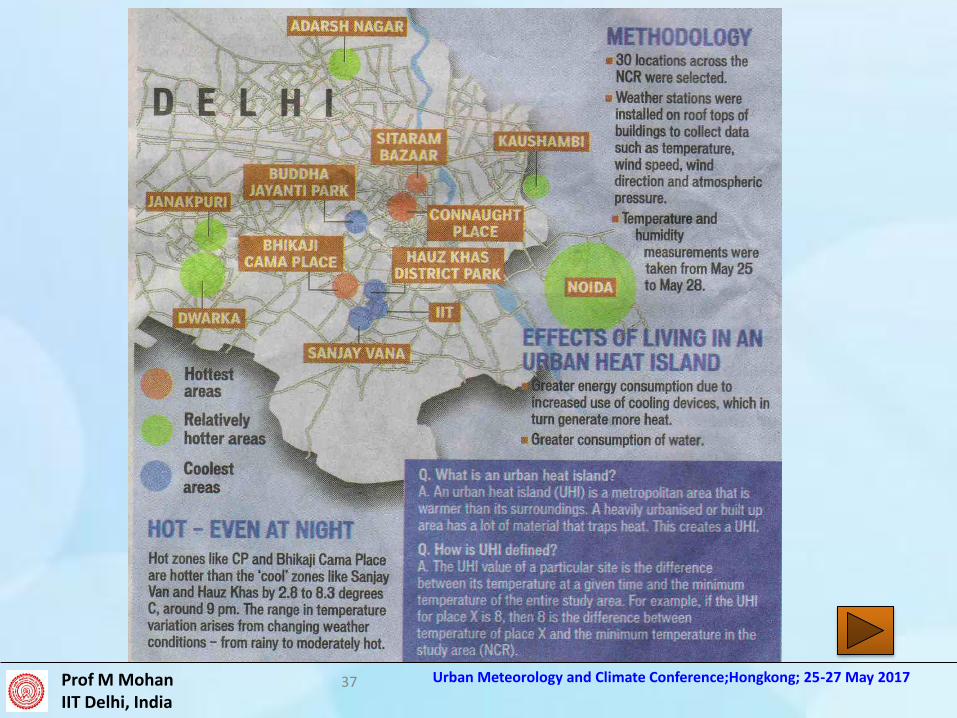
The Hindustan Times, 26 September, 2009
36 Urban Meteorology and Climate Conference;Hongkong; 25-27 May 2017
Prof M Mohan IIT Delhi, India
37 Urban Meteorology and Climate Conference;Hongkong; 25-27 May 2017
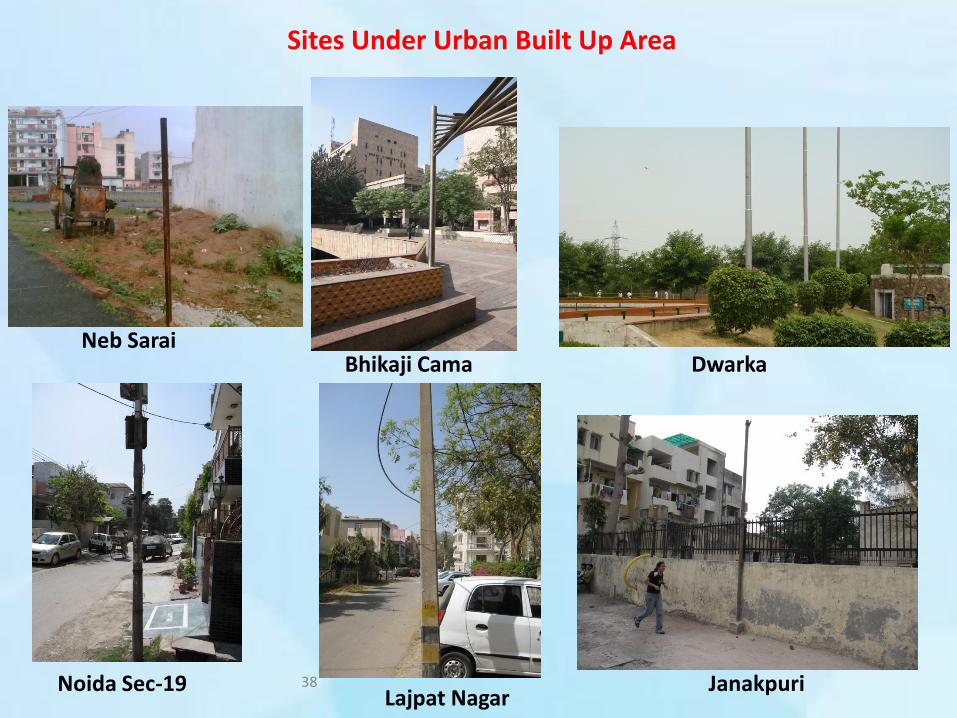
Neb Sarai Dwarka Bhikaji Cama
Lajpat Nagar Noida Sec-19 Janakpuri
Sites Under Urban Built Up Area
38
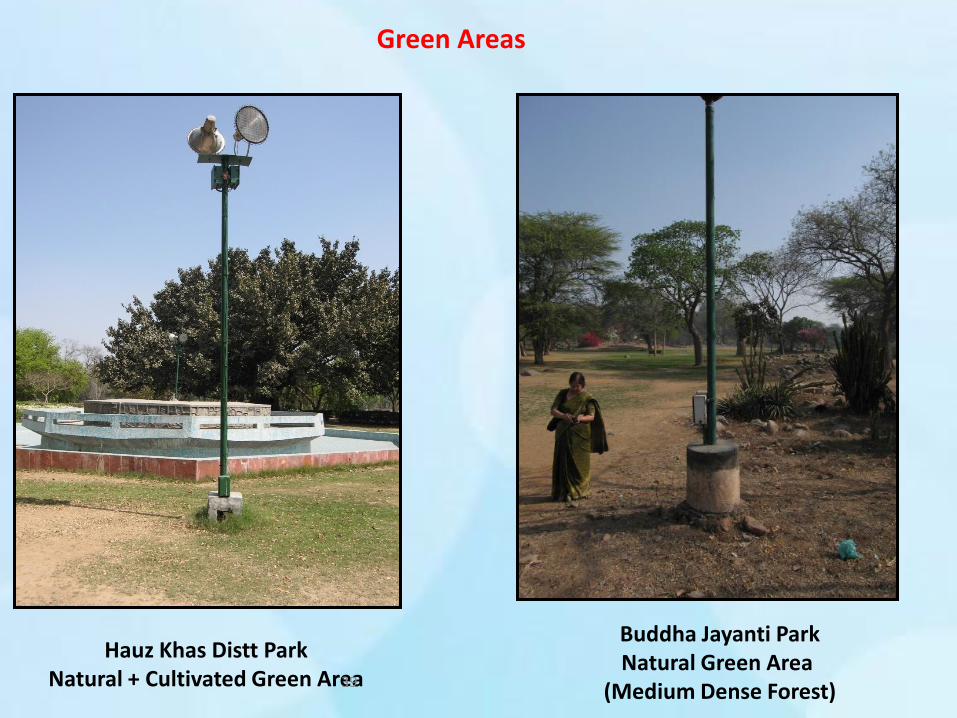
Buddha Jayanti Park Natural Green Area
(Medium Dense Forest)
Green Areas
Hauz Khas Distt Park Natural + Cultivated Green Area 39
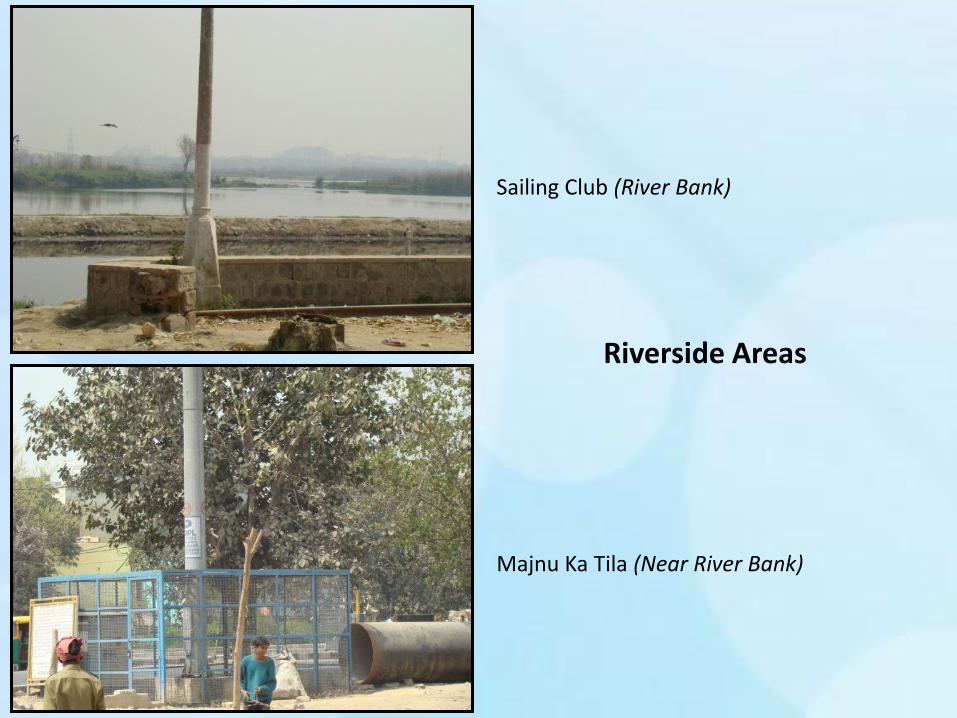
Sailing Club (River Bank)
Majnu Ka Tila (Near River Bank)
Riverside Areas
40
Prof M Mohan IIT Delhi, India
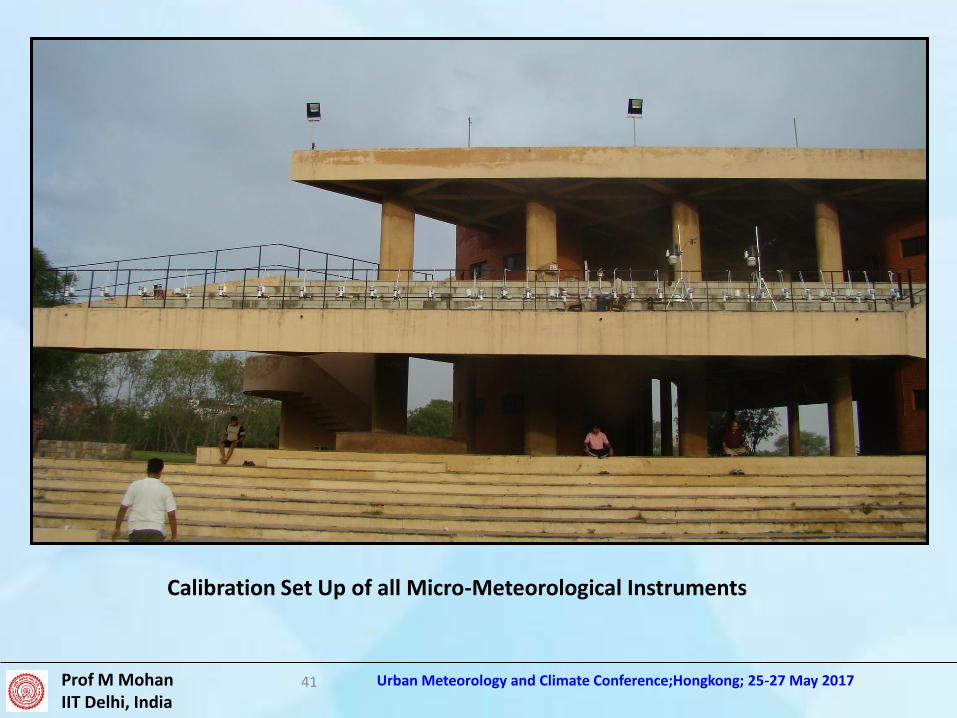
Calibration Set Up of all Micro-Meteorological Instruments
41 Urban Meteorology and Climate Conference;Hongkong; 25-27 May 2017
Prof M Mohan IIT Delhi, India
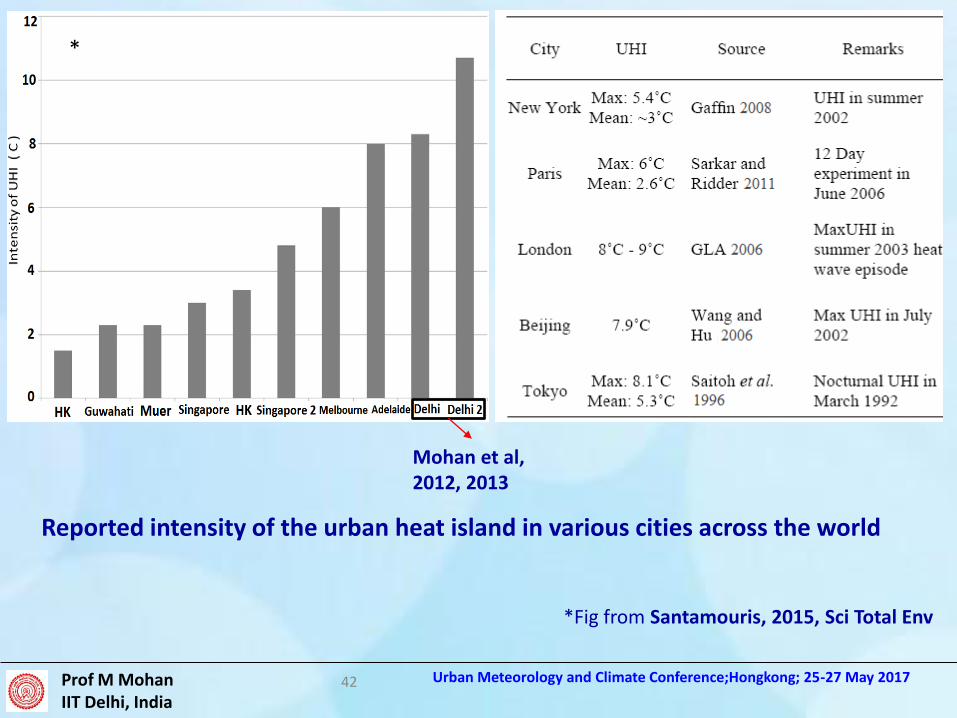
Mohan et al, 2012, 2013
Reported intensity of the urban heat island in various cities across the world
*
*Fig from Santamouris, 2015, Sci Total Env
42 Urban Meteorology and Climate Conference;Hongkong; 25-27 May 2017
Prof M Mohan IIT Delhi, India
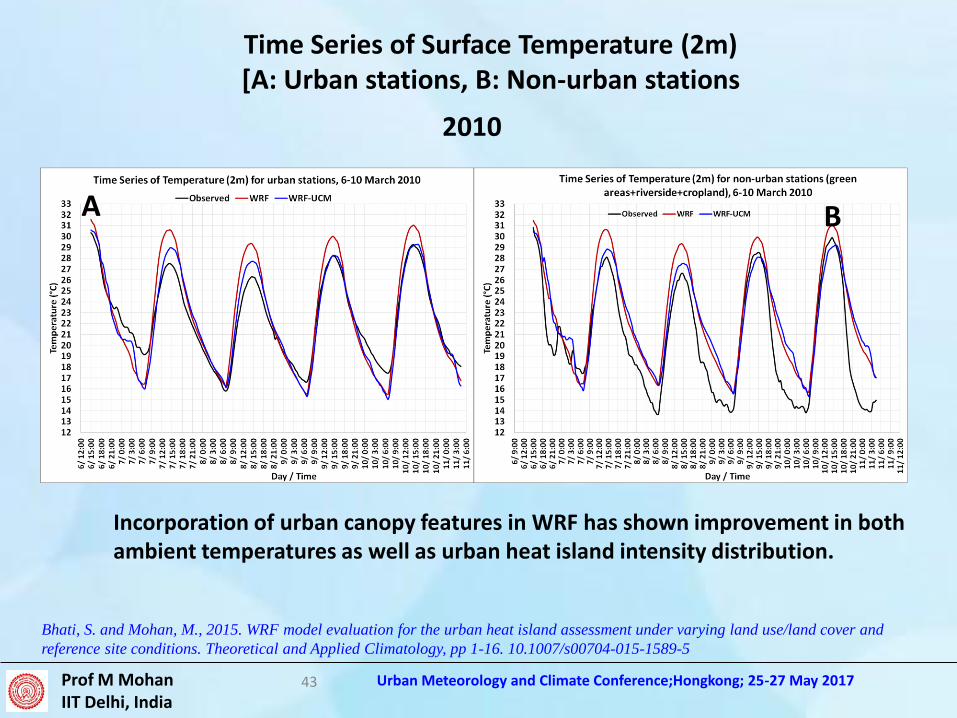
Time Series of Surface Temperature (2m) [A: Urban stations, B: Non-urban stations
A B
2010
Bhati, S. and Mohan, M., 2015. WRF model evaluation for the urban heat island assessment under varying land use/land cover and
reference site conditions. Theoretical and Applied Climatology, pp 1-16. 10.1007/s00704-015-1589-5
Incorporation of urban canopy features in WRF has shown improvement in both ambient temperatures as well as urban heat island intensity distribution.
43 Urban Meteorology and Climate Conference;Hongkong; 25-27 May 2017
Prof M Mohan IIT Delhi, India
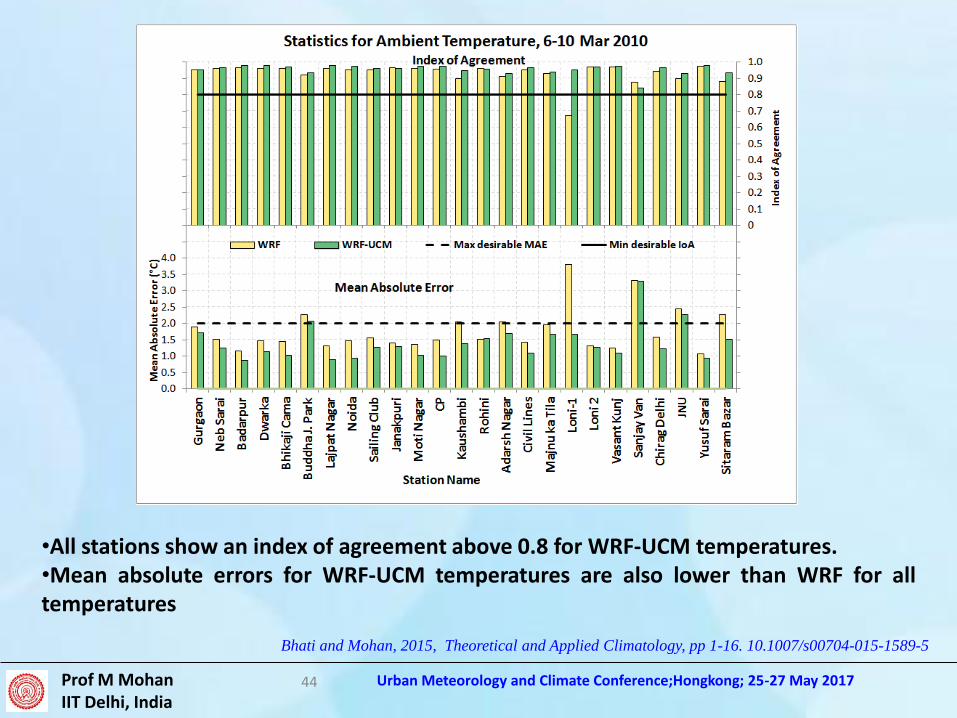
•All stations show an index of agreement above 0.8 for WRF-UCM temperatures. •Mean absolute errors for WRF-UCM temperatures are also lower than WRF for all temperatures
Bhati and Mohan, 2015, Theoretical and Applied Climatology, pp 1-16. 10.1007/s00704-015-1589-5
44 Urban Meteorology and Climate Conference;Hongkong; 25-27 May 2017
Prof M Mohan IIT Delhi, India
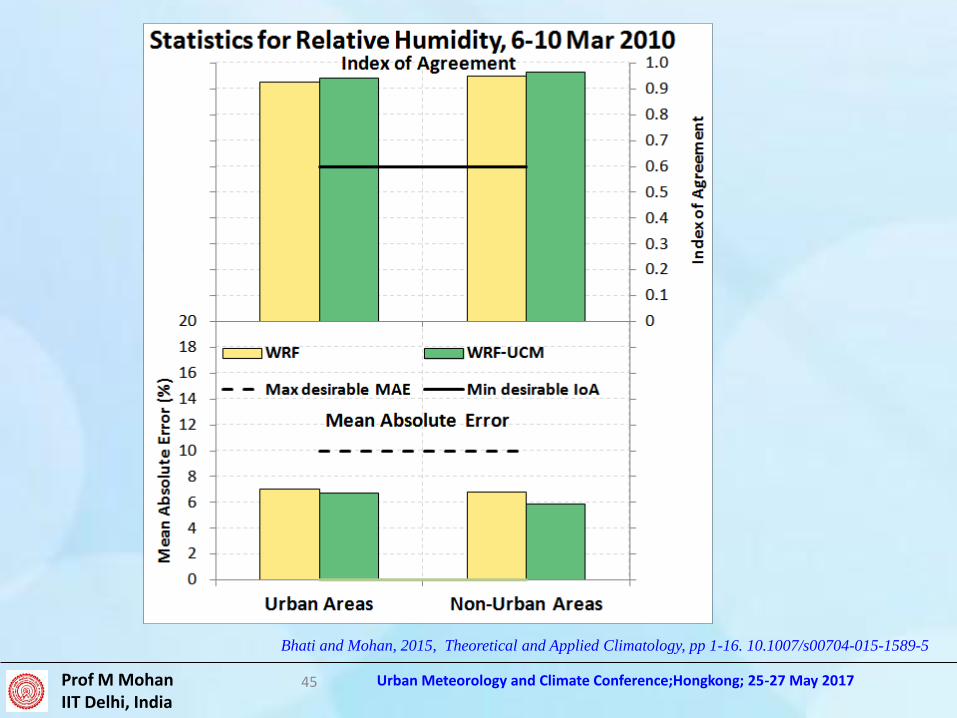
Bhati and Mohan, 2015, Theoretical and Applied Climatology, pp 1-16. 10.1007/s00704-015-1589-5
45 Urban Meteorology and Climate Conference;Hongkong; 25-27 May 2017
Prof M Mohan IIT Delhi, India
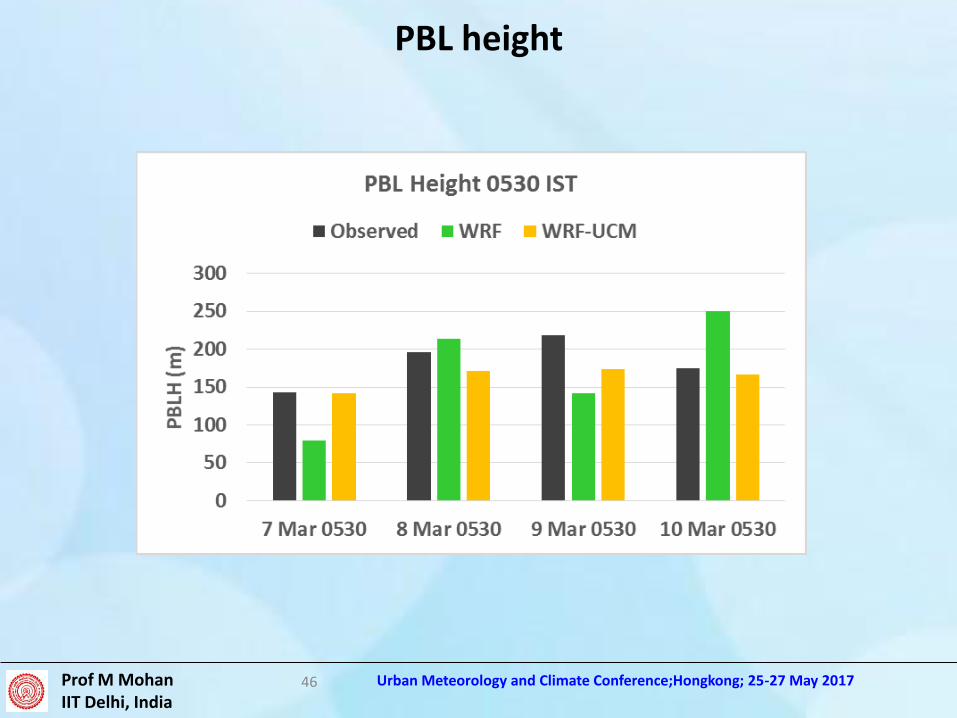
PBL height
46 Urban Meteorology and Climate Conference;Hongkong; 25-27 May 2017
Prof M Mohan IIT Delhi, India
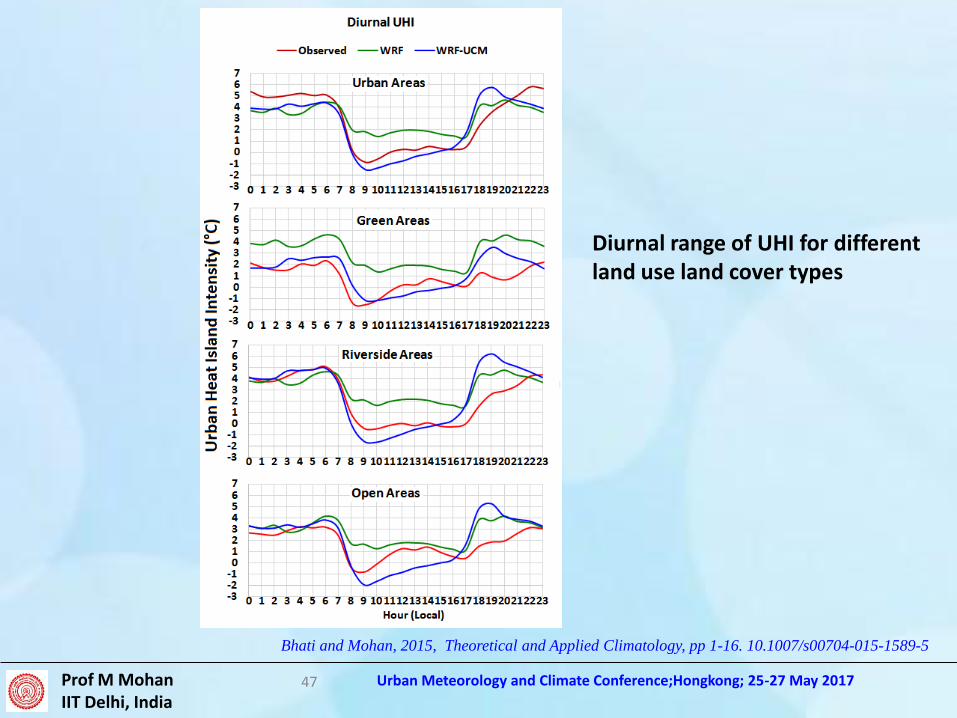
Diurnal range of UHI for different land use land cover types
Bhati and Mohan, 2015, Theoretical and Applied Climatology, pp 1-16. 10.1007/s00704-015-1589-5
47 Urban Meteorology and Climate Conference;Hongkong; 25-27 May 2017
Prof M Mohan IIT Delhi, India
Conclusions
• Significant changes in LULC observed across the globe due to urbanisation and developmental activities.
• NWP modelling shows significant impacts on temperature and air quality due to change in LULC across the globe
• Performance of mesoscale numerical models can be significantly altered by appropriate incorporation of LULC and urban canopy features.
48 Urban Meteorology and Climate Conference;Hongkong; 25-27 May 2017
Prof M Mohan IIT Delhi, India
Acknowledgements
Ms. Shweta Bhati
Dr. Anurag Kandya
Ms. Medhavi Gupta
Mr. Ankur P. Sati
49 Urban Meteorology and Climate Conference;Hongkong; 25-27 May 2017
Prof M Mohan IIT Delhi, India
THANKS
50