Embed Size (px)
Citation preview

2016 SWAT International conference
Reporter:Xu Fei
Topic: Database and GIS
application and development
Date:2016-07-27
Impacts of Manure
Application on SWAT Model
Outputs in the Xiangxi
River Watershed
1

Livestock pollution
Case Study
Research process
Main Conclusions
01
02
03
04
CONTENTS
CONT
ENTS
Livestock pollution01
02
CONTENTS
CONT
ENTS
2

01Livestock pollution
Part One
Background
Causes and impacts
Research advance
3

Asia showing the most rapid growth and structural change (Ling Gan et al. 2016), especially in China.
The environmental impact of livestock and poultry farming isResponsible for 18 % of the global emission of greenhouse gases
(Steinfeld et al. 2006a).
Livestock account for 34% of the total value of agricultural outputs, and
above 40% incomes of farmers were from livestock farming in some
regions of China (National bureau of statistics,2014 ).
Compared with the year 2007 in China, manure pollution problems will
become more serious in 2020, and the livestock excrement will
increase by 37 % (Liu et al. 2011; Fu et al. 2012).
.
Livestock pollution-Background
International
China
4

.
Causes.
Livestock pollution-Causes and impacts
Livestock pollution affects the environment
primarily by two pathways:
direct runoff of animal excreta from the
farms;
leaching or runoff from the open air slurry
used to collect and store animal excreta (Gu et al. 2008).
Eutroph
ication
Odor
pollution
Landscape
destruction
5
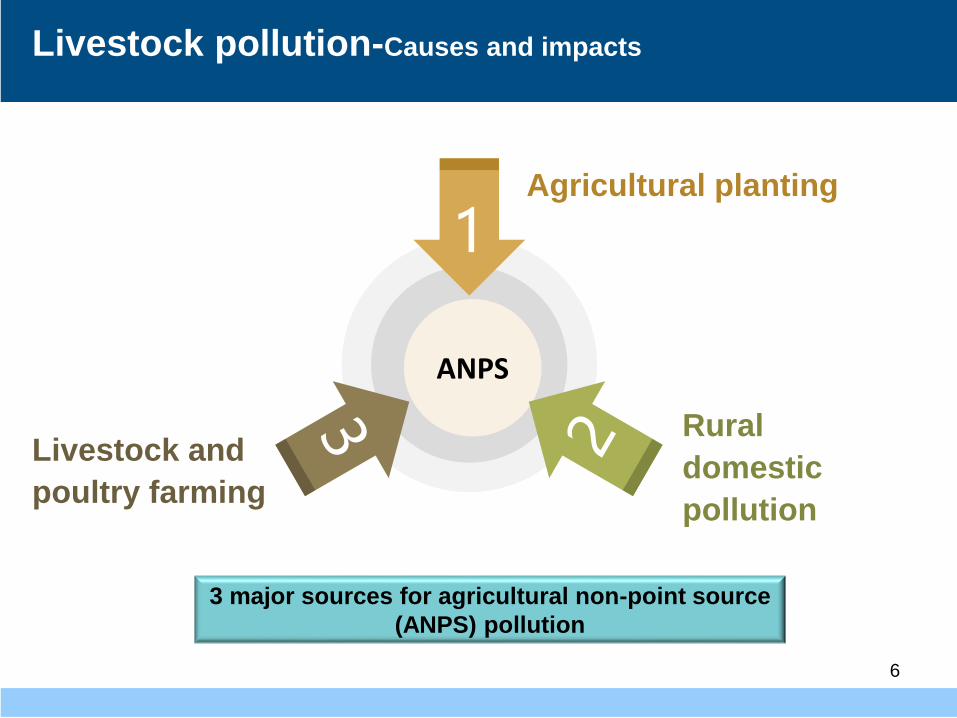
Livestock pollution-Causes and impacts
ANPS
1
Livestock and
poultry farming
Rural
domestic
pollution
Agricultural planting
3 major sources for agricultural non-point source
(ANPS) pollution
6

Livestock pollution-Research advance
Typical pollution discharging
coefficient
Spatial-temporal distribution
of the livestock amount and
pollution
i iki fk fk uk uk
Zhang et al., 2014; Wang et al.,
2015; Liu et al., 2014
at the provincial scale or at the
national scale;
geographical information system
(GIS);Duan et al., 2009; Sun and Wu, 2013; Jiao
et al., 2015
The results weren’t accurate enough since there were no universal
excretion coefficients around one country, or even around one province
(Shu et al., 2009;Yang et al., 2013). Additionally, the transport and
transformation of the pollutants are not considered when statistical
empirical coefficients are applied.
7

Livestock pollution-Research advance
How to simulate livestock and poultry pollution with
SWAT model?
B
D
A
C
E
Fertilizer database in SWAT. Apart from chemical fertilizers, there are also some
manure fertilizers. Variables in manure database include contents of mineral
nitrogen, mineral phosphorus, organic nitrogen, organic phosphorus and
information about fecal coliform.
Swine-fresh
manure
Beef-fresh
manure
Sheep-fresh
manure
Broiler-fresh
manure
Others
8

02Case study
Part Two
Site description
Livestock condition
9

Introduction of study area-Site description
$T#S
#S
#S
#S
#S
南阳镇
高阳镇
峡口镇
建阳坪乡
兴山县湘坪乡
香溪河流域$T 县
#S 乡 、 镇
水系
0 20000 Meters
图例
N
EW
S
三峡水系图
The Three Gorges
Reservoir
The Xiangxi
river watershedThe Yangtze River
watershed
10

Introduction of study area-Site description
Xiakou
Shennongjia
mountain(3105m)
Shennongjia Forestry District
ZiguiCounty
Guizhou
Xingshan County
Xiangxi river originates from
Shennongjia Forestry district.
94 km long, 3099 km2;
Controlled by Xingshan
hydrological gauge; 90%;
rich of phosphorus
Facing serious water and
soil loss;
Serious eutrophication
11

Introduction of study area-Site description
Administrative division was combined with watershed delineation in our study.
12

Introduction of study area-Livestock condition
Livestock farming exerted great threats on the environment
Agricultural structure of Xingshan was dominant by planting and livestock farming;
Rural scatter farming;
Main livestock: swine, beef, sheep and broiler
N、P discharged by livestock accounted for 77.9% of the total ANPS pollution (Wang et al., 2015).
13

03Research process
Part Three
SWAT model evaluation
Livestock condition analysis
Building new database
Simulation and analysis
14

Research process
Simulation, analysis
Building new databases
Livestock condition analysis
SWAT model calibration and
validation
04
03
02
01
Livestock amount statistics;
Manure, N, P estimation;
Spatial distribution,
RD
For flow, organic phosphorus
(ORGP), mineral phosphorus
(MINP)-NSE and R2
NMH、NMS、NMX
15

Research process-SWAT model evaluation
NSE and R2 values for flow were higher than those for
ORGP and MINP. All the values were credible. SWAT
model can be applied in Xiangxi river successfully.16

Research process-livestock condition analysis
Increasing tendency;
Top three towns:
Huangliang, Shuiyuesi and
Xiakou
17

Research process-building new database
Manure
production
(kg)
Manure
application
(kg/ha)
Fertilization
nitrogen
(kg N/kg
fert)
phosphurus
(kg P/kg
fert)
Huangliang
(12、16)56671956.14 45000 NMH
FMINN/P 0.0043 0.0007
ORGN/P 0.0034 0.0003
Shuiyuesi(11、
19、20、21、
22、23、24)
53666703.83 40000 NMS
FMINN/P 0.0044 0.0008
ORGN/P 0.0036 0.0003
Xiakou(25、
26、27)51200014.83 35000 NMX
FMINN/P 0.0046 0.0008
ORGN/P 0.0038 0.0003
Three different manure database according to practical manure production.
18

Research process-agricultural management practices
Huangliang(subbasin12/16)crop rotation of rice and oilseed rape
data SWAT Operation Name Notes
07-01 Plant/begin growing season Rice
07-01 Auto-irrigation Auto-irrigation based on crop demand
07-05 Continuous fertilization 55days, 11250 kg/ha per 10days
09-15 Harvest and kill Harvest and remove the ground part
09-20 Plant/begin growing season Oilseed rape
09-20 Auto-irrigation Auto-irrigation based on crop demand
09-25 Continuous fertilization 150days, 13500 kg/ha per 50days
05-30 Harvest and kill Harvest and remove the ground part
Agricultural management practices were set for Huangliang, Shuiyuesiand Xiakou, respectively, according to the actual practices.
19

Research process-
Xiakou(25、26、 27)citrus management
data SWAT Operation Name Notes
03-15Plant/begin growing
seasonCitrus
03-15 Auto-irrigation Auto-irrigation based on crop demand
03-20 Continuous fertilization 365days, 12000 kg/ha per 50days
Shuiyuesi(subbasin 11、19、20、21、22、23、24)
crop rotation of corn and oilseed rape
data SWAT Operation Name Notes
06-15Plant/begin growing
seasonCorn
06-15 Auto-irrigation Auto-irrigation based on crop demand
06-20 Continuous fertilization 55days, 13333 kg/ha per 20days
09-15 Harvest and kill Harvest and remove the ground part
09-20Plant/begin growing
seasonOilseed rape
09-20 Auto-irrigation Auto-irrigation based on crop demand
09-25 Continuous fertilization 150days, 13333 kg/ha per 50days
05-30 Harvest and kill Harvest and remove the ground part
agricultural management practices
20

Simulation and analysis
The individual livestock manure
applied for comparison.
Swine-fresh-manure
Beef-fresh-manure
Sheep-fresh-manure
Broiler-fresh-manure
SwM
BfM
ShM
BrM
21

Simulation and analysis
0
5
10
15
20
25
30
35
40
Huangliang Shuiyuesi Xiakou
OR
GP
/mil
lio
n k
g baseline
NM
SwM
BfM
ShM
BrM
0
1
1
2
2
3
3
4
4
Huangliang Shuiyuesi Xiakou
MIN
P/m
illi
on
kg
baseline
NM
SwM
BfM
ShM
BrM
0
5
10
15
20
25
30
35
40
45
Huangliang Shuiyuesi Xiakou
TP
/mil
lio
n k
g
baseline
NM
SwM
BfM
ShM
BrM
Spatial distribution of manure pollution 22

Simulation and analysis
Manure Town ORGP MINP TP
NM-SwM
Huangliang 0.78 0.43 0.77
Shuiyuesi 0.67 0.71 0.67
Xiakou 0.72 0.61 0.71
NM-BfM
Huangliang 0.80 0.43 0.79
Shuiyuesi 0.71 0.71 0.71
Xiakou 0.75 0.62 0.73
NM-ShM
Huangliang 0.77 0.42 0.75
Shuiyuesi 0.66 0.69 0.66
Xiakou 0.70 0.59 0.69
NM-BrM
Huangliang 0.80 0.43 0.79
Shuiyuesi 0.71 0.71 0.71
Xiakou 0.75 0.62 0.74
( )(%) s i
i
P PRD
P
Where Pi is the predicted value for towns applied SwM (i=1), BrM
(i=2), BfM (i=3) and ShM (i=4); Psis the predicted value for towns
applied NM. 23

04Main conclusions
Part Four
24

Main conclusions
NB manure produced the fewest ORGP, MINP and TPcompared with SwM, BfM, ShM and BrM. The applicationof BfM and BrM resulted in the largest pollutants,indicating that simulating manure pollution using thebeef-fresh-manure database and broiler-fresh-manuredatabase would cause greater errors in Xiangxi riverwatershed.
The pollutants produced by NB manure and the individuallivestock manure had a common feature:Huangliang<Shuiyuesi<Xiakou. The downstream of theXiangxi river faced greater livestock pollution threats,which need more attention.
25

End
Thankyou
Q & A26