Embed Size (px)
Citation preview

Chow, Block-Schachter, and Hickey 1
IMPACTS OF REAL TIME PASSENGER INFORMATION SIGNS IN RAIL STATIONS 1 AT THE MASSACHUSETTS BAY TRANSPORTATION AUTHORITY 2 3 Word Count: 5331 (text) + 500 (References) + 250 * (4 figures + 6 tables) = 8331 words 4 5 Abstract Word Count: 240 6 7 8 Submission Date: July 30, 2013 9 Revised Date: November 14, 2013 10 11 12 13 14 15 16 17 18 19 20 21 22 23 24 25 26 27 28 29 William Chow (Corresponding Author) 30 Massachusetts Institute of Technology 31 77 Massachusetts Avenue, Room 1-235, Cambridge, MA 02139 32 Phone: (408)-758-8836 Fax: Not Available 33 [email protected] 34 35 Dr. David Block-Schachter 36 Massachusetts Institute of Technology 37 77 Massachusetts Avenue, Room 1-235, Cambridge, MA 02139 38 Phone: (617)-460-0856 Fax: Not Available 39 [email protected] 40 41 Samuel Hickey 42 Massachusetts Bay Transportation Authority 43 45 High St, Room 507, Boston, MA 02110 44 Phone: (617)-222-3773 Fax: Not Available 45 [email protected] 46
TRB 2014 Annual Meeting Paper revised from original submittal.

Chow, Block-Schachter, and Hickey 2
ABSTRACT 1 Real-time information systems have been used in transit agencies around the world to better 2 inform passengers of their estimated wait. In 2012, the Massachusetts Bay Transportation 3 Authority (MBTA) rolled out new real-time countdown information across its heavy rail system. 4 These signs display the estimated arrival for the next two trains in each direction. This paper 5 examines whether the introduction of real-time arrival signage leads to reduced expectations of 6 wait time, improved satisfaction with the MBTA, and increased ridership. In-station surveys 7 were conducted before and after real-time information was introduced to gauge changes in 8 satisfaction and passenger wait time expectations. These expectations were compared against 9 headways collected from automated train tracking data. Ridership changes were measured using 10 MBTA provided automated fare collection data. Survey results reveal that after the introduction 11 of the countdown signs, people reduce their overestimation of wait time by 50 percent. 12 Satisfaction with the MBTA did not significantly change as a result of the real-time signage. 13 People reported feeling more relaxed with real-time signage if the next train arrival occurred 14 within a scheduled headway, but less relaxed for headways much greater than scheduled. Minor 15 improvements in ridership were detected in stations with the real-time information after 16 controlling for other factors, but these results are preliminary. This study suggests that real-time 17 arrival signage is a positive addition to heavy rail systems to increase passenger comfort and 18 improve perceptions of system performance in a relatively cost-effective manner using existing 19 technologies. 20 21 INTRODUCTION 22 Real-time passenger information (RTPI) for public transit is becoming more prevalent 23 worldwide. Systems such as London and New York have improved perceptions of public transit 24 attractiveness and satisfaction (1,2). The main benefits of RTPI for passengers include reducing 25 the displeasure of waiting for public transit, altering departure times to reduce actual wait times, 26 or changing modes to minimize travel time (2). Real-time information can be disseminated in a 27 variety of ways: through phone calls or texts, web applications, or signage located at transit 28 facilities detailing next train arrivals (“countdown timers”) (1). Because passengers perceive time 29 spent waiting as more onerous than in-vehicle travel time and access time, reducing wait times is 30 one way to increase the attractiveness of public transit (3,4). Past research on the psychological 31 impacts of real-time information has found correlations between decreased wait anxiety and 32 increased security with real-time information (5). 33 This paper examines the effects of introducing real-time information using existing 34 signage at the Massachusetts Bay Transportation Authority (MBTA) on perceptions of wait time, 35 system satisfaction, and ridership. It adds to the existing literature by documenting the impacts of 36 real-time information on wait time perception at heavy rail stations, whereas past research in 37 London and the Netherlands have focused on bus and light rail (6,7,8). In this context, the key 38 difference between heavy rail and other modes are enclosed stations (increasing platform access 39 time) and lower headways. Specifically, based on the MBTA countdown timer implementation, 40 the primary questions to consider are the following: 41
• Do countdown timers reduce how long people think they will wait for the train? 42 • Do countdown timers make people feel more relaxed about their wait for the train or 43
improve their perception of the transit agency? 44 • Do countdown timers lead to an increase in ridership? 45
TRB 2014 Annual Meeting Paper revised from original submittal.

Chow, Block-Schachter, and Hickey 3
LITERATURE REVIEW 1 Two effects of real-time information are relevant to this research: the perception impacts of real-2 time information and the associated ridership impacts. Past research has studied the passenger 3 impacts of real-time information, whether through wait time reductions, the value of the 4 information provided, or through changes in passenger path choice (6,9,10,11). In the realm of 5 ridership impacts, confounding factors, such as concurrent marketing or service changes often 6 make quantifying the direct impact of real-time information difficult. 7 Research into the effects of real-time information on service perceptions dates back two 8 decades. In 1993, signs were installed along London Regional Transport’s (now Transport for 9 London) bus route 18, and a cross-sectional survey was conducted both before and after the signs 10 were in use. This pilot project was conducted to evaluate the usefulness of providing real-time 11 information to waiting customers. Signs were installed for a total of six months, and passengers 12 were asked to rate the reliability of service, the accuracy of the signage, and attitudes towards 13 countdown systems and fares. The results showed a 26% reduction in passengers’ expected wait 14 time. (6,10) The study also put a value on the willingness to pay for this service, based on the 15 value of the reduction in perceived passenger wait time. This stated preference study looked at 16 varying characteristics of transit service with and without countdown information, and a 17 supplementary survey looked at how much people would increase transit fares to have 18 countdown information available. This study resulted in estimates ranging from $0.31 to 15-20% 19 of the ticket price in London (7). 20 A similar survey based method was utilized in The Hague, Netherlands in 2004 to 21 analyze wait-time expectations with real time signage at a tram (streetcar) station. The pre-22 installation survey contained questions on boarding time, usage, and demographics. Surveys 23 were distributed on station platforms one month prior to the implementation of RTPI, and 24 respondents asked to return the survey by mail. Two follow-up surveys were conducted, 3 25 months and 16 months after the signs were introduced. These follow up surveys were distributed 26 to 175 respondents to gauge differences in usage, with 53 responses. Estimated wait time was 27 reduced by 20% in both surveys with the introduction of real-time signage (8). Both the London 28 and The Hague study surveyed passengers in multiple stages and compared the psychological 29 effects in wait time estimation. 30 Ridership gains as a result of RTPI have been inconclusive in most cases. This is due to 31 confounding factors such as service or fare changes being implemented simultaneously. One 32 study that controlled for these factors is Tang’s study of the Chicago Transit Authority. A 33 mixed-effects model on ridership at the route level was estimated utilizing 9 years of data. This 34 model controlled for weather, unemployment, socioeconomic data, and transit service attributes. 35 The results showed a modest increase in ridership based on the introduction of real-time 36 information on buses. In addition, a stated preference survey was conducted with 99 respondents 37 to confirm a correlation between the psychological benefits of real time information and 38 increased ridership (12,13). A web-based study in Seattle looked at the effects of RTPI in an 39 online format. Existing public transit riders were asked whether trip behavior and satisfaction 40 changed as a result of mobile real-time information. The survey results noted with mobile RTPI, 41 most passengers did not alter travel behaviors, although approximately 20% of users increased 42 the number of trips taken on public transit as a result. Non-commute trips were more likely to 43 have increased usage (14) in this stated preference study compared to commute trips. 44 This review of the literature reveals that there is room for surveys that use a large 45 sample in order (1) to verify past results performed on other transit modes within a heavy rail 46
TRB 2014 Annual Meeting Paper revised from original submittal.
Chow, Block-Schachter, and Hickey 4
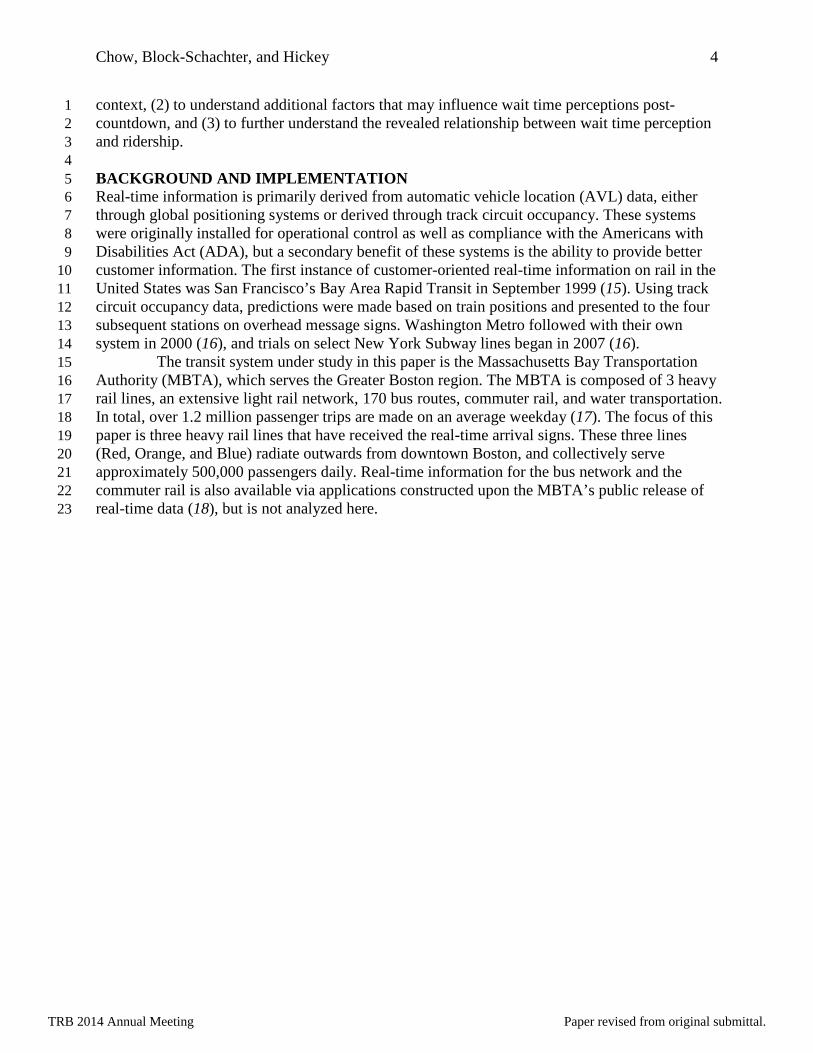
context, (2) to understand additional factors that may influence wait time perceptions post-1 countdown, and (3) to further understand the revealed relationship between wait time perception 2 and ridership. 3
4 BACKGROUND AND IMPLEMENTATION 5 Real-time information is primarily derived from automatic vehicle location (AVL) data, either 6 through global positioning systems or derived through track circuit occupancy. These systems 7 were originally installed for operational control as well as compliance with the Americans with 8 Disabilities Act (ADA), but a secondary benefit of these systems is the ability to provide better 9 customer information. The first instance of customer-oriented real-time information on rail in the 10 United States was San Francisco’s Bay Area Rapid Transit in September 1999 (15). Using track 11 circuit occupancy data, predictions were made based on train positions and presented to the four 12 subsequent stations on overhead message signs. Washington Metro followed with their own 13 system in 2000 (16), and trials on select New York Subway lines began in 2007 (16). 14 The transit system under study in this paper is the Massachusetts Bay Transportation 15 Authority (MBTA), which serves the Greater Boston region. The MBTA is composed of 3 heavy 16 rail lines, an extensive light rail network, 170 bus routes, commuter rail, and water transportation. 17 In total, over 1.2 million passenger trips are made on an average weekday (17). The focus of this 18 paper is three heavy rail lines that have received the real-time arrival signs. These three lines 19 (Red, Orange, and Blue) radiate outwards from downtown Boston, and collectively serve 20 approximately 500,000 passengers daily. Real-time information for the bus network and the 21 commuter rail is also available via applications constructed upon the MBTA’s public release of 22 real-time data (18), but is not analyzed here. 23
TRB 2014 Annual Meeting Paper revised from original submittal.

Chow, Block-Schachter, and Hickey 5
1 FIGURE 1 Map of MBTA Subway System, with surveyed stations highlighted 2
In order to display real-time information in stations, the MBTA leveraged LED signs 3 that had been installed at all heavy rail stations in 2007 but had only shown the current time, 4 announcements that played when the next train was approaching and arriving, and information 5 about service irregularities. MBTA staff developed software that combines real-time train 6 movement data from over 500 track circuits with schedule information, including real-time 7 schedule changes made by dispatchers, to produce predicted arrival times (departure times at 8 terminals) at all 51 heavy rail stations. On a typical day this software processes more than 9 70,000 train movement messages, more than 3,000 schedule messages and sends more than 10 350,000 countdown messages to the station signs. These countdown messages are sent to the 11 signs by way of the MBTA’s public announcement system. In order to accept these messages 12 the announcement system required an upgrade by the vendor. 13 The first stations to receive the countdown timers were on the Red Line, with stations 14 in downtown Boston receiving them in August and September of 2012 (7). The signs near the 15 fare gates display the time until the next train arrival in either direction and the platform-level 16 signs show the next train arrivals in both directions served by the line, as shown in Figure 2. 17 These signs count down the time until the next arrival and are referred to in Boston as 18 “countdown timers.” Real-time information signs had been activated in more than half of the 19
TRB 2014 Annual Meeting Paper revised from original submittal.

Chow, Block-Schachter, and Hickey 6
stations in December 2012, nearly 80% of stations in January 2013, and at remaining stations in 1 June 2013. The MBTA’s daily accuracy reports, which use an industry-standard definition of 2 “accurate” as within one minute accuracy for predictions under five minutes and within three 3 minutes for predictions over five minutes, show that more than 90% of countdown predictions 4 are accurate. Grouping by whether the train has departed the terminal station, the reports show 5 that countdown accuracy is in the mid 90% range for trains that have departed from the terminal 6 and around 80% for trains that have not yet departed from the terminal. 7
(a)
(b) (c)
FIGURE 2 “Countdown Timers” at South Station (Red Line). (a) Mezzanine Level at fare 8 gates showing next train arrival in either direction. (b) Northbound platform showing next 9 two train arrivals (c) Southbound platform showing next arrival for each branch 10 11 RESEARCH DESIGN 12 Data Collection 13 This study used intercept surveys on station platforms to test whether passengers had improved 14 perceptions of public transit and wait time. Surveys were administered between 8AM and 10AM 15 on weekdays across the Red, Orange, and Blue Lines. This timeframe captures both the end of 16 the morning rush hour and the beginning of the midday period, which allows comparison of 17 perceptions for several scheduled headways and ridership profiles. Sampled stations were 18 predominantly those with high ridership to increase sample size, and were surveyed both before 19 and after the countdown timers were installed to measure shifts in perception from similar 20
TRB 2014 Annual Meeting Paper revised from original submittal.

Chow, Block-Schachter, and Hickey 7
populations. Passengers were handed survey cards by volunteers, who were asked to respond and 1 return them to the volunteers. Surveys were administered to passengers waiting on the station 2 platform, and were asked to return the card before the train arrived. These surveys were 3 distributed from the previous train departure up until the in-station announcement that the next 4 train is approaching, roughly one minute before the next train arrives. This one minute cutoff 5 allowed participants to complete the survey without missing the train. Each survey has a unique 6 sequential identifier, which allowed survey responses to be associated with a train arrival. The 7 volunteers noted which survey was last handed out and the time of the arriving train. This 8 information is then matched with data provided by the MBTA on the arrival of trains at each 9 station to associate individuals to a train. The train headways are calculated using this train-10 tracking data, which in turn allow for estimations of actual wait times experienced by the 11 surveyed passengers. 12 The survey itself is composed of three questions along with direction of travel and 13 demographic data. The length of the survey allowed a higher response rate and immediate 14 completion of the survey, reducing possible error due to faulty recollection. The first question 15 asks passengers to rate the MBTA system on a 1-5 Likert scale, with 1 being poor and 5 being 16 great. The next question asked passengers to rate their wait experience from 1-5 for that day’s 17 specific trip, with 1 being aggravated and 5 being relaxed. The third question asked passengers to 18 estimate in minutes how long they expected to wait for the train, including time waited prior to 19 the survey being distributed. Additional collected information included the gender, age, and 20 direction the passenger was travelling in. Cross-tabulations by gender and age were largely 21 similar to past survey work on the MBTA. While there may be some unknown variance in ethnic 22 composition of the sample versus the population, there is no a priori reason perceptions of wait 23 time should differ based on this characteristic. 24 25 Methods and Hypotheses 26 The survey was distributed both before and after the countdown signs were turned on, giving two 27 representative samples to compare. A comparison of means test is performed on each survey 28 question, both in general and by specific line to see if there is a line-specific effect. As there may 29 be variations in service with respect to train headways on different survey days, the average wait 30 time for each passenger is calculated using train headways and subtracted from the passenger 31 response to generate an overestimate or underestimate of wait, which is then compared before 32 and after the signs are turned on. For ridership changes, a regression model is run using MBTA 33 Automated Fare Collection (AFC) data aggregated to the station or route level by day to 34 determine whether countdown increased ridership at rail stations. Controls for line specific 35 effects, day of week effects, monthly (seasonal), and station specific effects are used. 36 This research looks at the effects of real-time information to passengers waiting at rail 37 stations. Some of the expected effects include the following: 38
• Past research has indicated a reduction in perceived travel time for bus and tram due to 39 additional anchoring information, so there should be a reduction in passenger wait time 40 estimates for heavy rail as well. These reductions should be greater during the off-peak 41 period, and decrease to match actual train arrival patterns. 42
• Passenger satisfaction of wait should increase as a result of the reduced anxiety 43 associated with unknown wait times. Satisfaction should improve more for lower 44 headways, as the anxiety is reduced more knowing a low headway period is coming. 45
TRB 2014 Annual Meeting Paper revised from original submittal.

Chow, Block-Schachter, and Hickey 8
• Because the disutility of waiting for a train is decreased, passenger ratings of the MBTA 1 should improve. 2
• This expected reduction in wait time along with increased satisfaction of waiting and 3 public transit in general should yield an increase in ridership, but this effect may not be 4 pronounced until more users are acclimated to new wait-time estimates and incorporate 5 the new information into travel behavior. 6
RESULTS 7 Over the 6 month period of initial study, 4,201 surveys were collected at 7 stations. Of these 8 surveys, 4,118 had complete responses and were included in the analysis below. Each station 9 was surveyed for one morning before the countdown timers were active and one morning after, 10 with the exception of the Red Line stations. Central Square was surveyed twice without real-time 11 signage, and South Station was surveyed twice with real-time signage to better understand day-12 to-day variation. The distribution of complete responses before and after the countdown signs 13 were installed is shown by station in Table 1. 14 15 TABLE 1 Number of Survey Respondents 16
Station Without RTPI (Pre-implementation)
With RTPI (Post-implementation)
Total
Blue 447 287 734 Maverick 364 287 651 Beachmont 83 -- 83 Orange 344 493 837 Jackson Square 136 89 225 Roxbury Crossing 140 239 379 Ruggles 68 165 233 Red 1216 1331 2547 South Station 389 949 1338 Central Square 827 382 1207 All Lines 2007 2111 4118
In order to verify that service provided was similar before and after the real-time signs were 17 activated, the average actual wait time is calculated. This value is equal to 18 19
∑ 𝑇𝑟𝑎𝑖𝑛𝐻𝑒𝑎𝑑𝑤𝑎𝑦𝑖 + 1 𝑚𝑖𝑛𝑢𝑡𝑒
2𝑛𝑖=1
𝑛 (1)
assuming random passenger arrivals and random surveying. In equation (1), n is the number of 20 passengers surveyed. One minute is added to account for the time from when surveys stop being 21 distributed to the train arrival. Additional time equivalent to the subsequent headway is 22 incorporated into actual wait-time calculations if a passenger specifies travel to a branch not 23 served by the next train. These headways are calculated for each passenger and averaged across 24 the lines. Results are shown in Table 2. 25 26
TRB 2014 Annual Meeting Paper revised from original submittal.

Chow, Block-Schachter, and Hickey 9
TABLE 2 Comparison of average actual wait time experienced by passengers, both with 1 and without large gaps. 2
Average Actual Wait derived from headways (minutes) Line Without RTPI With RTPI With RTPI (no large gaps) Blue 3.59 3.76 3.76
Orange 3.92 4.10 4.10 Red 3.58 5.17 3.87
All Lines 3.64 4.73 3.91 High actual wait times on the Red Line post-implementation is attributed to a service disruption 3 that led to waits of over 30 minutes. Because of the unreliability of the countdown timers during 4 the service disruption, another average is calculated without the large service gap, shown in the 5 “no large gaps” column. By removing the data points corresponding to this disruption, the results 6 for the Red Line become more consistent with that of the Blue and Orange Line, and a better 7 comparison can be made before and after the implementation of real-time predictions. On 8 average, passengers experienced longer headways after the countdown timers were activated, 9 which while significant in all cases is likely unrelated to the predictions itself. We can conclude 10 that this increase in gaps is likely to increase Type II errors, where we falsely accept the null 11 hypothesis of no meaningful effect of real-time signage on positive characteristics. 12 13 MBTA and Satisfaction of Wait Rating 14 Initial expectations based on prior research were that passenger satisfaction with waiting 15 increases as a result of the countdown timer activation (5,6,7). Average results from the survey 16 both before and after the real-time information were activated are shown below in Table 3. 17 18 TABLE 3 Average Score for MBTA and their wait before and after real-time signs 19 installed, excluding large headways 20 MBTA Rating Average (1-5) Wait Satisfaction Rating Average (1-5) Subway Line
Without RTPI
With RTPI T-statistic Without
RTPI With RTPI T-statistic
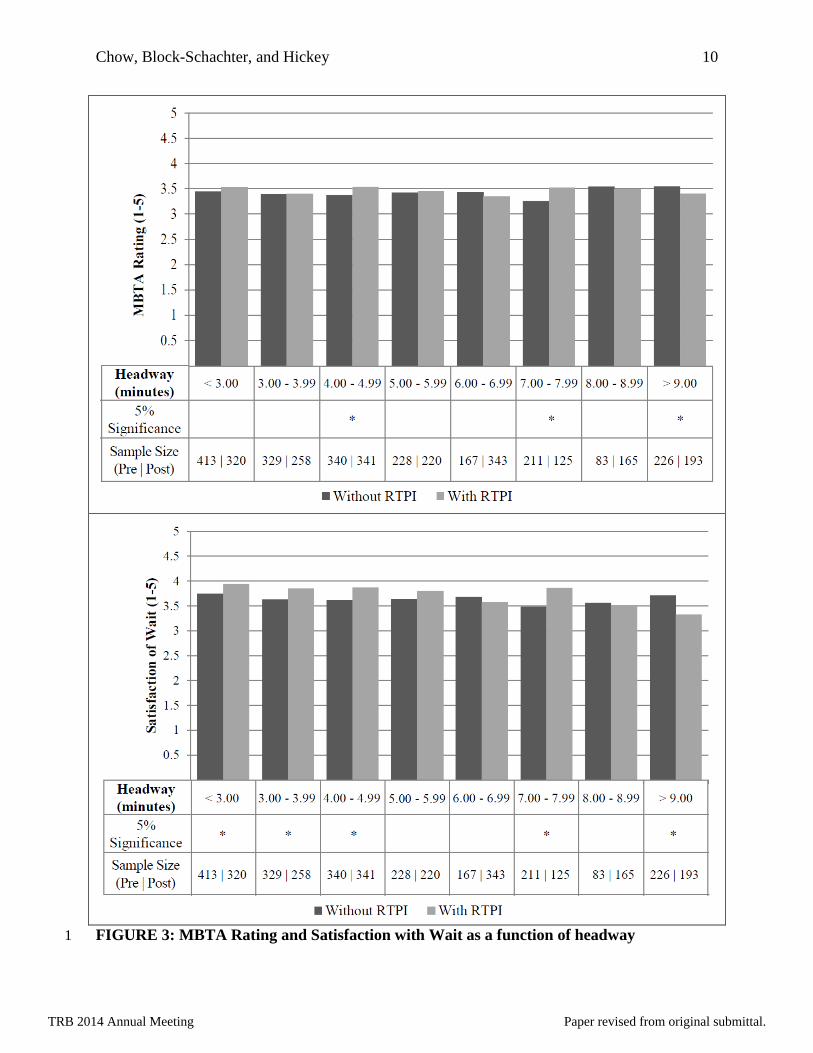
Blue 3.47 3.61 2.18* 3.69 3.84 2.08* Orange 3.35 3.36 0.08 3.51 3.59 1.24 Red 3.41 3.46 1.54 3.68 3.77 2.33* All Lines 3.41 3.46 1.64 3.65 3.73 2.74* Results from the intercept survey were mixed. Passengers rate both the MBTA system and their 21 satisfaction with wait higher after the countdown timer implementation, but this is only 22 significant for the Blue Line in both cases and for the Red Line in wait satisfaction. Given the 23 non-significant results for several cases at the line level, it is difficult to determine whether the 24 countdown timers played any role in improving satisfaction. 25 In response to variability in service across days and across lines, a separate approach to 26 compare these ratings was developed. The expectation is that customers’ perceptions are highly 27 dependent on wait time, so to control for service variations, results were aggregated based on 28 train headway. These were compared before and after real-time sign implementation, excluding 29 surveys conducted during service disruptions. Figure 3 shows the MBTA and Wait Satisfaction 30 Ratings as a function of headway. Results significant at the 5% level and sample sizes are shown 31 under the graph. As a reference, during the morning peak period typical Red Line headways are 32 4-5 minutes, while Blue and Orange Line headways are 5 minutes. 33
TRB 2014 Annual Meeting Paper revised from original submittal.
Chow, Block-Schachter, and Hickey 10
FIGURE 3: MBTA Rating and Satisfaction with Wait as a function of headway 1
TRB 2014 Annual Meeting Paper revised from original submittal.

Chow, Block-Schachter, and Hickey 11
When broken down by headway, there is still no major shift in respondents’ overall rating of the 1 MBTA. Significant increases were only measured in the 4 and 7 minute headway categories, 2 while for long headways over 9 minutes the MBTA rating declined. The satisfaction with wait 3 scores broken down by headway shows a clearer change in passenger sentiment with the new 4 real-time arrival signage. While scores remained relatively constant across headways prior to the 5 sign installation, there are significant increases in satisfaction for headways less than five 6 minutes. For headways greater than nine minutes, there is a significant decrease in the 7 satisfaction score, even after excluding observations during the service interruption. There is not 8 a significant change in satisfaction of wait between 5 and 9 minute headways. Passengers 9 respond to the amount of service being provided rather than simply the display of information. 10 A short advertised wait improved satisfaction while a long wait degrades wait time satisfaction. 11 12 Passenger Wait Time Estimates 13 Estimates of expected wait time are shown in Table 4 in two ways: passenger responses in wait 14 time estimation and passenger wait overestimation. The latter value is calculated by taking the 15 difference of the passenger estimate and the actual wait calculated in equation (1), averaged 16 across each rail line. 17
TABLE 4 Average Passenger Wait Time Estimates and Corresponding Average Headway 18 Experienced 19
Line
Average Passenger Wait Time Estimate (minutes)
Overestimation of Wait Time by Passengers (minutes)
Without RTPI
With RTPI (no large gaps)
Without RTPI
With RTPI T-statistic
Blue 6.25 4.76 2.66 1.00 6.02*** Orange 6.79 5.23 2.87 1.13 6.51***
Red 6.18 5.38 2.60 1.51 5.79*** All Lines 6.30 5.26 2.66 1.34 9.65***
Prior to the activation of real-time arrival signage, 53% of respondents indicated that they 20 expected to wait either 5 or 10 minutes for the train, showing that passengers think of round 21 numbers when not given an anchor on wait time. With countdown timers installed, some 22 passengers still assume this default one-headway mentality, while others note the real-time signs 23 and adjust their estimate to match the signage. As a result, the percentage of 5 and 10 minute 24 wait responses post-implementation decreased to 40%. Table 4 shows a significant reduction in 25 wait time overestimation on the Blue and Orange Lines of 1.7 minutes with RTPI, and a still 26 significant but smaller reduction of 1.1 minutes on the Red Line. This may be attributed to the 27 residual effects from the service interruption. Even after regular service resumed, announcements 28 about delays were still being made along the line, resulting in a passengers expecting to wait 29 longer than the estimates. 30
As with the Wait Satisfaction rating, the effects of real-time signage on expected wait 31 should also vary by headway. Figure 4 shows that without RTPI, passengers assume waits on the 32 order of 5 to 7 minutes for a train, regardless of actual train headways. This may be attributed to 33 passengers expecting to wait one full headway, the worst case scenario assuming scheduled 34 service. For train headways less than seven minutes, passenger wait time estimates post-35 activation decreased on the order of 1 to 2 minutes. These are all significant decreases at the 5 36 percent level. For big gaps, defined as 1.5 times the scheduled headway (8 minutes during AM 37
TRB 2014 Annual Meeting Paper revised from original submittal.

Chow, Block-Schachter, and Hickey 12
peak period), there is no significant change in wait time estimates. However, including data from 1 service disruptions increases wait time expectations, as passengers were not relying on the 2 inaccurate signage but on in-station announcements noting delays in the system. 3
4
5 FIGURE 4 Wait Time Estimate as a function of Headway 6 7 Comparison Between Peak and Off-peak Service 8 A secondary study was performed at Davis Station on the Red Line focusing on two questions: 9 whether different service characteristics impact passenger perceptions of wait and whether other 10 stations having countdown signs activated for extended periods of time affect stations without 11 countdown signs more. Specifically, this section looks at whether off-peak service with longer 12 headways benefitted more from the signage compared to peak service. Davis Station was 13 surveyed in June (before real-time activation) and July (after real-time activation) 2013 during 14 both peak and off-peak periods to gauge changes in ratings and wait times. Surveys were 15 distributed on the same day of the week for both periods. Results are shown in Table 5. 16
17
TRB 2014 Annual Meeting Paper revised from original submittal.

Chow, Block-Schachter, and Hickey 13
TABLE 5 Comparison of Peak and Off-Peak results 1 Without
RTPI With RTPI
T-statistic
Number of Surveys distributed
Davis Peak 351 150 -- Davis Off Peak 107 109 --
MBTA Rating (1-5)
Red Line Peak 3.41 3.46 1.54 Davis Peak 3.45 3.51 0.86 Davis Off-Peak 3.65 3.37 -2.36
Satisfaction of Wait Rating
(1-5)
Red Line Peak 3.68 3.77 2.33 Davis Peak 3.39 4.00 7.09 Davis Off-Peak 3.95 3.96 0.12
Wait Time Expectations (minutes)
Red Line Peak 6.18 5.38 4.62 Davis Peak 7.16 4.06 8.50 Davis Off-Peak 6.99 5.45 2.47
Difference of Expected wait and Actual wait time
Red Line Peak 2.60 1.58 5.79 Davis Peak 3.22 0.86 6.62 Davis Off-Peak 3.58 0.98 4.33
At Davis Station, results appear to be generally consistent with the previous work. Surprisingly, 2 there were larger variations in the MBTA rating and satisfaction of wait than expected. Lower 3 scores for the MBTA and wait satisfaction without real-time could be attributed to an 4 announcement of service disruption on the Red Line that did not affect the majority of 5 passengers in the station. However, the marked decrease in the MBTA rating during the off-peak 6 period is counterintuitive, especially after controlling for the day of week variation. There is a 7 consistent improvement in the wait-time estimates, and the decrease in wait time overestimation 8 is more pronounced here compared to previous Red Line survey work. There are two likely 9 causes: (1) passengers could be accustomed to other stations having real-time information, and 10 will be more likely to use it when implemented at new stations; (2) the real-time signage might 11 underreport actual train arrival times. This is due to Davis Station being the first stop after the 12 terminus, causing signs to report scheduled arrival times until the train leaves the terminus. On 13 several occasions, the countdown timer reported the next train arrival in one minute, with actual 14 arrivals more than a minute later. System reports comparing prediction times to actual arrival 15 times noted that for predicted arrivals of 1 minute, the train arrived later than the prediction half 16 the time. 17
This section shows that the peak period effects extend to other time periods for wait-18 times, but further study is needed to verify the effects on wait satisfaction and transit agency 19 perception. 20 21 Ridership 22 This section examines whether ridership increased as a result of the countdown sign project. 23 Signs were activated over the course of 9 months, allowing a natural variation in start date than 24 can help control for time-based trends based on economic and other factors, since countdown 25 clocks are put in service presumably without consideration of exogenous variables that influence 26 ridership. Our model follows a similar format to Tang’s (12), but is significantly simpler since 27 we have access to less data. The basic model treats the log of ridership at the station/route level 28 on a given day as function of whether or not that station had RTPI, and whether it was before or 29
TRB 2014 Annual Meeting Paper revised from original submittal.

Chow, Block-Schachter, and Hickey 14
after the fare increase. If RTPI positively impacts ridership, the coefficient will be positive and 1 significant. The inclusion of the fare increase provides a very basic test of directionality. If the 2 model is useful, it should estimate a negative impact of the fare increase on ridership. 3 Seasonal effects are accounted for by using dummy variables for each month (weekly 4 dummies were also tested), and day of week effects accounted for similarly. Station and line 5 level effects are used to control for the variability of overall levels of ridership by line and station. 6 Alternate forms of the model interacting these effects were also tested, as were models that 7 included day specific effects. Holidays, weekends, and system-wide service interruptions were 8 excluded from the dataset as RTPI was not guaranteed to be on during these periods. All heavy 9 rail stations received countdown timers within this time period. In addition, the MBTA 10 introduced a fare increase in July 2012. With these two sets of dates in mind, the model takes the 11 form 12 13 log(𝐵𝑜𝑎𝑟𝑑𝑖𝑛𝑔𝑠) ≈ 𝑓(𝐶𝑜𝑢𝑛𝑡𝑑𝑜𝑤𝑛,𝐹𝑎𝑟𝑒 𝐼𝑛𝑐𝑟𝑒𝑎𝑠𝑒, 𝑆𝑡𝑎𝑡𝑖𝑜𝑛/𝑅𝑜𝑢𝑡𝑒,𝐷𝑎𝑦 𝑜𝑓 𝑊𝑒𝑒𝑘,𝑀𝑜𝑛𝑡ℎ) (2) 14 15 Results are shown in Table 7, with the station, day of week, and month variables omitted for 16 brevity. This regression model indicates that ridership decreased by 3.9 percent as a result of the 17 fare increase, but increased by 1.7 percent with countdown timers. These were all significant at 18 the p=0.05 and p=0.01 level with a model-adjusted R2 of 0.96. The model suggests that a modest 19 ridership increase is possible as a result of countdown timers, although other factors such as fare 20 changes may affect ridership to a larger degree. Because this model relies heavily on fixed 21 effects, and does not directly connect system perception to increase ridership, we caution against 22 drawing too strong conclusions from it. While it may be that improved perceptions of service 23 and the positive press the MBTA garnered in this period did in fact improve service, we cannot 24 conclude that definitively at this point. 25 26 TABLE 6 Ridership Regression Results 27 Dependent Variable Estimate S. E. T-statistic Real-time 0.017 0.0054 13.09*** Fare Increase -0.039 0.003 3.23** Adjusted R2 0.9619 Significance Levels * 0.05 ** 0.01 *** 0.001 28 CONCLUSION 29 Countdown signs have significantly altered how passengers view their wait for public transit in 30 Boston. Passengers reduce estimates of wait time on average by 0.85 minutes. After controlling 31 for service disruptions (when the countdown predictions are less accurate), passengers reduce 32 wait time estimates by 1.3 minutes. This corresponds to a reduction of approximately 13% in 33 total passenger wait time estimation, and a 50% reduction in wait time overestimation. This 34 coincides with improved wait satisfaction for headways lower than 5 minutes, but decreased for 35 headways greater than 9 minutes. Wait time overestimation remained high at 34% even with 36 countdown timers, significantly higher than the 9-13% overestimate of wait time found by 37 Dzeikan (7). This may be the result of (1) respondents including wait time from prior modes of 38 transport in their responses, resulting in inflated estimates; (2) the uncertainty of wait from 39 service disruptions influencing estimates; (3) the tendency to round estimates of expected wait 40 time. 41
TRB 2014 Annual Meeting Paper revised from original submittal.

Chow, Block-Schachter, and Hickey 15
This low cost solution has shown to be an effective way to decrease expected passenger 1 wait time for regular service operations. This reduction has also been shown to improve 2 passenger satisfaction when waiting for the train during regular headways. The research results 3 presented here have several implications for the MBTA going forward: 4
• New amenities such as real time information, while increasing the attractiveness of 5 service, also raise the passenger expectations by making irregular service more visible. 6
• Increased visibility of real-time information means that passengers will incorporate this 7 information into wait time estimates. Inaccurate estimates reduce trust in the system and 8 increase wait anxiety beyond not having any information, decreasing satisfaction with the 9 system. 10
This research and the MBTA’s experience also have several implications for other transit 11 agencies: 12
• Real-time information improves the passenger experience at a relatively low cost. This 13 research and the MBTA’s experience provides strong support for other agencies to pursue 14 countdown timers, especially when their cost is compared to other customer improvement 15 measures like new trains, renovated stations, and more frequent service. 16
• Release real-time predictions to third-party app developers. A natural extension of in-17 station real-time information is releasing real-time predictions to third-party app 18 developers and allowing developers to create apps for customer use. The MBTA chose 19 to release a new version of its real-time prediction feed to developers in addition to 20 activating countdown timers in stations, but other agencies could implement an even 21 more low cost solution than the one chosen by the MBTA by only releasing a real-time 22 prediction feed to developers and avoiding the cost of maintaining a network of signs in 23 stations. However, because passengers will not automatically have the countdown 24 information in front of them in stations and will instead need to seek out the information, 25 the positive impacts on customer experience seen at the MBTA may not be as 26 pronounced. 27
Future research on real-time information at the MBTA includes expanding real-time 28 predictions to the Green Line, MBTA’s light rail system. Due to the different train tracking 29 technology, the Green Line will not have real-time information until at least 2015. Several key 30 differences may result in new findings for the Green Line. First, the Green Line has four 31 branches which converge into one trunk portion, compared to two on the Red Line. There exists 32 no preset order of train arrivals in the trunk to each branch. Because of this uncertainty, 33 introducing real-time information may yield much larger reductions in wait anxiety. In addition, 34 because the headways within the trunk portion of the Green Line vary more than those on the 35 heavy rail lines, there is likely to be more significant results for the effects of irregular service on 36 wait-time estimates and wait satisfaction due to greater variability in the sample. This does come 37 at a higher cost, as new train tracking technology will need to be installed to gain this 38 functionality. 39 Another extension of the work is verifying the effects of real-time information over the 40 entire day and weekend compared to the current AM peak period of study. Preliminary 41 indications are that findings will be more pronounced during periods of higher headways. This is 42 especially important as maintenance on rail lines typically occurs on weekends, resulting in 43 service disruptions and irregular service. Currently the real-time signs are turned off during any 44 scheduled track work. Fine tuning wait-time estimates and turning countdown timers on for the 45 remaining portions of service should reduce the wait-time uncertainty by a larger margin 46
TRB 2014 Annual Meeting Paper revised from original submittal.

Chow, Block-Schachter, and Hickey 16
compared to this existing piece as the additional uncertainty from irregular service is removed. 1 Lastly, additional impacts of real time information on behavior are necessary, including those 2 that utilize longitudinal survey data to: (1) better link ridership changes and satisfaction changes 3 as a result of improvements and (2) measure whether people have changed behavior with respect 4 to travel patterns as a result of real-time information, both before departing on the trip (on 5 computers or mobile phones) or while on the trip (on mobile phones or in-station signage). 6 In sum, while real-time arrival signage has reduced the expectation of wait for heavy rail 7 passengers and increased wait time satisfaction, it has put more emphasis on service regularity. 8 This research confirms the benefits of this relatively low-cost solution for transit agencies 9 including preliminary indications of ridership increases, and points to ways to change the 10 perception of time spent on public transit over the long-term. 11
TRB 2014 Annual Meeting Paper revised from original submittal.

Chow, Block-Schachter, and Hickey 17
REFERENCES 1 2 (1) Barker, J. B. et al. Real-Time Bus Arrival Information Systems. TCRP Synthesis 48, 3
Transportation Research Board, 2003, pp. 24-25. 4 5
(2) Smith, S. and K. Gay. Representation of Transit ITS in Network-Based Travel Models 6 http://ntl.bts.gov/lib/35000/35200/35275/Transit_ITS_2005.pdf Accessed Apr 21, 2013. 7
8 (3) Yoh, A. et.al. Hate to Wait: Effects of Wait Time on Public Transit Travelers’ Perceptions. 9
Transportation Research Record: Journal of the Transportation Research Board, No. 2216, 10 Transportation Research Board of the National Academies, Washington, D.C., 2011, pp. 11 116–124. 12
13 (4) Li, Y. Evaluating the Urban Commute Experience: A Time Perception Approach. Journal 14
of Public Transportation, Vol. 6, No. 4, 2003 pp. 41-66. 15 16
(5) Zhang, F., Q. Shen, and K. Clifton. Examination of Traveler Responses to Real-Time 17 Information About Bus Arrivals Using Panel Data. Transportation Research Record: 18 Journal of the Transportation Research Board, No. 2082, Transportation Research Board 19 of the National Academies, Washington, D.C., 2008, pp. 107–115. 20 21
(6) Dziekan, K., and K. Kottenhoff. Dynamic at-stop real-time information displays for public 22 transport: effects on customers. Transportation Research Part A. Transportation Research 23 Board, 2007, pp. 489–501. 24 25
(7) Mishalani, R., S. Lee, and M. McCord. Evaluating Real-Time Bus Arrival Information 26 Systems. Transportation Research Record: Journal of the Transportation Research Board, 27 No. 1731, Transportation Research Board of the National Academies, Washington, D.C., 28 2000 pp. 81-87. 29
30 (8) Hickman, M. D., and N. H. M. Wilson. Passenger Travel Time and Path Choice 31
Implications of Real-Time Transit Information. Journal of Transportation Research C, Vol. 32 3, No. 4, 1995, pp. 211–226. 33
34 (9) Gammer, N., T. Cherrett, C. Gutteridge. Disseminating real-time bus arrival information 35
via QRcode tagged bus stops: a case study of user take-up and reaction in Southampton, 36 UK. Journal of Transport Geography. 2013 Available online 19 July 2013 37
38 (10) Smith, R., S. Atkins, and R. Sheldon, London Transport Buses: ATT in Action and the 39
London Countdown Route 18 Project. Proceedings of the First World Congress on 40 Applications of Transport Telematics and Intelligent Vehicle–Highway Systems, Paris, 41 France, November 30–December 3, 1994, pp. 3048–3055. 42
43 (11) Dziekan K. and A. Vermeulen. Psychological Effects of and Design Preferences for Real-44
Time Information Displays. Journal of Public Transportation, Vol. 9, No. 1, 2006 pp. 71-45 89. 46
TRB 2014 Annual Meeting Paper revised from original submittal.

Chow, Block-Schachter, and Hickey 18
1 (12) Tang, L. and P. Thakuriah. Ridership effects of real-time bus information system: A case 2
study in the City of Chicago. Transportation Research Part C. Transportation Research 3 Board 2012. pp. 146–161. 4
5 (13) Tang, L., H. Ross, and X. Han. Substitution or Complementarity: an Examination of the 6
Ridership Effects of Real-time Bus Information on Transit Rail in the City of Chicago. 7 Transportation Research Record: Journal of the Transportation Research Board No. 2276, 8 Transportation Research Board of the National Academies, Washington, D. C., 2012, pp. 9 156-163 10
11 (14) Ferris, B., K. Watkins, and A. Borning. OneBusAway: Behavioral and Satisfaction 12
Changes Resulting from Providing Real-Time Arrival Information for Public Transit 13 Proceedings of the 2011 Transportation Research Board Annual Meeting. 14
15 (15) Casey, R. F. et.al. Advanced Public Transportation Systems: The State of the Art Update 16
2000. http://ntl.bts.gov/lib/jpodocs/repts_te/13583.pdf Accessed Apr. 22, 2013. 17 18 (16) Moskowitz, E. T riders today to learn where their train is. Boston.com 19
http://www.boston.com/news/local/massachusetts/articles/2012/08/15/mbta_debuting_coun20 tdown_signs_at_subway_stations_to_let_riders_know_when_next_train_is_arriving/ 21 Accessed Apr 22, 2013. 22
23 (17) MBTA. Ridership and Service Statistics. Massachusetts Bay Transportation Authority, 24
Boston, 2010. 25 26 (18) MBTA Developers Page. MBTA.com http://www.mbta.com/rider_tools/developers/ 27
Accessed July 27, 2013. 28 29
TRB 2014 Annual Meeting Paper revised from original submittal.