Embed Size (px)
Citation preview
Impactsofshrimpandprawnfarmingonlocalenvironmentsandlivelihoods insouthwestcoastalpartofBangladesh
Md.RashedulIslamStudent ID:47136804
Department ofEnvironmentSystemsGSFS,TheUniversityofTokyo
31st July,2015
1
Introduction
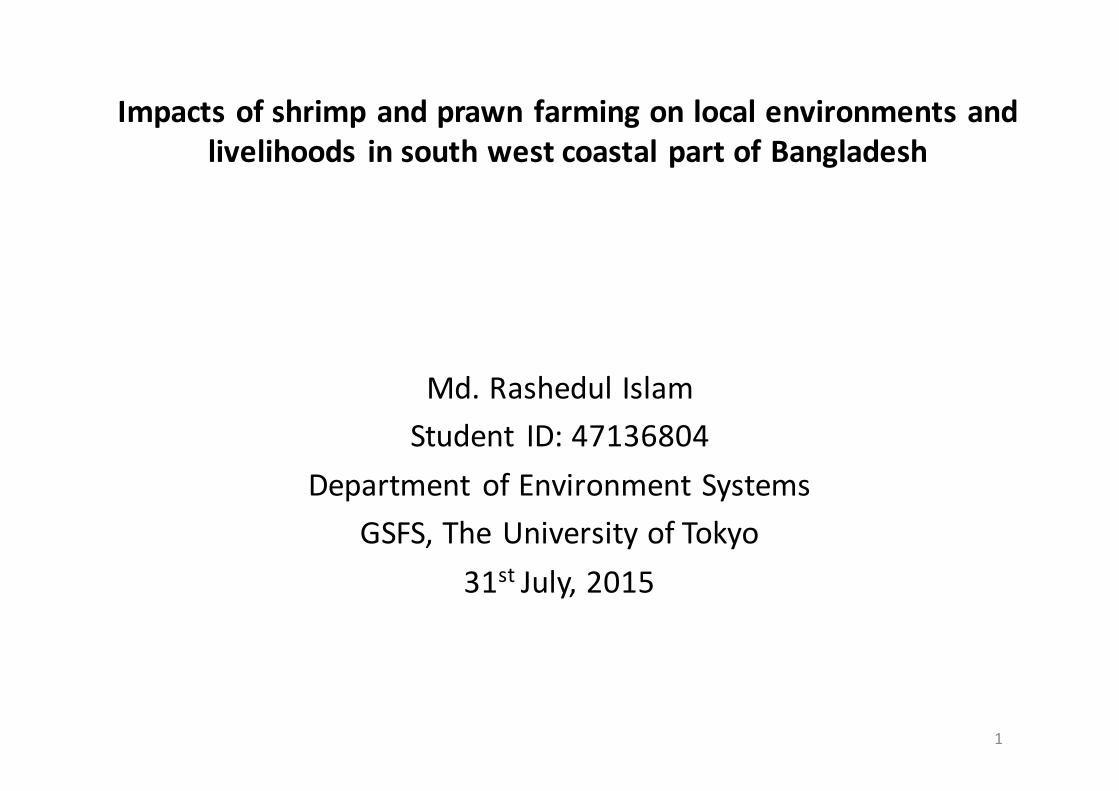
Shrimp farming has been started atearly of 1980s and prawn farming atearly of 1990s
Rapid expansion took place duesuitable agro-climatic condition andavailability resources
Occupied major economic activity inthe south-west coastal part ofBangladesh
Most of farms are constructed bytransforming prime agricultural land
Number of shrimp farmers: 538,000Number of prawn farmer: 295,000
Fig.1:Trendofincreasingfarmingareaandproductionofshrimp
(Source:DoF,2002,2014) 2Fig.2:TrendofincreasingfarmingareaandproductionofPrawn
0500010000150002000025000300003500040000
010000200003000040000500006000070000
1994-95 2000-01 2005-06 2012-13
Prod
uctio
ninM
T
Farm
areainha
Farmarea Prouduction
0100002000030000400005000060000700008000090000100000
0
50000
100000
150000
200000
250000
1985-86 1995-96 2005-06 2012-13
Prod
uctio
ninM
T
Farm
areainha
Farmarea Production
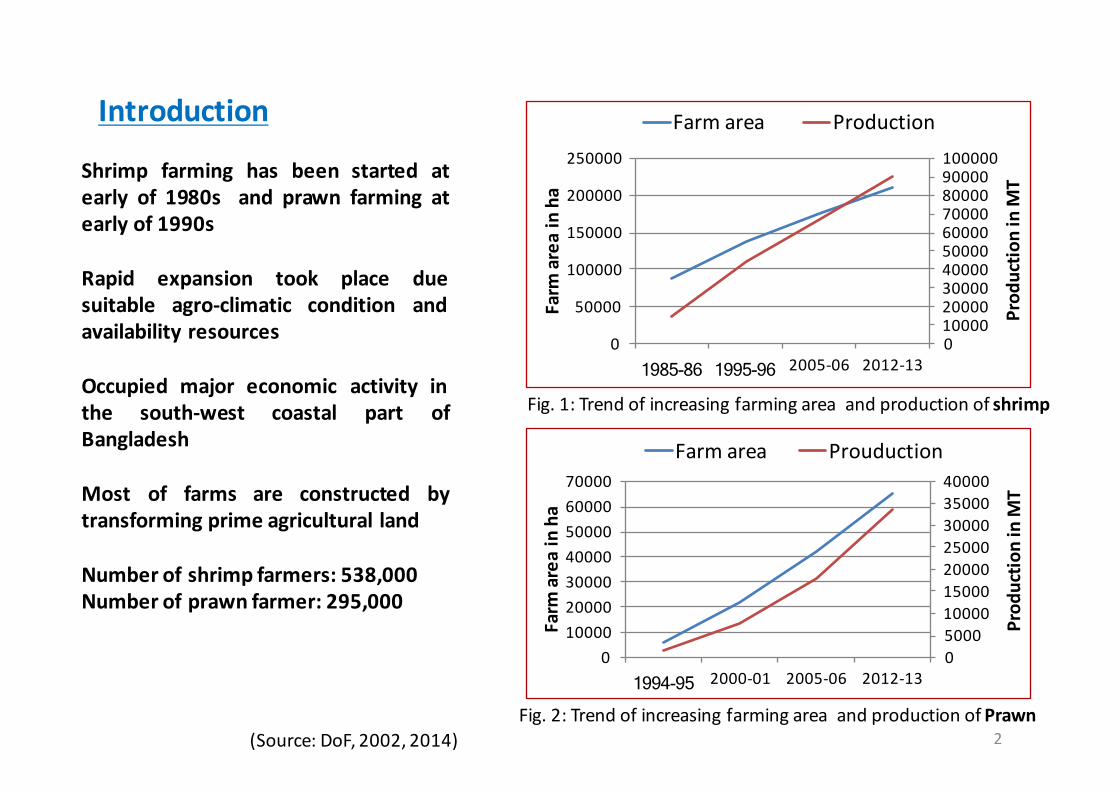
CultureEnvironmentSalinewater Shrimp
PrawnFreshwater
Salinewater
Shrimpfarminwetseason Shrimpfarmindryseason
Freshwater
Prawn-ricefarminwetseason Prawn-ricefarmindryseason3
Yieldtype
Months
January-February
February-March
March-April
April-May
May-June
June-July
July-August
August-Septem
ber
September
-October
October-
Novem
ber
Novem
ber-Decem
ber
Decem
ber-January
Shrimp
Prawn-rice
Rice
Firstcycleofshrimpproduction
Secondcycleofshrimpproduction
Prawnproductioncycle
Boro riceproductioncycle
Amanriceproductioncycle
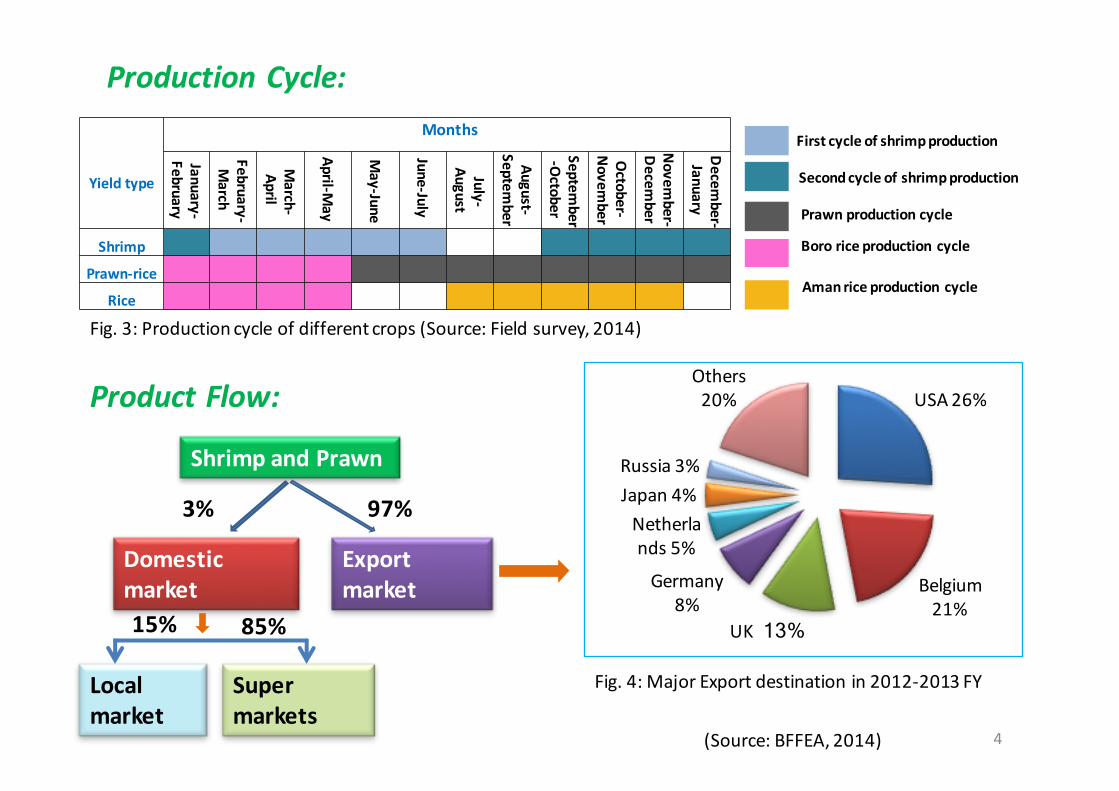
ProductionCycle:
ProductFlow: USA26%
Belgium21%
UK 13%
Germany8%
Netherlands 5%
Japan 4%Russia 3%
Others20%
Fig.4:MajorExportdestinationin2012-2013FY
(Source:BFFEA,2014)
ShrimpandPrawn
Domesticmarket
Exportmarket
3% 97%
Localmarket
Supermarkets
15% 85%
Fig.3:Productioncycleofdifferentcrops(Source:Fieldsurvey,2014)
4
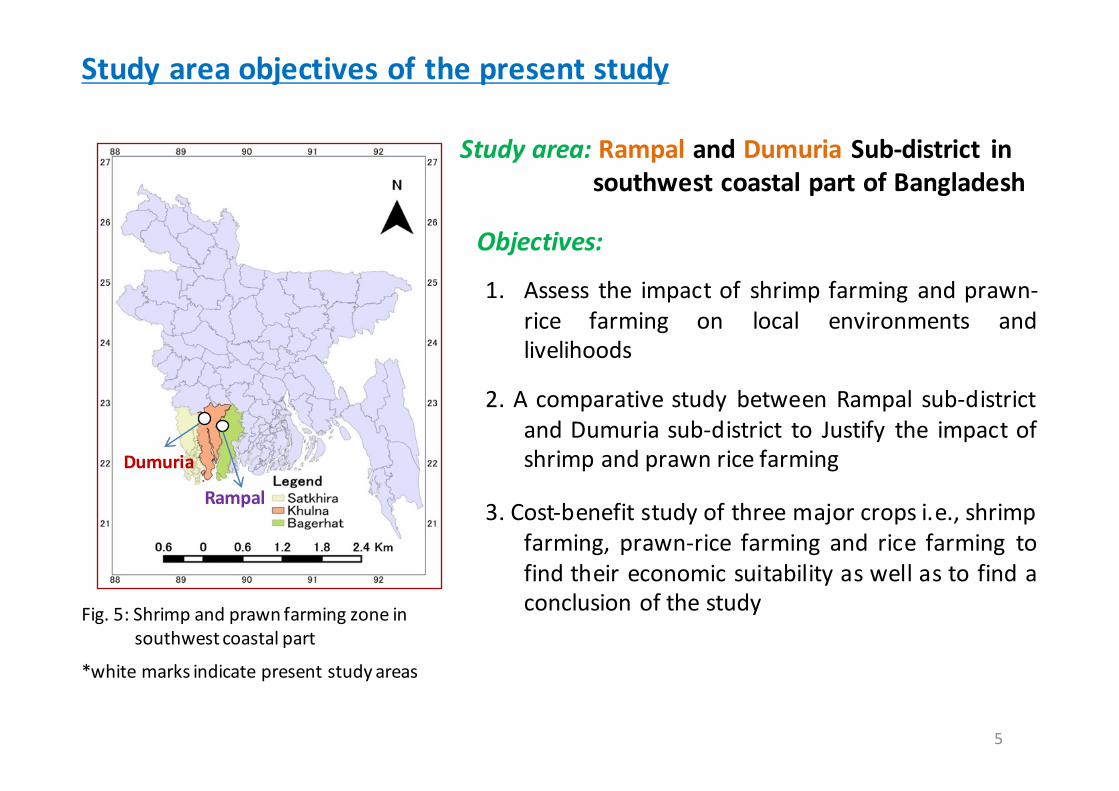
1. Assess the impact of shrimp farming and prawn-rice farming on local environments andlivelihoods
2. A comparative study between Rampal sub-districtand Dumuria sub-district to Justify the impact ofshrimp and prawn rice farming
3. Cost-benefit study of three major crops i.e., shrimpfarming, prawn-rice farming and rice farming tofind their economic suitability as well as to find aconclusion of the study
Studyareaobjectivesofthepresentstudy
Studyarea:Rampal andDumuria Sub-district insouthwestcoastalpartofBangladesh
Objectives:
Fig.5:Shrimpandprawnfarmingzoneinsouthwestcoastalpart
*whitemarksindicatepresentstudyareas
Dumuria
Rampal
5
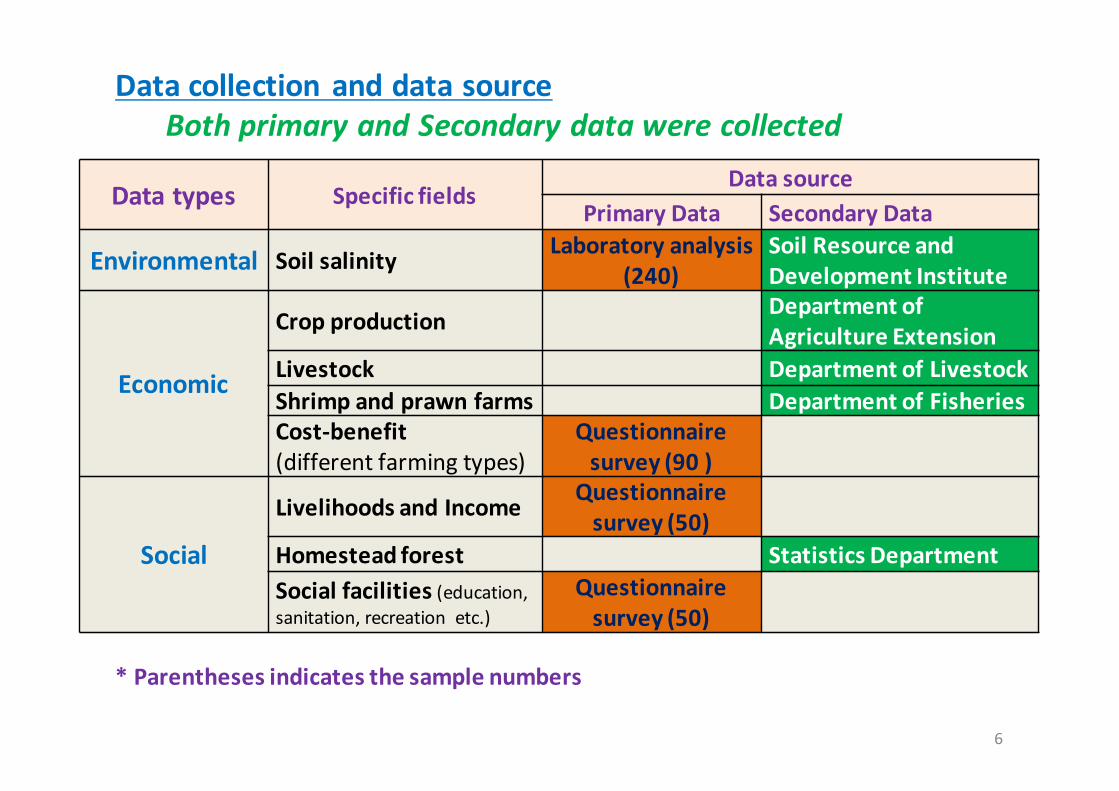
Datacollection anddatasourceBothprimaryandSecondarydatawerecollected
6
Datatypes SpecificfieldsDatasource
PrimaryData SecondaryData
Environmental Soilsalinity Laboratoryanalysis(240)
SoilResourceandDevelopmentInstitute
Economic
Cropproduction DepartmentofAgricultureExtension
Livestock DepartmentofLivestockShrimpandprawnfarms DepartmentofFisheriesCost-benefit(differentfarmingtypes)
Questionnairesurvey(90)
Social
Livelihoodsand Income Questionnairesurvey(50)
Homesteadforest Statistics DepartmentSocialfacilities(education,sanitation,recreationetc.)
Questionnairesurvey(50)
*Parenthesesindicatesthesamplenumbers
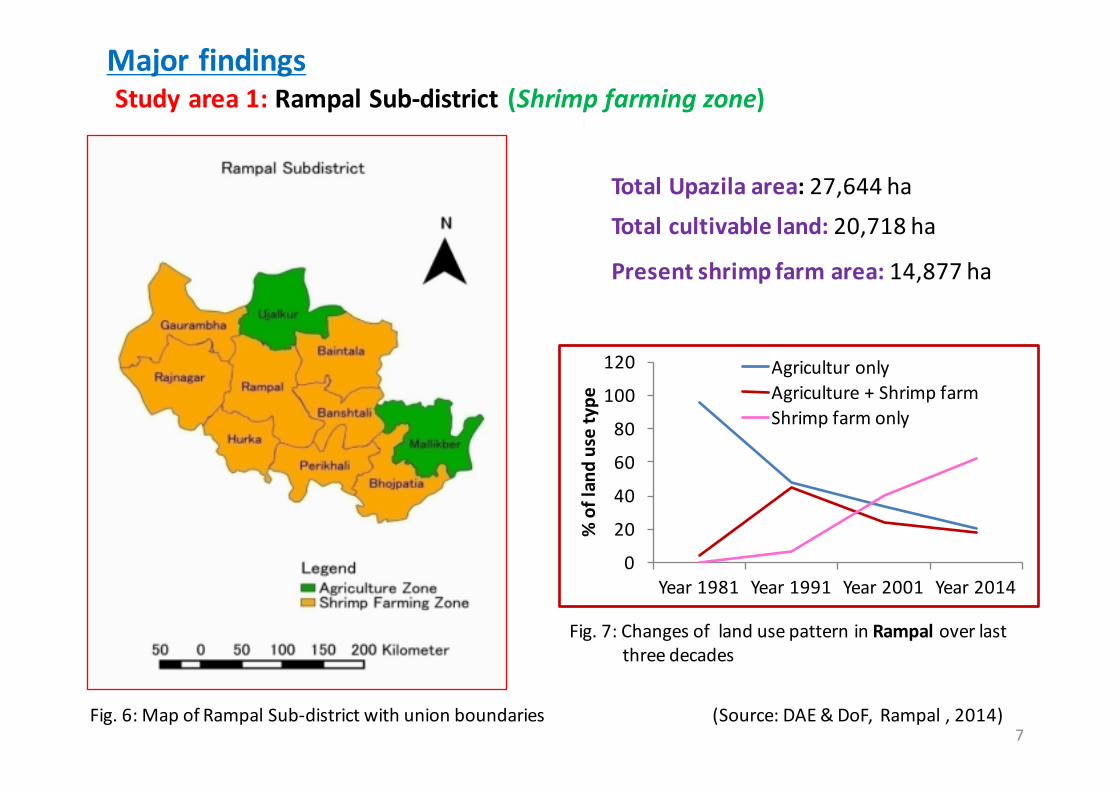
Fig.7:ChangesoflandusepatterninRampaloverlastthreedecades
TotalUpazilaarea:27,644haTotalcultivableland: 20,718ha
Presentshrimpfarmarea:14,877ha
(Source:DAE&DoF,Rampal,2014)Fig.6:MapofRampalSub-districtwithunionboundaries
Studyarea1:RampalSub-district (Shrimpfarmingzone)Majorfindings
7
0
20
40
60
80
100
120
Year1981 Year1991 Year2001 Year2014%oflandusetype
AgriculturonlyAgriculture+ShrimpfarmShrimpfarmonly
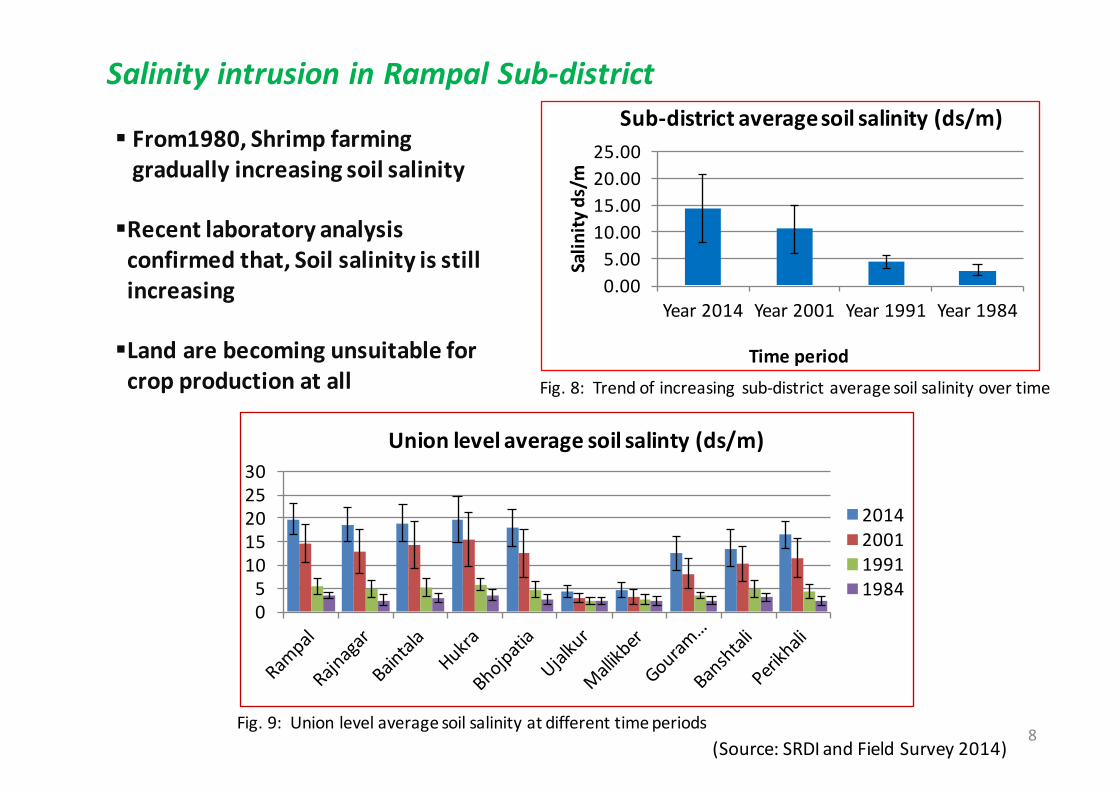
Fig.8:Trendofincreasingsub-districtaveragesoilsalinityovertime
§ From1980, Shrimp farminggradually increasing soil salinity
§Recent laboratory analysisconfirmed that, Soil salinity is stillincreasing
§Land are becoming unsuitable forcrop production at all
SalinityintrusioninRampalSub-district
Fig.9:Unionlevelaveragesoilsalinityatdifferenttimeperiods(Source:SRDIandFieldSurvey2014)
0.005.00
10.0015.0020.0025.00
Year2014 Year2001 Year1991 Year1984
Salin
ityds/m
Timeperiod
Sub-districtaveragesoilsalinity(ds/m)
8
05
1015202530
Unionlevelaveragesoilsalinty(ds/m)
2014200119911984
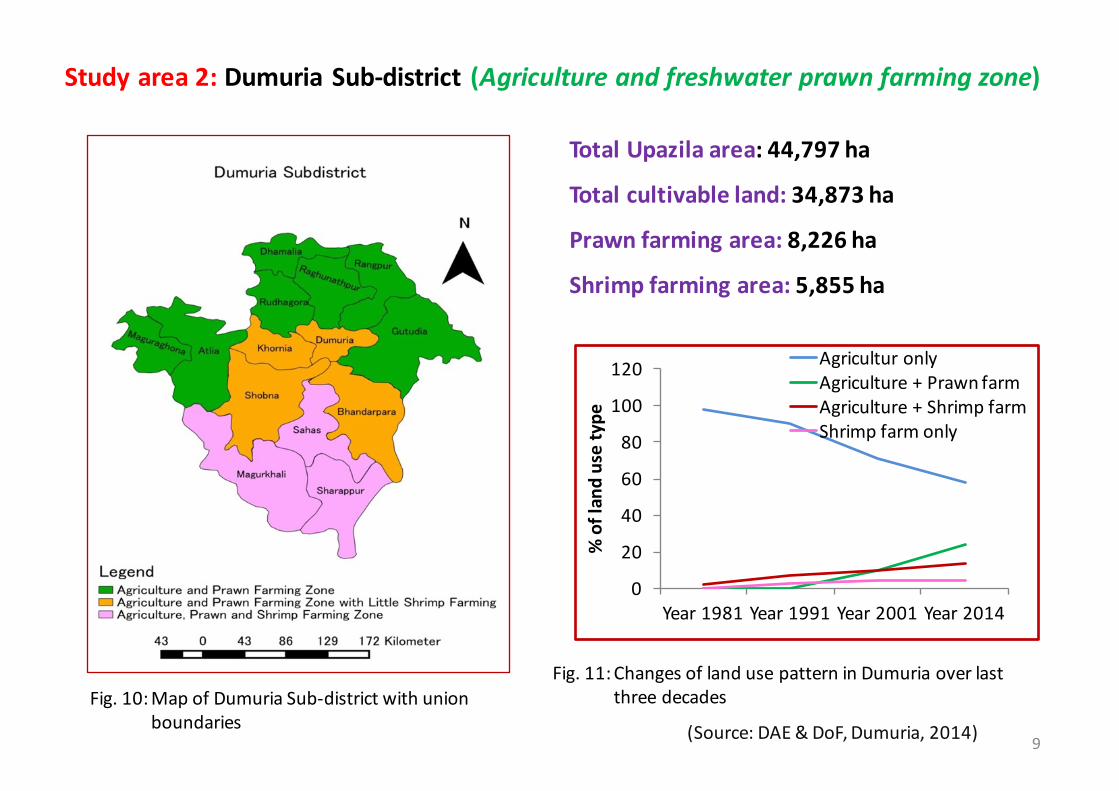
(Source:DAE&DoF,Dumuria,2014)
TotalUpazilaarea:44,797ha
Totalcultivableland: 34,873ha
Prawnfarmingarea: 8,226ha
Shrimpfarmingarea:5,855ha
Studyarea2:DumuriaSub-district (Agricultureandfreshwaterprawnfarmingzone)
Fig.11:ChangesoflandusepatterninDumuriaoverlastthreedecadesFig.10:MapofDumuriaSub-districtwithunion
boundaries9
0
20
40
60
80
100
120
Year1981 Year1991 Year2001 Year2014%oflandusetype
AgriculturonlyAgriculture+PrawnfarmAgriculture+ShrimpfarmShrimpfarmonly
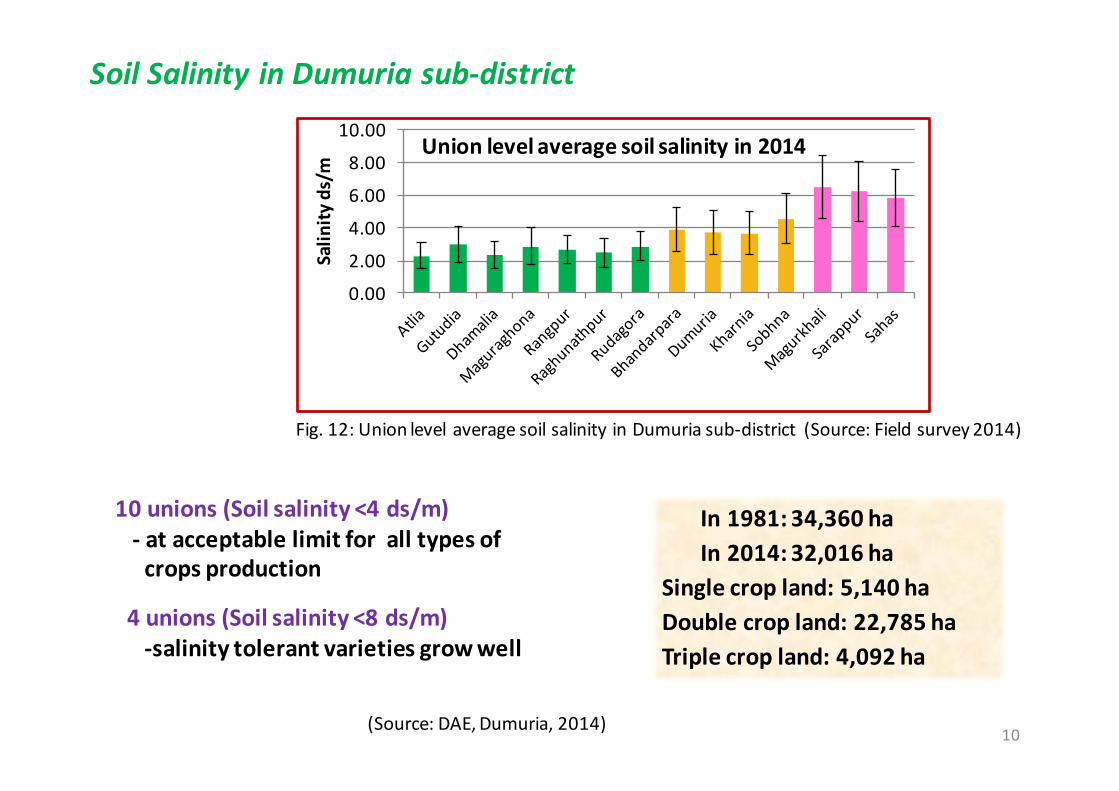
Fig.12:UnionlevelaveragesoilsalinityinDumuriasub-district(Source:Fieldsurvey2014)
10unions(Soilsalinity<4ds/m)- atacceptablelimitforalltypesofcropsproduction
4unions(Soilsalinity<8ds/m)-salinitytolerantvarietiesgrowwell
0.00
2.00
4.00
6.00
8.00
10.00
Salin
ityds/m
Unionlevelaveragesoilsalinityin2014
SoilSalinityinDumuriasub-district
(Source:DAE,Dumuria,2014) 10
In1981:34,360haIn2014:32,016ha
Singlecropland:5,140haDoublecropland:22,785haTriplecropland:4,092ha
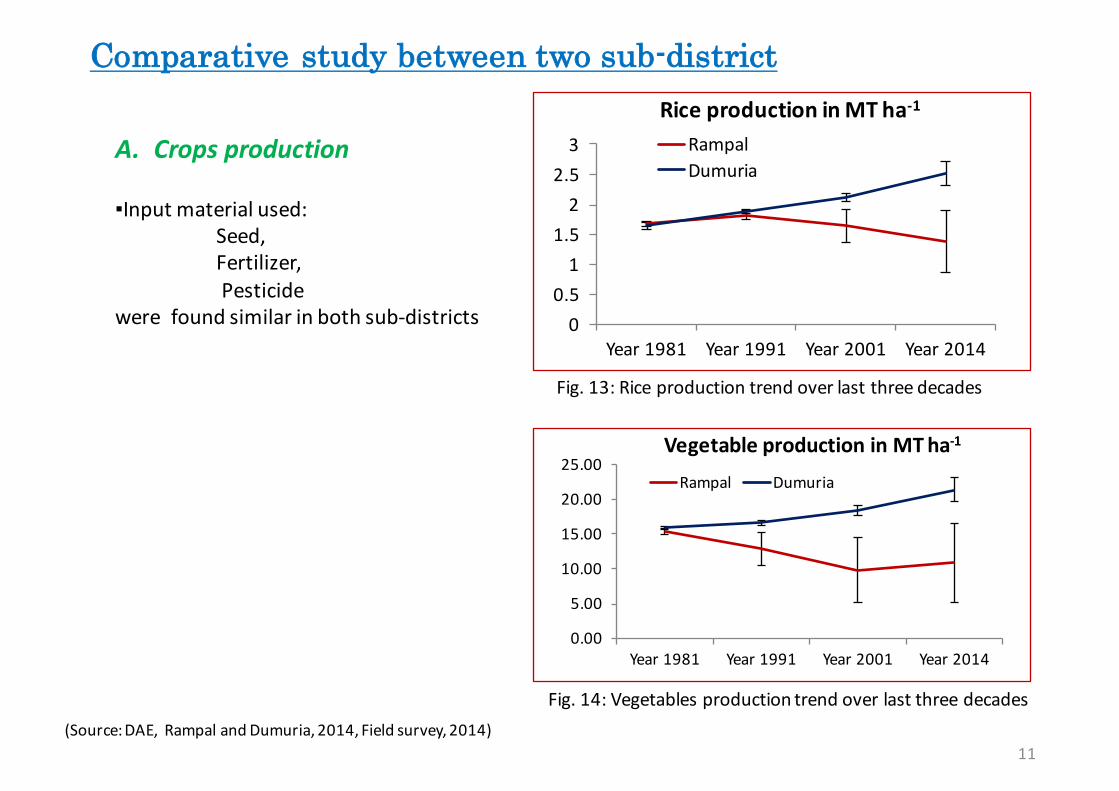
Comparative study between two sub-district
00.51
1.52
2.53
Year1981 Year1991 Year2001 Year2014
RiceproductioninMTha-1
RampalDumuria
0.00
5.00
10.00
15.00
20.00
25.00
Year1981 Year1991 Year2001 Year2014
VegetableproductioninMTha-1
Rampal Dumuria
A. Cropsproduction
▪Inputmaterialused:Seed,Fertilizer,Pesticide
werefoundsimilarinbothsub-districts
(Source:DAE,RampalandDumuria,2014,Fieldsurvey,2014)
Fig.13:Riceproductiontrendoverlastthreedecades
11
Fig.14:Vegetablesproductiontrendoverlastthreedecades
12
0.00
0.50
1.00
1.50
2.00
2.50
3.00
0.00 5.00 10.00 15.00 20.00 25.00
Perh
aprod
uctio
ninM
T
SoilSalinity(ds/m)
Unionlevelaveragesoilsalinityandriceproduction
Dumuriasub-district
Rampalsub-district
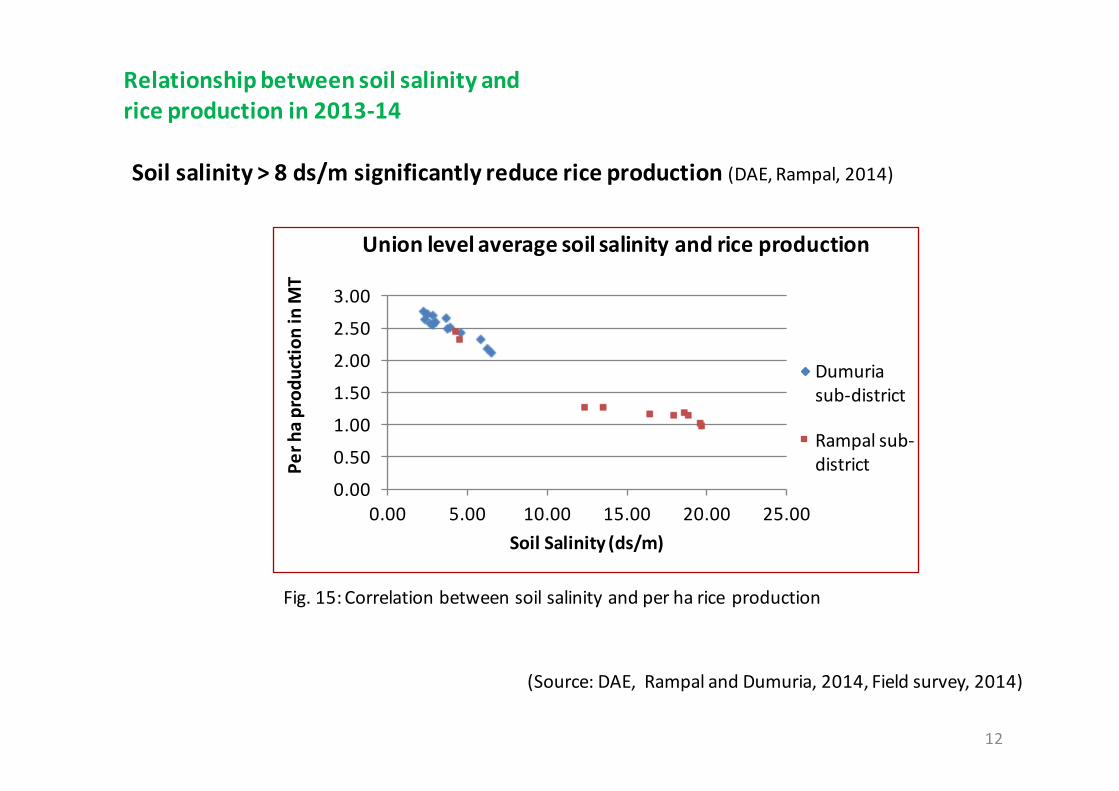
Soilsalinity>8ds/msignificantlyreducericeproduction(DAE,Rampal,2014)
Fig.15:Correlationbetweensoilsalinityandperhariceproduction
Relationshipbetweensoilsalinityandriceproductionin2013-14
(Source:DAE,RampalandDumuria,2014,Fieldsurvey,2014)
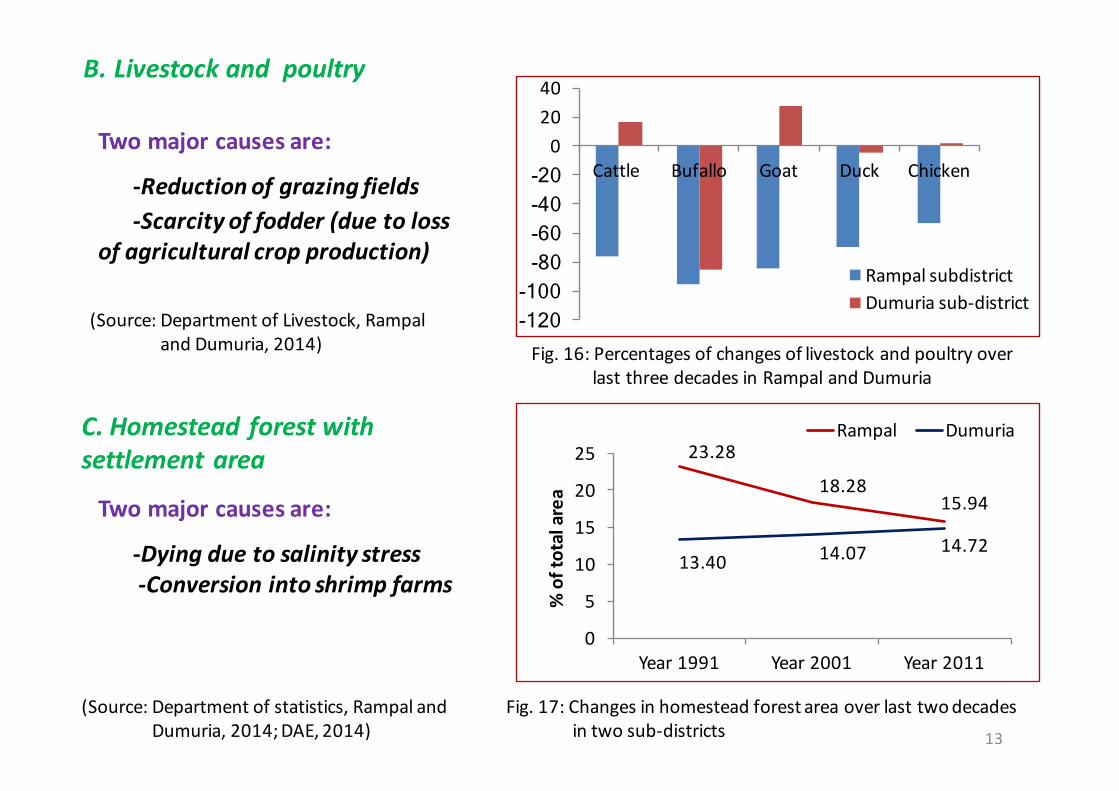
B.Livestockandpoultry
-120 -100 -80 -60 -40 -20 0
2040
Cattle Bufallo Goat Duck Chicken
RampalsubdistrictDumuriasub-district
Fig.16:PercentagesofchangesoflivestockandpoultryoverlastthreedecadesinRampalandDumuria
Twomajorcausesare:
-Reductionofgrazingfields-Scarcityoffodder(duetoloss
ofagriculturalcropproduction)
(Source:DepartmentofLivestock,RampalandDumuria,2014)
13
23.28
18.2815.94
13.40 14.07 14.72
0
5
10
15
20
25
Year1991 Year2001 Year2011
%oftotalarea
Rampal Dumuria
Fig.17:Changesinhomesteadforestareaoverlasttwodecadesintwosub-districts
Twomajorcausesare:
-Dyingduetosalinitystress-Conversionintoshrimpfarms
C.Homestead forestwithsettlementarea
(Source:Departmentofstatistics,RampalandDumuria,2014;DAE,2014)
(Source:Fieldsurvey2014)
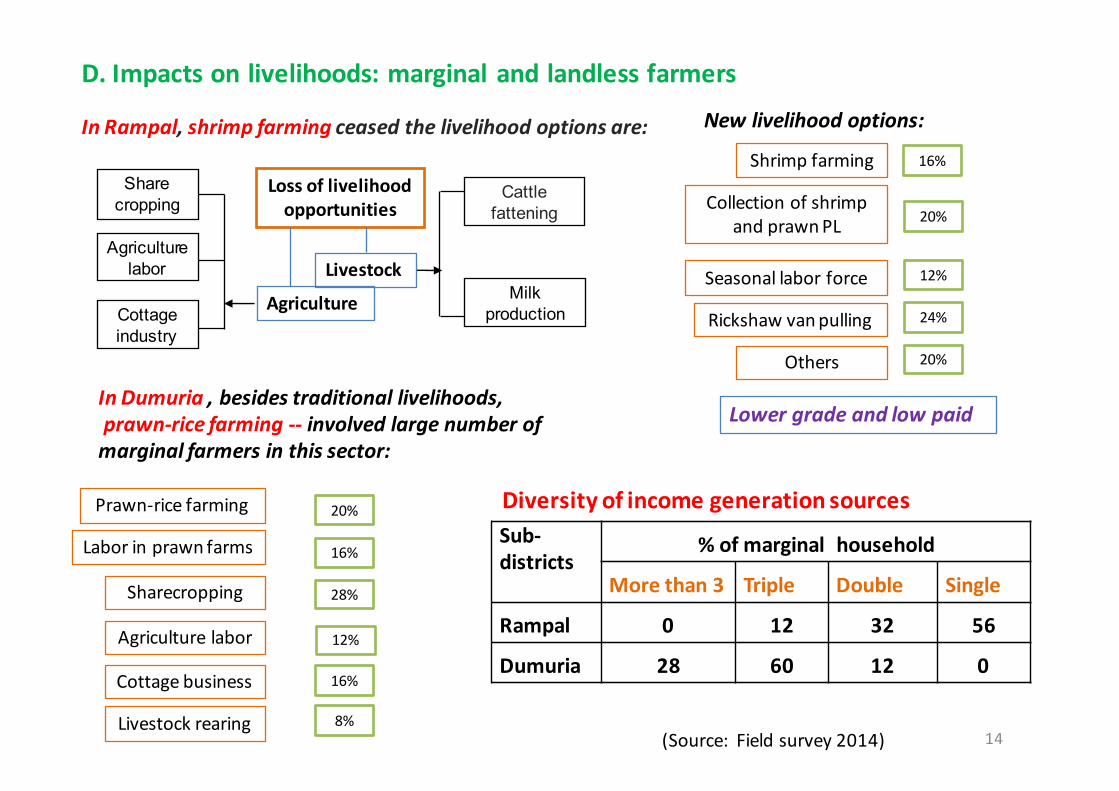
D.Impactsonlivelihoods:marginalandlandlessfarmers
InRampal,shrimpfarmingceasedthelivelihoodoptionsare:
Sharecropping
Cottage industry
Agriculture labor
Lossoflivelihoodopportunities
Cattlefattening
Milk productionAgriculture
Livestock
Newlivelihoodoptions:
Shrimpfarming
CollectionofshrimpandprawnPL
Seasonallaborforce
Others
Rickshawvanpulling
16%
20%
12%
24%
20%
InDumuria,besidestraditionallivelihoods,prawn-ricefarming-- involvedlargenumberofmarginalfarmersinthissector:
Prawn-ricefarming
Laborinprawnfarms
Sharecropping
Agriculturelabor
Cottagebusiness
Livestockrearing
20%
16%
28%
12%
16%
8%
Sub-districts
%of marginalhousehold
Morethan3 Triple Double Single
Rampal 0 12 32 56
Dumuria 28 60 12 0
Lowergradeandlowpaid
14
Diversityofincomegenerationsources
0
5000
10000
15000
20000
Householdhead'sincome
Familymember'sincmoe
Totalincome
Curren
cyinBDT
Averagemonthlyincome
Rampal
Dumuria
0
20
40
60
80
100
Accesstosafedrinkingwater
Useofsanitarylatrine
Accesstoelectricityconnection
Dropoutchildrenfrom
Primaryeducation
Percen
tageofFam
ily
Householdfacilities
Rampal
Dumuria
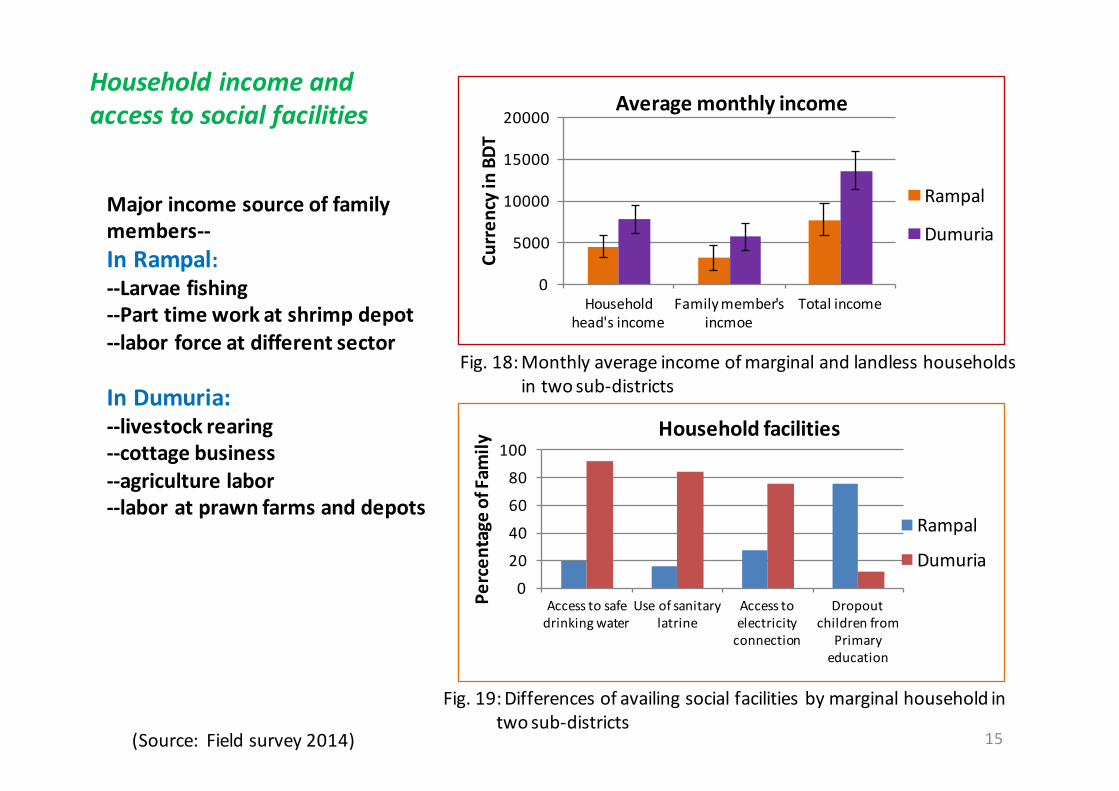
Householdincomeandaccesstosocialfacilities
Fig.18:Monthlyaverageincomeofmarginalandlandlesshouseholdsintwosub-districts
Fig.19:Differencesofavailingsocialfacilitiesbymarginalhouseholdintwosub-districts
Majorincomesourceoffamilymembers--InRampal:--Larvaefishing--Parttimeworkatshrimpdepot--laborforceatdifferentsector
InDumuria:--livestockrearing--cottagebusiness--agriculturelabor--laboratprawnfarmsanddepots
(Source:Fieldsurvey2014) 15
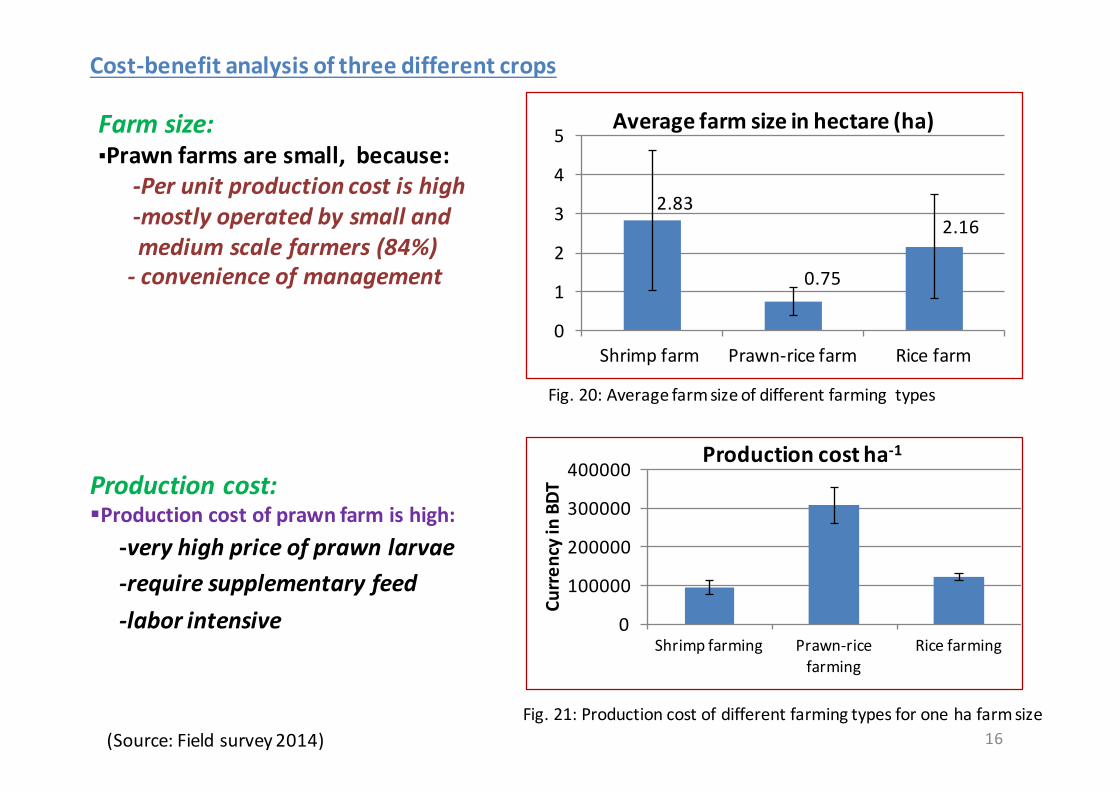
Cost-benefitanalysisofthreedifferentcrops
Farmsize:▪Prawnfarmsaresmall,because:
-Perunitproductioncostishigh-mostlyoperatedbysmallandmediumscalefarmers(84%)- convenienceofmanagement
(Source:Fieldsurvey2014)
Fig.20:Averagefarmsizeofdifferentfarmingtypes
2.83
0.75
2.16
0
1
2
3
4
5
Shrimpfarm Prawn-ricefarm Ricefarm
Averagefarmsizeinhectare(ha)
16
0
100000
200000
300000
400000
Shrimpfarming Prawn-ricefarming
Ricefarming
Curren
cyinBDT
Productioncostha-1
Fig.21:Productioncostofdifferentfarmingtypesforonehafarmsize
Productioncost:§Productioncostofprawnfarmishigh:
-veryhighpriceofprawnlarvae-requiresupplementaryfeed-laborintensive
17
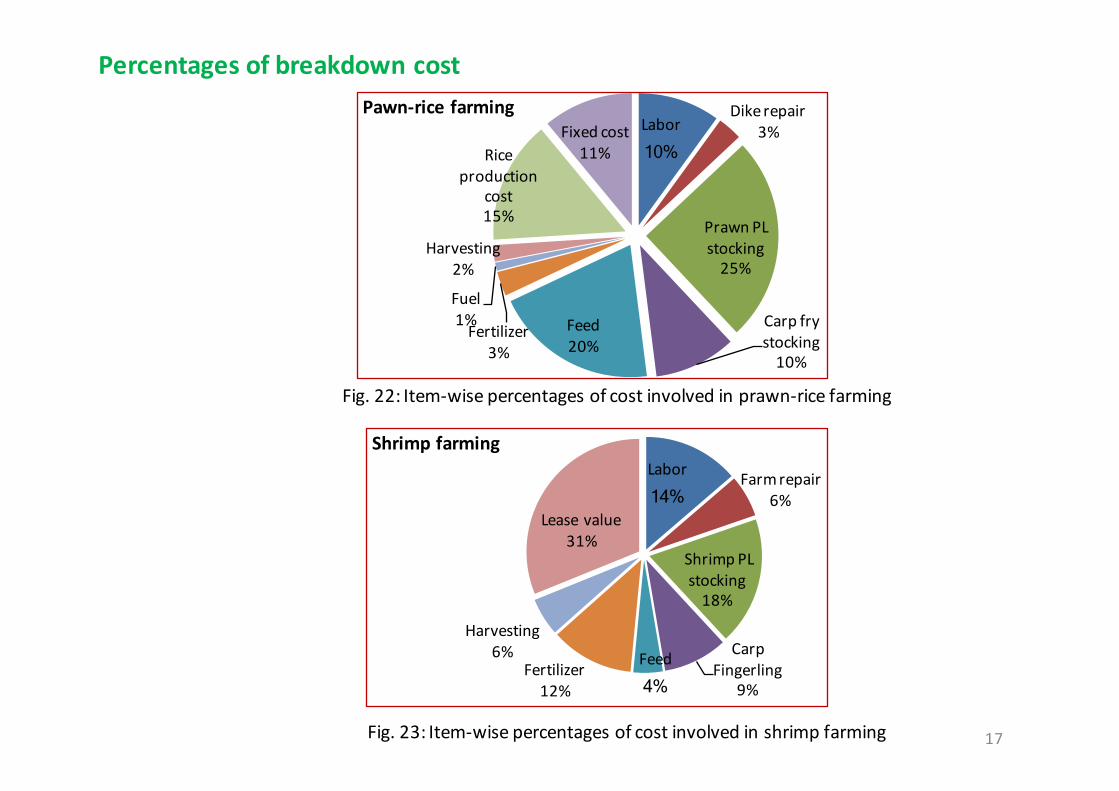
Percentagesofbreakdowncost
Labor
14% Farmrepair
6%
ShrimpPLstocking18%
CarpFingerling
9%
Feed
4% Fertilizer12%
Harvesting6%
Leasevalue31%
Shrimpfarming
Labor
10%
Dikerepair3%
PrawnPLstocking25%
Carpfrystocking10%
Feed20%
Fertilizer3%
Fuel1%
Harvesting2%
Riceproduction
cost15%
Fixedcost11%
Pawn-ricefarming
Fig.22:Item-wisepercentagesofcostinvolvedinprawn-ricefarming
Fig.23:Item-wisepercentagesofcostinvolvedinshrimpfarming
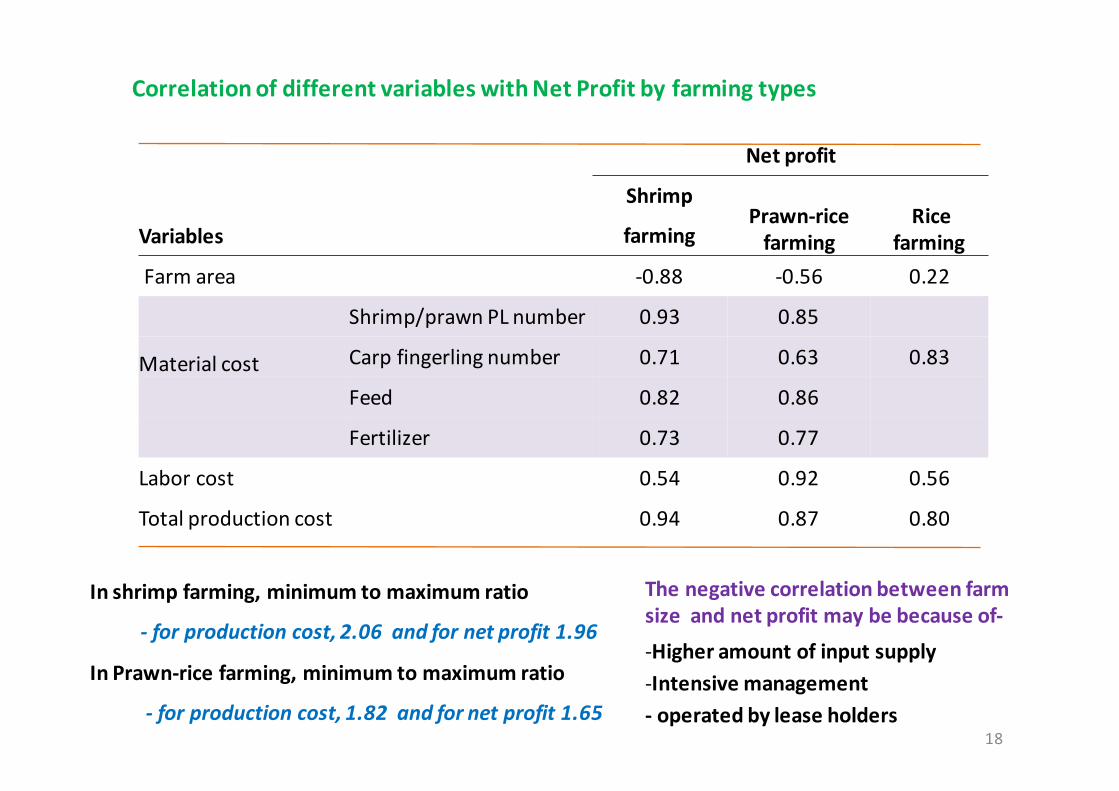
Netprofit
Variables
Shrimp
farmingPrawn-ricefarming
Ricefarming
Farmarea -0.88 -0.56 0.22
Shrimp/prawnPLnumber 0.93 0.85
Materialcost Carpfingerlingnumber 0.71 0.63 0.83
Feed 0.82 0.86
Fertilizer 0.73 0.77
Laborcost 0.54 0.92 0.56
Totalproductioncost 0.94 0.87 0.80
CorrelationofdifferentvariableswithNetProfitbyfarmingtypes
Inshrimpfarming,minimumtomaximumratio
- forproductioncost,2.06andfornetprofit1.96
InPrawn-ricefarming,minimumtomaximumratio
- forproductioncost,1.82andfornetprofit1.65
Thenegativecorrelationbetweenfarmsizeandnetprofitmaybebecauseof-
-Higheramountofinputsupply-Intensivemanagement- operatedbyleaseholders
18
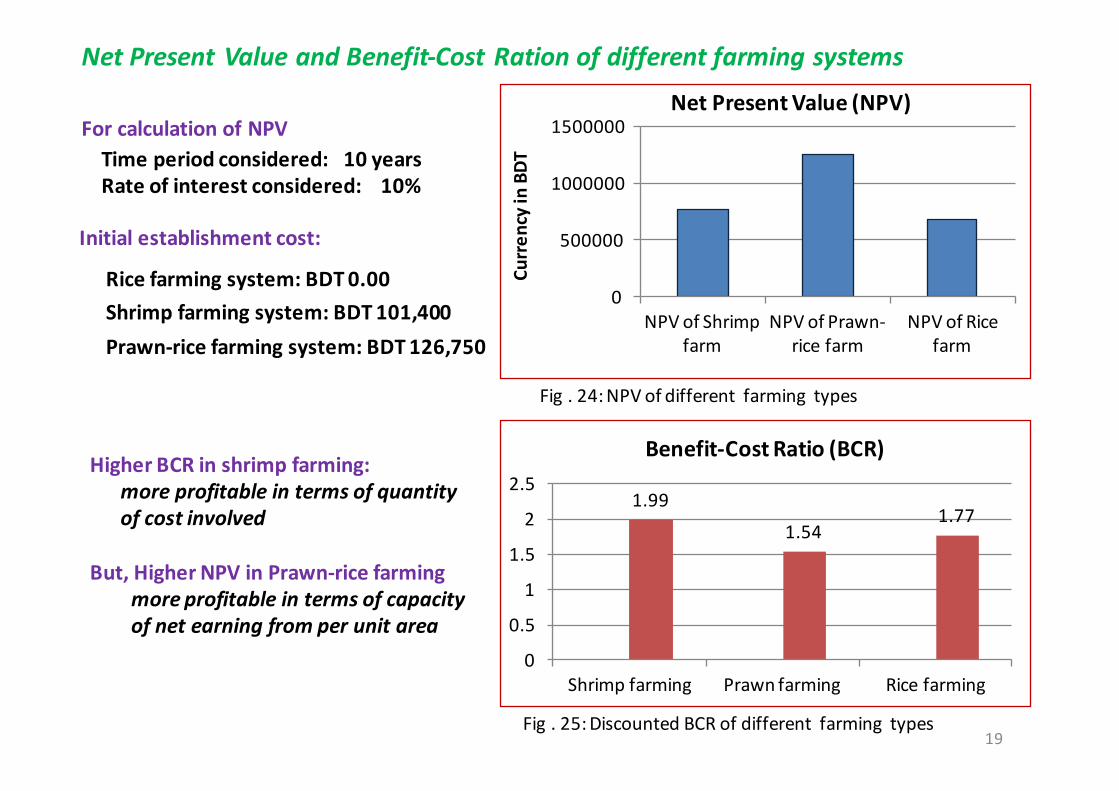
NetPresentValueandBenefit-CostRationofdifferentfarmingsystems
0
500000
1000000
1500000
NPVofShrimpfarm
NPVofPrawn-ricefarm
NPVofRicefarm
Curren
cyinBDT
NetPresentValue(NPV)
Initialestablishmentcost:
Ricefarmingsystem:BDT0.00Shrimpfarmingsystem:BDT101,400Prawn-ricefarmingsystem:BDT126,750
ForcalculationofNPVTimeperiodconsidered:10yearsRateofinterestconsidered:10%
Fig.24:NPVofdifferentfarmingtypes
Fig.25:DiscountedBCRofdifferentfarmingtypes
HigherBCRinshrimpfarming:moreprofitableintermsofquantityofcostinvolved
But,HigherNPVinPrawn-ricefarmingmoreprofitableintermsofcapacityofnetearningfromperunitarea
19
1.99
1.541.77
0
0.5
1
1.5
2
2.5
Shrimpfarming Prawnfarming Ricefarming
Benefit-CostRatio(BCR)
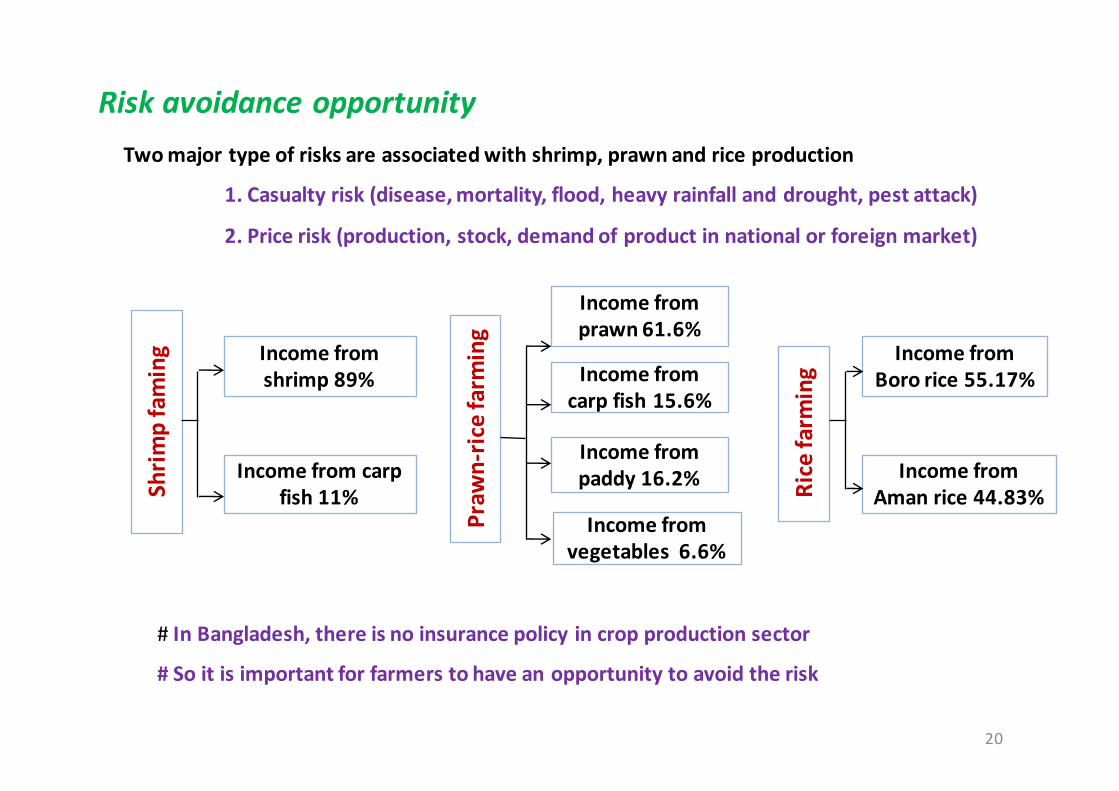
RiskavoidanceopportunityTwomajortypeofrisksareassociatedwithshrimp,prawnandriceproduction
1.Casualtyrisk(disease,mortality,flood,heavyrainfallanddrought,pestattack)
2.Pricerisk(production,stock,demandofproductinnationalorforeignmarket)
Shrim
pfaming Incomefrom
shrimp89%
Incomefromcarpfish11%
Praw
n-ric
efarm
ing
Incomefromcarpfish15.6%
Incomefromprawn61.6%
Incomefrompaddy16.2%
Incomefromvegetables6.6%
Ricefarm
ing
IncomefromBoro rice55.17%
IncomefromAmanrice44.83%
#InBangladesh,thereisnoinsurancepolicyincropproductionsector
#Soitisimportantforfarmerstohaveanopportunitytoavoidtherisk
20
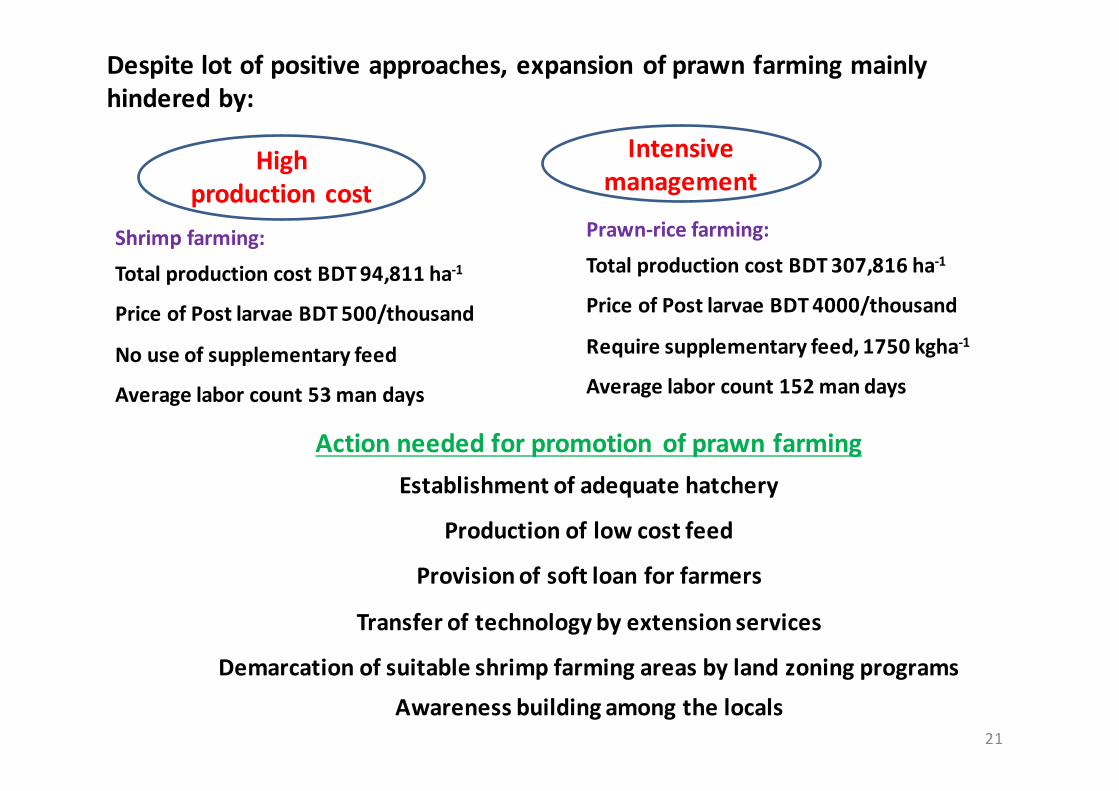
Despitelotofpositiveapproaches,expansionofprawnfarmingmainlyhinderedby:
Highproductioncost
Shrimpfarming:
TotalproductioncostBDT94,811ha-1
PriceofPostlarvaeBDT500/thousand
Nouseofsupplementaryfeed
Averagelaborcount53mandays
Prawn-ricefarming:
TotalproductioncostBDT307,816ha-1
PriceofPostlarvaeBDT4000/thousand
Requiresupplementaryfeed,1750kgha-1
Averagelaborcount152mandays
Actionneededforpromotion ofprawnfarmingEstablishmentofadequatehatchery
Productionoflowcostfeed
Provisionofsoftloanforfarmers
Transferoftechnologybyextensionservices
DemarcationofsuitableshrimpfarmingareasbylandzoningprogramsAwarenessbuildingamongthelocals
Intensivemanagement
21
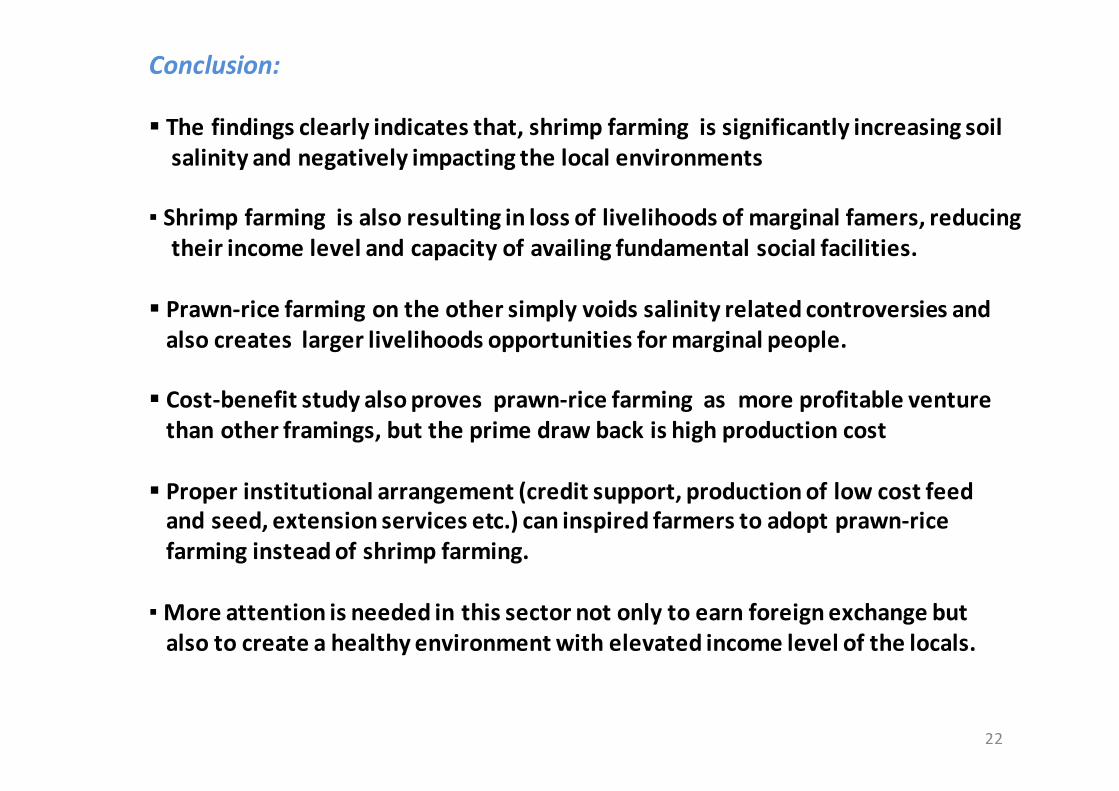
Conclusion:
§ The findings clearly indicates that, shrimp farming is significantly increasing soilsalinity and negatively impacting the local environments
▪ Shrimp farming is also resulting in loss of livelihoods of marginal famers, reducingtheir income level and capacity of availing fundamental social facilities.
§ Prawn-rice farming on the other simply voids salinity related controversies andalso creates larger livelihoods opportunities formarginal people.
§ Cost-benefit study alsoproves prawn-rice farming as more profitable venturethan other framings, but the prime draw back is high production cost
§ Proper institutional arrangement (credit support, productionof low cost feedand seed, extension services etc.) can inspired farmers to adopt prawn-ricefarming insteadof shrimp farming.
▪ More attention is needed in this sector not only to earn foreign exchange butalso to create a healthy environment with elevated income level of the locals.
22

ThankYou
23