Embed Size (px)
Citation preview
1 1/29/2007
IMPACT ANALYSIS of Basic SOFA with SNCR ALTERNATIVE for LELAND OLDS UNIT 1
This document is being provided in response to the North Dakota Department of Health’s request
issued in a December 1, 2006 letter to Basin Electric Power Cooperative regarding the NDDH’s
comments from their review of the final draft report of the BEPC LOS BART
DETERMINATION STUDY for LELAND OLDS STATION UNIT 1 and 2 (August 2006).
This is intended to be in addition to the following sections:
2.4.2 Energy Impacts of NOX Control Alternatives – LOS Unit 1;
2.4.3 Non Air Quality and Other Environmental Impacts of NOX Control Alternatives – LOS
Unit 1;
2.4.4 Visibility Impairment Impacts of Leland Olds Station NOX Controls – Unit 1;
2.4.5 Summary of Impacts of LOS NOX Controls – Unit 1;
CORRECTIONS:
Included in this document are replacements to the following sections of the August 2006 BEPC
BART Determination Study report:
2.4.1.2 Operating and Maintenance Cost Estimates for NOX Controls – LOS Unit 1;
2.4.1.3 Cost Effectiveness for NOX Controls – LOS Unit 1;
The following describes corrections to Section 2.4.1.2 O&M costs, and Section 2.4.1.3 Cost
Effectiveness, for those LOS Unit 1 alternatives that involve a chemical reagent injected for NOx
control. These corrections are included in front of the updated impacts evaluation added for the
basic SOFA with SNCR NOX Control alternative for LOS Unit 1.
Additional coal consumption for those alternatives that involve a chemical reagent injected for
NOx control to compensate for the heat of vaporization of the reagent dilution water should be
included in the O&M costs; this follows EPA OAQPS convention. For the purposes of this
study, this additional coal consumption has been included in the annual O&M costs provided in
the August 2006 final draft of the BEPC LOS BART Report. For example, the cost of this extra
coal consumption was incorrectly calculated as $10 per year for LOS Unit 1’s basic SOFA +
SNCR alternative for both the historic and PTE cases in the August 2006 final draft of the BEPC
LOS BART Report, assuming $0.91/mmBtu. It should have been 53,645 mmBtu/yr x
$0.91/mmBtu = $48,600/yr annual O&M cost for LOS Unit 1’s basic SOFA + SNCR alternative.
2 1/29/2007
Similarly, included in this document are replacements to the following sections of the August
2006 BEPC BART Determination Study report:
2.5.1.2 Operating and Maintenance Cost Estimates for NOX Controls – LOS Unit 2;
2.5.1.3 Cost Effectiveness for NOX Controls – LOS Unit 2;
The following describes corrections to Section 2.5.1.2 O&M costs, and Section 2.5.1.3 Cost
Effectiveness, for those LOS Unit 2 alternatives that involve a chemical reagent injected for NOX
control. These corrections are also included at the back of this updated impacts evaluation.
The cost of this extra coal consumption for those alternatives that involve a chemical reagent
injected for NOx control to compensate for the heat of vaporization of the reagent dilution water
was incorrectly calculated as $20 per year for LOS Unit 2’s SNCR + ASOFA alternative and $40
per year for RRI+SNCR with ASOFA alternative for both the historic and PTE cases in the
August 2006 final draft of the BEPC LOS BART Report, assuming $0.91/mmBtu. It should have
been 204,807 mmBtu/yr x $0.91/mmBtu = $185,400/yr annual O&M cost for LOS Unit 2’s
SNCR + ASOFA alternative, and 389,490 mmBtu/yr x $0.91/mmBtu = $352,700/yr annual O&M
cost for LOS Unit 2’s RRI+SNCR with ASOFA alternative.
64 1/29/2007
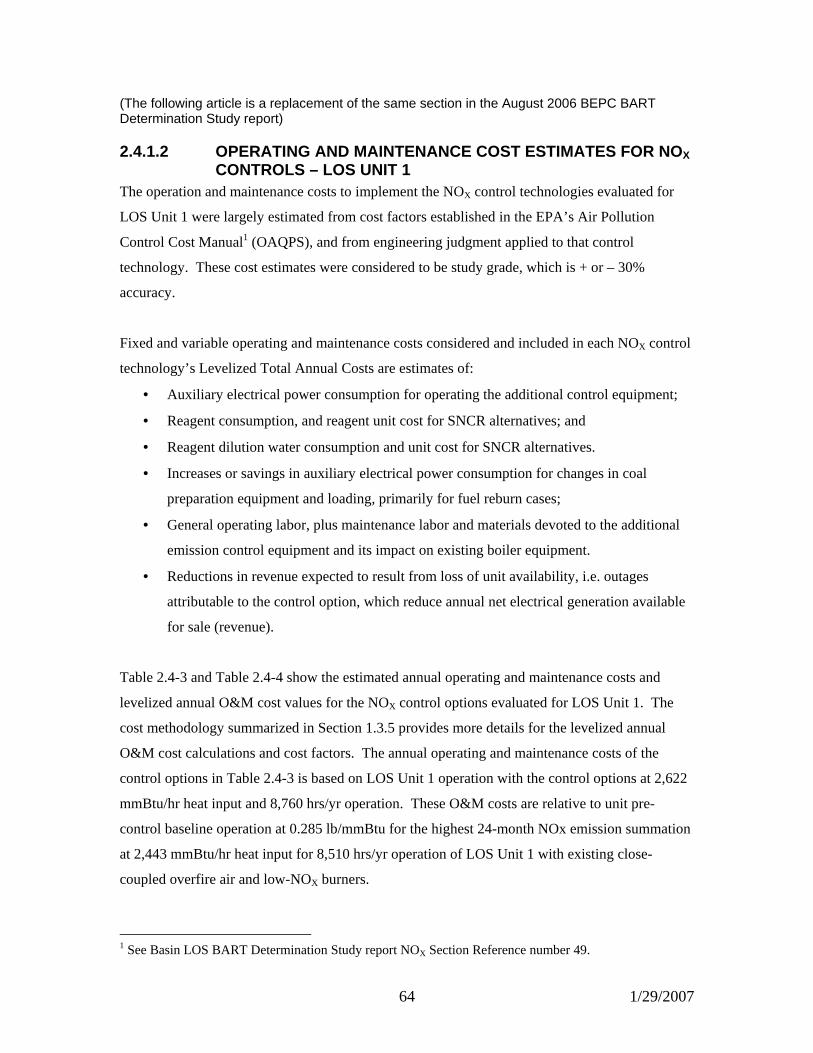
(The following article is a replacement of the same section in the August 2006 BEPC BART Determination Study report)
2.4.1.2 OPERATING AND MAINTENANCE COST ESTIMATES FO R NOX CONTROLS – LOS UNIT 1
The operation and maintenance costs to implement the NOX control technologies evaluated for
LOS Unit 1 were largely estimated from cost factors established in the EPA’s Air Pollution
Control Cost Manual1 (OAQPS), and from engineering judgment applied to that control
technology. These cost estimates were considered to be study grade, which is + or – 30%
accuracy.
Fixed and variable operating and maintenance costs considered and included in each NOX control
technology’s Levelized Total Annual Costs are estimates of:
• Auxiliary electrical power consumption for operating the additional control equipment;
• Reagent consumption, and reagent unit cost for SNCR alternatives; and
• Reagent dilution water consumption and unit cost for SNCR alternatives.
• Increases or savings in auxiliary electrical power consumption for changes in coal
preparation equipment and loading, primarily for fuel reburn cases;
• General operating labor, plus maintenance labor and materials devoted to the additional
emission control equipment and its impact on existing boiler equipment.
• Reductions in revenue expected to result from loss of unit availability, i.e. outages
attributable to the control option, which reduce annual net electrical generation available
for sale (revenue).
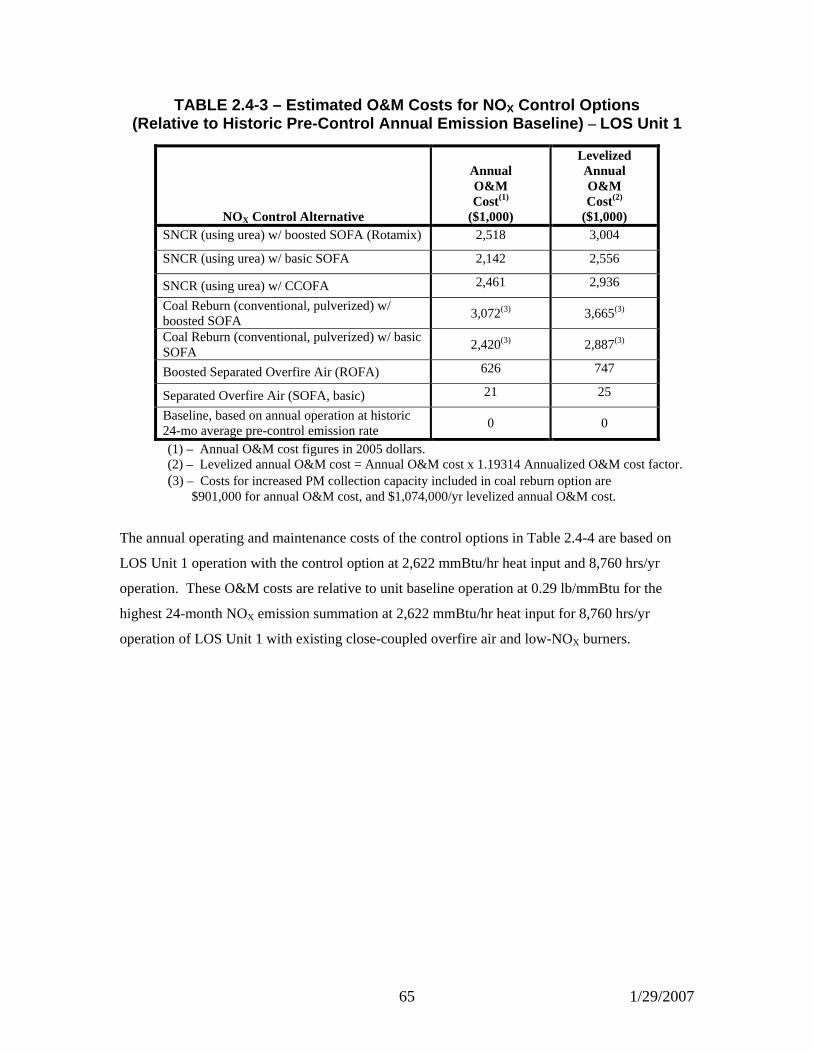
Table 2.4-3 and Table 2.4-4 show the estimated annual operating and maintenance costs and
levelized annual O&M cost values for the NOX control options evaluated for LOS Unit 1. The
cost methodology summarized in Section 1.3.5 provides more details for the levelized annual
O&M cost calculations and cost factors. The annual operating and maintenance costs of the
control options in Table 2.4-3 is based on LOS Unit 1 operation with the control options at 2,622
mmBtu/hr heat input and 8,760 hrs/yr operation. These O&M costs are relative to unit pre-
control baseline operation at 0.285 lb/mmBtu for the highest 24-month NOx emission summation
at 2,443 mmBtu/hr heat input for 8,510 hrs/yr operation of LOS Unit 1 with existing close-
coupled overfire air and low-NOX burners.
1 See Basin LOS BART Determination Study report NOX Section Reference number 49.
65 1/29/2007
TABLE 2.4-3 – Estimated O&M Costs for NO X Control Options (Relative to Historic Pre-Control Annual Emission B aseline) – LOS Unit 1
NOX Control Alternative
Annual O&M Cost(1)
($1,000)
Levelized Annual O&M Cost(2)
($1,000) SNCR (using urea) w/ boosted SOFA (Rotamix) 2,518 3,004
SNCR (using urea) w/ basic SOFA 2,142 2,556
SNCR (using urea) w/ CCOFA 2,461 2,936
Coal Reburn (conventional, pulverized) w/ boosted SOFA
3,072(3) 3,665(3)
Coal Reburn (conventional, pulverized) w/ basic SOFA
2,420(3) 2,887(3)
Boosted Separated Overfire Air (ROFA) 626 747
Separated Overfire Air (SOFA, basic) 21 25
Baseline, based on annual operation at historic 24-mo average pre-control emission rate
0 0
(1) – Annual O&M cost figures in 2005 dollars. (2) – Levelized annual O&M cost = Annual O&M cost x 1.19314 Annualized O&M cost factor. (3) – Costs for increased PM collection capacity included in coal reburn option are
$901,000 for annual O&M cost, and $1,074,000/yr levelized annual O&M cost.
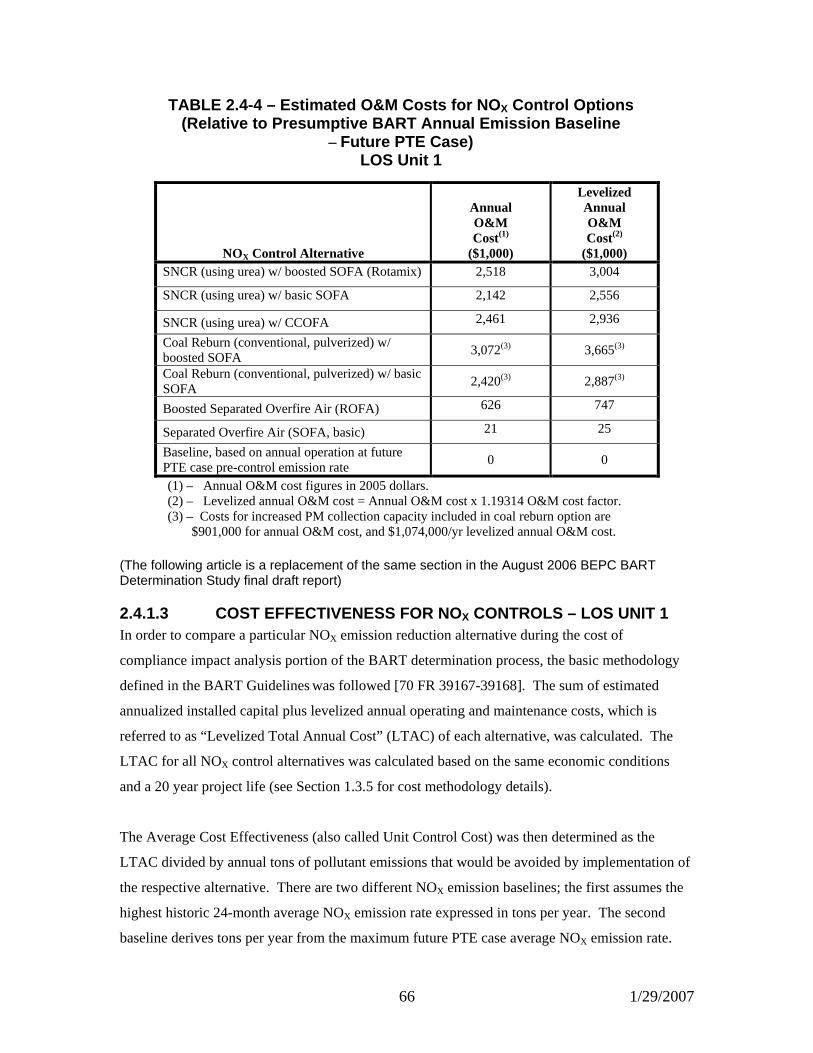
The annual operating and maintenance costs of the control options in Table 2.4-4 are based on
LOS Unit 1 operation with the control option at 2,622 mmBtu/hr heat input and 8,760 hrs/yr
operation. These O&M costs are relative to unit baseline operation at 0.29 lb/mmBtu for the
highest 24-month NOX emission summation at 2,622 mmBtu/hr heat input for 8,760 hrs/yr
operation of LOS Unit 1 with existing close-coupled overfire air and low-NOX burners.
66 1/29/2007
TABLE 2.4-4 – Estimated O&M Costs for NO X Control Options (Relative to Presumptive BART Annual Emission Basel ine
– Future PTE Case) LOS Unit 1
NOX Control Alternative
Annual O&M Cost(1)
($1,000)
Levelized Annual O&M Cost(2)
($1,000) SNCR (using urea) w/ boosted SOFA (Rotamix) 2,518 3,004
SNCR (using urea) w/ basic SOFA 2,142 2,556
SNCR (using urea) w/ CCOFA 2,461 2,936
Coal Reburn (conventional, pulverized) w/ boosted SOFA
3,072(3) 3,665(3)
Coal Reburn (conventional, pulverized) w/ basic SOFA
2,420(3) 2,887(3)
Boosted Separated Overfire Air (ROFA) 626 747
Separated Overfire Air (SOFA, basic) 21 25
Baseline, based on annual operation at future PTE case pre-control emission rate
0 0
(1) – Annual O&M cost figures in 2005 dollars. (2) – Levelized annual O&M cost = Annual O&M cost x 1.19314 O&M cost factor. (3) – Costs for increased PM collection capacity included in coal reburn option are
$901,000 for annual O&M cost, and $1,074,000/yr levelized annual O&M cost. (The following article is a replacement of the same section in the August 2006 BEPC BART Determination Study final draft report)
2.4.1.3 COST EFFECTIVENESS FOR NOX CONTROLS – LOS UNIT 1 In order to compare a particular NOX emission reduction alternative during the cost of
compliance impact analysis portion of the BART determination process, the basic methodology
defined in the BART Guidelines was followed [70 FR 39167-39168]. The sum of estimated
annualized installed capital plus levelized annual operating and maintenance costs, which is
referred to as “Levelized Total Annual Cost” (LTAC) of each alternative, was calculated. The
LTAC for all NOX control alternatives was calculated based on the same economic conditions
and a 20 year project life (see Section 1.3.5 for cost methodology details).
The Average Cost Effectiveness (also called Unit Control Cost) was then determined as the
LTAC divided by annual tons of pollutant emissions that would be avoided by implementation of
the respective alternative. There are two different NOX emission baselines; the first assumes the
highest historic 24-month average NOX emission rate expressed in tons per year. The second
baseline derives tons per year from the maximum future PTE case average NOX emission rate.
67 1/29/2007
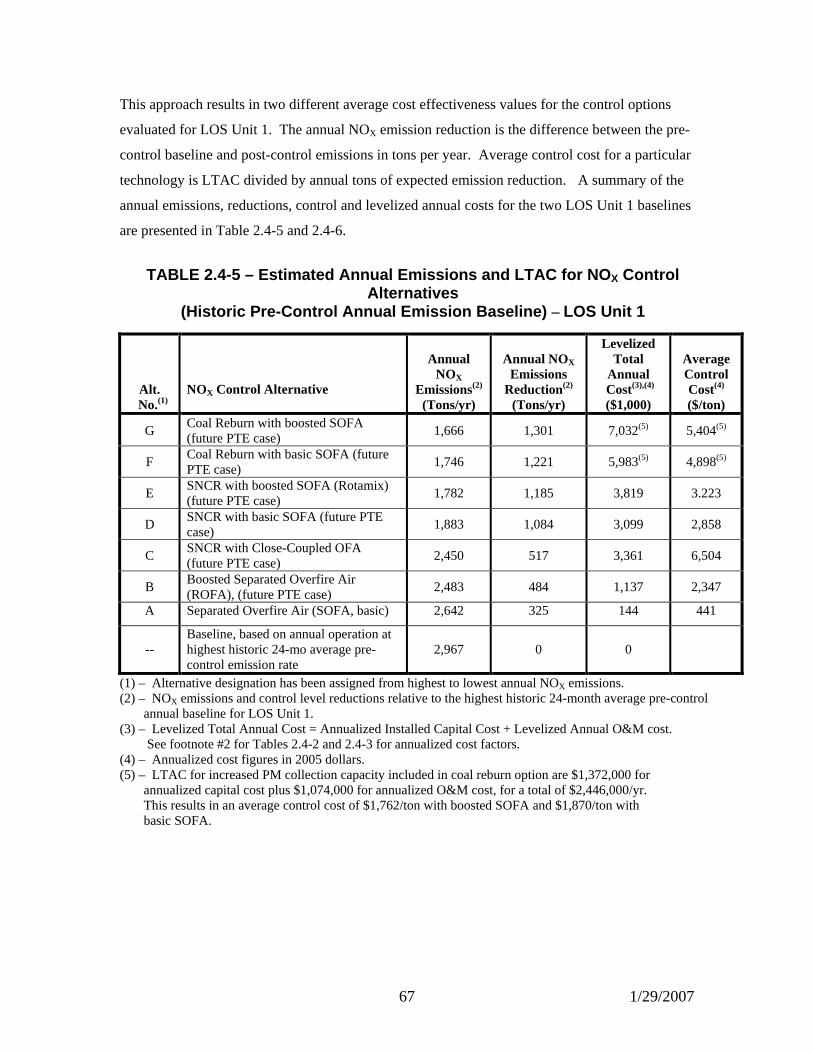
This approach results in two different average cost effectiveness values for the control options
evaluated for LOS Unit 1. The annual NOX emission reduction is the difference between the pre-
control baseline and post-control emissions in tons per year. Average control cost for a particular
technology is LTAC divided by annual tons of expected emission reduction. A summary of the
annual emissions, reductions, control and levelized annual costs for the two LOS Unit 1 baselines
are presented in Table 2.4-5 and 2.4-6.
TABLE 2.4-5 – Estimated Annual Emissions and LTAC f or NOX Control
Alternatives (Historic Pre-Control Annual Emission Baseline) – LOS Unit 1
Alt. No.(1)
NOX Control Alternative
Annual NOX
Emissions(2)
(Tons/yr)
Annual NOX Emissions
Reduction(2)
(Tons/yr)
Levelized Total
Annual Cost(3),(4)
($1,000)
Average Control Cost(4)
($/ton)
G Coal Reburn with boosted SOFA (future PTE case)
1,666 1,301 7,032(5) 5,404(5)
F Coal Reburn with basic SOFA (future PTE case)
1,746 1,221 5,983(5) 4,898(5)
E SNCR with boosted SOFA (Rotamix) (future PTE case)
1,782 1,185 3,819 3.223
D SNCR with basic SOFA (future PTE case)
1,883 1,084 3,099 2,858
C SNCR with Close-Coupled OFA (future PTE case)
2,450 517 3,361 6,504
B Boosted Separated Overfire Air (ROFA), (future PTE case)
2,483 484 1,137 2,347
A Separated Overfire Air (SOFA, basic) 2,642 325 144 441
--
Baseline, based on annual operation at highest historic 24-mo average pre-control emission rate
2,967
0
0
(1) – Alternative designation has been assigned from highest to lowest annual NOX emissions. (2) – NOX emissions and control level reductions relative to the highest historic 24-month average pre-control
annual baseline for LOS Unit 1. (3) – Levelized Total Annual Cost = Annualized Installed Capital Cost + Levelized Annual O&M cost.
See footnote #2 for Tables 2.4-2 and 2.4-3 for annualized cost factors. (4) – Annualized cost figures in 2005 dollars. (5) – LTAC for increased PM collection capacity included in coal reburn option are $1,372,000 for
annualized capital cost plus $1,074,000 for annualized O&M cost, for a total of $2,446,000/yr. This results in an average control cost of $1,762/ton with boosted SOFA and $1,870/ton with basic SOFA.
68 1/29/2007
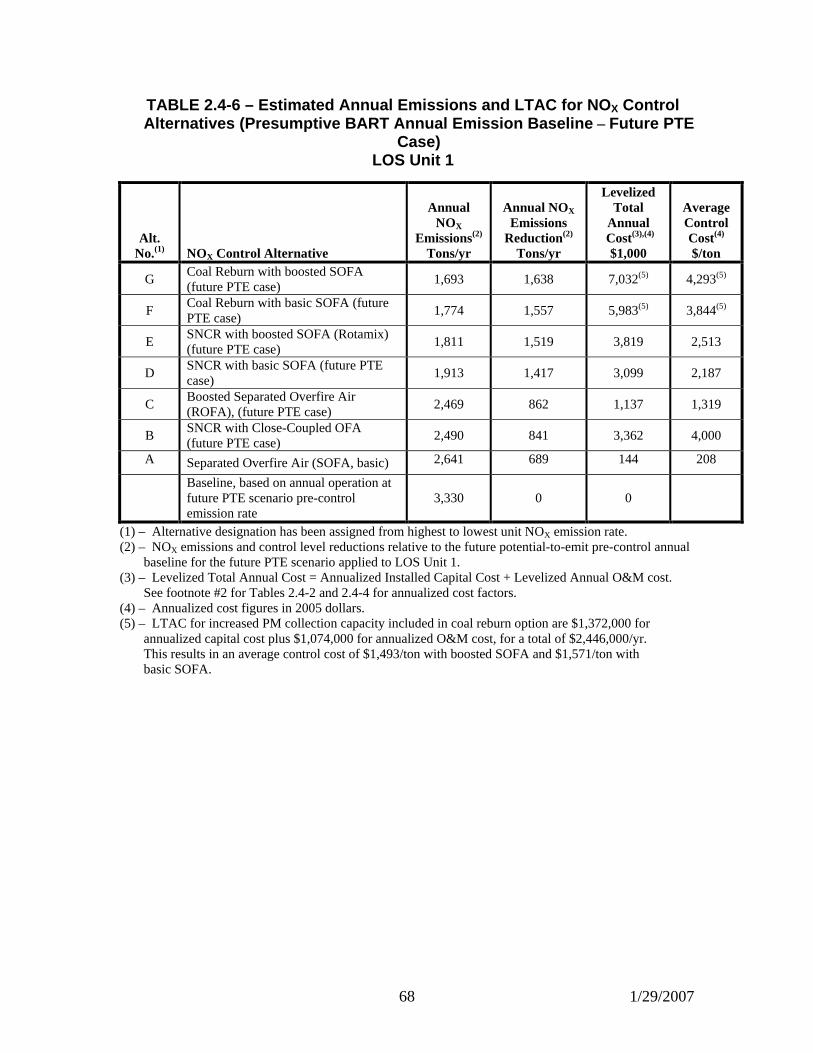
TABLE 2.4-6 – Estimated Annual Emissions and LTAC f or NOX Control Alternatives (Presumptive BART Annual Emission Base line – Future PTE
Case) LOS Unit 1
Alt. No.(1)
NOX Control Alternative
Annual NOX
Emissions(2)
Tons/yr
Annual NOX Emissions
Reduction(2)
Tons/yr
Levelized Total
Annual Cost(3),(4)
$1,000
Average Control Cost(4)
$/ton
G Coal Reburn with boosted SOFA (future PTE case)
1,693 1,638 7,032(5) 4,293(5)
F Coal Reburn with basic SOFA (future PTE case)
1,774 1,557 5,983(5) 3,844(5)
E SNCR with boosted SOFA (Rotamix) (future PTE case)
1,811 1,519 3,819 2,513
D SNCR with basic SOFA (future PTE case)
1,913 1,417 3,099 2,187
C Boosted Separated Overfire Air (ROFA), (future PTE case)
2,469 862 1,137 1,319
B SNCR with Close-Coupled OFA (future PTE case)
2,490 841 3,362 4,000
A Separated Overfire Air (SOFA, basic) 2,641 689 144 208
Baseline, based on annual operation at future PTE scenario pre-control emission rate
3,330
0
0
(1) – Alternative designation has been assigned from highest to lowest unit NOX emission rate. (2) – NOX emissions and control level reductions relative to the future potential-to-emit pre-control annual
baseline for the future PTE scenario applied to LOS Unit 1. (3) – Levelized Total Annual Cost = Annualized Installed Capital Cost + Levelized Annual O&M cost.
See footnote #2 for Tables 2.4-2 and 2.4-4 for annualized cost factors. (4) – Annualized cost figures in 2005 dollars. (5) – LTAC for increased PM collection capacity included in coal reburn option are $1,372,000 for
annualized capital cost plus $1,074,000 for annualized O&M cost, for a total of $2,446,000/yr. This results in an average control cost of $1,493/ton with boosted SOFA and $1,571/ton with basic SOFA.
69 1/29/2007
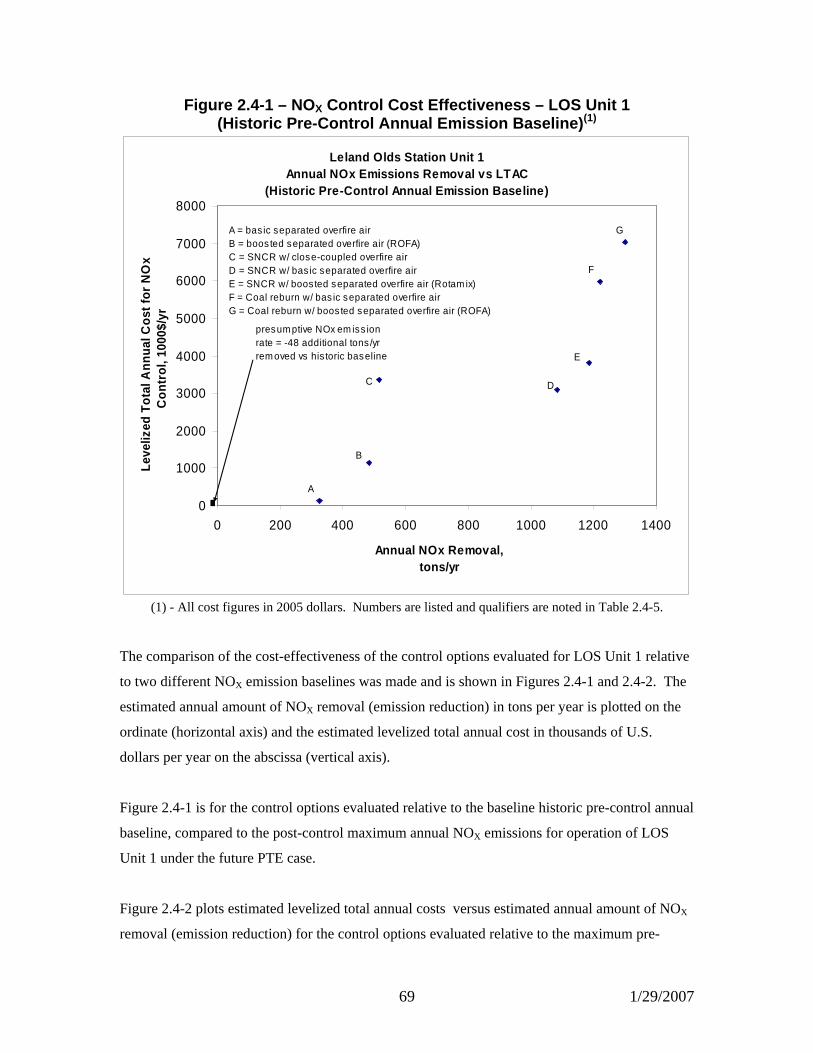
Figure 2.4-1 – NO X Control Cost Effectiveness – LOS Unit 1 (Historic Pre-Control Annual Emission Baseline) (1)
Leland Olds Station Unit 1 Annual NOx Emissions Removal vs LTAC
(Historic Pre-Control Annual Emission Baseline)
0
1000
2000
3000
4000
5000
6000
7000
8000
0 200 400 600 800 1000 1200 1400
Annual NOx Removal, tons/yr
Leve
lized
Tot
al A
nnua
l Cos
t for
NO
x C
ontr
ol, 1
000$
/yr
A = bas ic separated overfire airB = boos ted separated overfire air (ROFA)C = SNCR w/ close-coupled overfire airD = SNCR w/ bas ic separated overfire airE = SNCR w/ boosted separated overfire air (Rotam ix)F = Coal reburn w/ bas ic separated overfire airG = Coal reburn w/ boos ted separated overfire air (ROFA)
A
B
C D
E
F
G
presumptive NOx em iss ion rate = -48 additional tons /yr removed vs his toric baseline
■
(1) - All cost figures in 2005 dollars. Numbers are listed and qualifiers are noted in Table 2.4-5.
The comparison of the cost-effectiveness of the control options evaluated for LOS Unit 1 relative
to two different NOX emission baselines was made and is shown in Figures 2.4-1 and 2.4-2. The
estimated annual amount of NOX removal (emission reduction) in tons per year is plotted on the
ordinate (horizontal axis) and the estimated levelized total annual cost in thousands of U.S.
dollars per year on the abscissa (vertical axis).
Figure 2.4-1 is for the control options evaluated relative to the baseline historic pre-control annual
baseline, compared to the post-control maximum annual NOX emissions for operation of LOS
Unit 1 under the future PTE case.
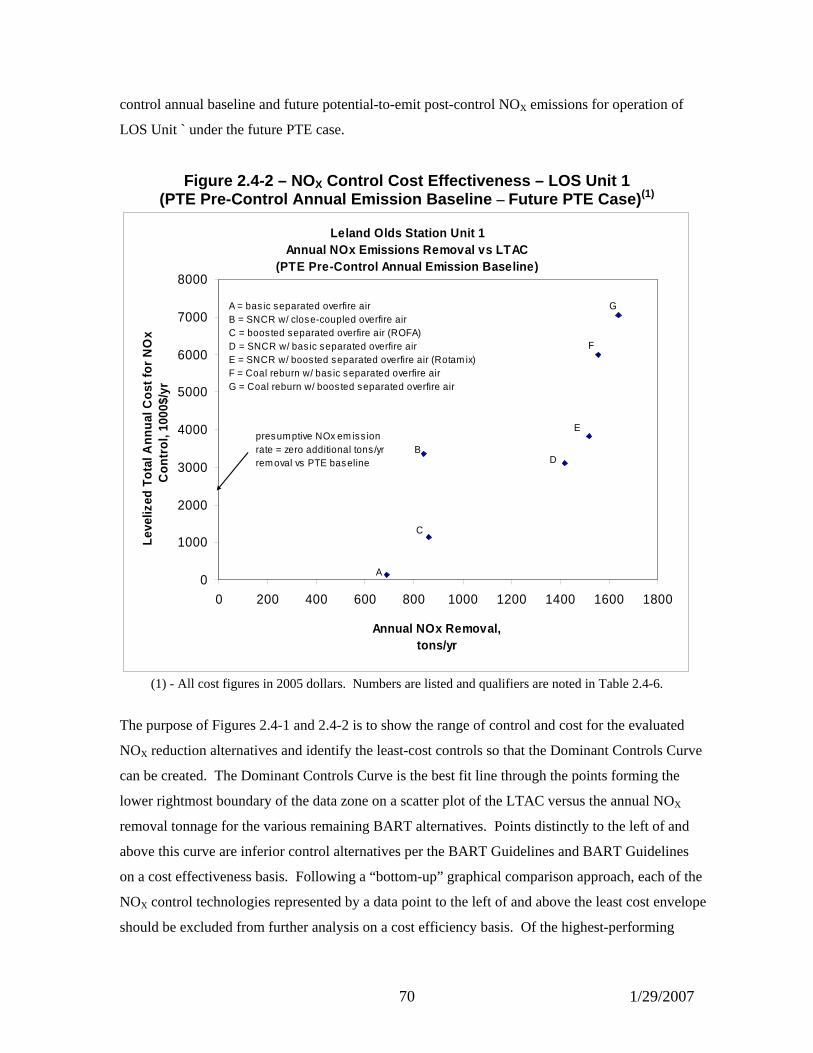
Figure 2.4-2 plots estimated levelized total annual costs versus estimated annual amount of NOX
removal (emission reduction) for the control options evaluated relative to the maximum pre-
70 1/29/2007
control annual baseline and future potential-to-emit post-control NOX emissions for operation of
LOS Unit ` under the future PTE case.
Figure 2.4-2 – NO X Control Cost Effectiveness – LOS Unit 1 (PTE Pre-Control Annual Emission Baseline – Future PTE Case) (1)
Leland Olds Station Unit 1 Annual NOx Emissions Removal vs LTAC
(PTE Pre-Control Annual Emission Baseline)
0
1000
2000
3000
4000
5000
6000
7000
8000
0 200 400 600 800 1000 1200 1400 1600 1800
Annual NOx Removal, tons/yr
Leve
lized
Tot
al A
nnua
l Cos
t for
NO
x C
ontr
ol, 1
000$
/yr
A = bas ic separated overfire airB = SNCR w/ close-coupled overfire air C = boosted separated overfire air (ROFA)D = SNCR w/ bas ic separated overfire airE = SNCR w/ boosted separated overfire air (Rotam ix)F = Coal reburn w/ bas ic separated overfire airG = Coal reburn w/ boos ted separated overfire air
A
B
C
D
E
F
G
presumptive NOx em iss ion rate = zero additional tons /yr removal vs PTE baseline
(1) - All cost figures in 2005 dollars. Numbers are listed and qualifiers are noted in Table 2.4-6.
The purpose of Figures 2.4-1 and 2.4-2 is to show the range of control and cost for the evaluated
NOX reduction alternatives and identify the least-cost controls so that the Dominant Controls Curve
can be created. The Dominant Controls Curve is the best fit line through the points forming the
lower rightmost boundary of the data zone on a scatter plot of the LTAC versus the annual NOX
removal tonnage for the various remaining BART alternatives. Points distinctly to the left of and
above this curve are inferior control alternatives per the BART Guidelines and BART Guidelines
on a cost effectiveness basis. Following a “bottom-up” graphical comparison approach, each of the
NOX control technologies represented by a data point to the left of and above the least cost envelope
should be excluded from further analysis on a cost efficiency basis. Of the highest-performing
71 1/29/2007
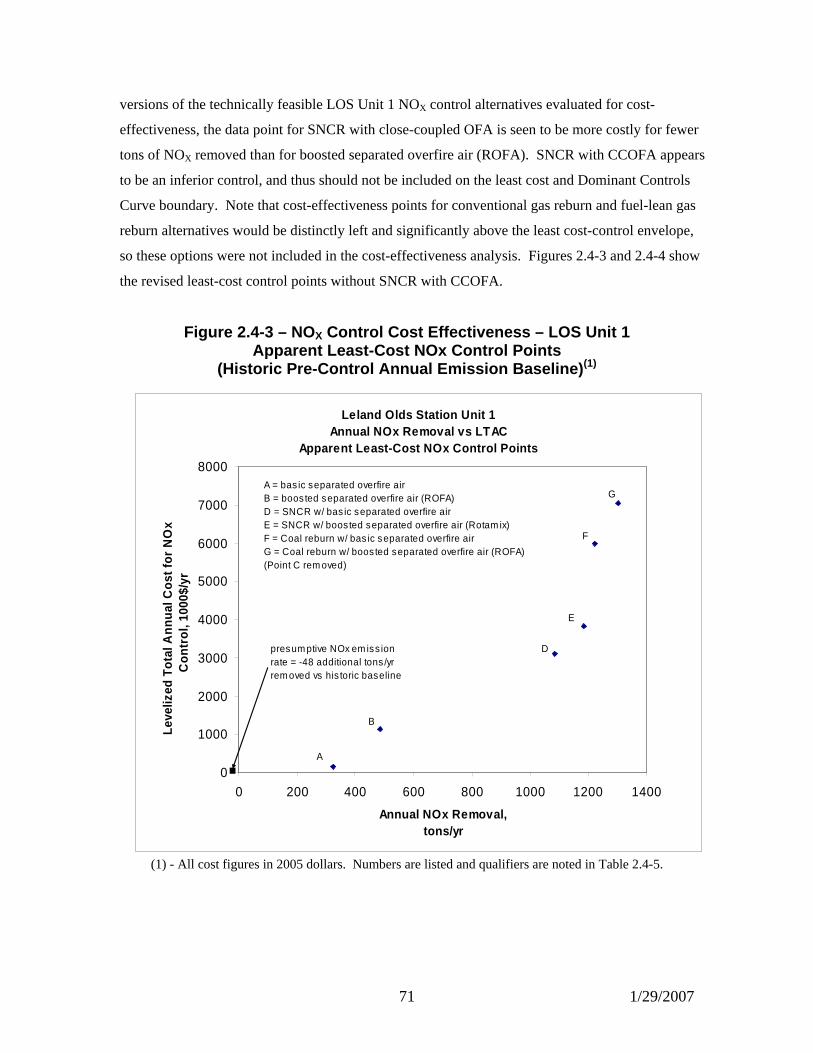
versions of the technically feasible LOS Unit 1 NOX control alternatives evaluated for cost-
effectiveness, the data point for SNCR with close-coupled OFA is seen to be more costly for fewer
tons of NOX removed than for boosted separated overfire air (ROFA). SNCR with CCOFA appears
to be an inferior control, and thus should not be included on the least cost and Dominant Controls
Curve boundary. Note that cost-effectiveness points for conventional gas reburn and fuel-lean gas
reburn alternatives would be distinctly left and significantly above the least cost-control envelope,
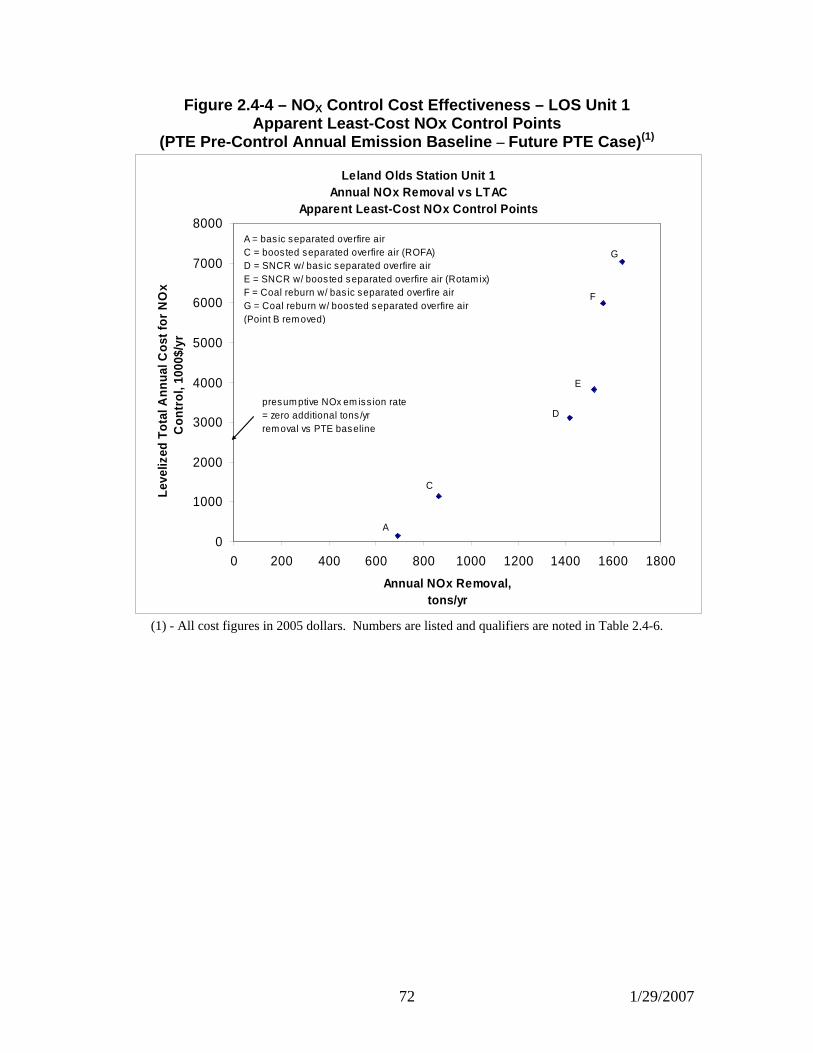
so these options were not included in the cost-effectiveness analysis. Figures 2.4-3 and 2.4-4 show
the revised least-cost control points without SNCR with CCOFA.
Figure 2.4-3 – NO X Control Cost Effectiveness – LOS Unit 1 Apparent Least-Cost NOx Control Points
(Historic Pre-Control Annual Emission Baseline) (1)
Leland Olds Station Unit 1Annual NOx Removal vs LTAC
Apparent Least-Cost NOx Control Points
0
1000
2000
3000
4000
5000
6000
7000
8000
0 200 400 600 800 1000 1200 1400
Annual NOx Removal, tons/yr
Leve
lized
Tot
al A
nnua
l Cos
t for
NO
x C
ontr
ol, 1
000$
/yr
A
D
E
F
G
B
A = bas ic separated overfire airB = boos ted separated overfire air (ROFA)D = SNCR w/ bas ic separated overfire airE = SNCR w/ boos ted separated overfire air (Rotam ix)F = Coal reburn w/ bas ic separated overfire airG = Coal reburn w/ boos ted separated overfire air (ROFA)(Point C rem oved)
presum ptive NOx em iss ion rate = -48 additional tons /yr rem oved vs his toric baseline
■
(1) - All cost figures in 2005 dollars. Numbers are listed and qualifiers are noted in Table 2.4-5.
72 1/29/2007
Figure 2.4-4 – NO X Control Cost Effectiveness – LOS Unit 1 Apparent Least-Cost NOx Control Points
(PTE Pre-Control Annual Emission Baseline – Future PTE Case) (1)
Leland Olds Station Unit 1Annual NOx Removal vs LTAC
Apparent Least-Cost NOx Control Points
0
1000
2000
3000
4000
5000
6000
7000
8000
0 200 400 600 800 1000 1200 1400 1600 1800
Annual NOx Removal, tons/yr
Leve
lized
Tot
al A
nnua
l Cos
t for
NO
x C
ontr
ol, 1
000$
/yr
A
C
D
E
F
G
A = bas ic separated overfire airC = boos ted separated overfire air (ROFA)D = SNCR w/ bas ic separated overfire airE = SNCR w/ boos ted separated overfire air (Rotam ix)F = Coal reburn w/ bas ic separated overfire airG = Coal reburn w/ boos ted separated overfire air(Point B rem oved)
presum ptive NOx em iss ion rate = zero additional tons /yr rem oval vs PTE baseline
(1) - All cost figures in 2005 dollars. Numbers are listed and qualifiers are noted in Table 2.4-6.
73 1/29/2007
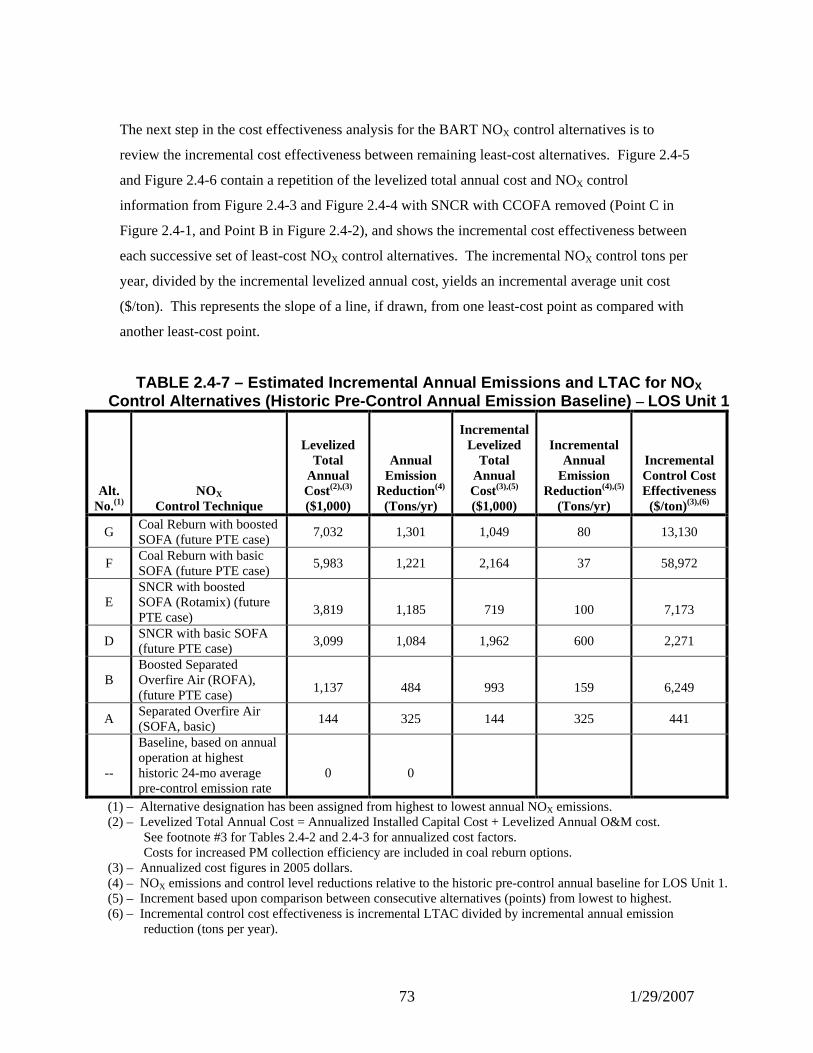
The next step in the cost effectiveness analysis for the BART NOX control alternatives is to
review the incremental cost effectiveness between remaining least-cost alternatives. Figure 2.4-5
and Figure 2.4-6 contain a repetition of the levelized total annual cost and NOX control
information from Figure 2.4-3 and Figure 2.4-4 with SNCR with CCOFA removed (Point C in
Figure 2.4-1, and Point B in Figure 2.4-2), and shows the incremental cost effectiveness between
each successive set of least-cost NOX control alternatives. The incremental NOX control tons per
year, divided by the incremental levelized annual cost, yields an incremental average unit cost
($/ton). This represents the slope of a line, if drawn, from one least-cost point as compared with
another least-cost point.
TABLE 2.4-7 – Estimated Incremental Annual Emission s and LTAC for NO X Control Alternatives (Historic Pre-Control Annual E mission Baseline) – LOS Unit 1
Alt. No.(1)
NOX Control Technique
Levelized Total
Annual Cost(2),(3)
($1,000)
Annual Emission
Reduction(4)
(Tons/yr)
Incremental Levelized
Total Annual Cost(3),(5) ($1,000)
Incremental
Annual Emission
Reduction(4),(5)
(Tons/yr)
Incremental Control Cost Effectiveness ($/ton)(3),(6)
G Coal Reburn with boosted SOFA (future PTE case)
7,032 1,301 1,049 80 13,130
F Coal Reburn with basic SOFA (future PTE case)
5,983 1,221 2,164 37 58,972
E SNCR with boosted SOFA (Rotamix) (future PTE case)
3,819 1,185 719 100 7,173
D SNCR with basic SOFA (future PTE case)
3,099 1,084 1,962 600 2,271
B Boosted Separated Overfire Air (ROFA), (future PTE case)
1,137 484 993 159 6,249
A Separated Overfire Air (SOFA, basic)
144 325 144 325 441
--
Baseline, based on annual operation at highest historic 24-mo average pre-control emission rate
0
0
(1) – Alternative designation has been assigned from highest to lowest annual NOX emissions. (2) – Levelized Total Annual Cost = Annualized Installed Capital Cost + Levelized Annual O&M cost.
See footnote #3 for Tables 2.4-2 and 2.4-3 for annualized cost factors. Costs for increased PM collection efficiency are included in coal reburn options.
(3) – Annualized cost figures in 2005 dollars. (4) – NOX emissions and control level reductions relative to the historic pre-control annual baseline for LOS Unit 1. (5) – Increment based upon comparison between consecutive alternatives (points) from lowest to highest. (6) – Incremental control cost effectiveness is incremental LTAC divided by incremental annual emission
reduction (tons per year).
74 1/29/2007
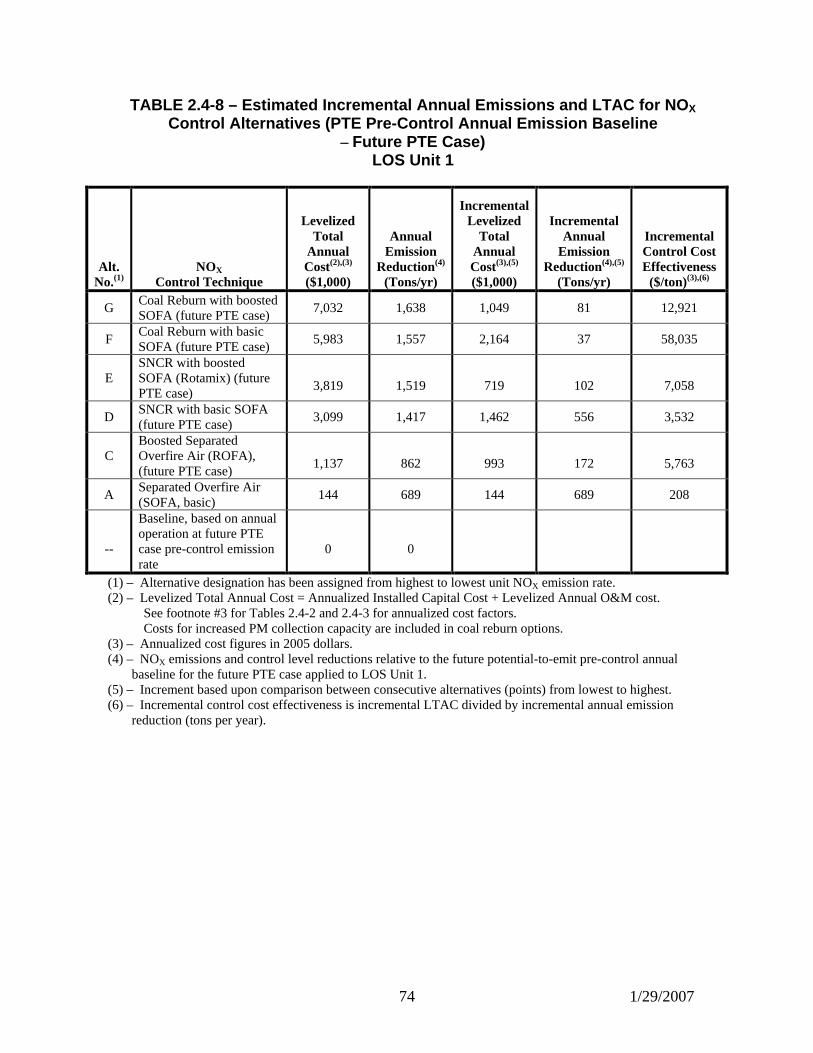
TABLE 2.4-8 – Estimated Incremental Annual Emission s and LTAC for NO X Control Alternatives (PTE Pre-Control Annual Emissi on Baseline
– Future PTE Case) LOS Unit 1
Alt. No.(1)
NOX Control Technique
Levelized Total
Annual Cost(2),(3)
($1,000)
Annual Emission
Reduction(4)
(Tons/yr)
Incremental Levelized
Total Annual Cost(3),(5) ($1,000)
Incremental
Annual Emission
Reduction(4),(5)
(Tons/yr)
Incremental Control Cost Effectiveness ($/ton)(3),(6)
G Coal Reburn with boosted SOFA (future PTE case)
7,032 1,638 1,049 81 12,921
F Coal Reburn with basic SOFA (future PTE case)
5,983 1,557 2,164 37 58,035
E SNCR with boosted SOFA (Rotamix) (future PTE case)
3,819 1,519 719 102 7,058
D SNCR with basic SOFA (future PTE case)
3,099 1,417 1,462 556 3,532
C Boosted Separated Overfire Air (ROFA), (future PTE case)
1,137 862 993 172 5,763
A Separated Overfire Air (SOFA, basic)
144 689 144 689 208
--
Baseline, based on annual operation at future PTE case pre-control emission rate
0
0
(1) – Alternative designation has been assigned from highest to lowest unit NOX emission rate. (2) – Levelized Total Annual Cost = Annualized Installed Capital Cost + Levelized Annual O&M cost.
See footnote #3 for Tables 2.4-2 and 2.4-3 for annualized cost factors. Costs for increased PM collection capacity are included in coal reburn options.
(3) – Annualized cost figures in 2005 dollars. (4) – NOX emissions and control level reductions relative to the future potential-to-emit pre-control annual
baseline for the future PTE case applied to LOS Unit 1. (5) – Increment based upon comparison between consecutive alternatives (points) from lowest to highest. (6) – Incremental control cost effectiveness is incremental LTAC divided by incremental annual emission
reduction (tons per year).
75 1/29/2007
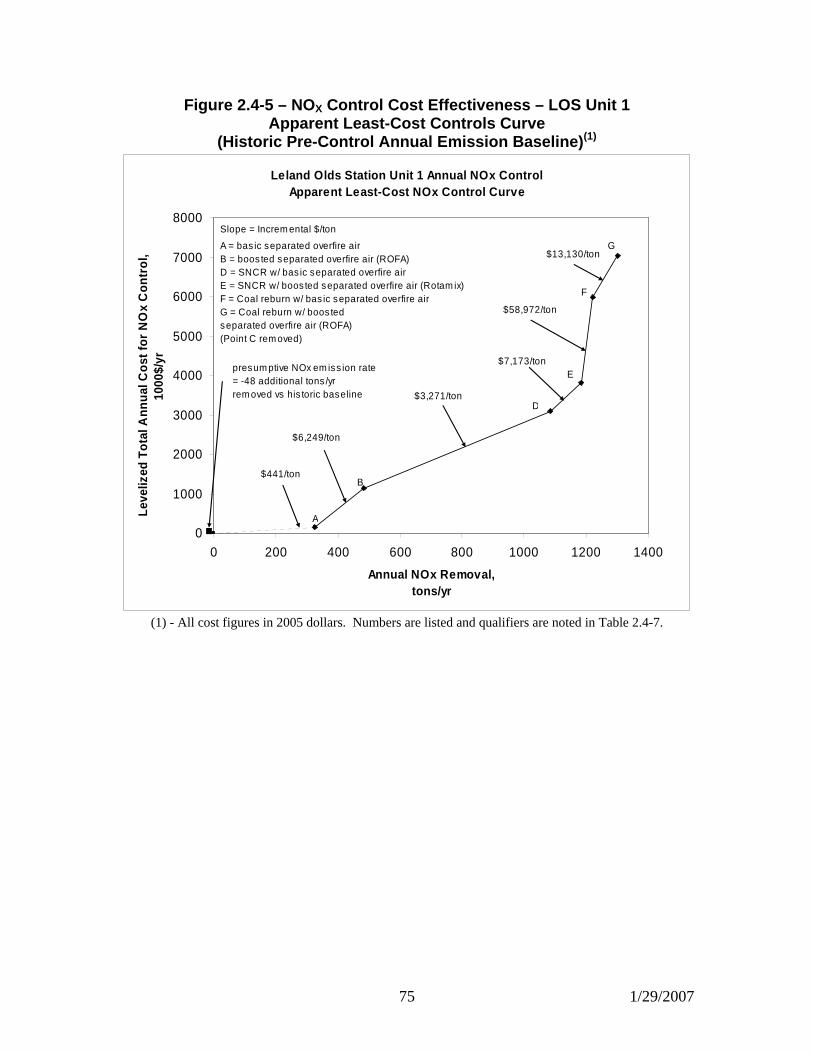
Figure 2.4-5 – NO X Control Cost Effectiveness – LOS Unit 1 Apparent Least-Cost Controls Curve
(Historic Pre-Control Annual Emission Baseline) (1)
Leland Olds Station Unit 1 Annual NOx ControlApparent Least-Cost NOx Control Curve
0
1000
2000
3000
4000
5000
6000
7000
8000
0 200 400 600 800 1000 1200 1400
Annual NOx Removal, tons/yr
Leve
lized
Tot
al A
nnua
l Cos
t for
NO
x C
ontr
ol,
1000
$/yr
B
D
Slope = Increm ental $/ton
$3,271/ton
$441/ton
$13,130/ton
$6,249/ton
$7,173/ton
A
E
F
G
presum ptive NOx em iss ion rate = -48 additional tons /yr rem oved vs his toric baseline
■
$58,972/ton
A = bas ic separated overfire airB = boos ted separated overfire air (ROFA)D = SNCR w/ bas ic separated overfire airE = SNCR w/ boos ted separated overfire air (Rotam ix)F = Coal reburn w/ bas ic separated overfire airG = Coal reburn w/ boos ted separated overfire air (ROFA)(Point C rem oved)
(1) - All cost figures in 2005 dollars. Numbers are listed and qualifiers are noted in Table 2.4-7.
76 1/29/2007
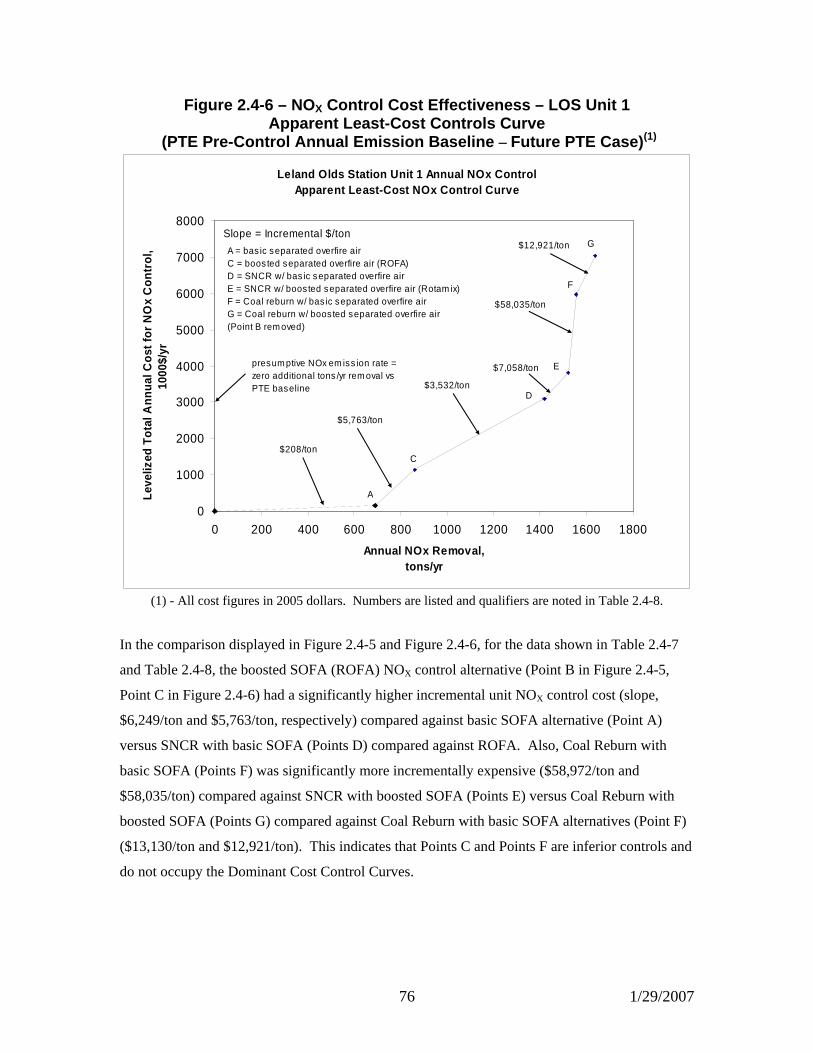
Figure 2.4-6 – NO X Control Cost Effectiveness – LOS Unit 1 Apparent Least-Cost Controls Curve
(PTE Pre-Control Annual Emission Baseline – Future PTE Case) (1)
Leland Olds Station Unit 1 Annual NOx ControlApparent Least-Cost NOx Control Curve
0
1000
2000
3000
4000
5000
6000
7000
8000
0 200 400 600 800 1000 1200 1400 1600 1800
Annual NOx Removal, tons/yr
Leve
lized
Tot
al A
nnua
l Cos
t for
NO
x C
ontr
ol,
1000
$/yr
A
C
D
Slope = Incremental $/ton
A = bas ic separated overfire airC = boos ted separated overfire air (ROFA)D = SNCR w/ bas ic separated overfire airE = SNCR w/ boosted separated overfire air (Rotam ix)F = Coal reburn w/ bas ic separated overfire airG = Coal reburn w/ boosted separated overfire air(Point B rem oved)
$12,921/ton
$5,763/ton
$208/ton
$7,058/ton
$3,532/ton
G
F
$58,035/ton
Epresum ptive NOx em iss ion rate = zero additional tons /yr rem oval vs PTE baseline
(1) - All cost figures in 2005 dollars. Numbers are listed and qualifiers are noted in Table 2.4-8.
In the comparison displayed in Figure 2.4-5 and Figure 2.4-6, for the data shown in Table 2.4-7
and Table 2.4-8, the boosted SOFA (ROFA) NOX control alternative (Point B in Figure 2.4-5,
Point C in Figure 2.4-6) had a significantly higher incremental unit NOX control cost (slope,
$6,249/ton and $5,763/ton, respectively) compared against basic SOFA alternative (Point A)
versus SNCR with basic SOFA (Points D) compared against ROFA. Also, Coal Reburn with
basic SOFA (Points F) was significantly more incrementally expensive ($58,972/ton and
$58,035/ton) compared against SNCR with boosted SOFA (Points E) versus Coal Reburn with
boosted SOFA (Points G) compared against Coal Reburn with basic SOFA alternatives (Point F)
($13,130/ton and $12,921/ton). This indicates that Points C and Points F are inferior controls and
do not occupy the Dominant Cost Control Curves.
77 1/29/2007
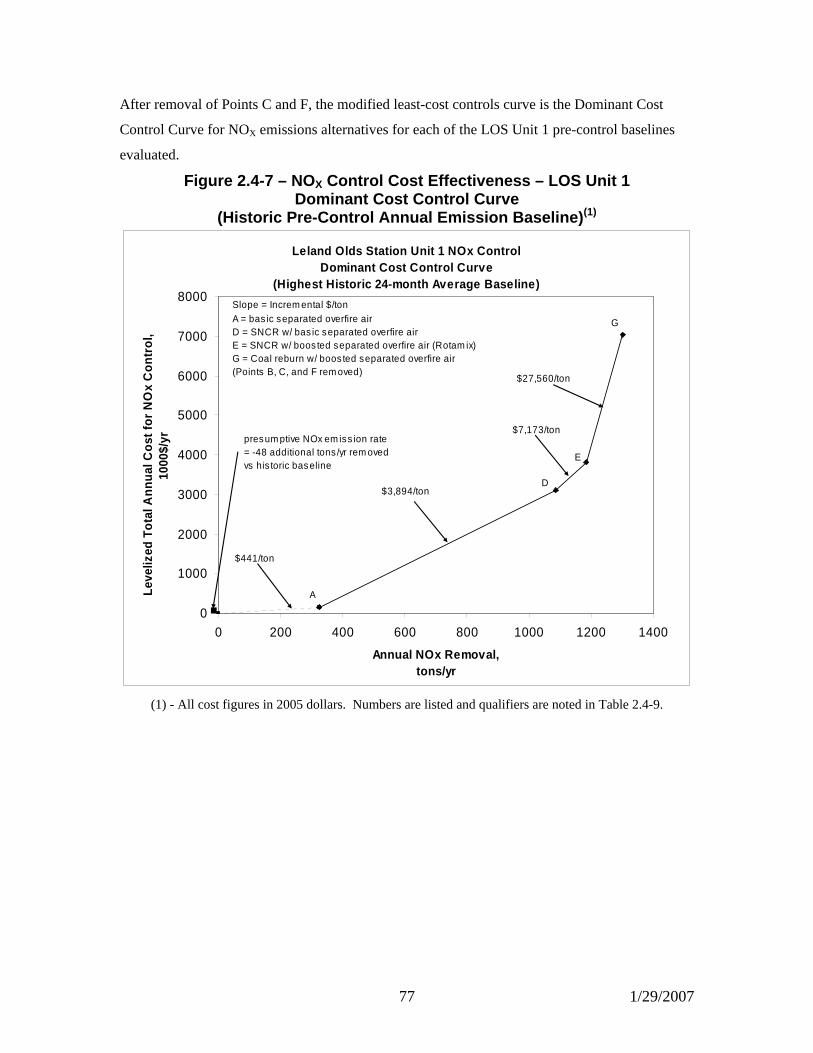
After removal of Points C and F, the modified least-cost controls curve is the Dominant Cost
Control Curve for NOX emissions alternatives for each of the LOS Unit 1 pre-control baselines
evaluated.
Figure 2.4-7 – NO X Control Cost Effectiveness – LOS Unit 1 Dominant Cost Control Curve
(Historic Pre-Control Annual Emission Baseline) (1)
Leland Olds Station Unit 1 NOx ControlDominant Cost Control Curve
(Highest Historic 24-month Average Baseline)
0
1000
2000
3000
4000
5000
6000
7000
8000
0 200 400 600 800 1000 1200 1400
Annual NOx Removal, tons/yr
Leve
lized
Tot
al A
nnua
l Cos
t for
NO
x C
ontr
ol,
1000
$/yr
D
Slope = Increm ental $/tonA = bas ic separated overfire airD = SNCR w/ bas ic separated overfire airE = SNCR w/ boos ted separated overfire air (Rotam ix)G = Coal reburn w/ boos ted separated overfire air(Points B, C, and F rem oved)
$3,894/ton
$441/ton
$27,560/ton
A
G
presum ptive NOx em iss ion rate = -48 additional tons /yr rem oved vs his toric baseline
■
$7,173/ton
E
(1) - All cost figures in 2005 dollars. Numbers are listed and qualifiers are noted in Table 2.4-9.
78 1/29/2007
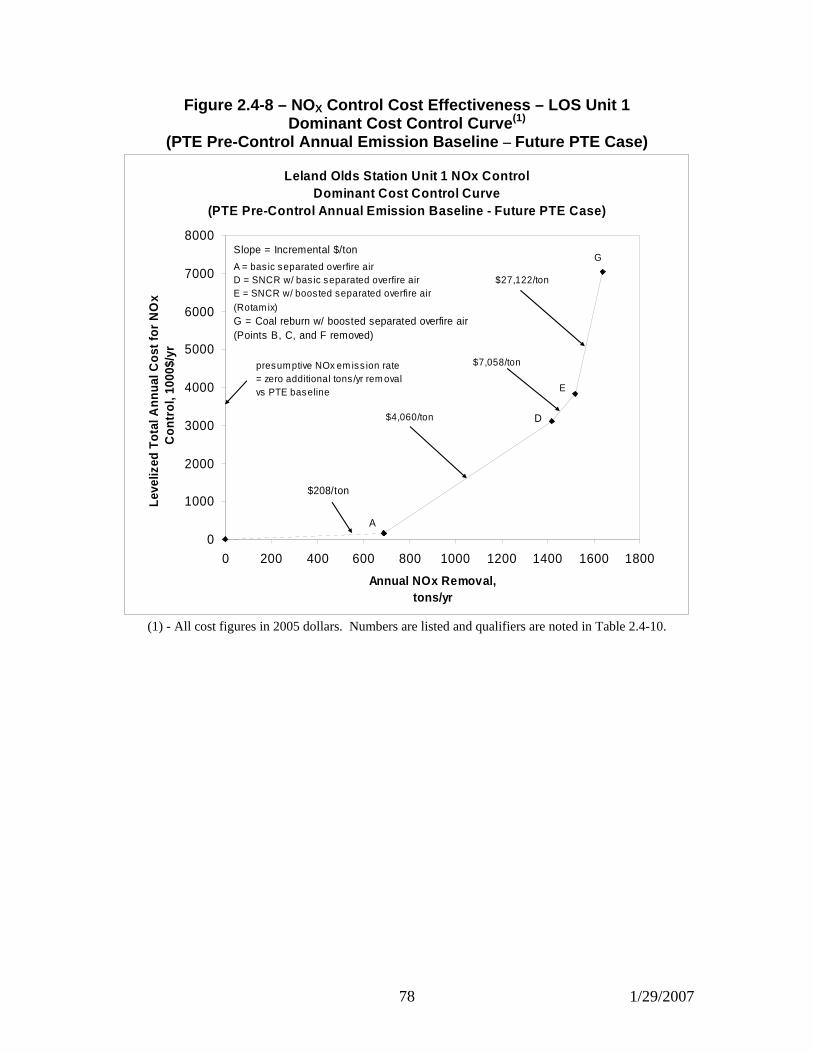
Figure 2.4-8 – NO X Control Cost Effectiveness – LOS Unit 1 Dominant Cost Control Curve (1)
(PTE Pre-Control Annual Emission Baseline – Future PTE Case)
Leland Olds Station Unit 1 NOx ControlDominant Cost Control Curve
(PTE Pre-Control Annual Emission Baseline - Future PTE C ase)
0
1000
2000
3000
4000
5000
6000
7000
8000
0 200 400 600 800 1000 1200 1400 1600 1800
Annual NOx Removal, tons/yr
Leve
lized
Tot
al A
nnua
l Cos
t for
NO
x C
ontr
ol, 1
000$
/yr
Slope = Incremental $/ton
A
$27,122/tonA = bas ic separated overfire airD = SNCR w/ bas ic separated overfire airE = SNCR w/ boos ted separated overfire air (Rotam ix)G = Coal reburn w/ boosted separated overfire air(Points B, C, and F removed)
D
G
$4,060/ton
$208/ton
E
$7,058/tonpresum ptive NOx em iss ion rate = zero additional tons /yr rem oval vs PTE baseline
(1) - All cost figures in 2005 dollars. Numbers are listed and qualifiers are noted in Table 2.4-10.
79 1/29/2007
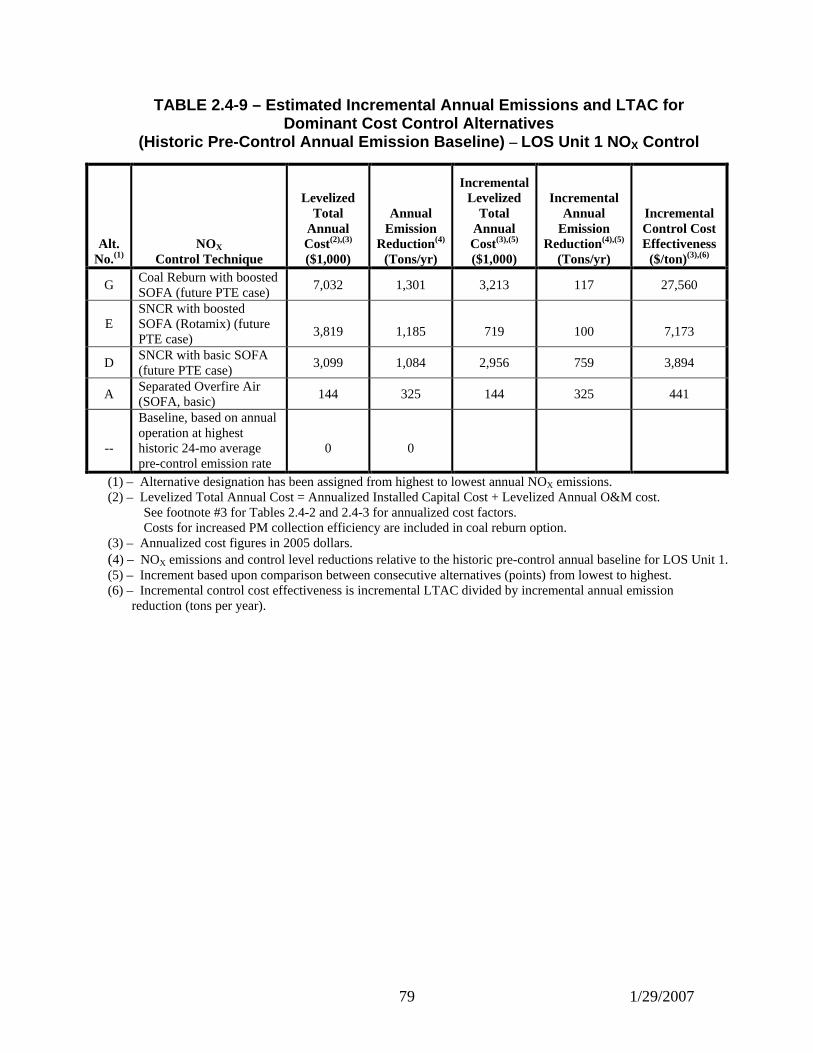
TABLE 2.4-9 – Estimated Incremental Annual Emission s and LTAC for Dominant Cost Control Alternatives
(Historic Pre-Control Annual Emission Baseline) – LOS Unit 1 NO X Control
Alt. No.(1)
NOX Control Technique
Levelized Total
Annual Cost(2),(3)
($1,000)
Annual Emission
Reduction(4)
(Tons/yr)
Incremental Levelized
Total Annual Cost(3),(5) ($1,000)
Incremental
Annual Emission
Reduction(4),(5)
(Tons/yr)
Incremental Control Cost Effectiveness ($/ton)(3),(6)
G Coal Reburn with boosted SOFA (future PTE case)
7,032 1,301 3,213 117 27,560
E SNCR with boosted SOFA (Rotamix) (future PTE case)
3,819 1,185 719 100 7,173
D SNCR with basic SOFA (future PTE case)
3,099 1,084 2,956 759 3,894
A Separated Overfire Air (SOFA, basic)
144 325 144 325 441
--
Baseline, based on annual operation at highest historic 24-mo average pre-control emission rate
0
0
(1) – Alternative designation has been assigned from highest to lowest annual NOX emissions. (2) – Levelized Total Annual Cost = Annualized Installed Capital Cost + Levelized Annual O&M cost.
See footnote #3 for Tables 2.4-2 and 2.4-3 for annualized cost factors. Costs for increased PM collection efficiency are included in coal reburn option.
(3) – Annualized cost figures in 2005 dollars. (4) – NOX emissions and control level reductions relative to the historic pre-control annual baseline for LOS Unit 1. (5) – Increment based upon comparison between consecutive alternatives (points) from lowest to highest. (6) – Incremental control cost effectiveness is incremental LTAC divided by incremental annual emission
reduction (tons per year).
80 1/29/2007
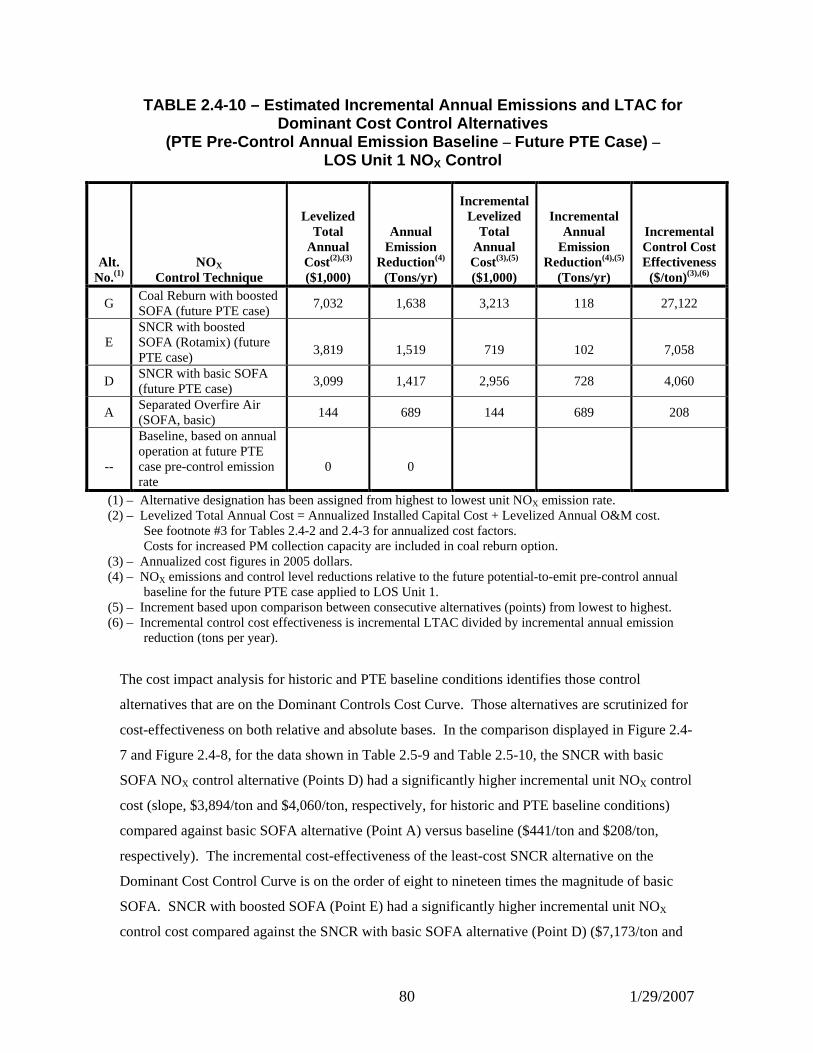
TABLE 2.4-10 – Estimated Incremental Annual Emissio ns and LTAC for Dominant Cost Control Alternatives
(PTE Pre-Control Annual Emission Baseline – Future PTE Case) – LOS Unit 1 NO X Control
Alt. No.(1)
NOX Control Technique
Levelized Total
Annual Cost(2),(3)
($1,000)
Annual Emission
Reduction(4)
(Tons/yr)
Incremental Levelized
Total Annual Cost(3),(5) ($1,000)
Incremental
Annual Emission
Reduction(4),(5)
(Tons/yr)
Incremental Control Cost Effectiveness ($/ton)(3),(6)
G Coal Reburn with boosted SOFA (future PTE case)
7,032 1,638 3,213 118 27,122
E SNCR with boosted SOFA (Rotamix) (future PTE case)
3,819 1,519 719 102 7,058
D SNCR with basic SOFA (future PTE case)
3,099 1,417 2,956 728 4,060
A Separated Overfire Air (SOFA, basic)
144 689 144 689 208
--
Baseline, based on annual operation at future PTE case pre-control emission rate
0
0
(1) – Alternative designation has been assigned from highest to lowest unit NOX emission rate. (2) – Levelized Total Annual Cost = Annualized Installed Capital Cost + Levelized Annual O&M cost.
See footnote #3 for Tables 2.4-2 and 2.4-3 for annualized cost factors. Costs for increased PM collection capacity are included in coal reburn option.
(3) – Annualized cost figures in 2005 dollars. (4) – NOX emissions and control level reductions relative to the future potential-to-emit pre-control annual
baseline for the future PTE case applied to LOS Unit 1. (5) – Increment based upon comparison between consecutive alternatives (points) from lowest to highest. (6) – Incremental control cost effectiveness is incremental LTAC divided by incremental annual emission
reduction (tons per year).
The cost impact analysis for historic and PTE baseline conditions identifies those control
alternatives that are on the Dominant Controls Cost Curve. Those alternatives are scrutinized for
cost-effectiveness on both relative and absolute bases. In the comparison displayed in Figure 2.4-
7 and Figure 2.4-8, for the data shown in Table 2.5-9 and Table 2.5-10, the SNCR with basic
SOFA NOX control alternative (Points D) had a significantly higher incremental unit NOX control
cost (slope, $3,894/ton and $4,060/ton, respectively, for historic and PTE baseline conditions)
compared against basic SOFA alternative (Point A) versus baseline ($441/ton and $208/ton,
respectively). The incremental cost-effectiveness of the least-cost SNCR alternative on the
Dominant Cost Control Curve is on the order of eight to nineteen times the magnitude of basic
SOFA. SNCR with boosted SOFA (Point E) had a significantly higher incremental unit NOX
control cost compared against the SNCR with basic SOFA alternative (Point D) ($7,173/ton and
81 1/29/2007
$7,058/ton, vs $3,894/ton and $4,060/ton respectively). Coal Reburn with boosted SOFA (Points
G) was even more incrementally costly versus SNCR with boosted SOFA (Points E) ($27,560/ton
and $27,122/ton, vs $($7,173/ton and $7,058/ton respectively).
In the final BART Guidelines, the EPA neither proposes hard definitions for reasonable or
unreasonable Unit Control Costs nor for incremental cost effectiveness values. As can be seen
from a review of Table 2.4-5, the average levelized control cost effectiveness of control
alternatives calculated for the future PTE case relative to the highest 24-hour historic baseline
NOX emission ranges from $441/ton to $6,504/ton. Table 2.4-6 shows average levelized control
cost effectiveness of control alternatives calculated for the future PTE case relative to the
presumptive NOX emission level ranges from $208/ton to $4,293/ton. The latter has lower costs
per ton of NOX emission removal due to the higher number of tons removed for the maximum
emissions for pre-control baseline and additional controls under the future PTE case.
Various combinations of NOX control technologies evaluated for control and cost-effectiveness
are considered to be technically feasible for LOS Unit 1, but have much higher installation and
operating costs compared with basic SOFA alone. This confirms the analysis performed by the
EPA for establishing the presumptive limits for BART NOX emissions from pulverized coal-fired
EGUs: that the application of current combustion control technology, [primarily low-NOx
burners and overfire air] is generally, but not always, more cost-effective than post-combustion
controls. Based on the cost impact analysis and the premise that LOS Unit 1’s historic and PTE
annual average baseline emissions already meet the presumptive BART NOX level of 0.29
lb/mmBtu, only the least-cost alternative of basic separated overfire air was considered for further
impact and visibility impairment evaluations for LOS Unit 1 NOX emissions control.
The other elements of the fourth step of a BART analysis after the cost impact analysis include
evaluating the following impacts:
♦ Energy impacts.
♦ Non-air quality environmental impacts.
♦ Remaining useful life of the source.
For the purposes of this BART analysis, the remaining useful life of the source was assumed to
exceed the 20-year project life utilized in the levelized annual cost impact estimates. The other
impacts for the single LOS Unit 1 NOX emissions control alternative chosen to be evaluated
82 1/29/2007
further are discussed in Section 2.4.2 and Section 2.4.3. Visibility impairment impacts evaluated
for selected LOS Unit 1 NOX emissions controls are summarized in Section 2.4.4.
84 8/11/2009
(The following article is an addition to the August 2006 BEPC BART Determination Study report.)
[The same basic kinds of energy impacts for NOX emissions controls described in the August 2006 BEPC LOS BART Report were evaluated for the SOFA with SNCR alternative for LOS Unit 1.]
2.4.2.1 ENERGY IMPACTS OF SOFA with SNCR NO X CONTROL ALTERNATIVE – LOS UNIT 1
Another feasible NOX control alternative was reviewed for significant or unusual energy penalties or
benefits associated with its use on LOS Unit 1.
Basic SOFA with SNCR operation on LOS Unit 1 may require slightly higher forced draft fan power
consumption resulting from higher fan discharge pressure, with combustion air damper actuators’
electrical power demand expected to be an insignificant (+ 1 kW) change in net electrical power
consumption from LOS Unit 1. Higher windbox pressure and ductwork pressure drop impacts of the
SOFA system on the forced draft fans’ and induced draft fans’ auxiliary electrical power consumption
are expected to be negligible (less than 1% of the annual auxiliary power consumed by these fans).
The SNCR portion of this layered alternative involves a chemical reagent injected for NOX control,
assumed to be aqueous urea. The injection of a diluted urea solution requires some additional
auxiliary power for heating and pumping the liquid, and using compressed air for atomization and
cooling the reagent injection nozzles/lances. Heat is required for urea reagent storage, assumed to be
applied to outside concentrated aqueous urea storage tank(s). For the basic SOFA with SNCR
alternative, the source of heat is assumed to be auxiliary electrical power. Together, the addition of
SNCR to LOS Unit 1 is estimated to consume 35.8 kW, which was calculated following EPA
OAQPS convention2. Based on operation for the entire year with the assumed 99% availability
factor, this would consume approximately 310,000 kW-hr/yr of additional auxiliary electrical power.
Additional coal consumption for those alternatives that involve a chemical reagent injected for NOx
control to compensate for the heat of vaporization of the reagent dilution water; this follows EPA
OAQPS convention1, but is not accepted practice by an experienced SNCR vendor (Fuel Tech) who
claims that the heat produced from the exothermic reaction of urea and NOX is approximately equal to
the heat required to evaporate the dilution water. Reagent dilution water for those SNCR alternatives
that involve a chemical reagent injected for NOx control were assumed to be four times the amount of
delivered aqueous urea solution consumption (assumes urea is a 50% solution as delivered and is
2. See Basin LOS BART Determination Study report NOX Section Reference number 49, page 1-34.
85 8/11/2009
injected as a 10% solution); this also follows EPA OAQPS convention3. This was estimated to be
approximately 6.2 million Btu per hour, or 53,645 mmBtu/yr.
Likewise, operation of a basic SOFA with SNCR alternative may cause a small increase in levels of
unburned carbon in the flyash emitted from the LOS Unit 1 boiler compared with current operation.
This represents a slight amount of lost potential electrical power generation from the incompletely
burned fuel, so this inefficiency could have a small negative impact (much less than 1%) on the plant
unit heat rate (higher Btu/kW-hr). This impact was not quantified, as the historical variation in coal
heat content that influences plant unit heat rate is expected to have more significant impacts.
As discussed above, SNCR operation will cause a slight decrease (approximately 0.2%) on the LOS
Unit 1 plant unit heat rate (higher Btu/kW-hr), primarily to higher flue gas moisture with
corresponding sensible and latent heat losses which would require a slightly higher gross heat input to
evaporate the extra dilution water input. This ignores the slight increase in induced draft fan
horsepower and auxiliary electrical power consumption to handle the extra coal combustion products,
urea and dilution water flows that will result in increased flue gas mass flow during SNCR operation.
LOS Unit 1 boiler furnace exit gas temperature and superheater steam / reheater steam outlet
temperatures is not expected to change significantly, as a slight increase during air-staged burner
operation with SOFA may be offset by a slight depression from the injection of the urea dilution
water. This impact on the boiler’s operation is typically small, and within the design capabilities of
the boiler from a heat transfer and mechanical stress standpoint. This impact on the LOS Unit 1
boiler’s thermal conversion efficiency and steam cycle impacts from small steam temperature
changes was not quantified, but is not expected to be significant.
SOFA and SNCR are not expected to significantly reduce LOS Unit 1 reliability and availability to
generate electrical power. There may be some changes in the degradation rate of the boiler’s furnace
waterwall tubes resulting from exposure of more area of the furnace walls to slightly air-starved
conditions during SOFA operation. Such conditions can promote corrosion of the steel waterwall
tubes by sulfur compounds in the furnace gases being created above the burners and below the SOFA
injection ports. Due to the moderate sulfur content in the lignite and modest amount of air-staging
during firing of the existing low-NOX burners expected during SOFA operation, this potential change
in corrosion rate of the boiler tubes is expected to be minor. This degradation is expected to occur
3 See Basin LOS BART Determination Study report NOX Section Reference number 49, page 1-35.
86 8/11/2009
over many years of operation, and normally requires periodic replacement of the deteriorated sections
of boiler furnace waterwall tubes and superheater/reheater tube banks to avoid forced outages to
repair tube leaks or failed sections. The potential change in the frequency of furnace wall tube and
superheater/reheater tube failures and changeouts is difficult to estimate, and has not been quantified.
SNCR with SOFA operation of LOS Unit 1 may also cause a slight increase in fireside deposit
accumulation, especially in the primary and possibly secondary superheater and reheater tube banks.
This is expected to be minor, and removed during periodic scheduled outages of LOS Unit 1.
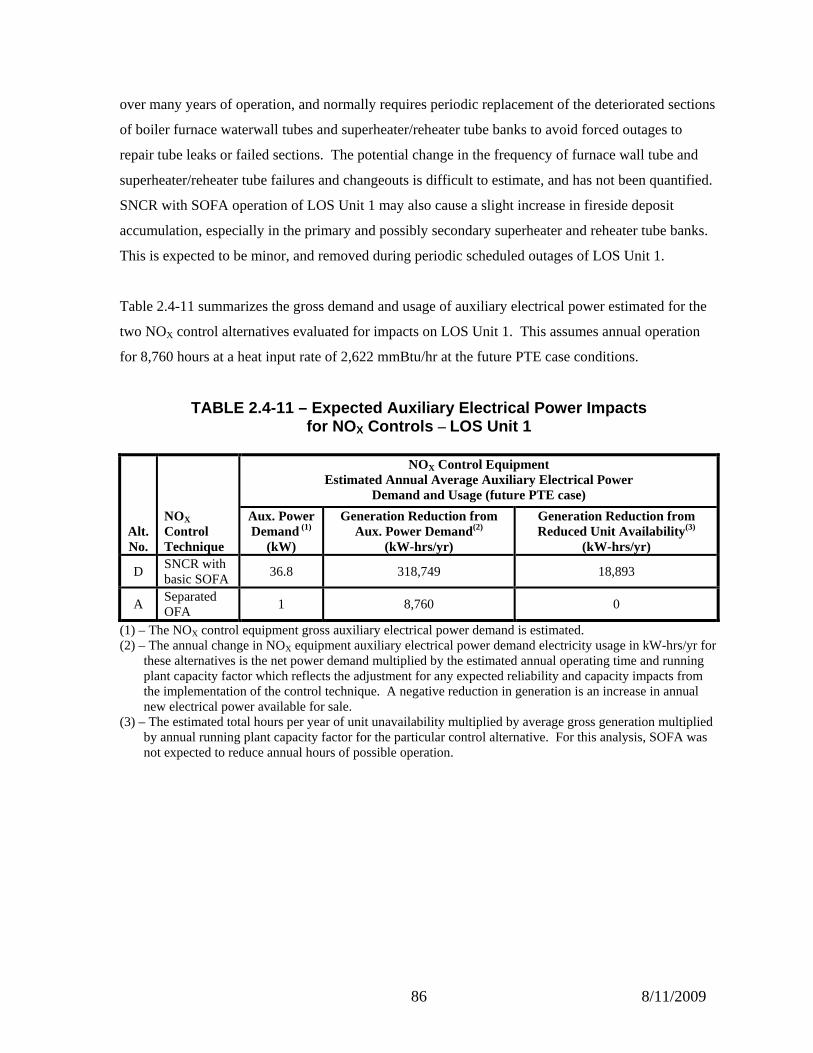
Table 2.4-11 summarizes the gross demand and usage of auxiliary electrical power estimated for the
two NOX control alternatives evaluated for impacts on LOS Unit 1. This assumes annual operation
for 8,760 hours at a heat input rate of 2,622 mmBtu/hr at the future PTE case conditions.
TABLE 2.4-11 – Expected Auxiliary Electrical Power Impacts for NO X Controls – LOS Unit 1
Alt. No.
NOX Control Technique
NOX Control Equipment Estimated Annual Average Auxiliary Electrical Power
Demand and Usage (future PTE case)
Aux. Power
Demand (1)
(kW)
Generation Reduction from Aux. Power Demand(2)
(kW-hrs/yr)
Generation Reduction from Reduced Unit Availability(3)
(kW-hrs/yr)
D SNCR with basic SOFA
36.8 318,749 18,893
A Separated OFA
1 8,760 0
(1) – The NOX control equipment gross auxiliary electrical power demand is estimated. (2) – The annual change in NOX equipment auxiliary electrical power demand electricity usage in kW-hrs/yr for
these alternatives is the net power demand multiplied by the estimated annual operating time and running plant capacity factor which reflects the adjustment for any expected reliability and capacity impacts from the implementation of the control technique. A negative reduction in generation is an increase in annual new electrical power available for sale.
(3) – The estimated total hours per year of unit unavailability multiplied by average gross generation multiplied by annual running plant capacity factor for the particular control alternative. For this analysis, SOFA was not expected to reduce annual hours of possible operation.
88 8/11/2009
(The following article is an addition to the August 2006 BEPC BART Determination Study report)
[The same basic kinds of non-air environmental impacts for NOX emissions controls described in the August 2006 BEPC LOS BART Report were evaluated for the SOFA with SNCR alternative for LOS Unit 1.]
2.4.3.2 NON AIR QUALITY AND OTHER ENVIRONMENTAL IMPACTS OF SOFA with SNCR – LOS UNIT 1
Operation of an SNCR-related system will normally create a small amount of unreacted urea or
ammonia to be emitted. The amount of ammonia slip produced by SNCR depends on the amount of
reagent utilization and location of the injection points. Higher SNCR NOX reduction performance
involves greater amounts of reagent usage and ammonia slip. This potential air emission increase
does not qualify as a non-air environmental impact evaluated for the BART impact analysis, and
therefore has not been quantified.
Ammonia slip is typically controlled to less than 10 ppmvd, especially since the possible formation of
sulfates such as ammonium sulfate [(NH4)2SO4] and ammonium bisulfate [NH4HSO4] will be more
problematic at higher slip levels. Sulfur trioxide (SO3) formed during combustion in the boiler can
combine with ammonia during passage through the flue gas ductwork to form the sulfates. Boiler
combustion air heaters, whether tubular or rotary regenerative types, can become fouled with such
sulfate compounds. An extension of scheduled unit outages or forced outages (unlikely) could occur
as a result of these sulfate deposit accumulations and the time spent to remove them. This could
reduce unit operating time (annual availability), but for LOS Unit 1 is expected to be very small,
estimated to be 1% of the annual operating time possible.
Some of the unreacted ammonia from SNCR operation will be collected with the flyash in the
electrostatic precipitator. This is not expected to pose any significant hazards in the subsequent
disposal of the flyash in the nearby permitted landfill currently used by BEPC for this coal
combustion byproduct material.
Storage of urea or ammonia reagent on-site creates the potential for accidents, leaks, and subsequent
releases to air, ground, and surface water immediately surrounding the facility. Regulation of storage
and containment of such reagents as hazardous substances will be under the requirements of various
federal Acts, which are not part of this BART impact analysis.
89 8/11/2009
The amount of unburned carbon in the flyash produced by the boiler, collected for disposal or
potentially emitted to the atmosphere may increase by small increments due to operation of LOS Unit
1 using separated overfire air for NOX emissions control. The potential changes in the annual
amounts of flyash disposal rates are expected to be inconsequential, and have not been quantified.
This potential air emission increase does not qualify as a non-air environmental impact evaluated for
the BART impact analysis, and therefore has not been quantified.
The operation of a system using a basic form of separated overfire air for NOX emissions control may
increase carbon monoxide concentrations in the stack flue gas emitted from the LOS Unit 1 boiler.
This potential air emission increase does not qualify as a non-air environmental impact evaluated for
the BART impact analysis, and therefore has not been quantified.
The operation of a conventional SNCR system is not expected to significantly impact emissions of
CO or volatile organic compounds (VOCs). The chemical form of the reagent will affect the amount
of carbon dioxide emitted, since urea contains CO which is readily converted to CO2 in the boiler-
furnace and convection sections by combining with available free oxygen. One mole of carbon
dioxide (CO2) will be created and emitted for every mole of urea injected for reaction with NOX. This
is a relatively small increase in the total amount of CO2 produced as part of the combustion of carbon-
based fossil fuel in the form of lignite. This potential air emission increase does not qualify as a non-
air environmental impact evaluated for the BART impact analysis, and therefore has not been
quantified.
Any remaining ammonia slip that is not collected or condensed in the air pollution control system will
be emitted from the stack as an aerosol or condensable particulate. This has the potential to increase
atmospheric visibility impairment downwind of the facility compared with a pristine condition.
Although the predicted amount of such potential impact from ammonia slip emissions has not been
determined, it is expected to be small in comparison with the significant anticipated reduction in far-
field ozone and improvement in atmospheric visibility as a result of the overall NOX emission
reductions from the use of SNCR-related alternatives. This potential air emission increase does not
qualify as a non-air environmental impact evaluated for the BART impact analysis, and therefore has
not been quantified.
There were no other adverse or significant changes in non-air quality environmental impacts
identified for LOS Unit 1 as a result of using separated overfire air with SNCR for NOX emissions
90 8/11/2009
control. Predicted visibility impairment improvement impacts from the reduction in nitrogen oxides
emissions predicted to result from operation of LOS Unit 1 with SOFA and SNCR are discussed in
the next section.
(The following article is a replacement of the same section in the August 2006 BEPC BART
Determination Study report)
2.4.4 VISIBILITY IMPAIRMENT IMPACTS OF LELAND OLDS STATION NOX CONTROLS –UNIT 1
The fifth step in a BART analysis is to conduct a visibility improvement determination for the source.
For this BART analysis, there were two baseline NOX emission rates modeled for LOS Unit 1 – one
for the historic pre-control NOX emission rate listed in the NDDH BART protocol3, and one applying
the presumptive BART NOX emission rate. The historic pre-control emission baseline was the 24-
hour average actual NOX emission rate from the highest emitting day of the years 2000-2002
(meteorological period modeled per the NDDH BART protocol3). The historic (protocol) NOX
baseline condition emission rate was modeled simultaneously with the highest 24-hour average SO2
emission rate, and the highest 24-hour average PM emission rate of the 2000-2002 time period.
The historic (protocol) baseline hourly NOX emission rate used for modeling visibility impacts due to
LOS Unit 1 under the conditions stated above was 813 lb/hr. Visibility impact modeling was
performed using the CALPUFF model with the difference between the impacts from historic pre-
control baseline and post-control average hourly NOX emission rates representing the visibility
impairment impact reduction. One CALPUFF model run was performed with the LOS Unit 1’s basic
SOFA NOX emission rate and another run was subsequently conducted with LOS Unit 1’s SOFA
with SNCR NOX emission rate, constant PM emissions, and BART level of SO2 control assuming the
Potential-To-Emit (PTE) boiler design rating for heat input (2,622 mmBtu/hr). The unit NOX
emission rate of 0.168 lb/mmBtu multiplied by the boiler PTE heat input rating of 2,622 mmBtu/hr
yields 441 lb/hr for LOS Unit 1 under the future PTE case. This compares to the visibility model
using an average post-control hourly future PTE LOS Unit 1 NOX emission rate of 0.23 lb/mmBtu
with the PTE boiler heat input rating to yield 603 lb/hr for operation with basic SOFA.
In keeping with the NDDH BART visibility impairment impact modeling protocol, the BART NOX
post-control future PTE presumptive emission rate (760 lb/hr), basic SOFA, and SOFA with SNCR
alternatives all have a different boiler heat input basis than the LOS Unit 1 historic highest 24-hour
91 8/11/2009
pre-control NOX emission baseline (813 lb/hr). The post-control conditions for LOS Unit 1 all
assume operation at the boiler PTE heat input capacity rating (future PTE case) of 2,622 mmBtu/hr.
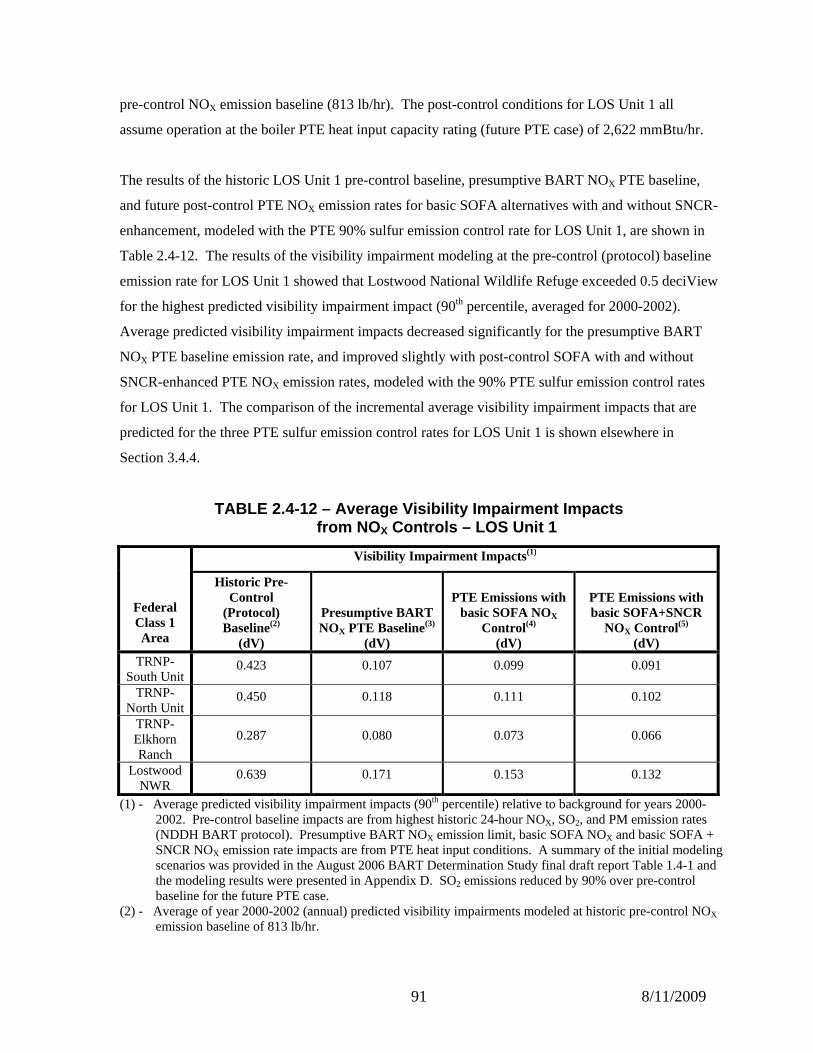
The results of the historic LOS Unit 1 pre-control baseline, presumptive BART NOX PTE baseline,
and future post-control PTE NOX emission rates for basic SOFA alternatives with and without SNCR-
enhancement, modeled with the PTE 90% sulfur emission control rate for LOS Unit 1, are shown in
Table 2.4-12. The results of the visibility impairment modeling at the pre-control (protocol) baseline
emission rate for LOS Unit 1 showed that Lostwood National Wildlife Refuge exceeded 0.5 deciView
for the highest predicted visibility impairment impact (90th percentile, averaged for 2000-2002).
Average predicted visibility impairment impacts decreased significantly for the presumptive BART
NOX PTE baseline emission rate, and improved slightly with post-control SOFA with and without
SNCR-enhanced PTE NOX emission rates, modeled with the 90% PTE sulfur emission control rates
for LOS Unit 1. The comparison of the incremental average visibility impairment impacts that are
predicted for the three PTE sulfur emission control rates for LOS Unit 1 is shown elsewhere in
Section 3.4.4.
TABLE 2.4-12 – Average Visibility Impairment Impact s from NO X Controls – LOS Unit 1
Federal Class 1 Area
Visibility Impairment Impacts (1)
Historic Pre-Control
(Protocol) Baseline(2)
(dV)
Presumptive BART NOX PTE Baseline(3)
(dV)
PTE Emissions with basic SOFA NOX
Control (4) (dV)
PTE Emissions with basic SOFA+SNCR
NOX Control (5) (dV)
TRNP-South Unit
0.423 0.107 0.099 0.091
TRNP-North Unit
0.450 0.118 0.111 0.102
TRNP-Elkhorn Ranch
0.287 0.080 0.073 0.066
Lostwood NWR
0.639 0.171 0.153 0.132
(1) - Average predicted visibility impairment impacts (90th percentile) relative to background for years 2000-2002. Pre-control baseline impacts are from highest historic 24-hour NOX, SO2, and PM emission rates (NDDH BART protocol). Presumptive BART NOX emission limit, basic SOFA NOX and basic SOFA + SNCR NOX emission rate impacts are from PTE heat input conditions. A summary of the initial modeling scenarios was provided in the August 2006 BART Determination Study final draft report Table 1.4-1 and the modeling results were presented in Appendix D. SO2 emissions reduced by 90% over pre-control baseline for the future PTE case.
(2) - Average of year 2000-2002 (annual) predicted visibility impairments modeled at historic pre-control NOX emission baseline of 813 lb/hr.
92 8/11/2009
(3) - Average of year 2000-2002 (annual) predicted visibility impairments modeled at presumptive BART post-control PTE NOX mass emission hourly rate of 760.4 lb/hr (0.29 lb/mmBtu x 2,622 mmBtu/hr).
(4) - Average of year 2000-2002 (annual) predicted visibility impairments modeled at basic SOFA control alternative’s post-control PTE NOX mass emission hourly rate of 603.1 lb/hr (0.23 lb/mmBtu x 2,622 mmBtu/hr).
(5) - Average of year 2000-2002 (annual) predicted visibility impairments modeled at basic SOFA with SNCR control alternative’s post-control PTE NOX mass emission hourly rate 441 lb/hr (0.168 lb/mmBtu x 2,622 mmBtu/hr).
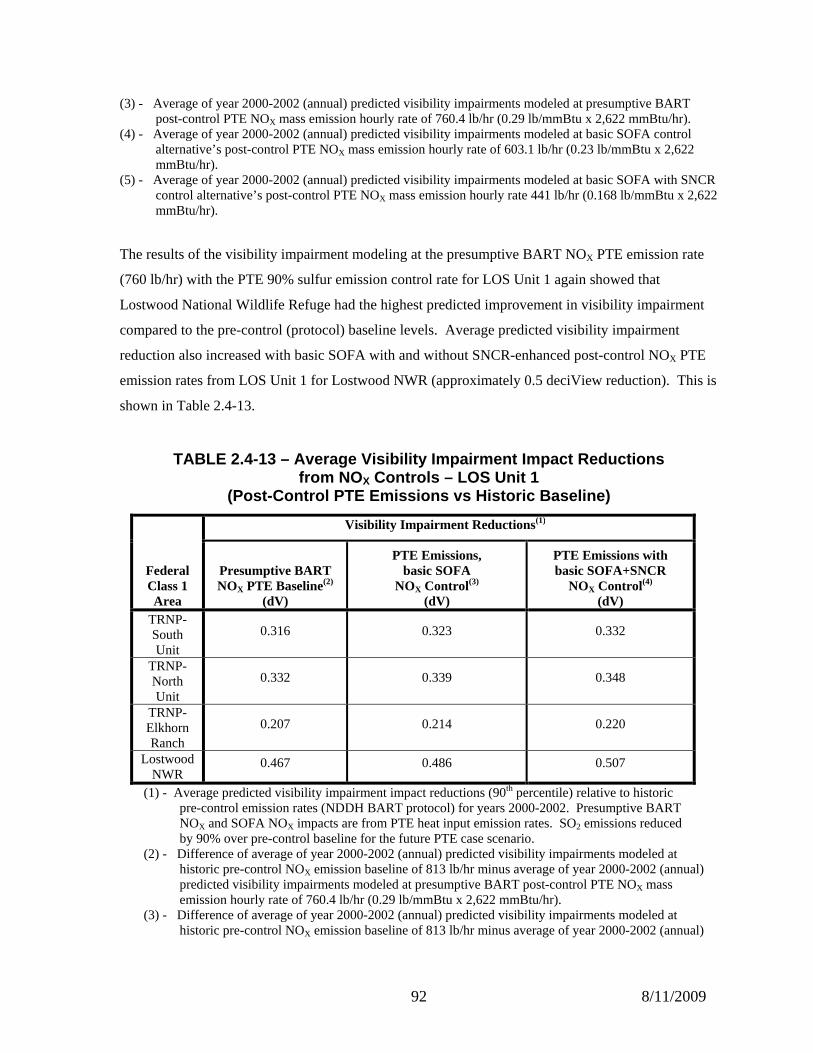
The results of the visibility impairment modeling at the presumptive BART NOX PTE emission rate
(760 lb/hr) with the PTE 90% sulfur emission control rate for LOS Unit 1 again showed that
Lostwood National Wildlife Refuge had the highest predicted improvement in visibility impairment
compared to the pre-control (protocol) baseline levels. Average predicted visibility impairment
reduction also increased with basic SOFA with and without SNCR-enhanced post-control NOX PTE
emission rates from LOS Unit 1 for Lostwood NWR (approximately 0.5 deciView reduction). This is
shown in Table 2.4-13.
TABLE 2.4-13 – Average Visibility Impairment Impact Reductions from NO X Controls – LOS Unit 1
(Post-Control PTE Emissions vs Historic Baseline)
Federal Class 1 Area
Visibility Impairment Reductions (1)
Presumptive BART NOX PTE Baseline(2)
(dV)
PTE Emissions, basic SOFA
NOX Control (3)
(dV)
PTE Emissions with basic SOFA+SNCR
NOX Control (4) (dV)
TRNP-South Unit
0.316 0.323 0.332
TRNP-North Unit
0.332 0.339 0.348
TRNP-Elkhorn Ranch
0.207 0.214 0.220
Lostwood NWR
0.467 0.486 0.507
(1) - Average predicted visibility impairment impact reductions (90th percentile) relative to historic pre-control emission rates (NDDH BART protocol) for years 2000-2002. Presumptive BART NOX and SOFA NOX impacts are from PTE heat input emission rates. SO2 emissions reduced by 90% over pre-control baseline for the future PTE case scenario.
(2) - Difference of average of year 2000-2002 (annual) predicted visibility impairments modeled at historic pre-control NOX emission baseline of 813 lb/hr minus average of year 2000-2002 (annual) predicted visibility impairments modeled at presumptive BART post-control PTE NOX mass emission hourly rate of 760.4 lb/hr (0.29 lb/mmBtu x 2,622 mmBtu/hr).
(3) - Difference of average of year 2000-2002 (annual) predicted visibility impairments modeled at historic pre-control NOX emission baseline of 813 lb/hr minus average of year 2000-2002 (annual)
93 8/11/2009
predicted visibility impairments modeled at basic SOFA control alternative’s post-control PTE NOX mass emission hourly rate of 603.1 lb/hr (0.23 lb/mmBtu x 2,622 mmBtu/hr).
(4) - Difference of average of year 2000-2002 (annual) predicted visibility impairments modeled at historic pre-control NOX emission baseline of 813 lb/hr minus average of year 2000-2002 (annual) predicted visibility impairments modeled at basic SOFA with SNCR control alternative’s post-control PTE NOX mass emission hourly rate 441 lb/hr (0.168 lb/mmBtu x 2,622 mmBtu/hr).
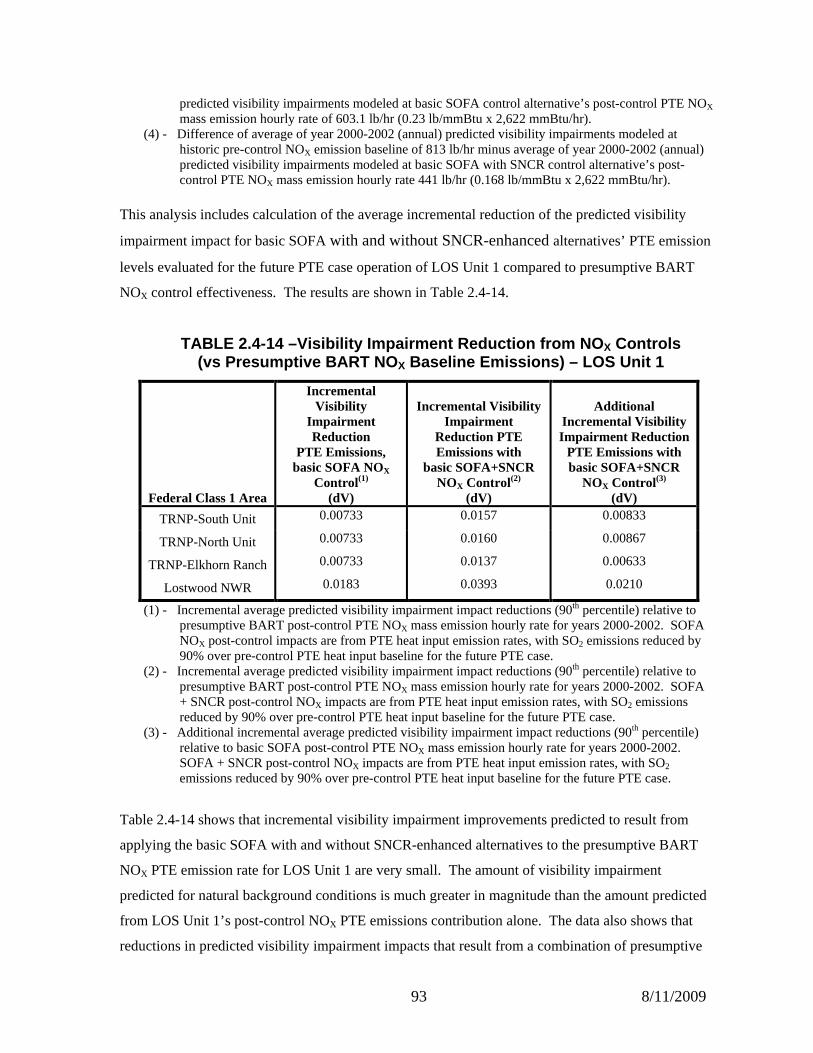
This analysis includes calculation of the average incremental reduction of the predicted visibility
impairment impact for basic SOFA with and without SNCR-enhanced alternatives’ PTE emission
levels evaluated for the future PTE case operation of LOS Unit 1 compared to presumptive BART
NOX control effectiveness. The results are shown in Table 2.4-14.
TABLE 2.4-14 –Visibility Impairment Reduction from NOX Controls (vs Presumptive BART NO X Baseline Emissions) – LOS Unit 1
Federal Class 1 Area
Incremental Visibility
Impairment Reduction
PTE Emissions, basic SOFA NOX
Control (1)
(dV)
Incremental Visibility Impairment
Reduction PTE Emissions with
basic SOFA+SNCR NOX Control (2)
(dV)
Additional Incremental Visibility Impairment Reduction
PTE Emissions with basic SOFA+SNCR
NOX Control (3) (dV)
TRNP-South Unit 0.00733 0.0157 0.00833
TRNP-North Unit 0.00733 0.0160 0.00867
TRNP-Elkhorn Ranch 0.00733 0.0137 0.00633
Lostwood NWR 0.0183 0.0393 0.0210
(1) - Incremental average predicted visibility impairment impact reductions (90th percentile) relative to presumptive BART post-control PTE NOX mass emission hourly rate for years 2000-2002. SOFA NOX post-control impacts are from PTE heat input emission rates, with SO2 emissions reduced by 90% over pre-control PTE heat input baseline for the future PTE case.
(2) - Incremental average predicted visibility impairment impact reductions (90th percentile) relative to presumptive BART post-control PTE NOX mass emission hourly rate for years 2000-2002. SOFA + SNCR post-control NOX impacts are from PTE heat input emission rates, with SO2 emissions reduced by 90% over pre-control PTE heat input baseline for the future PTE case.
(3) - Additional incremental average predicted visibility impairment impact reductions (90th percentile) relative to basic SOFA post-control PTE NOX mass emission hourly rate for years 2000-2002. SOFA + SNCR post-control NOX impacts are from PTE heat input emission rates, with SO2 emissions reduced by 90% over pre-control PTE heat input baseline for the future PTE case.
Table 2.4-14 shows that incremental visibility impairment improvements predicted to result from
applying the basic SOFA with and without SNCR-enhanced alternatives to the presumptive BART
NOX PTE emission rate for LOS Unit 1 are very small. The amount of visibility impairment
predicted for natural background conditions is much greater in magnitude than the amount predicted
from LOS Unit 1’s post-control NOX PTE emissions contribution alone. The data also shows that
reductions in predicted visibility impairment impacts that result from a combination of presumptive
94 8/11/2009
BART NOX PTE emissions and SO2 PTE emissions at the 90 percent (or better) control levels
compared to the pre-control (protocol) emission conditions are much greater in significance than the
incremental improvements of predicted visibility impairment from additional reductions in NOX
emissions.
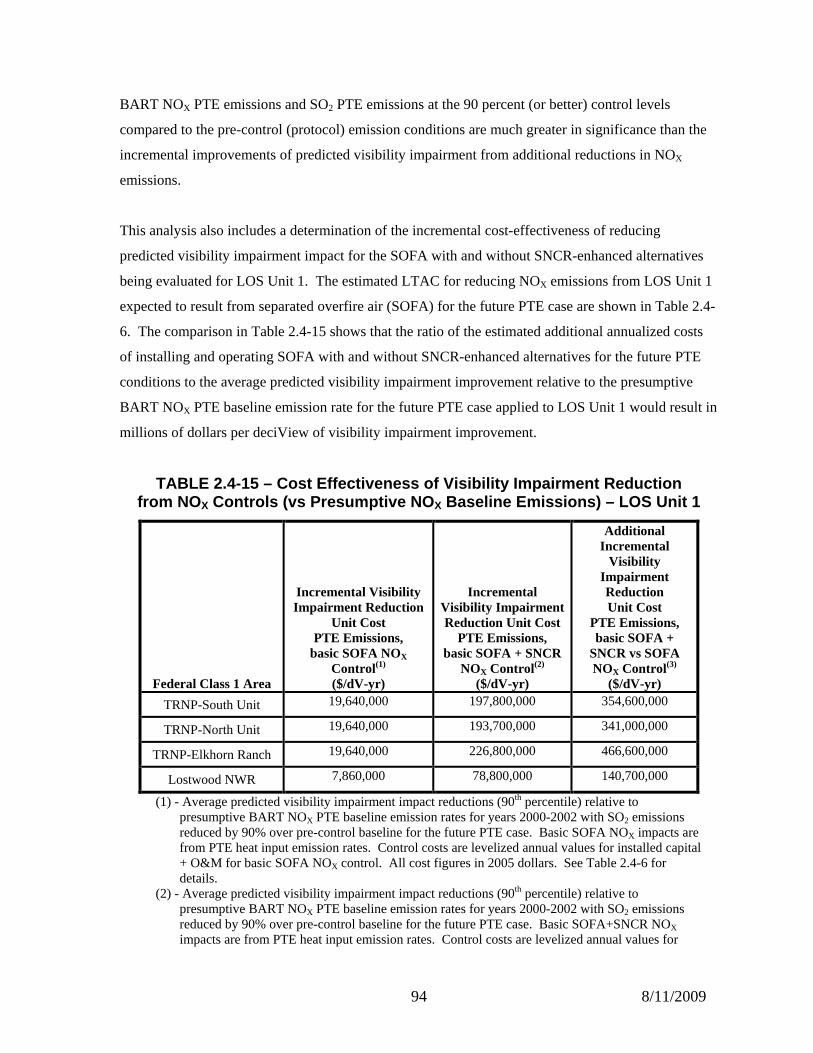
This analysis also includes a determination of the incremental cost-effectiveness of reducing
predicted visibility impairment impact for the SOFA with and without SNCR-enhanced alternatives
being evaluated for LOS Unit 1. The estimated LTAC for reducing NOX emissions from LOS Unit 1
expected to result from separated overfire air (SOFA) for the future PTE case are shown in Table 2.4-
6. The comparison in Table 2.4-15 shows that the ratio of the estimated additional annualized costs
of installing and operating SOFA with and without SNCR-enhanced alternatives for the future PTE
conditions to the average predicted visibility impairment improvement relative to the presumptive
BART NOX PTE baseline emission rate for the future PTE case applied to LOS Unit 1 would result in
millions of dollars per deciView of visibility impairment improvement.
TABLE 2.4-15 – Cost Effectiveness of Visibility Imp airment Reduction from NO X Controls (vs Presumptive NO X Baseline Emissions) – LOS Unit 1
Federal Class 1 Area
Incremental Visibility Impairment Reduction
Unit Cost PTE Emissions,
basic SOFA NOX Control (1) ($/dV-yr)
Incremental Visibility Impairment Reduction Unit Cost
PTE Emissions, basic SOFA + SNCR
NOX Control (2) ($/dV-yr)
Additional Incremental
Visibility Impairment Reduction Unit Cost
PTE Emissions, basic SOFA +
SNCR vs SOFA NOX Control (3)
($/dV-yr)
TRNP-South Unit 19,640,000 197,800,000 354,600,000
TRNP-North Unit 19,640,000 193,700,000 341,000,000
TRNP-Elkhorn Ranch 19,640,000 226,800,000 466,600,000
Lostwood NWR 7,860,000 78,800,000 140,700,000
(1) - Average predicted visibility impairment impact reductions (90th percentile) relative to presumptive BART NOX PTE baseline emission rates for years 2000-2002 with SO2 emissions reduced by 90% over pre-control baseline for the future PTE case. Basic SOFA NOX impacts are from PTE heat input emission rates. Control costs are levelized annual values for installed capital + O&M for basic SOFA NOX control. All cost figures in 2005 dollars. See Table 2.4-6 for details.
(2) - Average predicted visibility impairment impact reductions (90th percentile) relative to presumptive BART NOX PTE baseline emission rates for years 2000-2002 with SO2 emissions reduced by 90% over pre-control baseline for the future PTE case. Basic SOFA+SNCR NOX impacts are from PTE heat input emission rates. Control costs are levelized annual values for
95 8/11/2009
installed capital + O&M for basic SOFA+ SNCR NOX control. All cost figures in 2005 dollars. See Table 2.4-6 for details.
(3) - Average predicted incremental visibility impairment impact reductions (90th percentile) relative to basic SOFA NOX PTE emission rates for years 2000-2002 with SO2 emissions reduced by 90% over pre-control baseline for the future PTE case. Basic SOFA and basic SOFA with SNCR NOX impacts are from PTE heat input emission rates. Incremental control costs are levelized annual values for installed capital + O&M for basic SOFA with SNCR control vs basic SOFA NOX control. All cost figures in 2005 dollars. See Table 2.4-6 for details.
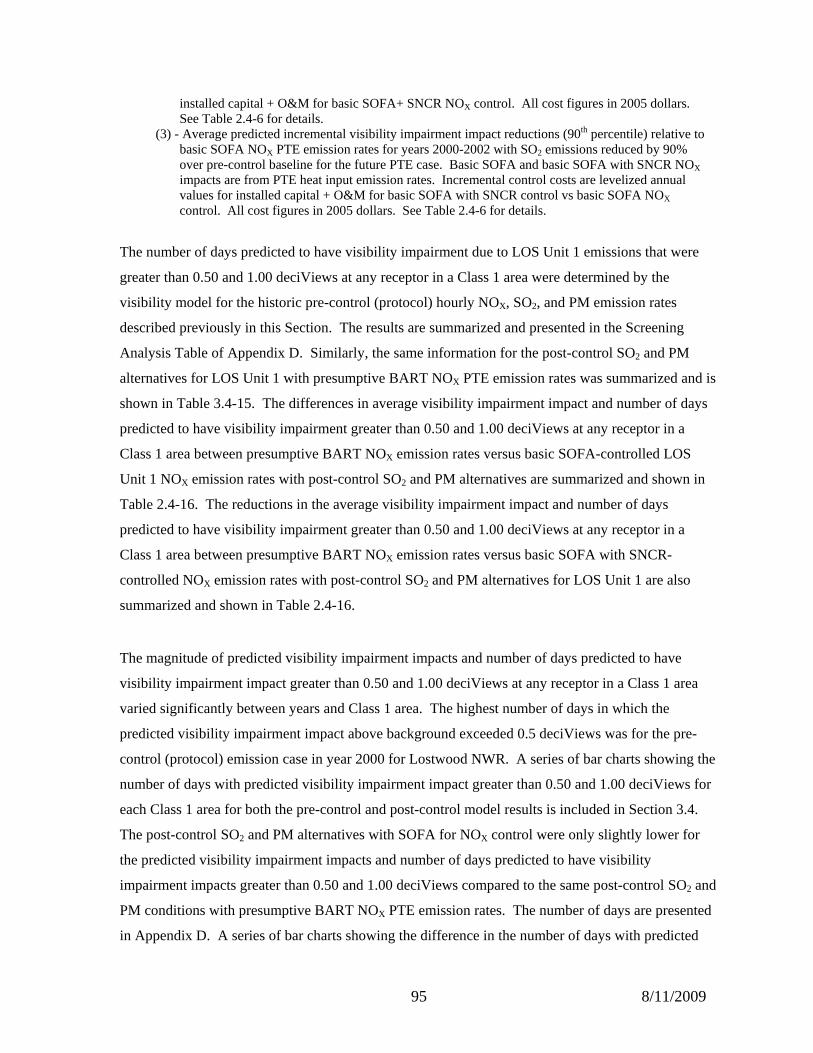
The number of days predicted to have visibility impairment due to LOS Unit 1 emissions that were
greater than 0.50 and 1.00 deciViews at any receptor in a Class 1 area were determined by the
visibility model for the historic pre-control (protocol) hourly NOX, SO2, and PM emission rates
described previously in this Section. The results are summarized and presented in the Screening
Analysis Table of Appendix D. Similarly, the same information for the post-control SO2 and PM
alternatives for LOS Unit 1 with presumptive BART NOX PTE emission rates was summarized and is
shown in Table 3.4-15. The differences in average visibility impairment impact and number of days
predicted to have visibility impairment greater than 0.50 and 1.00 deciViews at any receptor in a
Class 1 area between presumptive BART NOX emission rates versus basic SOFA-controlled LOS
Unit 1 NOX emission rates with post-control SO2 and PM alternatives are summarized and shown in
Table 2.4-16. The reductions in the average visibility impairment impact and number of days
predicted to have visibility impairment greater than 0.50 and 1.00 deciViews at any receptor in a
Class 1 area between presumptive BART NOX emission rates versus basic SOFA with SNCR-
controlled NOX emission rates with post-control SO2 and PM alternatives for LOS Unit 1 are also
summarized and shown in Table 2.4-16.
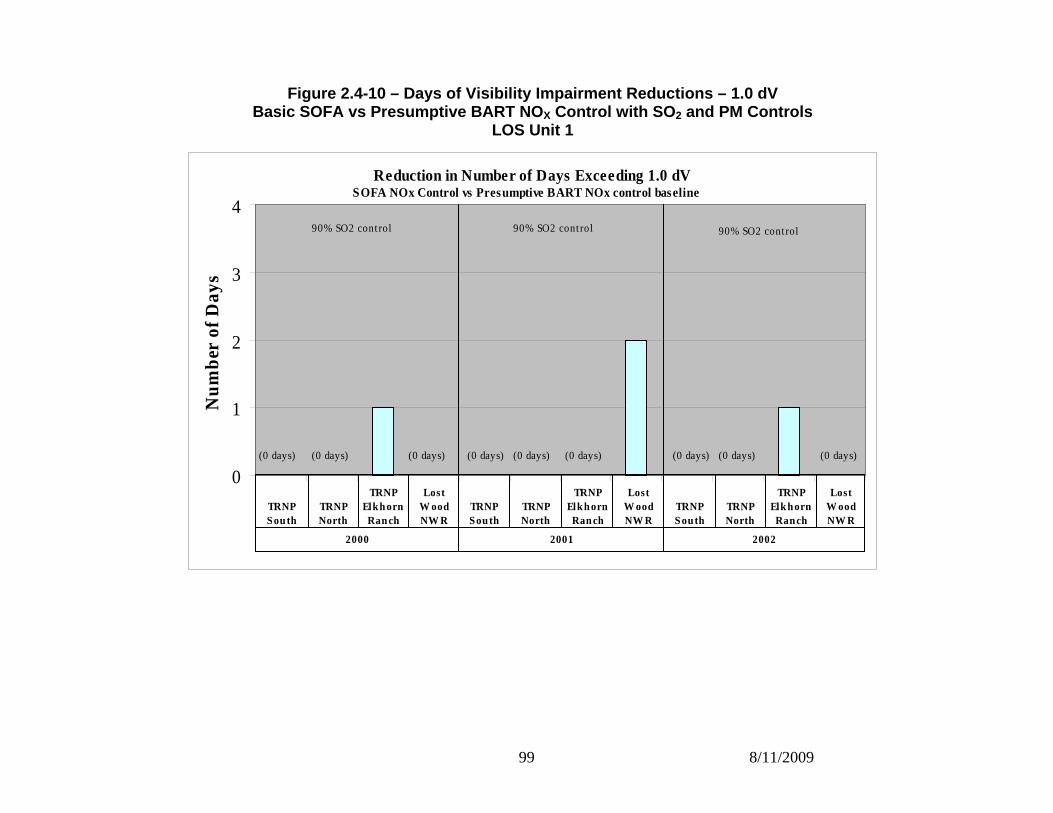
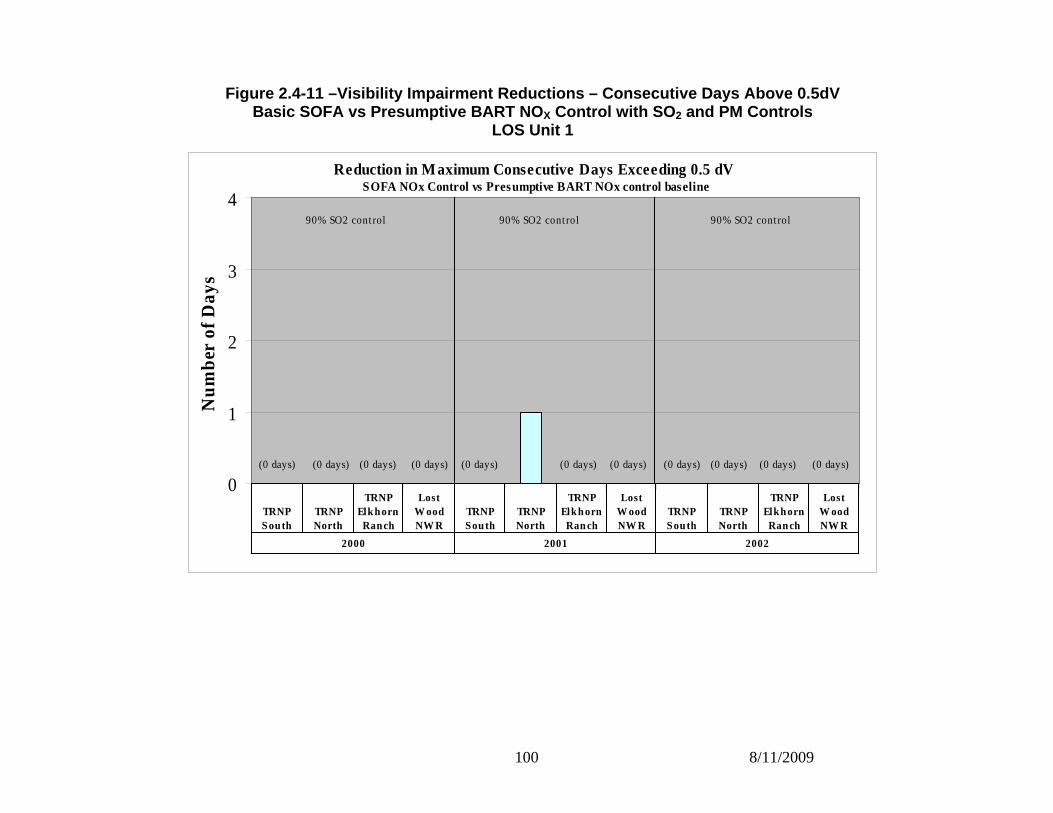
The magnitude of predicted visibility impairment impacts and number of days predicted to have
visibility impairment impact greater than 0.50 and 1.00 deciViews at any receptor in a Class 1 area
varied significantly between years and Class 1 area. The highest number of days in which the
predicted visibility impairment impact above background exceeded 0.5 deciViews was for the pre-
control (protocol) emission case in year 2000 for Lostwood NWR. A series of bar charts showing the
number of days with predicted visibility impairment impact greater than 0.50 and 1.00 deciViews for
each Class 1 area for both the pre-control and post-control model results is included in Section 3.4.
The post-control SO2 and PM alternatives with SOFA for NOX control were only slightly lower for
the predicted visibility impairment impacts and number of days predicted to have visibility
impairment impacts greater than 0.50 and 1.00 deciViews compared to the same post-control SO2 and
PM conditions with presumptive BART NOX PTE emission rates. The number of days are presented
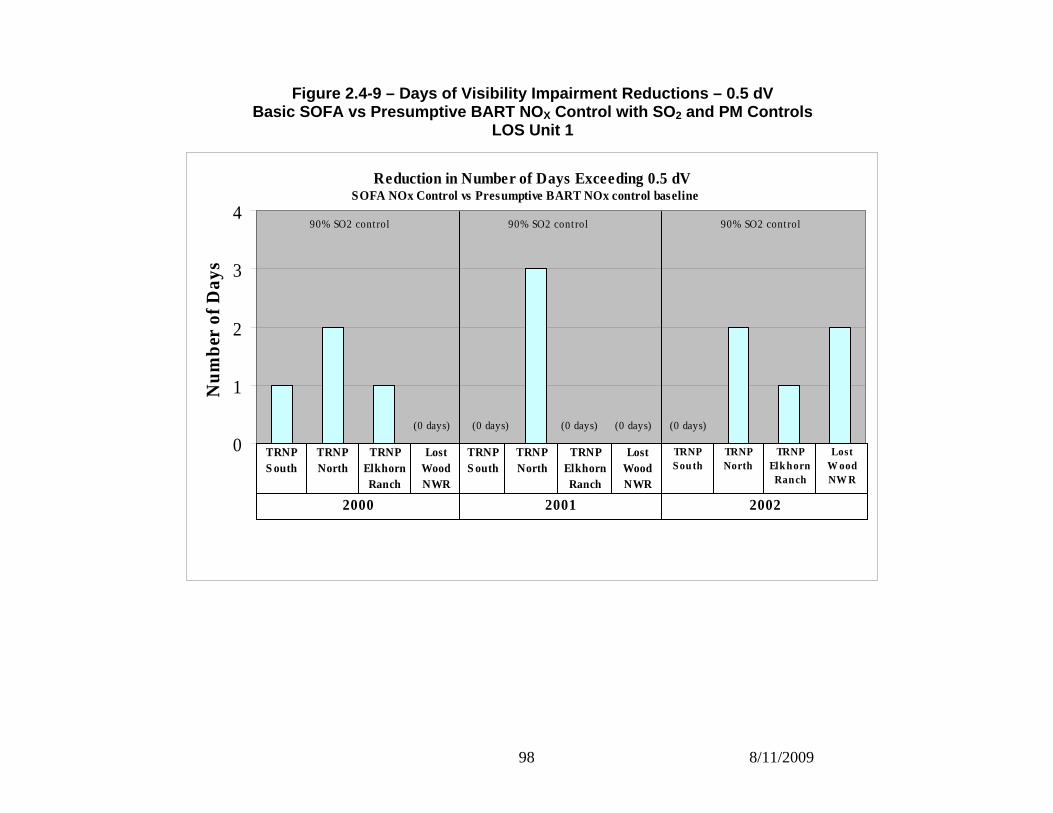
in Appendix D. A series of bar charts showing the difference in the number of days with predicted
96 8/11/2009
visibility impairment impact greater than 0.50 and 1.00 deciViews for each Class 1 area for the
SOFA-controlled PTE emission rates compared to presumptive BART NOX PTE emission rates with
post-control SO2 and PM alternatives is included in Figures 2.4-9, 2.4-10, and 2.4-11.
(The following article is a replacement of the same section in the August 2006 BEPC BART Determination Study final draft report)
2.4.5 SUMMARY OF IMPACTS OF LOS NO X CONTROLS – UNIT 1
Table 2.4-17 summarizes the various quantifiable impacts discussed in Sections 2.4.1 through 2.4.4
for the single BART NOX alternative evaluated for LOS Unit 1.
97 8/11/2009
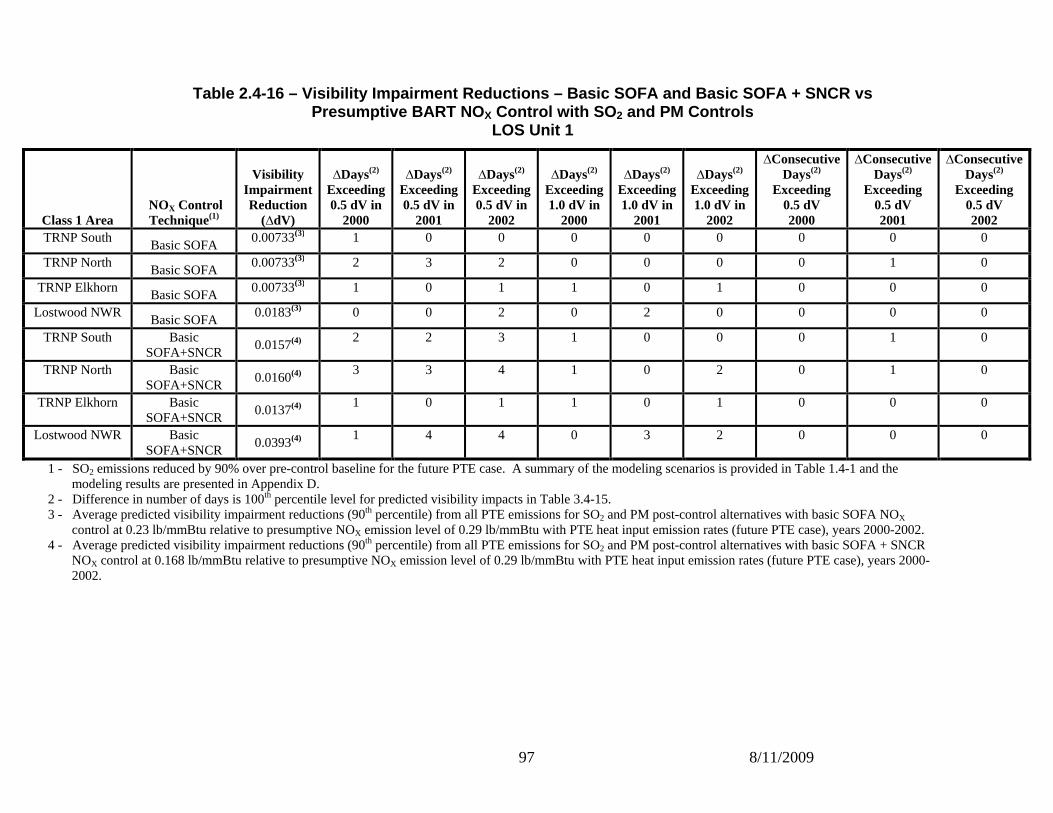
Table 2.4-16 – Visibility Impairment Reductions – B asic SOFA and Basic SOFA + SNCR vs Presumptive BART NO X Control with SO 2 and PM Controls
LOS Unit 1
Class 1 Area
NOX Control Technique(1)
Visibility Impairment Reduction
(∆dV)
∆Days(2) Exceeding 0.5 dV in
2000
∆Days(2) Exceeding 0.5 dV in
2001
∆Days(2) Exceeding 0.5 dV in
2002
∆Days(2) Exceeding 1.0 dV in
2000
∆Days(2) Exceeding 1.0 dV in
2001
∆Days(2) Exceeding 1.0 dV in
2002
∆Consecutive Days(2)
Exceeding 0.5 dV 2000
∆Consecutive Days(2)
Exceeding 0.5 dV 2001
∆Consecutive Days(2)
Exceeding 0.5 dV 2002
TRNP South Basic SOFA
0.00733(3) 1 0 0 0 0 0 0 0 0
TRNP North Basic SOFA
0.00733(3) 2 3 2 0 0 0 0 1 0
TRNP Elkhorn Basic SOFA
0.00733(3) 1 0 1 1 0 1 0 0 0
Lostwood NWR Basic SOFA
0.0183(3) 0 0 2 0 2 0 0 0 0
TRNP South Basic SOFA+SNCR
0.0157(4) 2 2 3 1 0 0 0 1 0
TRNP North Basic SOFA+SNCR
0.0160(4) 3 3 4 1 0 2 0 1 0
TRNP Elkhorn Basic SOFA+SNCR
0.0137(4) 1 0 1 1 0 1 0 0 0
Lostwood NWR Basic SOFA+SNCR
0.0393(4) 1 4 4 0 3 2 0 0 0
1 - SO2 emissions reduced by 90% over pre-control baseline for the future PTE case. A summary of the modeling scenarios is provided in Table 1.4-1 and the modeling results are presented in Appendix D.
2 - Difference in number of days is 100th percentile level for predicted visibility impacts in Table 3.4-15. 3 - Average predicted visibility impairment reductions (90th percentile) from all PTE emissions for SO2 and PM post-control alternatives with basic SOFA NOX
control at 0.23 lb/mmBtu relative to presumptive NOX emission level of 0.29 lb/mmBtu with PTE heat input emission rates (future PTE case), years 2000-2002. 4 - Average predicted visibility impairment reductions (90th percentile) from all PTE emissions for SO2 and PM post-control alternatives with basic SOFA + SNCR
NOX control at 0.168 lb/mmBtu relative to presumptive NOX emission level of 0.29 lb/mmBtu with PTE heat input emission rates (future PTE case), years 2000-2002.
98 8/11/2009
Figure 2.4-9 – Days of Visibility Impairment Reduct ions – 0.5 dV Basic SOFA vs Presumptive BART NO X Control with SO 2 and PM Controls
LOS Unit 1
Reduction in Number of Days Exceeding 0.5 dV
0
1
2
3
4N
um
ber
of D
ays
2000 2001 2002
TRNPS outh
TRNPNorth
TRNPElkhorn Ranch
Lost Wood NWR
TRNPS outh
TRNPNorth
TRNPElkhorn Ranch
Lost Wood NWR
TRNP Sou th
TRNP North
TRNP Elkhorn Ranch
Lost W ood NW R
SOFA NOx Control vs Presumptive BART NOx control baseline
90% SO2 control 90% SO2 control90% SO2 control
(0 days) (0 days) (0 days) (0 days)(0 days)
99 8/11/2009
Figure 2.4-10 – Days of Visibility Impairment Reduc tions – 1.0 dV Basic SOFA vs Presumptive BART NO X Control with SO 2 and PM Controls
LOS Unit 1
Reduction in Number of Days Exceeding 1.0 dV
0
1
2
3
4N
um
ber
of D
ays
TRNP Sou th
TRNP North
TRNP Elkhorn Ranch
Lost W ood NW R
TRNP Sou th
TRNP North
TRNP Elkhorn Ranch
Lost W ood NW R
TRNP South
TRNP North
TRNP Elkhorn Ranch
Lost W ood NW R
2000 2001 2002
SOFA NOx Control vs Presumptive BART NOx control baseline
90% SO2 control 90% SO2 control90% SO2 control
(0 days)(0 days)(0 days)(0 days)(0 days)(0 days) (0 days)(0 days)(0 days)
100 8/11/2009
Figure 2.4-11 –Visibility Impairment Reductions – C onsecutive Days Above 0.5dV Basic SOFA vs Presumptive BART NO X Control with SO 2 and PM Controls
LOS Unit 1
Reduction in Maximum Consecutive Days Exceeding 0.5 dV
0
1
2
3
4N
um
ber
of D
ays
TRNP South
TRNP North
TRNP Elkhorn Ranch
Lost W ood NW R
TRNP Sou th
TRNP North
TRNP Elkhorn Ranch
Lost W ood NW R
TRNP South
TRNP North
TRNP Elkhorn Ranch
Lost W ood NW R
2000 2001 2002
SOFA NOx Control vs Presumptive BART NOx control baseline
90% SO2 control90% SO2 control90% SO2 control
(0 days) (0 days) (0 days) (0 days) (0 days) (0 days) (0 days) (0 days) (0 days) (0 days) (0 days)
101 8/11/2009
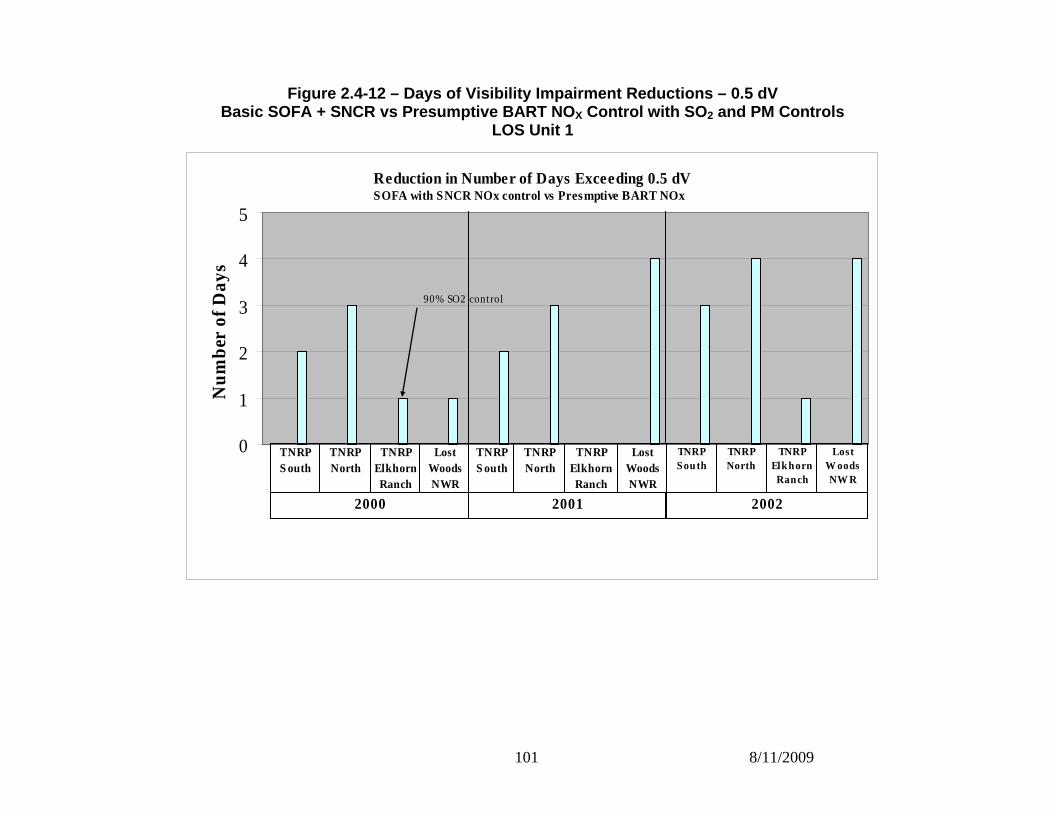
Figure 2.4-12 – Days of Visibility Impairment Reduc tions – 0.5 dV Basic SOFA + SNCR vs Presumptive BART NO X Control with SO 2 and PM Controls
LOS Unit 1
Reduction in Number of Days Exceeding 0.5 dV
0
1
2
3
4
5N
um
ber
of D
ays
2000 2001 2002
TNRPS outh
TNRPNorth
TNRPElkhorn Ranch
Lost Woods NWR
TNRPS outh
TNRPNorth
TNRPElkhorn Ranch
Lost Woods NWR
TNRP Sou th
TNRP North
TNRP Elkhorn Ranch
Lost W oods NW R
SOFA with SNCR NOx control vs Presmptive BART NOx
90% SO2 control
102 8/11/2009
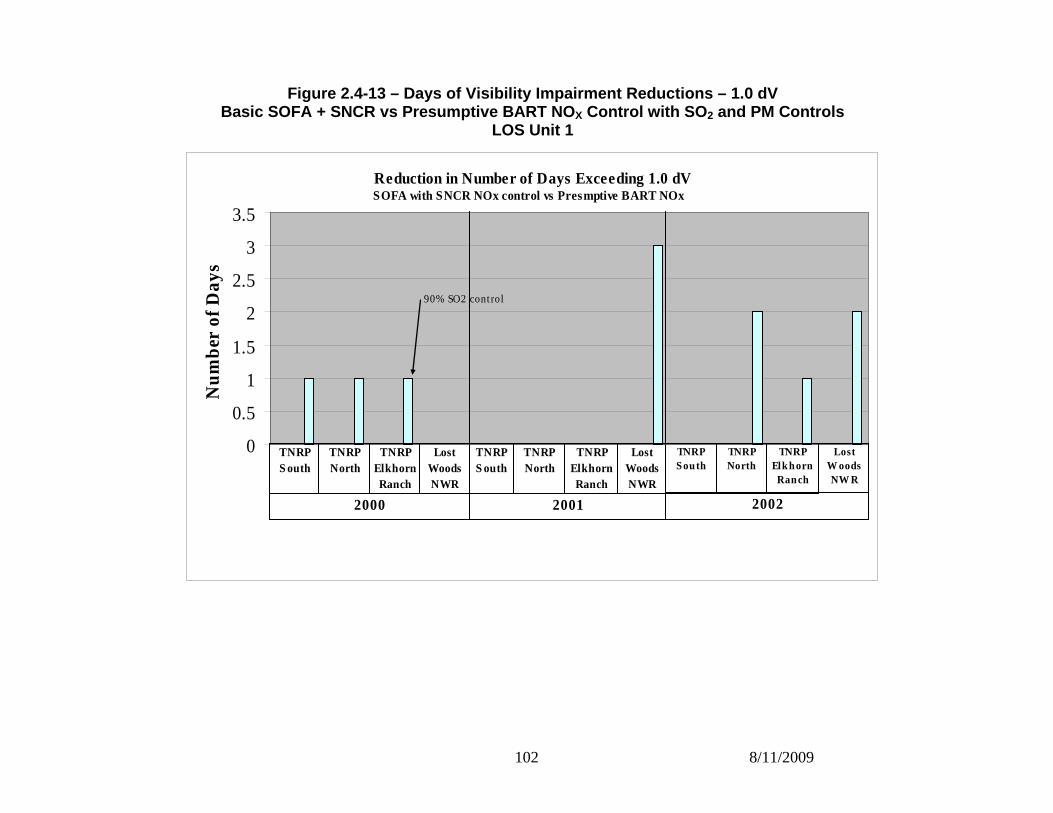
Figure 2.4-13 – Days of Visibility Impairment Reduc tions – 1.0 dV Basic SOFA + SNCR vs Presumptive BART NO X Control with SO 2 and PM Controls
LOS Unit 1
Reduction in Number of Days Exceeding 1.0 dV
0
0.5
1
1.5
2
2.5
3
3.5N
um
ber
of D
ays
2000 2001 2002
TNRPS outh
TNRPNorth
TNRPElkhorn Ranch
Lost Woods NWR
TNRPS outh
TNRPNorth
TNRPElkhorn Ranch
Lost Woods NWR
TNRP South
TNRP North
TNRP Elkhorn Ranch
Lost W oods NW R
SOFA with SNCR NOx control vs Presmptive BART NOx
90% SO2 control
103 8/11/2009
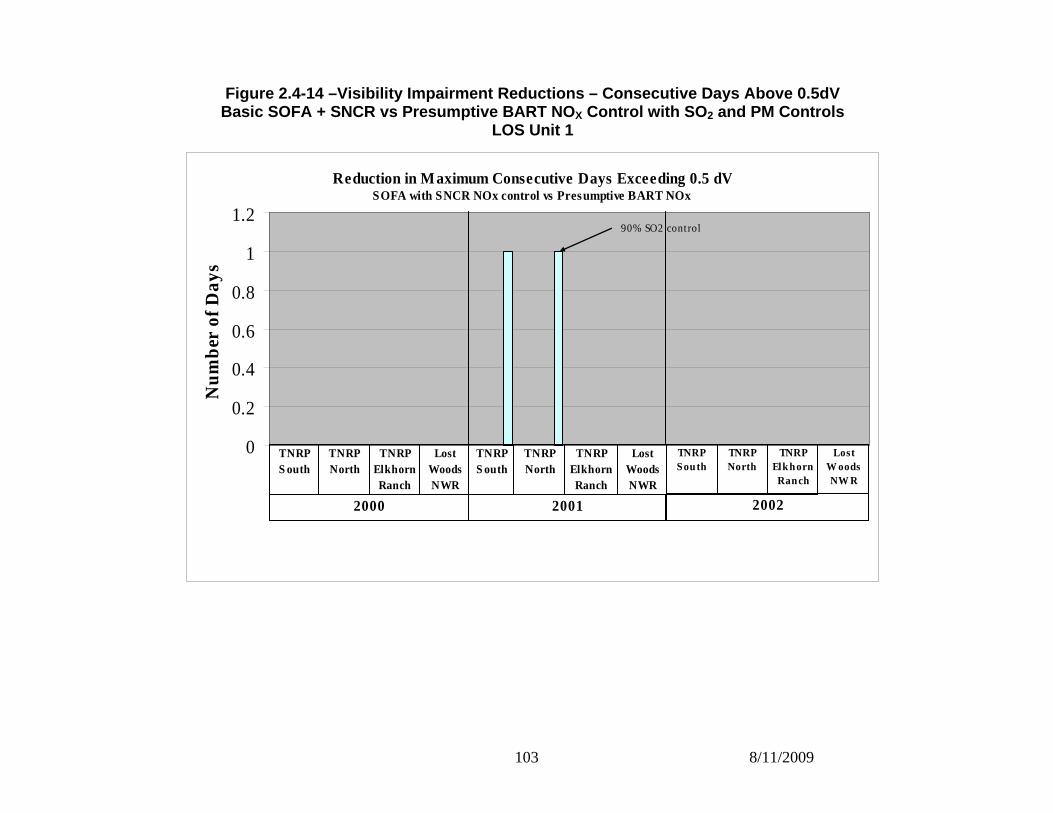
Figure 2.4-14 –Visibility Impairment Reductions – C onsecutive Days Above 0.5dV Basic SOFA + SNCR vs Presumptive BART NO X Control with SO 2 and PM Controls
LOS Unit 1
Reduction in Maximum Consecutive Days Exceeding 0.5 dV
0
0.2
0.4
0.6
0.8
1
1.2N
um
ber
of D
ays
2000 2001 2002
TNRPS outh
TNRPNorth
TNRPElkhorn Ranch
Lost Woods NWR
TNRPS outh
TNRPNorth
TNRPElkhorn Ranch
Lost Woods NWR
TNRP South
TNRP North
TNRP Elkhorn Ranch
Lost W oods NW R
SOFA with SNCR NOx control vs Presumptive BART NOx
90% SO2 control
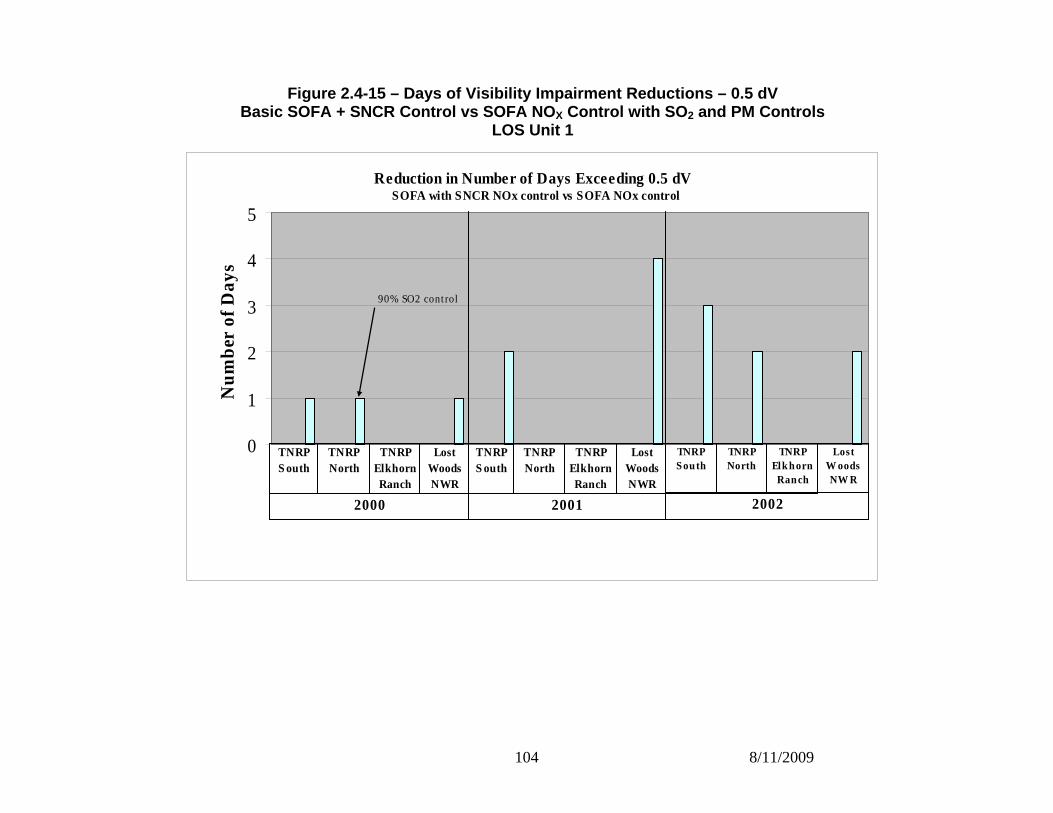
104 8/11/2009
Figure 2.4-15 – Days of Visibility Impairment Reduc tions – 0.5 dV Basic SOFA + SNCR Control vs SOFA NO X Control with SO 2 and PM Controls
LOS Unit 1
Reduction in Number of Days Exceeding 0.5 dV
0
1
2
3
4
5N
um
ber
of D
ays
2000 2001 2002
TNRPS outh
TNRPNorth
TNRPElkhorn Ranch
Lost Woods NWR
TNRPS outh
TNRPNorth
TNRPElkhorn Ranch
Lost Woods NWR
TNRP South
TNRP North
TNRP Elkhorn Ranch
Lost W oods NW R
SOFA with SNCR NOx control vs SOFA NOx control
90% SO2 control
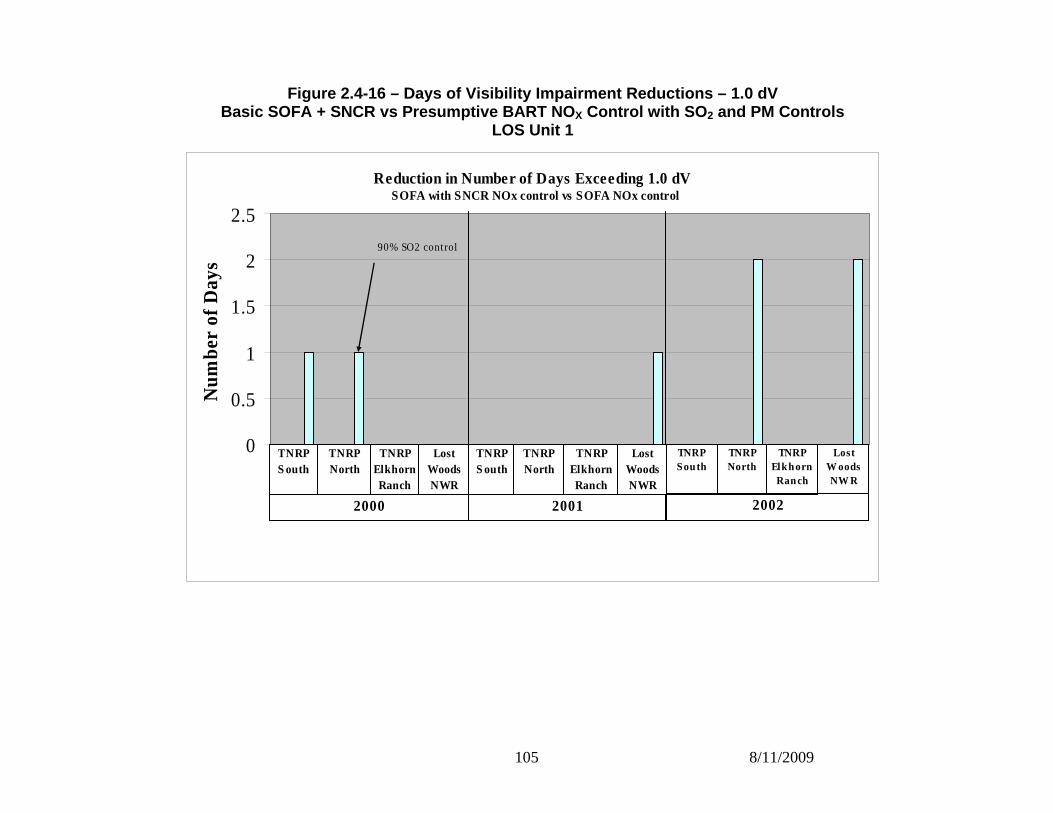
105 8/11/2009
Figure 2.4-16 – Days of Visibility Impairment Reduc tions – 1.0 dV Basic SOFA + SNCR vs Presumptive BART NO X Control with SO 2 and PM Controls
LOS Unit 1
Reduction in Number of Days Exceeding 1.0 dV
0
0.5
1
1.5
2
2.5N
umbe
r of
Day
s
2000 2001 2002
TNRPS outh
TNRPNorth
TNRPElkhorn Ranch
Lost Woods NWR
TNRPS outh
TNRPNorth
TNRPElkhorn Ranch
Lost Woods NWR
TNRP South
TNRP North
TNRP Elkhorn Ranch
Lost W oods NW R
SOFA with SNCR NOx control vs SOFA NOx control
90% SO2 control
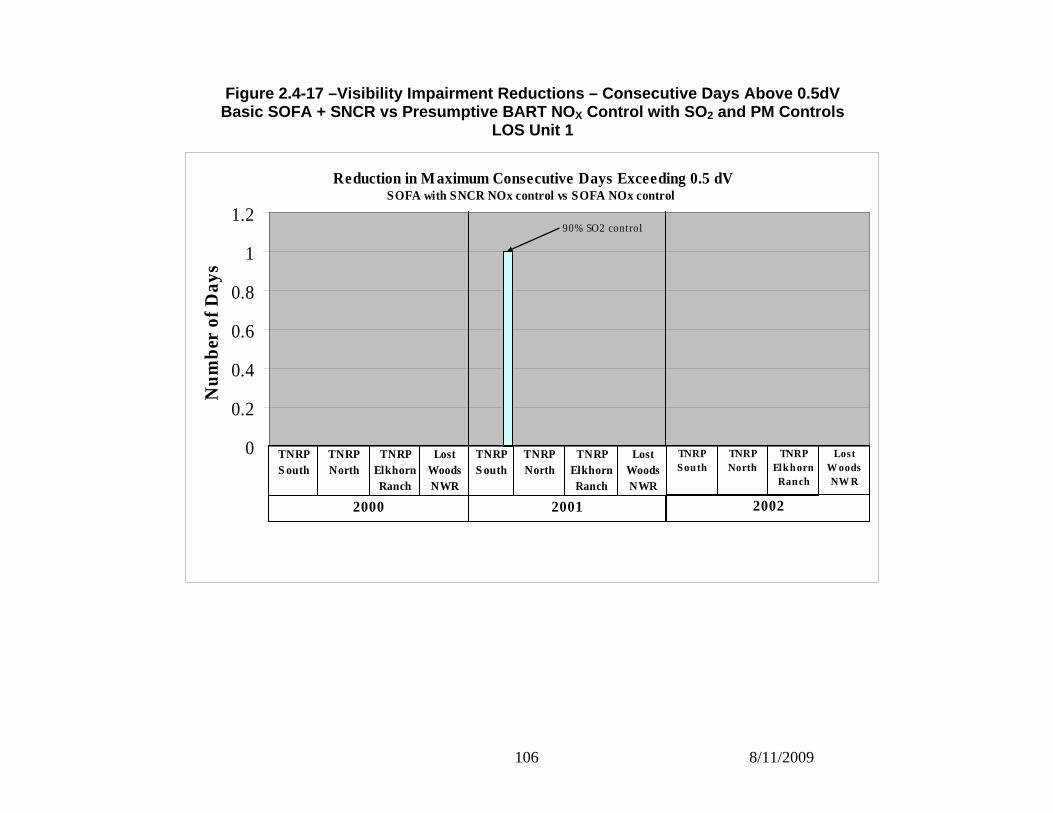
106 8/11/2009
Figure 2.4-17 –Visibility Impairment Reductions – C onsecutive Days Above 0.5dV Basic SOFA + SNCR vs Presumptive BART NO X Control with SO 2 and PM Controls
LOS Unit 1
Reduction in Maximum Consecutive Days Exceeding 0.5 dV
0
0.2
0.4
0.6
0.8
1
1.2N
um
ber
of D
ays
2000 2001 2002
TNRPS outh
TNRPNorth
TNRPElkhorn Ranch
Lost Woods NWR
TNRPS outh
TNRPNorth
TNRPElkhorn Ranch
Lost Woods NWR
TNRP South
TNRP North
TNRP Elkhorn Ranch
Lost W oods NW R
SOFA with SNCR NOx control vs SOFA NOx control
90% SO2 control
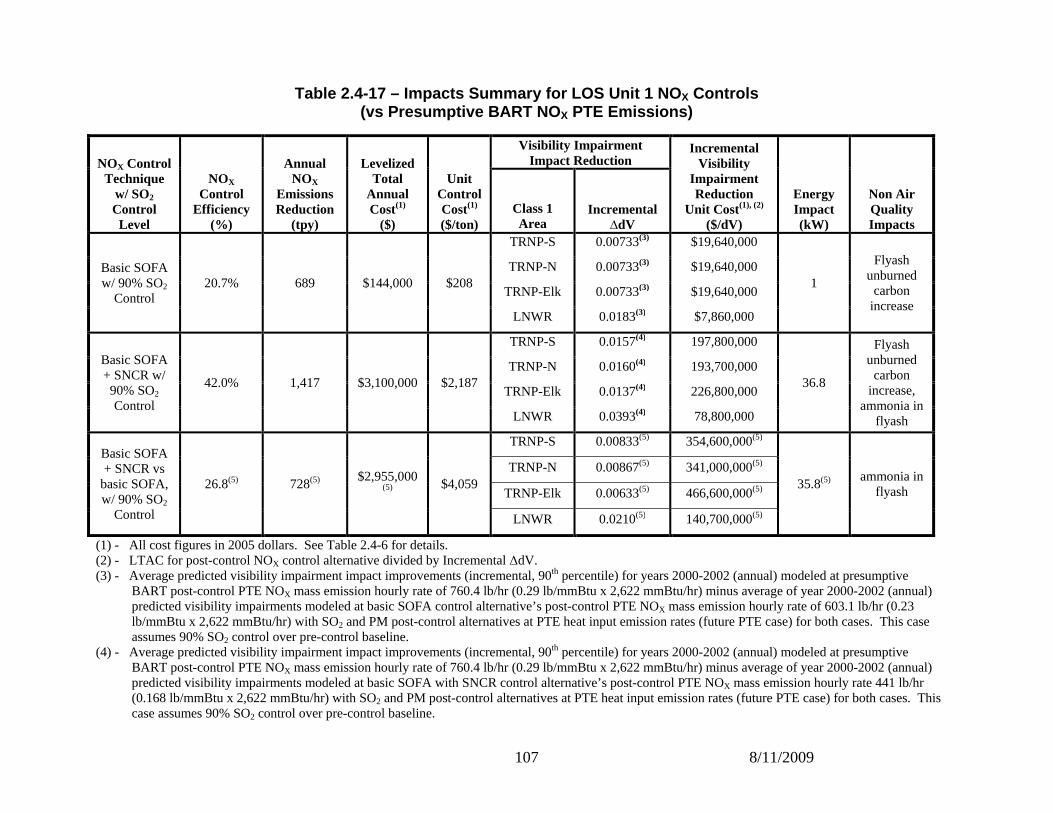
107 8/11/2009
Table 2.4-17 – Impacts Summary for LOS Unit 1 NO X Controls (vs Presumptive BART NO X PTE Emissions)
(1) - All cost figures in 2005 dollars. See Table 2.4-6 for details. (2) - LTAC for post-control NOX control alternative divided by Incremental ∆dV. (3) - Average predicted visibility impairment impact improvements (incremental, 90th percentile) for years 2000-2002 (annual) modeled at presumptive
BART post-control PTE NOX mass emission hourly rate of 760.4 lb/hr (0.29 lb/mmBtu x 2,622 mmBtu/hr) minus average of year 2000-2002 (annual) predicted visibility impairments modeled at basic SOFA control alternative’s post-control PTE NOX mass emission hourly rate of 603.1 lb/hr (0.23 lb/mmBtu x 2,622 mmBtu/hr) with SO2 and PM post-control alternatives at PTE heat input emission rates (future PTE case) for both cases. This case assumes 90% SO2 control over pre-control baseline.
(4) - Average predicted visibility impairment impact improvements (incremental, 90th percentile) for years 2000-2002 (annual) modeled at presumptive BART post-control PTE NOX mass emission hourly rate of 760.4 lb/hr (0.29 lb/mmBtu x 2,622 mmBtu/hr) minus average of year 2000-2002 (annual) predicted visibility impairments modeled at basic SOFA with SNCR control alternative’s post-control PTE NOX mass emission hourly rate 441 lb/hr (0.168 lb/mmBtu x 2,622 mmBtu/hr) with SO2 and PM post-control alternatives at PTE heat input emission rates (future PTE case) for both cases. This case assumes 90% SO2 control over pre-control baseline.
NOX Control Technique
w/ SO2 Control Level
NOX Control
Efficiency (%)
Annual NOX
Emissions Reduction
(tpy)
Levelized Total
Annual Cost(1)
($)
Unit Control Cost(1) ($/ton)
Visibility Impairment Impact Reduction
Incremental Visibility
Impairment Reduction
Unit Cost(1), (2)
($/dV)
Energy Impact (kW)
Non Air Quality Impacts
Class 1 Area
Incremental
∆dV
Basic SOFA w/ 90% SO2
Control 20.7% 689 $144,000 $208
TRNP-S 0.00733(3) $19,640,000
1
Flyash unburned carbon increase
TRNP-N 0.00733(3) $19,640,000
TRNP-Elk 0.00733(3) $19,640,000
LNWR 0.0183(3) $7,860,000
Basic SOFA + SNCR w/ 90% SO2 Control
42.0% 1,417 $3,100,000 $2,187
TRNP-S 0.0157(4) 197,800,000
36.8
Flyash unburned carbon
increase, ammonia in
flyash
TRNP-N 0.0160(4) 193,700,000
TRNP-Elk 0.0137(4) 226,800,000
LNWR 0.0393(4) 78,800,000
Basic SOFA + SNCR vs basic SOFA, w/ 90% SO2
Control
26.8(5) 728(5) $2,955,000 (5) $4,059
TRNP-S 0.00833(5) 354,600,000(5)
35.8(5) ammonia in flyash
TRNP-N 0.00867(5) 341,000,000(5)
TRNP-Elk 0.00633(5) 466,600,000(5)
LNWR 0.0210(5) 140,700,000(5)
108 8/11/2009
(5) - Average predicted incremental visibility impairment impact improvements (incremental, 90th percentile) for years 2000-2002 (annual) modeled at SOFA post-control PTE NOX mass emission hourly rate of 603.1 lb/hr (0.23 lb/mmBtu x 2,622 mmBtu/hr) minus average of year 2000-2002 (annual) predicted visibility impairments modeled at basic SOFA with SNCR control alternative’s post-control PTE NOX mass emission hourly rate 441 lb/hr (0.168 lb/mmBtu x 2,622 mmBtu/hr) with SO2 and PM post-control alternatives at PTE heat input emission rates (future PTE case) for both cases. This case assumes 90% SO2 control over pre-control baseline.
109 8/11/2009
(The following article is a copy of the same section in the August 2006 BEPC BART Determination Study final draft report. It is included here for continuity from the corrected and amended Unit 1 portion of the BEPC BART Determination Study report and the corrected Unit 2 portion that follows)
2.5 EVALUATION OF IMPACTS FOR FEASIBLE NO X CONTROLS – LOS
UNIT 2
The fourth step of a BART analysis is to evaluate the following impacts of feasible emission controls:
♦ The cost of compliance.
♦ The energy impacts.
♦ The non-air quality environmental impacts.
♦ The remaining useful life of the source.
The purpose of the impacts evaluation is to determine if there are any energy, economic, non-air
quality environmental reasons, or aspects of the remaining useful life of the source, which would
eliminate the control technologies from consideration for Leland Olds Station Unit 2.
2.5.1 COST IMPACTS OF NOX CONTROLS – LOS UNIT 2
An evaluation was performed to determine the compliance costs of installing various feasible NOX
control alternatives on LOS Unit 2 boiler. This evaluation included estimates for:
• Capital costs;
• Fixed and variable operating and maintenance costs; and
• Levelized total annual costs
to engineer, procure, construct, install, startup, test, and place into commercial operation the
particular control technology. The results of this evaluation are summarized in Tables 2.5-1 through
2.5-8. From Step 3 of the BART analysis, compared with other similarly-effective NOX controls,
conventional gas reburn alternatives would have high expected capital costs for a natural gas supply
pipeline and on-going natural gas costs. Thus, otherwise technically feasible gas-consuming
alternatives are considered economically unattractive for application at LOS on the Unit 2 boiler.
Although the BART Guidelines prescribes following a “top down” analysis approach for BART
determination, the development of a least cost envelope with dominant controls1 [70 FR 39168]
clearly labels points with lower emissions reductions and total annual costs first, i.e. “A”, “B”, etc.
then proceeding with labeling and connecting points plotted further away from the zero emission
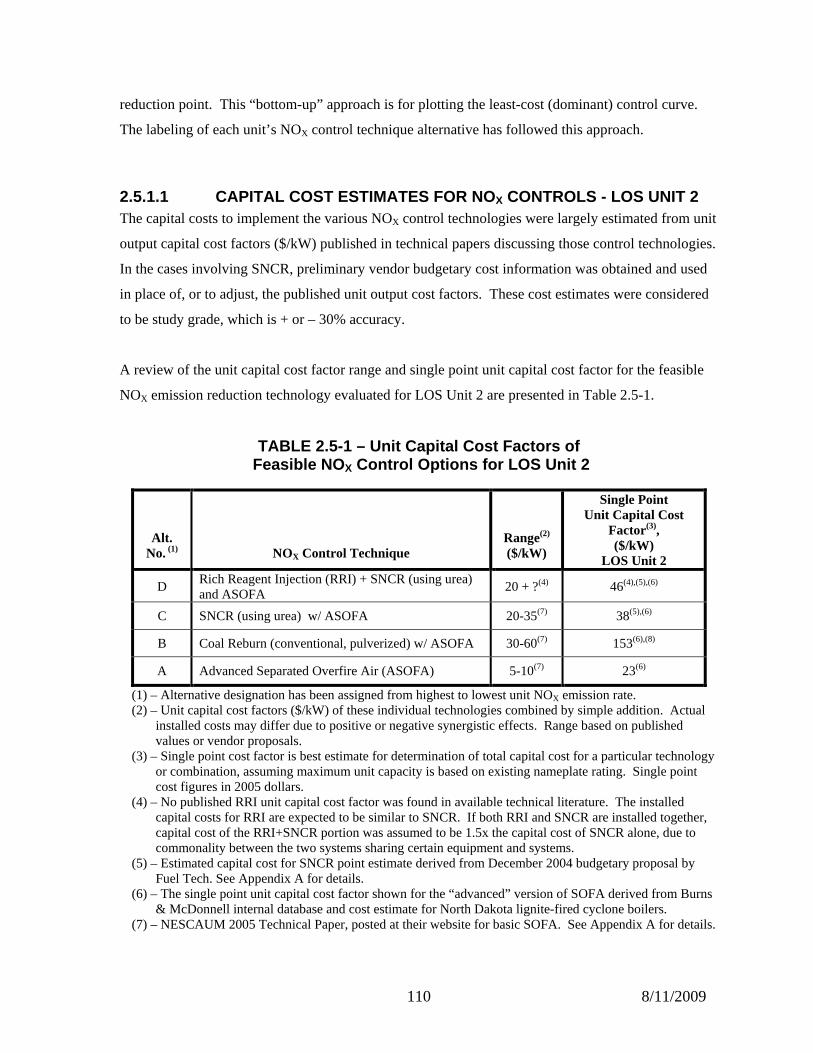
110 8/11/2009
reduction point. This “bottom-up” approach is for plotting the least-cost (dominant) control curve.
The labeling of each unit’s NOX control technique alternative has followed this approach.
2.5.1.1 CAPITAL COST ESTIMATES FOR NO X CONTROLS - LOS UNIT 2 The capital costs to implement the various NOX control technologies were largely estimated from unit
output capital cost factors ($/kW) published in technical papers discussing those control technologies.
In the cases involving SNCR, preliminary vendor budgetary cost information was obtained and used
in place of, or to adjust, the published unit output cost factors. These cost estimates were considered
to be study grade, which is + or – 30% accuracy.
A review of the unit capital cost factor range and single point unit capital cost factor for the feasible
NOX emission reduction technology evaluated for LOS Unit 2 are presented in Table 2.5-1.
TABLE 2.5-1 – Unit Capital Cost Factors of Feasible NO X Control Options for LOS Unit 2
Alt. No. (1)
NOX Control Technique
Range(2) ($/kW)
Single Point Unit Capital Cost
Factor(3), ($/kW)
LOS Unit 2
D Rich Reagent Injection (RRI) + SNCR (using urea) and ASOFA
20 + ?(4) 46(4),(5),(6)
C SNCR (using urea) w/ ASOFA 20-35(7) 38(5),(6)
B Coal Reburn (conventional, pulverized) w/ ASOFA 30-60(7) 153(6),(8)
A Advanced Separated Overfire Air (ASOFA) 5-10(7) 23(6)
(1) – Alternative designation has been assigned from highest to lowest unit NOX emission rate. (2) – Unit capital cost factors ($/kW) of these individual technologies combined by simple addition. Actual
installed costs may differ due to positive or negative synergistic effects. Range based on published values or vendor proposals.
(3) – Single point cost factor is best estimate for determination of total capital cost for a particular technology or combination, assuming maximum unit capacity is based on existing nameplate rating. Single point cost figures in 2005 dollars.
(4) – No published RRI unit capital cost factor was found in available technical literature. The installed capital costs for RRI are expected to be similar to SNCR. If both RRI and SNCR are installed together, capital cost of the RRI+SNCR portion was assumed to be 1.5x the capital cost of SNCR alone, due to commonality between the two systems sharing certain equipment and systems.
(5) – Estimated capital cost for SNCR point estimate derived from December 2004 budgetary proposal by Fuel Tech. See Appendix A for details.
(6) – The single point unit capital cost factor shown for the “advanced” version of SOFA derived from Burns & McDonnell internal database and cost estimate for North Dakota lignite-fired cyclone boilers.
(7) – NESCAUM 2005 Technical Paper, posted at their website for basic SOFA. See Appendix A for details.
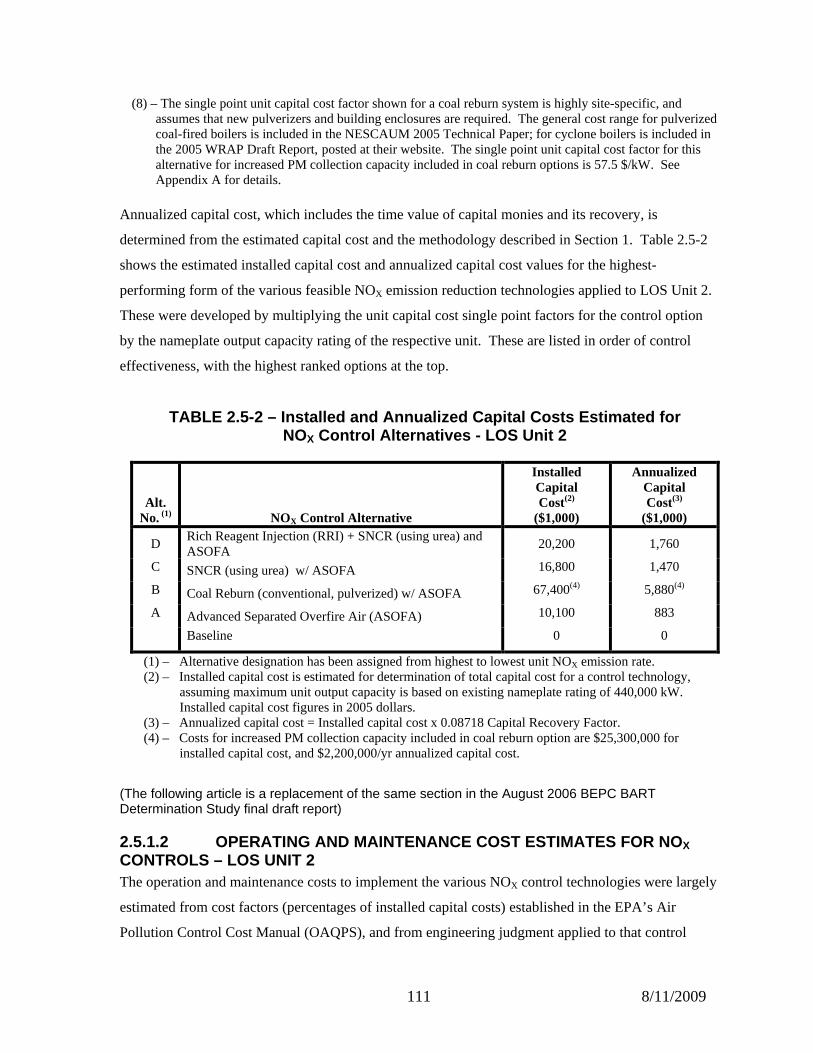
111 8/11/2009
(8) – The single point unit capital cost factor shown for a coal reburn system is highly site-specific, and assumes that new pulverizers and building enclosures are required. The general cost range for pulverized coal-fired boilers is included in the NESCAUM 2005 Technical Paper; for cyclone boilers is included in the 2005 WRAP Draft Report, posted at their website. The single point unit capital cost factor for this alternative for increased PM collection capacity included in coal reburn options is 57.5 $/kW. See Appendix A for details.
Annualized capital cost, which includes the time value of capital monies and its recovery, is
determined from the estimated capital cost and the methodology described in Section 1. Table 2.5-2
shows the estimated installed capital cost and annualized capital cost values for the highest-
performing form of the various feasible NOX emission reduction technologies applied to LOS Unit 2.
These were developed by multiplying the unit capital cost single point factors for the control option
by the nameplate output capacity rating of the respective unit. These are listed in order of control
effectiveness, with the highest ranked options at the top.
TABLE 2.5-2 – Installed and Annualized Capital Cost s Estimated for NOX Control Alternatives - LOS Unit 2
Alt. No. (1)
NOX Control Alternative
Installed Capital Cost(2)
($1,000)
Annualized Capital Cost(3)
($1,000)
D Rich Reagent Injection (RRI) + SNCR (using urea) and ASOFA
20,200 1,760
C SNCR (using urea) w/ ASOFA 16,800 1,470
B Coal Reburn (conventional, pulverized) w/ ASOFA 67,400(4) 5,880(4)
A Advanced Separated Overfire Air (ASOFA) 10,100 883
Baseline 0 0
(1) – Alternative designation has been assigned from highest to lowest unit NOX emission rate. (2) – Installed capital cost is estimated for determination of total capital cost for a control technology,
assuming maximum unit output capacity is based on existing nameplate rating of 440,000 kW. Installed capital cost figures in 2005 dollars.
(3) – Annualized capital cost = Installed capital cost x 0.08718 Capital Recovery Factor. (4) – Costs for increased PM collection capacity included in coal reburn option are $25,300,000 for
installed capital cost, and $2,200,000/yr annualized capital cost.
(The following article is a replacement of the same section in the August 2006 BEPC BART Determination Study final draft report)
2.5.1.2 OPERATING AND MAINTENANCE COST ESTIMATES FO R NOX CONTROLS – LOS UNIT 2 The operation and maintenance costs to implement the various NOX control technologies were largely
estimated from cost factors (percentages of installed capital costs) established in the EPA’s Air
Pollution Control Cost Manual (OAQPS), and from engineering judgment applied to that control
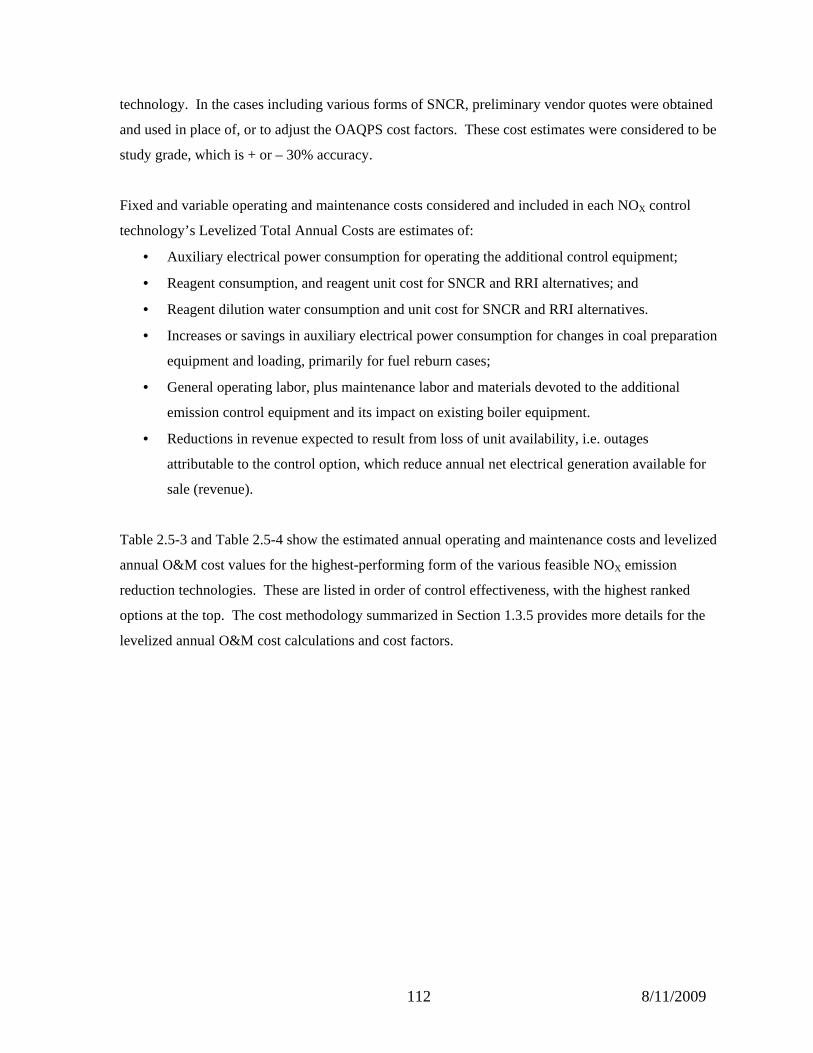
112 8/11/2009
technology. In the cases including various forms of SNCR, preliminary vendor quotes were obtained
and used in place of, or to adjust the OAQPS cost factors. These cost estimates were considered to be
study grade, which is + or – 30% accuracy.
Fixed and variable operating and maintenance costs considered and included in each NOX control
technology’s Levelized Total Annual Costs are estimates of:
• Auxiliary electrical power consumption for operating the additional control equipment;
• Reagent consumption, and reagent unit cost for SNCR and RRI alternatives; and
• Reagent dilution water consumption and unit cost for SNCR and RRI alternatives.
• Increases or savings in auxiliary electrical power consumption for changes in coal preparation
equipment and loading, primarily for fuel reburn cases;
• General operating labor, plus maintenance labor and materials devoted to the additional
emission control equipment and its impact on existing boiler equipment.
• Reductions in revenue expected to result from loss of unit availability, i.e. outages
attributable to the control option, which reduce annual net electrical generation available for
sale (revenue).
Table 2.5-3 and Table 2.5-4 show the estimated annual operating and maintenance costs and levelized
annual O&M cost values for the highest-performing form of the various feasible NOX emission
reduction technologies. These are listed in order of control effectiveness, with the highest ranked
options at the top. The cost methodology summarized in Section 1.3.5 provides more details for the
levelized annual O&M cost calculations and cost factors.
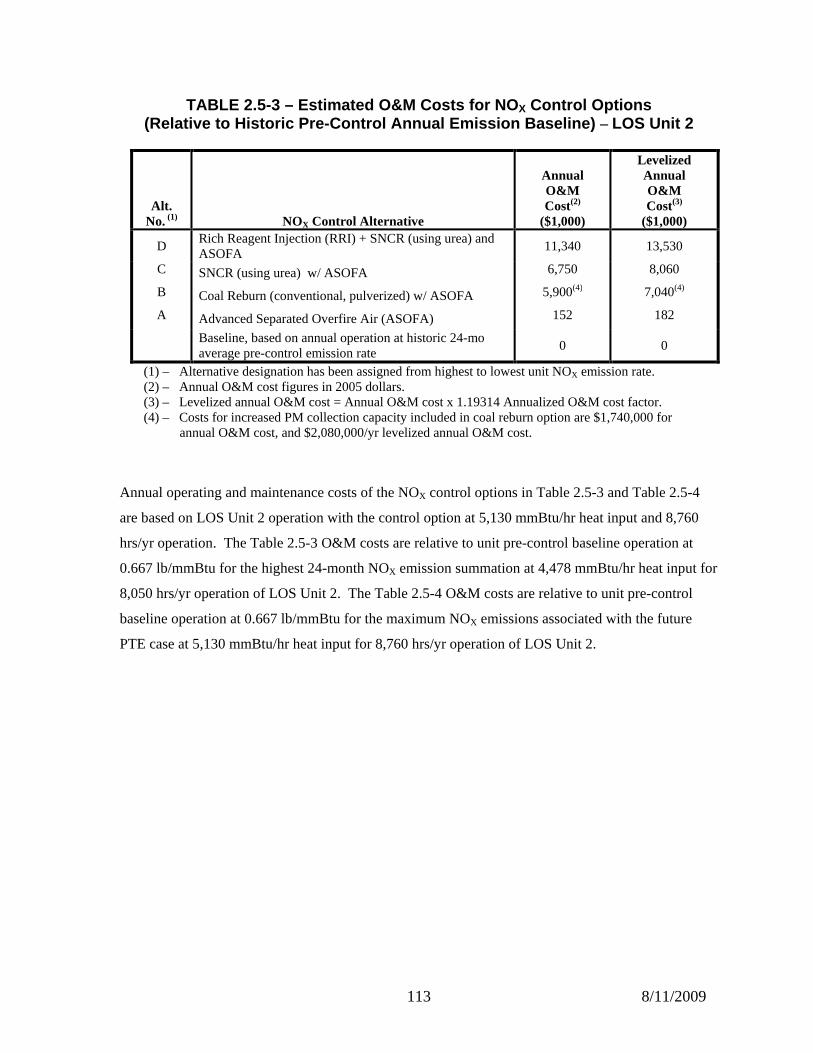
113 8/11/2009
TABLE 2.5-3 – Estimated O&M Costs for NO X Control Options (Relative to Historic Pre-Control Annual Emission B aseline) – LOS Unit 2
Alt. No. (1)
NOX Control Alternative
Annual O&M Cost(2)
($1,000)
Levelized Annual O&M Cost(3)
($1,000)
D Rich Reagent Injection (RRI) + SNCR (using urea) and ASOFA
11,340 13,530
C SNCR (using urea) w/ ASOFA 6,750 8,060
B Coal Reburn (conventional, pulverized) w/ ASOFA 5,900(4) 7,040(4)
A Advanced Separated Overfire Air (ASOFA) 152 182
Baseline, based on annual operation at historic 24-mo average pre-control emission rate
0 0
(1) – Alternative designation has been assigned from highest to lowest unit NOX emission rate. (2) – Annual O&M cost figures in 2005 dollars. (3) – Levelized annual O&M cost = Annual O&M cost x 1.19314 Annualized O&M cost factor. (4) – Costs for increased PM collection capacity included in coal reburn option are $1,740,000 for
annual O&M cost, and $2,080,000/yr levelized annual O&M cost.
Annual operating and maintenance costs of the NOX control options in Table 2.5-3 and Table 2.5-4
are based on LOS Unit 2 operation with the control option at 5,130 mmBtu/hr heat input and 8,760
hrs/yr operation. The Table 2.5-3 O&M costs are relative to unit pre-control baseline operation at
0.667 lb/mmBtu for the highest 24-month NOX emission summation at 4,478 mmBtu/hr heat input for
8,050 hrs/yr operation of LOS Unit 2. The Table 2.5-4 O&M costs are relative to unit pre-control
baseline operation at 0.667 lb/mmBtu for the maximum NOX emissions associated with the future
PTE case at 5,130 mmBtu/hr heat input for 8,760 hrs/yr operation of LOS Unit 2.
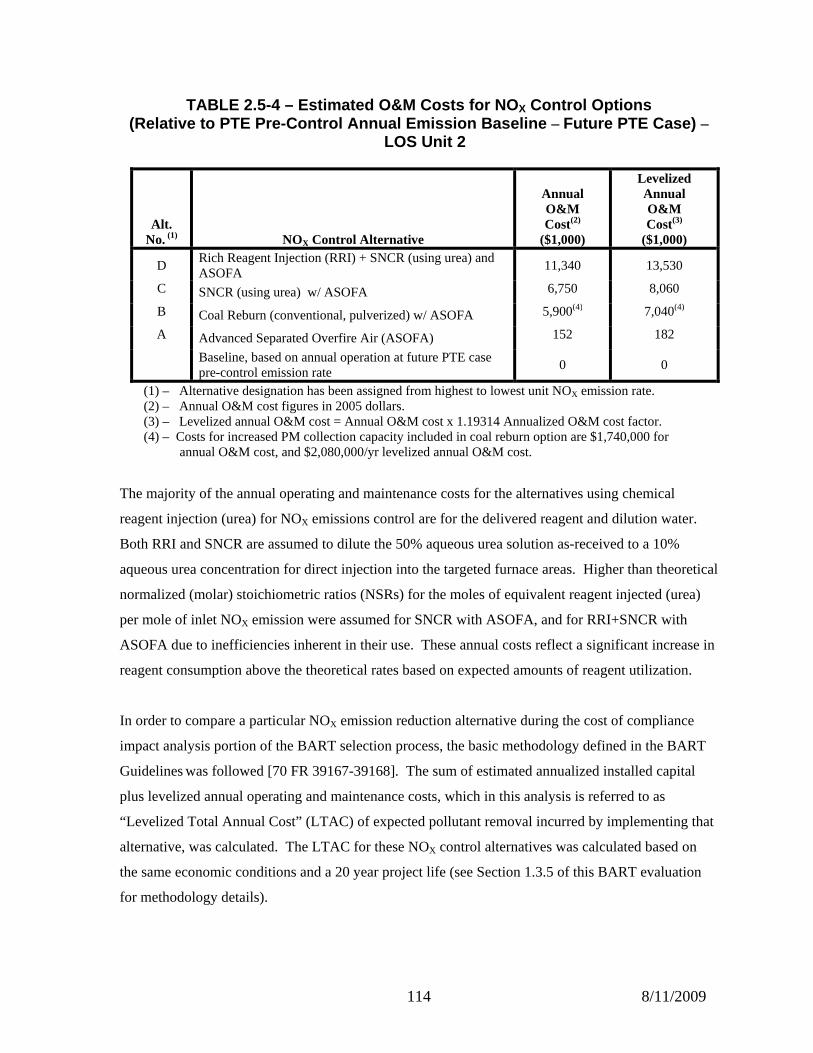
114 8/11/2009
TABLE 2.5-4 – Estimated O&M Costs for NO X Control Options (Relative to PTE Pre-Control Annual Emission Baseli ne – Future PTE Case) –
LOS Unit 2
Alt. No. (1)
NOX Control Alternative
Annual O&M Cost(2)
($1,000)
Levelized Annual O&M Cost(3)
($1,000)
D Rich Reagent Injection (RRI) + SNCR (using urea) and ASOFA
11,340 13,530
C SNCR (using urea) w/ ASOFA 6,750 8,060
B Coal Reburn (conventional, pulverized) w/ ASOFA 5,900(4) 7,040(4)
A Advanced Separated Overfire Air (ASOFA) 152 182
Baseline, based on annual operation at future PTE case pre-control emission rate
0 0
(1) – Alternative designation has been assigned from highest to lowest unit NOX emission rate. (2) – Annual O&M cost figures in 2005 dollars. (3) – Levelized annual O&M cost = Annual O&M cost x 1.19314 Annualized O&M cost factor. (4) – Costs for increased PM collection capacity included in coal reburn option are $1,740,000 for
annual O&M cost, and $2,080,000/yr levelized annual O&M cost.
The majority of the annual operating and maintenance costs for the alternatives using chemical
reagent injection (urea) for NOX emissions control are for the delivered reagent and dilution water.
Both RRI and SNCR are assumed to dilute the 50% aqueous urea solution as-received to a 10%
aqueous urea concentration for direct injection into the targeted furnace areas. Higher than theoretical
normalized (molar) stoichiometric ratios (NSRs) for the moles of equivalent reagent injected (urea)
per mole of inlet NOX emission were assumed for SNCR with ASOFA, and for RRI+SNCR with
ASOFA due to inefficiencies inherent in their use. These annual costs reflect a significant increase in
reagent consumption above the theoretical rates based on expected amounts of reagent utilization.
In order to compare a particular NOX emission reduction alternative during the cost of compliance
impact analysis portion of the BART selection process, the basic methodology defined in the BART
Guidelines was followed [70 FR 39167-39168]. The sum of estimated annualized installed capital
plus levelized annual operating and maintenance costs, which in this analysis is referred to as
“Levelized Total Annual Cost” (LTAC) of expected pollutant removal incurred by implementing that
alternative, was calculated. The LTAC for these NOX control alternatives was calculated based on
the same economic conditions and a 20 year project life (see Section 1.3.5 of this BART evaluation
for methodology details).
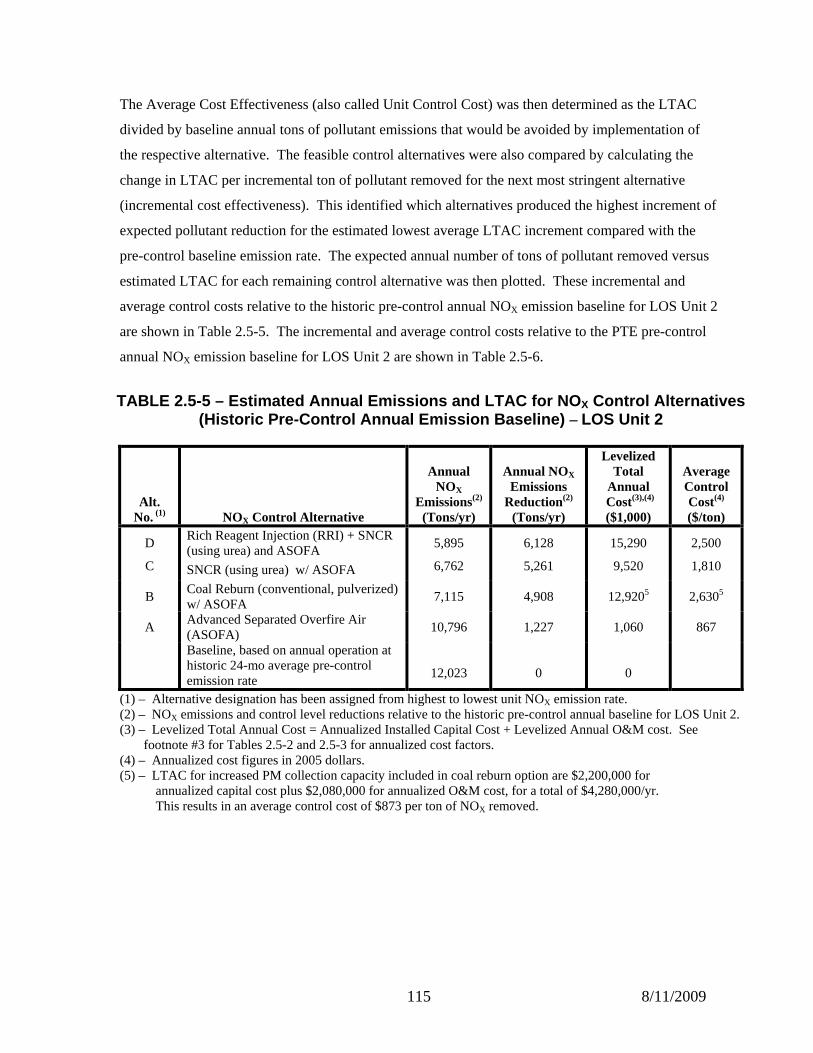
115 8/11/2009
The Average Cost Effectiveness (also called Unit Control Cost) was then determined as the LTAC
divided by baseline annual tons of pollutant emissions that would be avoided by implementation of
the respective alternative. The feasible control alternatives were also compared by calculating the
change in LTAC per incremental ton of pollutant removed for the next most stringent alternative
(incremental cost effectiveness). This identified which alternatives produced the highest increment of
expected pollutant reduction for the estimated lowest average LTAC increment compared with the
pre-control baseline emission rate. The expected annual number of tons of pollutant removed versus
estimated LTAC for each remaining control alternative was then plotted. These incremental and
average control costs relative to the historic pre-control annual NOX emission baseline for LOS Unit 2
are shown in Table 2.5-5. The incremental and average control costs relative to the PTE pre-control
annual NOX emission baseline for LOS Unit 2 are shown in Table 2.5-6.
TABLE 2.5-5 – Estimated Annual Emissions and LTAC f or NOX Control Alternatives
(Historic Pre-Control Annual Emission Baseline) – LOS Unit 2
Alt. No. (1)
NOX Control Alternative
Annual NOX
Emissions(2)
(Tons/yr)
Annual NOX Emissions
Reduction(2)
(Tons/yr)
Levelized Total
Annual Cost(3),(4)
($1,000)
Average Control Cost(4)
($/ton)
D Rich Reagent Injection (RRI) + SNCR (using urea) and ASOFA
5,895 6,128 15,290 2,500
C SNCR (using urea) w/ ASOFA 6,762 5,261 9,520 1,810
B Coal Reburn (conventional, pulverized) w/ ASOFA 7,115 4,908 12,9205 2,6305
A Advanced Separated Overfire Air (ASOFA)
10,796 1,227 1,060 867
Baseline, based on annual operation at historic 24-mo average pre-control emission rate
12,023 0 0
(1) – Alternative designation has been assigned from highest to lowest unit NOX emission rate. (2) – NOX emissions and control level reductions relative to the historic pre-control annual baseline for LOS Unit 2. (3) – Levelized Total Annual Cost = Annualized Installed Capital Cost + Levelized Annual O&M cost. See
footnote #3 for Tables 2.5-2 and 2.5-3 for annualized cost factors. (4) – Annualized cost figures in 2005 dollars. (5) – LTAC for increased PM collection capacity included in coal reburn option are $2,200,000 for
annualized capital cost plus $2,080,000 for annualized O&M cost, for a total of $4,280,000/yr. This results in an average control cost of $873 per ton of NOX removed.
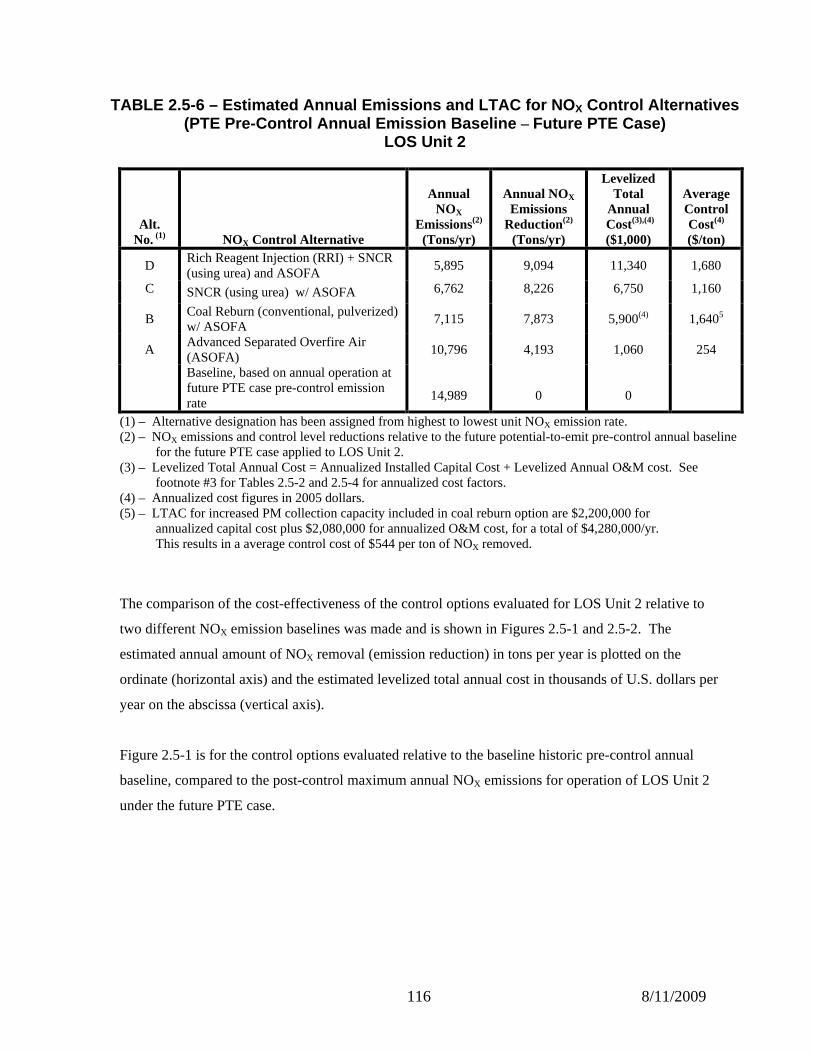
116 8/11/2009
TABLE 2.5-6 – Estimated Annual Emissions and LTAC f or NOX Control Alternatives (PTE Pre-Control Annual Emission Baseline – Future PTE Case)
LOS Unit 2
Alt. No. (1)
NOX Control Alternative
Annual NOX
Emissions(2)
(Tons/yr)
Annual NOX Emissions
Reduction(2)
(Tons/yr)
Levelized Total
Annual Cost(3),(4)
($1,000)
Average Control Cost(4)
($/ton)
D Rich Reagent Injection (RRI) + SNCR (using urea) and ASOFA
5,895 9,094 11,340 1,680
C SNCR (using urea) w/ ASOFA 6,762 8,226 6,750 1,160
B Coal Reburn (conventional, pulverized) w/ ASOFA 7,115 7,873 5,900(4) 1,6405
A Advanced Separated Overfire Air (ASOFA)
10,796 4,193 1,060 254
Baseline, based on annual operation at future PTE case pre-control emission rate
14,989 0 0
(1) – Alternative designation has been assigned from highest to lowest unit NOX emission rate. (2) – NOX emissions and control level reductions relative to the future potential-to-emit pre-control annual baseline
for the future PTE case applied to LOS Unit 2. (3) – Levelized Total Annual Cost = Annualized Installed Capital Cost + Levelized Annual O&M cost. See
footnote #3 for Tables 2.5-2 and 2.5-4 for annualized cost factors. (4) – Annualized cost figures in 2005 dollars. (5) – LTAC for increased PM collection capacity included in coal reburn option are $2,200,000 for
annualized capital cost plus $2,080,000 for annualized O&M cost, for a total of $4,280,000/yr. This results in a average control cost of $544 per ton of NOX removed.
The comparison of the cost-effectiveness of the control options evaluated for LOS Unit 2 relative to
two different NOX emission baselines was made and is shown in Figures 2.5-1 and 2.5-2. The
estimated annual amount of NOX removal (emission reduction) in tons per year is plotted on the
ordinate (horizontal axis) and the estimated levelized total annual cost in thousands of U.S. dollars per
year on the abscissa (vertical axis).
Figure 2.5-1 is for the control options evaluated relative to the baseline historic pre-control annual
baseline, compared to the post-control maximum annual NOX emissions for operation of LOS Unit 2
under the future PTE case.
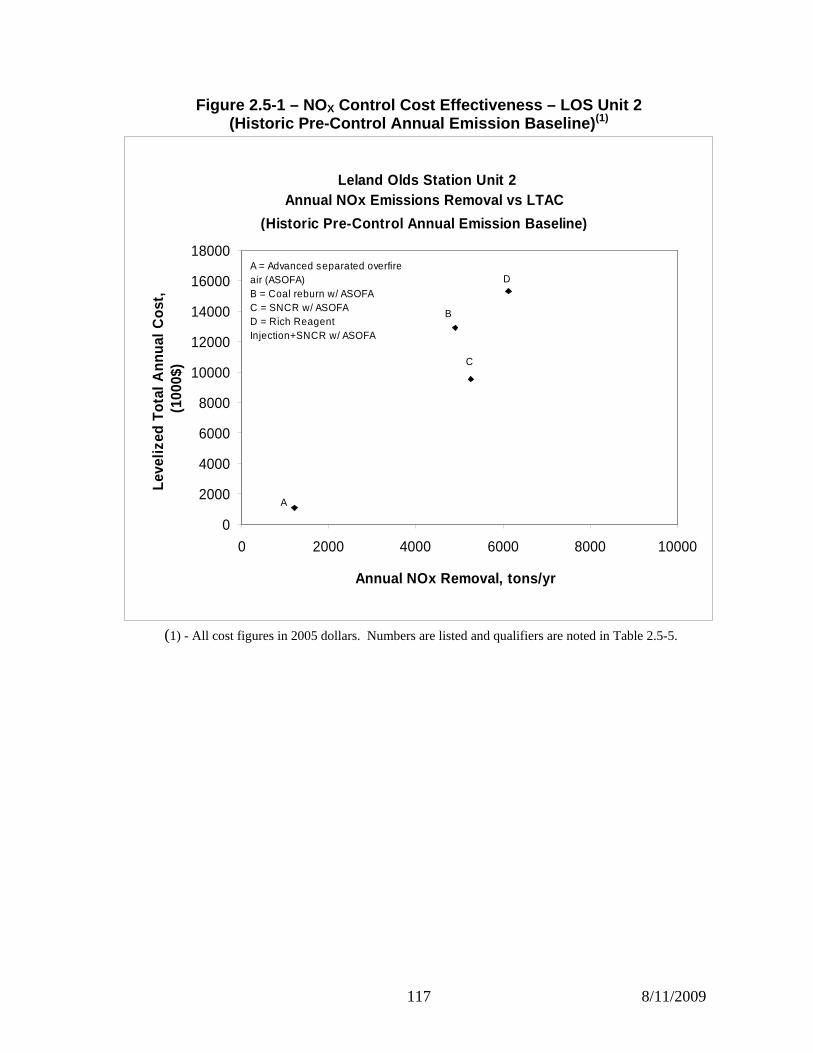
117 8/11/2009
Figure 2.5-1 – NO X Control Cost Effectiveness – LOS Unit 2 (Historic Pre-Control Annual Emission Baseline) (1)
Leland Olds Station Unit 2Annual NOx Emissions Removal vs LTAC
(Historic Pre-Control Annual Emission Baseline)
0
2000
4000
6000
8000
10000
12000
14000
16000
18000
0 2000 4000 6000 8000 10000
Annual NOx Removal, tons/yr
Leve
lized
Tot
al A
nnua
l Cos
t,(1
000$
)
A
B
D
C
A = Advanced separated overfire air (ASOFA)B = Coal reburn w/ ASOFAC = SNCR w/ ASOFAD = Rich Reagent Injection+SNCR w/ ASOFA
(1) - All cost figures in 2005 dollars. Numbers are listed and qualifiers are noted in Table 2.5-5.
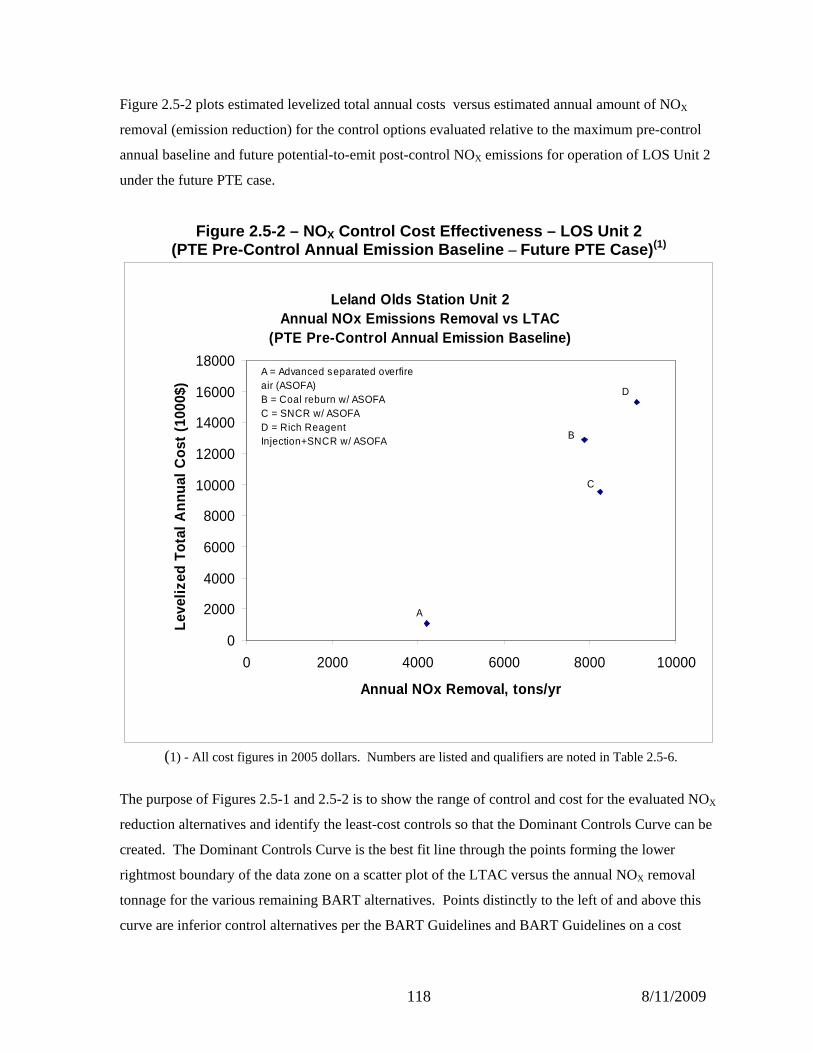
118 8/11/2009
Figure 2.5-2 plots estimated levelized total annual costs versus estimated annual amount of NOX
removal (emission reduction) for the control options evaluated relative to the maximum pre-control
annual baseline and future potential-to-emit post-control NOX emissions for operation of LOS Unit 2
under the future PTE case.
Figure 2.5-2 – NO X Control Cost Effectiveness – LOS Unit 2 (PTE Pre-Control Annual Emission Baseline – Future PTE Case) (1)
Leland Olds Station Unit 2 Annual NOx Emissions Removal vs LTAC
(PTE Pre-Control Annual Emission Baseline)
0
2000
4000
6000
8000
10000
12000
14000
16000
18000
0 2000 4000 6000 8000 10000
Annual NOx Removal, tons/yr
Leve
lized
Tot
al A
nnua
l Cos
t (10
00$)
A = Advanced separated overfire air (ASOFA)B = Coal reburn w/ ASOFAC = SNCR w/ ASOFA D = Rich Reagent Injection+SNCR w/ ASOFA
C
A
B
D
(1) - All cost figures in 2005 dollars. Numbers are listed and qualifiers are noted in Table 2.5-6.
The purpose of Figures 2.5-1 and 2.5-2 is to show the range of control and cost for the evaluated NOX
reduction alternatives and identify the least-cost controls so that the Dominant Controls Curve can be
created. The Dominant Controls Curve is the best fit line through the points forming the lower
rightmost boundary of the data zone on a scatter plot of the LTAC versus the annual NOX removal
tonnage for the various remaining BART alternatives. Points distinctly to the left of and above this
curve are inferior control alternatives per the BART Guidelines and BART Guidelines on a cost
119 8/11/2009
effectiveness basis. Following a “bottom-up” graphical comparison approach, each of the NOX control
technologies represented by a data point to the left of and above the least cost envelope should be
excluded from further analysis on a cost efficiency basis. Of the highest-performing versions of the
technically feasible LOS Unit 2 NOX control alternatives evaluated for cost-effectiveness, the data point
for coal reburn with ASOFA is seen to be more costly for fewer tons of NOX removed than for SNCR
with ASOFA. This appears to be an inferior control, and thus should not be included on the least cost
and Dominant Controls Curve boundary. Note that cost-effectiveness points for conventional gas
reburn and fuel-lean gas reburn alternatives would be distinctly left and significantly above the least
cost-control envelope, so these options were not included in the cost-effectiveness analysis.
The next step in the cost effectiveness analysis for the BART NOX control alternatives is to review
the incremental cost effectiveness between remaining least-cost alternatives. Figure 2.5-3 and Figure
2.5-4 contains a repetition of the levelized total annual cost and NOX control information from Figure
2.5-1 and Figure 2.5-2 with Point B removed, and shows the incremental cost effectiveness between
each successive set of least-cost NOX control alternatives. The incremental NOX control tons per
year, divided by the incremental levelized annual cost, yields an incremental average unit cost ($/ton).
This represents the slope of a line, if drawn, from one least-cost point as compared with another least-
cost point. This modified least-cost controls curve is the Dominant Controls Cost Curve for NOX
emissions alternatives for each of the LOS Unit 2 pre-control baselines evaluated.
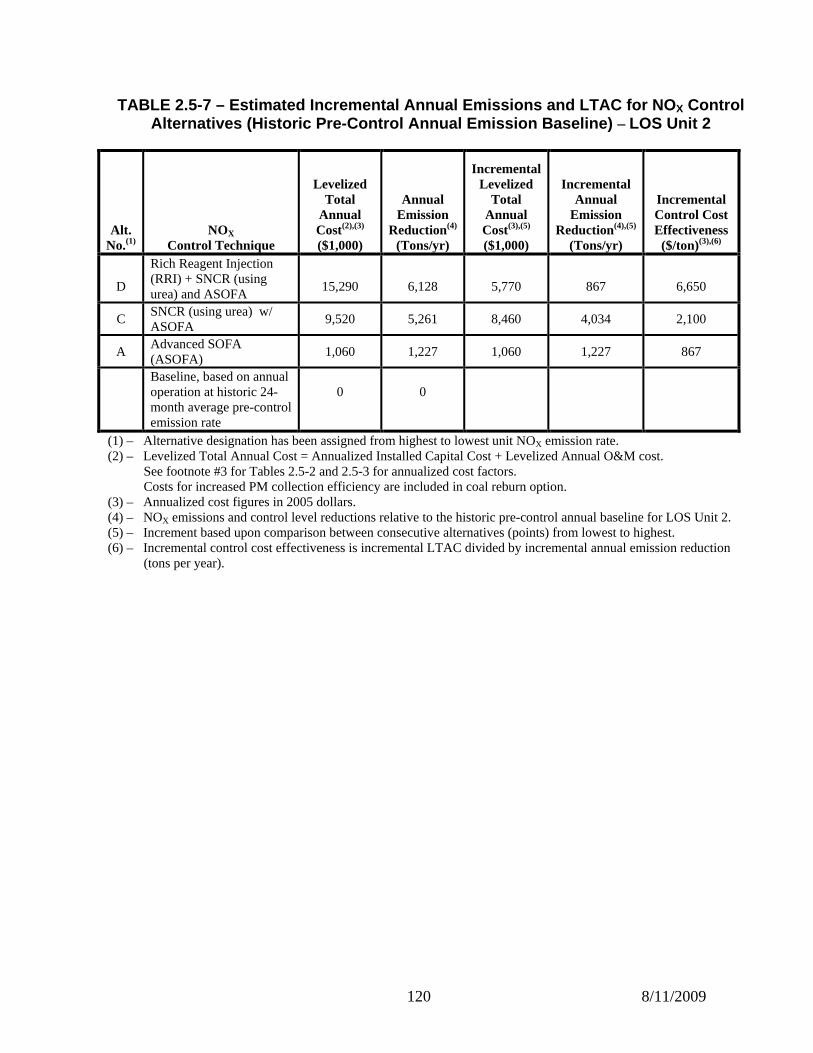
120 8/11/2009
TABLE 2.5-7 – Estimated Incremental Annual Emission s and LTAC for NO X Control Alternatives (Historic Pre-Control Annual Emission Baseline) – LOS Unit 2
Alt. No.(1)
NOX Control Technique
Levelized Total
Annual Cost(2),(3)
($1,000)
Annual Emission
Reduction(4)
(Tons/yr)
Incremental Levelized
Total Annual Cost(3),(5) ($1,000)
Incremental
Annual Emission
Reduction(4),(5)
(Tons/yr)
Incremental Control Cost Effectiveness ($/ton)(3),(6)
D
Rich Reagent Injection (RRI) + SNCR (using urea) and ASOFA
15,290 6,128 5,770 867 6,650
C SNCR (using urea) w/ ASOFA
9,520 5,261 8,460 4,034 2,100
A Advanced SOFA (ASOFA)
1,060 1,227 1,060 1,227 867
Baseline, based on annual operation at historic 24-month average pre-control emission rate
0
0
(1) – Alternative designation has been assigned from highest to lowest unit NOX emission rate. (2) – Levelized Total Annual Cost = Annualized Installed Capital Cost + Levelized Annual O&M cost.
See footnote #3 for Tables 2.5-2 and 2.5-3 for annualized cost factors. Costs for increased PM collection efficiency are included in coal reburn option.
(3) – Annualized cost figures in 2005 dollars. (4) – NOX emissions and control level reductions relative to the historic pre-control annual baseline for LOS Unit 2. (5) – Increment based upon comparison between consecutive alternatives (points) from lowest to highest. (6) – Incremental control cost effectiveness is incremental LTAC divided by incremental annual emission reduction
(tons per year).
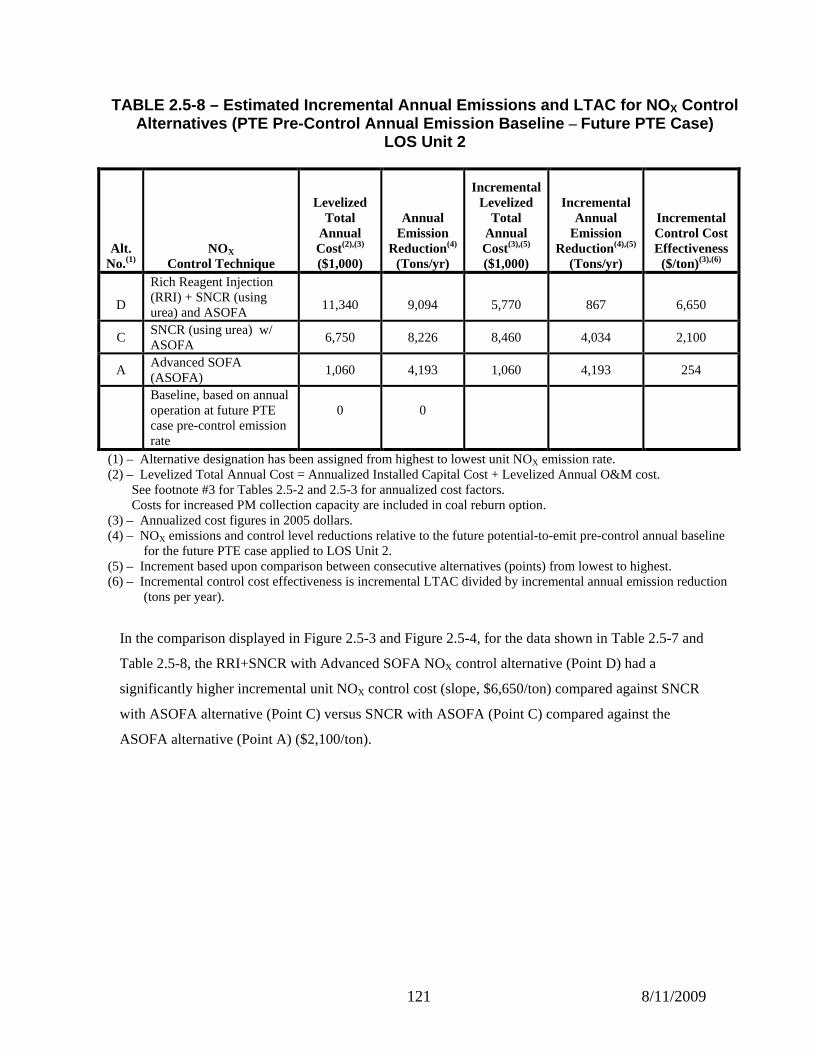
121 8/11/2009
TABLE 2.5-8 – Estimated Incremental Annual Emission s and LTAC for NO X Control Alternatives (PTE Pre-Control Annual Emission Basel ine – Future PTE Case)
LOS Unit 2
Alt. No.(1)
NOX Control Technique
Levelized Total
Annual Cost(2),(3)
($1,000)
Annual Emission
Reduction(4)
(Tons/yr)
Incremental Levelized
Total Annual Cost(3),(5) ($1,000)
Incremental
Annual Emission
Reduction(4),(5)
(Tons/yr)
Incremental Control Cost Effectiveness ($/ton)(3),(6)
D
Rich Reagent Injection (RRI) + SNCR (using urea) and ASOFA
11,340 9,094 5,770 867 6,650
C SNCR (using urea) w/ ASOFA
6,750 8,226 8,460 4,034 2,100
A Advanced SOFA (ASOFA)
1,060 4,193 1,060 4,193 254
Baseline, based on annual operation at future PTE case pre-control emission rate
0
0
(1) – Alternative designation has been assigned from highest to lowest unit NOX emission rate. (2) – Levelized Total Annual Cost = Annualized Installed Capital Cost + Levelized Annual O&M cost.
See footnote #3 for Tables 2.5-2 and 2.5-3 for annualized cost factors. Costs for increased PM collection capacity are included in coal reburn option.
(3) – Annualized cost figures in 2005 dollars. (4) – NOX emissions and control level reductions relative to the future potential-to-emit pre-control annual baseline
for the future PTE case applied to LOS Unit 2. (5) – Increment based upon comparison between consecutive alternatives (points) from lowest to highest. (6) – Incremental control cost effectiveness is incremental LTAC divided by incremental annual emission reduction
(tons per year).
In the comparison displayed in Figure 2.5-3 and Figure 2.5-4, for the data shown in Table 2.5-7 and
Table 2.5-8, the RRI+SNCR with Advanced SOFA NOX control alternative (Point D) had a
significantly higher incremental unit NOX control cost (slope, $6,650/ton) compared against SNCR
with ASOFA alternative (Point C) versus SNCR with ASOFA (Point C) compared against the
ASOFA alternative (Point A) ($2,100/ton).
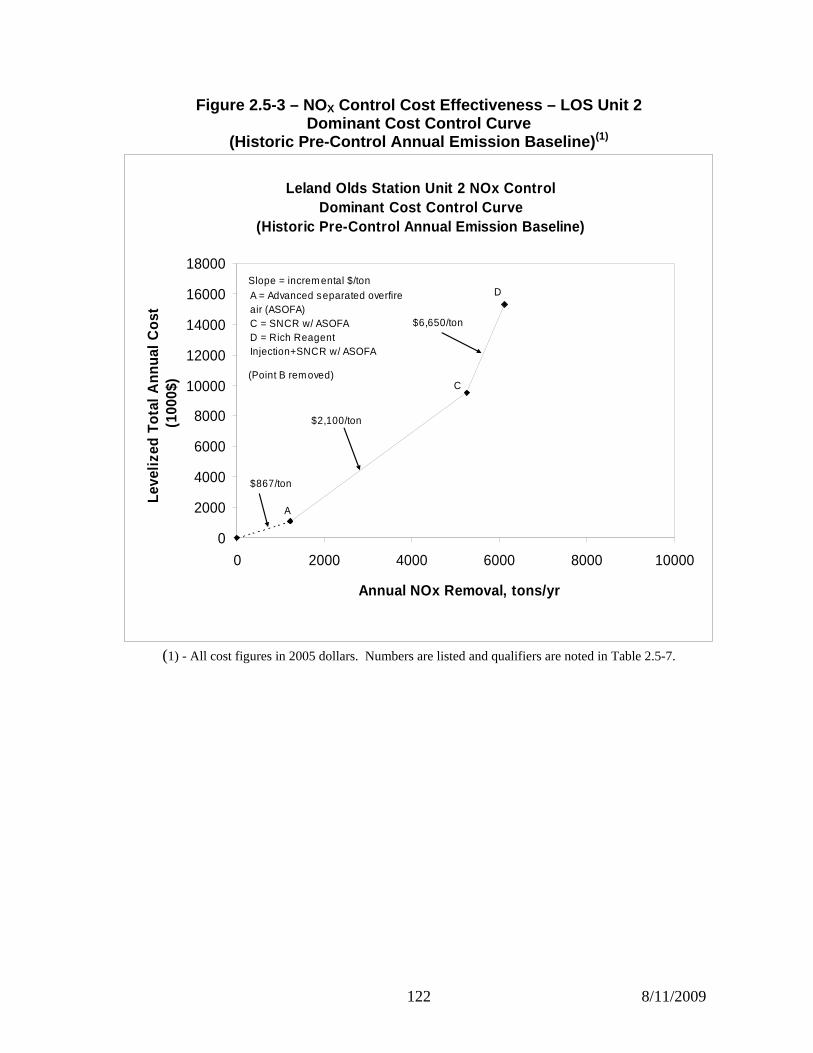
122 8/11/2009
Figure 2.5-3 – NO X Control Cost Effectiveness – LOS Unit 2 Dominant Cost Control Curve
(Historic Pre-Control Annual Emission Baseline) (1)
Leland Olds Station Unit 2 NOx Control Dominant Cost Control Curve
(Historic Pre-Control Annual Emission Baseline)
0
2000
4000
6000
8000
10000
12000
14000
16000
18000
0 2000 4000 6000 8000 10000
Annual NOx Removal, tons/yr
Leve
lized
Tot
al A
nnua
l Cos
t (1
000$
)
Slope = increm ental $/ton
(Point B rem oved)
A
$2,100/ton
$6,650/ton
C
DA = Advanced separated overfire air (ASOFA)C = SNCR w/ ASOFAD = Rich Reagent Injection+SNCR w/ ASOFA
$867/ton
(1) - All cost figures in 2005 dollars. Numbers are listed and qualifiers are noted in Table 2.5-7.
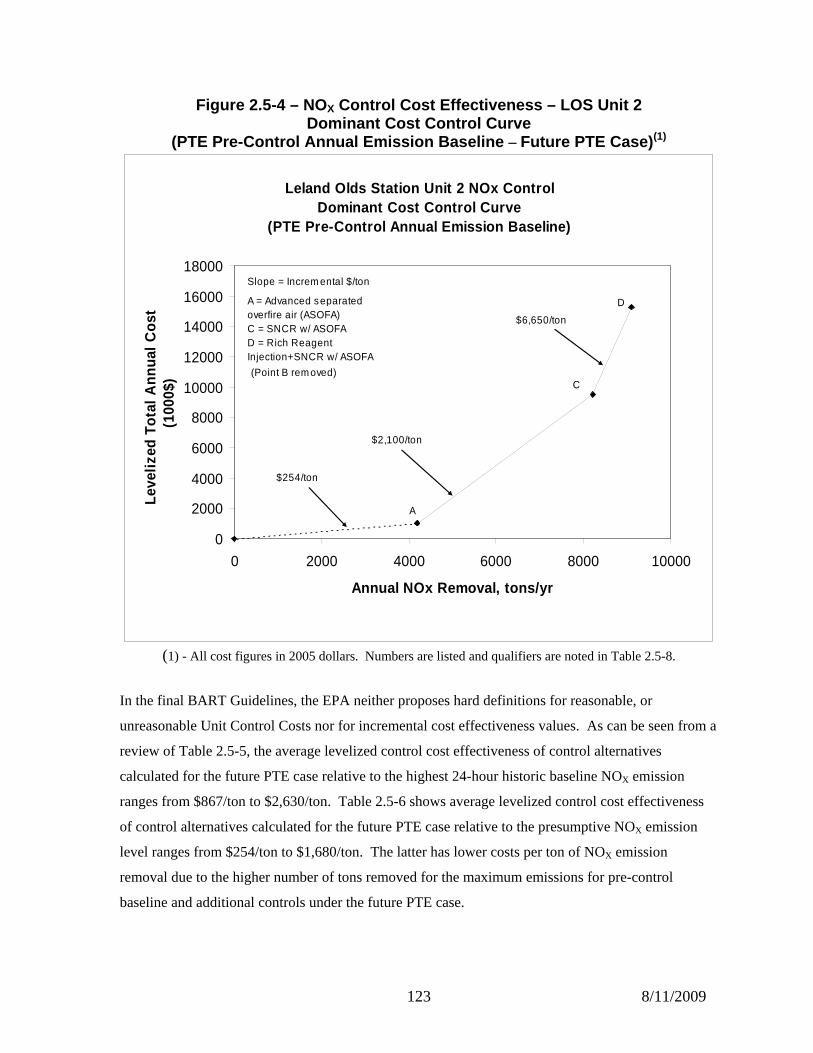
123 8/11/2009
Figure 2.5-4 – NO X Control Cost Effectiveness – LOS Unit 2 Dominant Cost Control Curve
(PTE Pre-Control Annual Emission Baseline – Future PTE Case) (1)
Leland Olds Station Unit 2 NOx Control Dominant Cost Control Curve
(PTE Pre-Control Annual Emission Baseline)
0
2000
4000
6000
8000
10000
12000
14000
16000
18000
0 2000 4000 6000 8000 10000
Annual NOx Removal, tons/yr
Leve
lized
Tot
al A
nnua
l Cos
t (
1000
$)
Slope = Increm ental $/ton
A
C
D
$2,100/ton
$6,650/ton
A = Advanced separated overfire air (ASOFA)C = SNCR w/ ASOFAD = Rich Reagent Injection+SNCR w/ ASOFA
$254/ton
(Point B rem oved)
(1) - All cost figures in 2005 dollars. Numbers are listed and qualifiers are noted in Table 2.5-8.
In the final BART Guidelines, the EPA neither proposes hard definitions for reasonable, or
unreasonable Unit Control Costs nor for incremental cost effectiveness values. As can be seen from a
review of Table 2.5-5, the average levelized control cost effectiveness of control alternatives
calculated for the future PTE case relative to the highest 24-hour historic baseline NOX emission
ranges from $867/ton to $2,630/ton. Table 2.5-6 shows average levelized control cost effectiveness
of control alternatives calculated for the future PTE case relative to the presumptive NOX emission
level ranges from $254/ton to $1,680/ton. The latter has lower costs per ton of NOX emission
removal due to the higher number of tons removed for the maximum emissions for pre-control
baseline and additional controls under the future PTE case.
124 8/11/2009
The incremental cost effectiveness is a measure of the increase in marginal cost effectiveness between
two specific alternatives. Alternatively, the incremental cost effectiveness analysis identifies the rate
of change of cost effectiveness with respect to removal benefits (i.e., the slope of the Dominant
Control Cost Curve) between successively more effective alternatives. The incremental cost analysis
indicates that from a cost effectiveness viewpoint, the highest performing alternative is Rich Reagent
Injection + SNCR with ASOFA (Point D). This control option is considered technically feasible for
Leland Olds Station Unit 2 boiler, incurs a significant annual (levelized) incremental cost compared
to the next highest feasible NOX control technique, SNCR with ASOFA (Point C, slope from C to D
=6,650 $/ton) compared against the next lowest alternative, ASOFA (Point A, slope from A to C =
2,100 $/ton).
The other elements of the fourth step of a BART analysis following cost of compliance are to
evaluate the following impacts of feasible emission controls:
♦ The energy impacts.
♦ The non-air quality environmental impacts.
♦ The remaining useful life of the source.
For the purposes of this BART analysis, the remaining useful life of the source was assumed to
exceed the 20-year project life utilized in the cost impact estimates. The other impacts for the LOS
Unit 2 NOX emissions control alternatives from the Dominant Control Cost Curve are discussed in
Section 2.5.2 and Section 2.5.3. Visibility impairment impacts for these LOS Unit 2 NOX emissions
controls are summarized in Section 2.5.4.
(The following article is a replacement of the same section in the August 2006 BEPC BART Determination Study final draft report)
2.4.6 ENERGY IMPACTS OF NOX CONTROL ALTERNATIVES – LOS UNIT 2
Operation of the top NOX control technologies considered feasible for potential application at the
Leland Olds Station impose direct impacts on the consumption of energy required for the production
of electrical power at the facility. The details of estimated energy usage and costs for the various
LOS Unit 2 NOX control alternatives are summarized in Appendix A.
Control alternatives for reduction of NOX emissions were reviewed to determine if the use of the
technique or technology will result in any significant or unusual energy penalties or benefits. There
are several basic kinds of energy impacts for NOX emissions controls:
125 8/11/2009
♦ Potential increase or decrease in power plant energy consumption resulting from a change in
thermal (heat) energy to net electrical output conversion efficiency of the unit, usually
expressed as an hourly unit heat rate (Btu/kW-hr) or the inverse of pounds of pollutant per
unit electrical power output (MW-hr). This may or may not change the net electrical output
(MW) capacity of the EGU, depending on if there are physical or imposed limits on the total
heat input to the boiler or electrical power output.
♦ Potential increase or decrease in net electrical output of the unit, resulting from changes in
physical operational limitations imposed on the ability to sustain a fuel heat input rate
(mmBtu/hr) which results in a potentially lower or higher unit net electrical output (MW)
capacity. This is effectively a change in net electrical output (MW) capacity of the EGU.
♦ Potential increase or decrease in net electrical output of the unit, resulting from changes in
auxiliary electrical power demand and usage (kW, kW-hrs). This is effectively a change in
net electrical output (MW) capacity of the EGU.
♦ Potential increase or decrease in reliability and availability to generate electrical power. This
results in a change to the number of hours of annual operation, not necessarily a change in net
electrical output (MW) capacity of the EGU.
(The following article is a replacement of the same section in the August 2006 BEPC BART Determination Study final draft report)
2.5.2.1 ENERGY IMPACTS OF SOFA ALTERNATIVES – LOS U NIT 1 There should not be a major impact on energy consumption by the operation of the advanced
variation of a separated overfire air system. ASOFA was the only NOX control technology common
to all four alternatives evaluated for LOS Unit 2. SOFA does not significantly change the total
amount of air introduced into the boiler, only the location where it is introduced. Combustion air
damper actuators’ electrical power demand would be insignificant (+ 1 kW) change in net electrical
power consumption from LOS Unit 2. For cyclone boilers, providing effective volumes and
velocities of separated overfire air at the injection ports should not require higher forced draft fan
power consumption resulting from higher fan discharge pressure. Higher lignite drying system vent
ductwork pressure drop impacts of the advanced SOFA system on the forced draft fans’ auxiliary
electrical power consumption are expected to be negligible (less than 1% of the annual auxiliary
power consumed by these fans) so that unit net electrical output (MW) capacity is essentially the
same as the current nameplate rating.
126 8/11/2009
Operation of a SOFA system may cause a small increase in levels of unburned carbon in the flyash
emitted from the boiler compared with current operation. This represents a slight amount of lost
potential electrical power generation from the incompletely burned fuel, so this inefficiency could
have a small negative impact (much less than 1%) on the plant unit heat rate (higher Btu/kw-hr). This
impact was not quantified, as the historical variation in coal heat content that influences plant unit
heat rate may be more significant.
Boiler furnace exit gas temperature and superheater steam / reheater steam outlet temperatures may
be slightly elevated during air-staged cyclone operation with SOFA. This impact on the boiler’s
operation is typically small, and within the design capabilities of the boiler from a heat transfer and
mechanical stress standpoint. This small negative impact (much less than 1%) on the plant unit heat
rate (higher Btu/kW-hr) was not quantified, as the historical variation in coal heat content that
influences plant unit heat rate is expected to have more significant impacts.
SOFA is not expected to significantly reduce unit reliability and availability to generate electrical
power, once the amount of secondary combustion air that can be withdrawn from the cyclones is
established for consistent combustion and continuous slag tapping under substoichiometric air/fuel
operating conditions for LOS Unit 2. There may be some changes in the degradation rate of the
boiler’s furnace waterwall tubes resulting from exposure of more area of the furnace walls to slightly
air-starved conditions during SOFA operation. Such conditions can promote corrosion from sulfur
compounds in the furnace gases being created above the cyclones and below the SOFA injection
ports. Due to the relatively moderate amounts of sulfur content in the lignite, modest amount of air-
staging of the existing cyclones during SOFA operation, and the potential use of recirculated flue gas
along the lower furnace walls, the expected change in corrosion rate of the boiler tubes should be
minor. This degradation is expected to occur over many years of operation, and normally requires
periodic replacement of the deteriorated sections of boiler furnace waterwall tubes to avoid forced
outages to repair tube leaks or failed sections. The potential change in the frequency of furnace wall
tube failures and changeouts is difficult to estimate, and has not been quantified.
(The following article is a replacement of the same section in the August 2006 BEPC BART Determination Study final draft report)
2.5.2.2 ENERGY IMPACTS OF SNCR ALTERNATIVES – LOS U NIT 2 The SNCR portion of this layered alternative involves a chemical reagent injected for NOX control,
assumed to be aqueous urea. For SNCR-related NOX control alternatives (with or without Rich
127 8/11/2009
Reagent Injection), the injection of a diluted urea solution requires some additional auxiliary power
for heating and pumping the liquid, and using compressed air for atomization and cooling the reagent
injection nozzles/lances. Heat is required for urea reagent storage. For the Advanced SOFA + SNCR
with and without RRI alternatives, the source of heat is assumed to be auxiliary electrical power, on
the order of 150 to 300 kW, which was calculated following EPA OAQPS convention4. Based on
operation for the entire year with the assumed 99% availability factor, this would consume
approximately 310,000 kW-hr/yr of additional auxiliary electrical power.
Advanced SOFA + SNCR with and without RRI alternatives’ operation is not expected to require
higher forced draft fan power consumption. Combustion air damper actuators’ electrical power
demands are expected to be an insignificant (+ 1 kW) change in net electrical power consumption
from LOS Unit 2.
Additional coal consumption for those alternatives that involve a chemical reagent injected for NOx
control to compensate for the heat of vaporization of the reagent dilution water; this follows EPA
OAQPS convention1, but is not accepted practice by an experienced SNCR vendor (Fuel Tech) who
claims that the heat produced from the exothermic reaction of urea and NOX is approximately equal to
the heat required to evaporate the dilution water. Reagent dilution water for those SNCR alternatives
that involve a chemical reagent injected for NOx control were assumed to be four times the amount of
delivered aqueous urea solution consumption (assumes urea is a 50% solution as delivered and is
injected as a 10% solution); this also follows EPA OAQPS convention5. This was estimated to be
approximately 23.7 million Btu per hour for Advanced SOFA + SNCR, or 204,800 mmBtu/yr and
approximately 45.0 million Btu per hour for Advanced SOFA + SNCR with RRI, or 389,500
mmBtu/yr for LOS Unit 2.
Likewise, operation of a Advanced SOFA + SNCR with and without RRI alternatives may cause a
small increase in levels of unburned carbon in the flyash emitted from the boiler compared with
current operation. This represents a slight amount of lost potential electrical power generation from
the incompletely burned fuel, so this inefficiency could have a small negative impact (much less than
1%) on the plant unit heat rate (higher Btu/kW-hr). This impact was not quantified, as the historical
variation in coal heat content that influences plant unit heat rate is expected to have more significant
impacts.
4 See Basin LOS BART Determination Study report NOX Section Reference number 49, page 1-34. 5 See Basin LOS BART Determination Study report NOX Section Reference number 49, page 1-35.
128 8/11/2009
As discussed above, SNCR operation will cause a slight decrease (approximately 0.5-0.9%) on the
plant unit heat rate (higher Btu/kW-hr), primarily to higher flue gas moisture with corresponding
sensible and latent heat losses which would require a slightly higher gross heat input to evaporate the
extra dilution water input. This ignores the slight increase in induced draft fan horsepower and
auxiliary electrical power consumption to handle the extra coal combustion products, urea and
dilution water flows that will result in increased flue gas mass flow during SNCR/RRI operation. The
impact of additional flue gas created by operation of an SNCR-related system on induced draft fan
power consumption should be insignificant.
Boiler furnace exit gas temperature and superheater steam / reheater steam outlet temperatures is not
expected to change significantly, as a slight increase during air-staged burner operation with SOFA
may be offset by a slight depression from the injection of the urea dilution water. This impact on the
boiler’s operation is typically small, and within the design capabilities of the boiler from a heat
transfer and mechanical stress standpoint. This impact on the LOS Unit 2 boiler’s thermal conversion
efficiency and steam cycle impacts from small steam temperature changes was not quantified, but is
not expected to be significant.
ASOFA and SNCR/RRI are not expected to significantly reduce unit reliability and availability to
generate electrical power. There may be some changes in the degradation rate of the boiler’s furnace
waterwall tubes resulting from exposure of more area of the furnace walls to slightly air-starved
conditions during SOFA operation. Such conditions can promote corrosion of the steel waterwall
tubes by sulfur compounds in the furnace gases being created above the burners and below the SOFA
injection ports. Due to the moderate sulfur content in the lignite and modest amount of air-staging
during firing of the existing cyclone burners expected during ASOFA operation, this potential change
in corrosion rate of the boiler tubes is expected to be minor. SNCR/RRI may cause a slight increase
in fireside deposit accumulation, especially in the primary and possibly secondary superheater and
reheater tube banks. This degradation is expected to occur over many years of operation, and
normally requires periodic replacement of the deteriorated sections of boiler furnace waterwall tubes
and superheater/reheater tube banks to avoid forced outages to repair tube leaks or failed sections.
The potential change in the frequency of furnace wall tube and superheater/reheater tube failures and
changeouts is difficult to estimate, and has not been quantified.
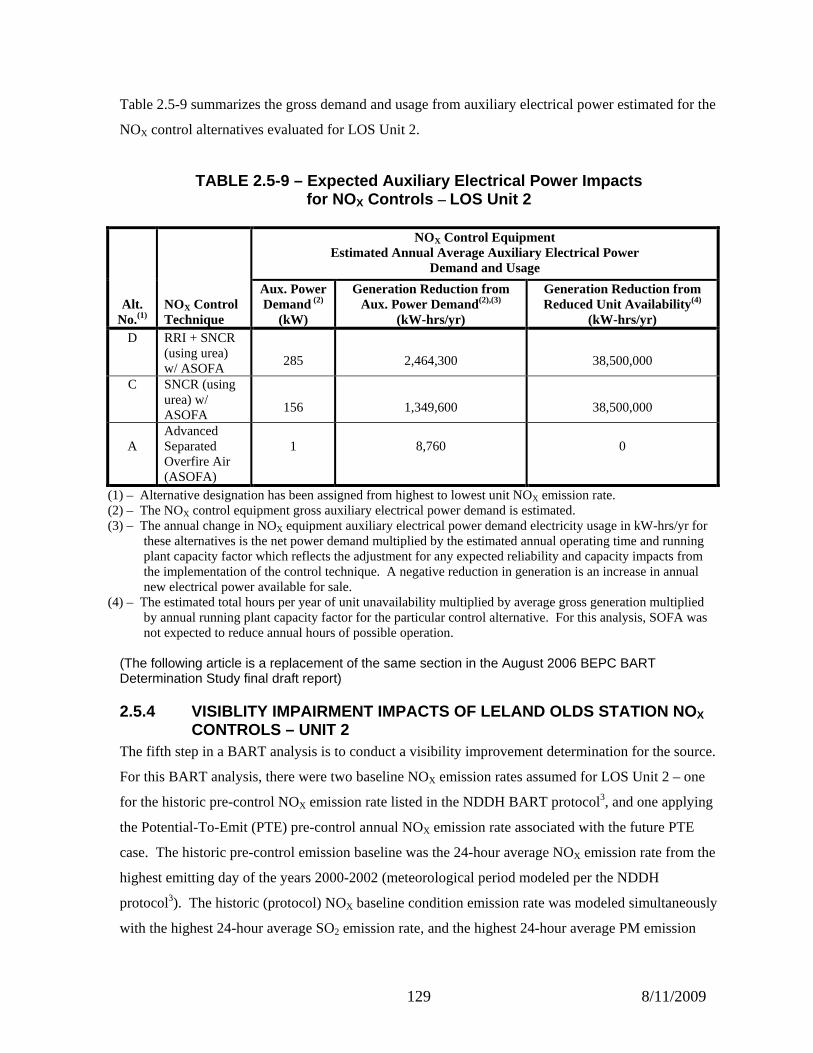
129 8/11/2009
Table 2.5-9 summarizes the gross demand and usage from auxiliary electrical power estimated for the
NOX control alternatives evaluated for LOS Unit 2.
TABLE 2.5-9 – Expected Auxiliary Electrical Power I mpacts for NO X Controls – LOS Unit 2
Alt.
No.(1)
NOX Control Technique
NOX Control Equipment Estimated Annual Average Auxiliary Electrical Power
Demand and Usage
Aux. Power
Demand (2)
(kW)
Generation Reduction from Aux. Power Demand(2),(3)
(kW-hrs/yr)
Generation Reduction from Reduced Unit Availability(4)
(kW-hrs/yr) D
RRI + SNCR (using urea) w/ ASOFA
285 2,464,300 38,500,000
C
SNCR (using urea) w/ ASOFA
156 1,349,600 38,500,000
A
Advanced Separated Overfire Air (ASOFA)
1
8,760
0
(1) – Alternative designation has been assigned from highest to lowest unit NOX emission rate. (2) – The NOX control equipment gross auxiliary electrical power demand is estimated. (3) – The annual change in NOX equipment auxiliary electrical power demand electricity usage in kW-hrs/yr for
these alternatives is the net power demand multiplied by the estimated annual operating time and running plant capacity factor which reflects the adjustment for any expected reliability and capacity impacts from the implementation of the control technique. A negative reduction in generation is an increase in annual new electrical power available for sale.
(4) – The estimated total hours per year of unit unavailability multiplied by average gross generation multiplied by annual running plant capacity factor for the particular control alternative. For this analysis, SOFA was not expected to reduce annual hours of possible operation.
(The following article is a replacement of the same section in the August 2006 BEPC BART Determination Study final draft report)
2.5.4 VISIBLITY IMPAIRMENT IMPACTS OF LELAND OLDS S TATION NOX CONTROLS – UNIT 2
The fifth step in a BART analysis is to conduct a visibility improvement determination for the source.
For this BART analysis, there were two baseline NOX emission rates assumed for LOS Unit 2 – one
for the historic pre-control NOX emission rate listed in the NDDH BART protocol3, and one applying
the Potential-To-Emit (PTE) pre-control annual NOX emission rate associated with the future PTE
case. The historic pre-control emission baseline was the 24-hour average NOX emission rate from the
highest emitting day of the years 2000-2002 (meteorological period modeled per the NDDH
protocol3). The historic (protocol) NOX baseline condition emission rate was modeled simultaneously
with the highest 24-hour average SO2 emission rate, and the highest 24-hour average PM emission
130 8/11/2009
rate of the 2000-2002 time period. The historic (protocol) baseline hourly NOX emission rate used for
modeling visibility impacts due to LOS Unit 2 under the conditions stated above was 3,959 lb/hr.
Visibility impairment impact modeling was performed using the CALPUFF model with the
difference between the impacts from historic (protocol) pre-control baseline and post-control average
hourly emission rates representing the visibility impairment impact reduction for LOS Unit 2. Three
post-control CALPUFF model runs for LOS Unit 2 were conducted with the same presumptive
BART SO2 emission baseline rate of 95%, constant PM emissions, and various levels of NOX control
assuming the same boiler design rating for heat input (5,130 mmBtu/hr). For the three post-control
alternatives representing LOS Unit 2 PTE annual emissions associated with the future PTE case, the
model used average unit NOX emission rates of 0.48, 0.304, and 0.265 lb/mmBtu (corresponding to
the design parameter in Table 1.2-1 and control rates in Table 1.4-1) multiplied by the boiler heat
input rating of 5,130 mmBtu/hr to yield average hourly NOX emission rates 2,462, 1,560, and 1,360
lb/hr. The boiler heat input basis for LOS Unit 2’s historic highest 24-hour pre-control NOX emission
baseline, in keeping with the NDDH BART visibility impairment impact modeling protocol, is
different than assumed for the PTE annual post-control conditions of the NOX control alternatives
evaluated for visibility impairment impacts.
The results of the visibility impairment modeling at the historic pre-control (protocol) baseline NOX
emission rate for LOS Unit 2 showed that all four of the designated Class 1 areas exceeded 0.5
deciView for highest predicted visibility impairment impact (90th percentile, averaged for 2000-
2002). Lostwood National Wildlife Refuge (LNWR) showed the biggest predicted visibility
impairment impact, which averaged 0.98 dV for the three years modeled (2000-2002). Average
predicted visibility impairment impacts decreased significantly with presumptive BART SO2
emission rate combined with constant PM emissions and various post-control ASOFA-enhanced NOX
emission rates for LOS Unit 2. This is shown in Table 2.5-10.
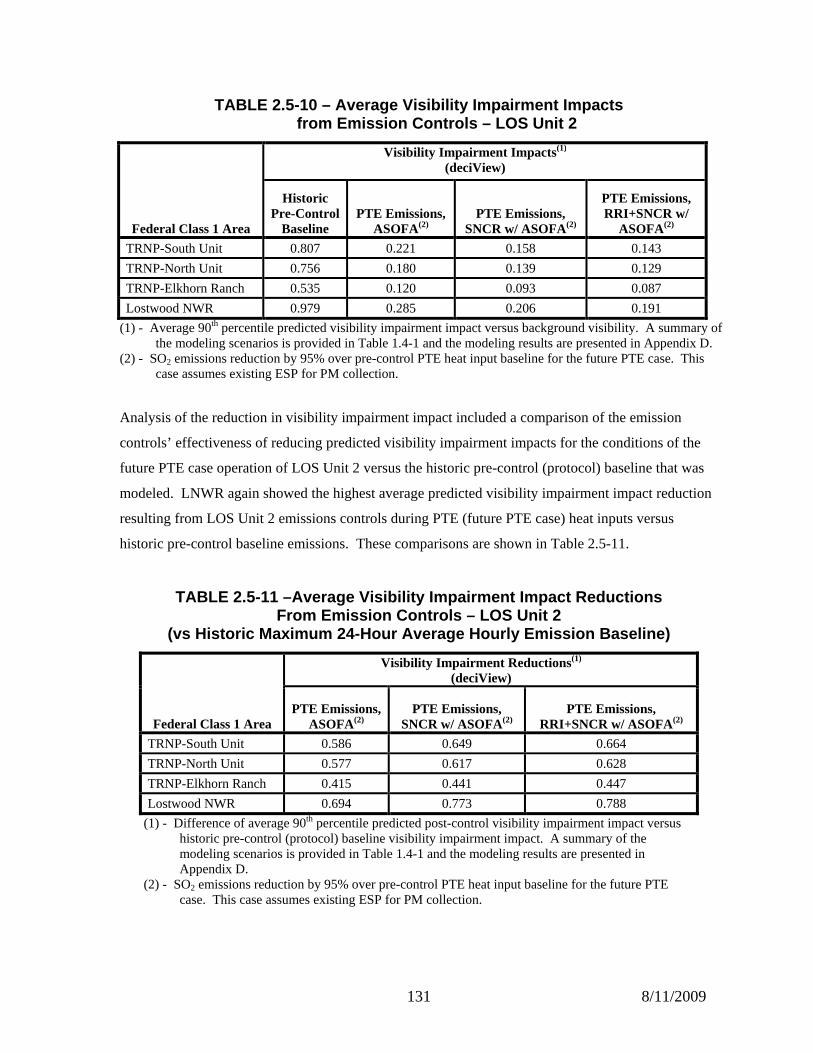
131 8/11/2009
TABLE 2.5-10 – Average Visibility Impairment Impact s from Emission Controls – LOS Unit 2
Federal Class 1 Area
Visibility Impairment Impacts (1) (deciView)
Historic Pre-Control
Baseline PTE Emissions,
ASOFA(2) PTE Emissions,
SNCR w/ ASOFA(2)
PTE Emissions, RRI+SNCR w/
ASOFA(2)
TRNP-South Unit 0.807 0.221 0.158 0.143
TRNP-North Unit 0.756 0.180 0.139 0.129
TRNP-Elkhorn Ranch 0.535 0.120 0.093 0.087
Lostwood NWR 0.979 0.285 0.206 0.191
(1) - Average 90th percentile predicted visibility impairment impact versus background visibility. A summary of the modeling scenarios is provided in Table 1.4-1 and the modeling results are presented in Appendix D.
(2) - SO2 emissions reduction by 95% over pre-control PTE heat input baseline for the future PTE case. This case assumes existing ESP for PM collection.
Analysis of the reduction in visibility impairment impact included a comparison of the emission
controls’ effectiveness of reducing predicted visibility impairment impacts for the conditions of the
future PTE case operation of LOS Unit 2 versus the historic pre-control (protocol) baseline that was
modeled. LNWR again showed the highest average predicted visibility impairment impact reduction
resulting from LOS Unit 2 emissions controls during PTE (future PTE case) heat inputs versus
historic pre-control baseline emissions. These comparisons are shown in Table 2.5-11.
TABLE 2.5-11 –Average Visibility Impairment Impact Reductions From Emission Controls – LOS Unit 2
(vs Historic Maximum 24-Hour Average Hourly Emissio n Baseline)
Federal Class 1 Area
Visibility Impairment Reductions (1)
(deciView)
PTE Emissions, ASOFA(2)
PTE Emissions, SNCR w/ ASOFA(2)
PTE Emissions, RRI+SNCR w/ ASOFA(2)
TRNP-South Unit 0.586 0.649 0.664
TRNP-North Unit 0.577 0.617 0.628
TRNP-Elkhorn Ranch 0.415 0.441 0.447
Lostwood NWR 0.694 0.773 0.788
(1) - Difference of average 90th percentile predicted post-control visibility impairment impact versus historic pre-control (protocol) baseline visibility impairment impact. A summary of the modeling scenarios is provided in Table 1.4-1 and the modeling results are presented in Appendix D.
(2) - SO2 emissions reduction by 95% over pre-control PTE heat input baseline for the future PTE case. This case assumes existing ESP for PM collection.
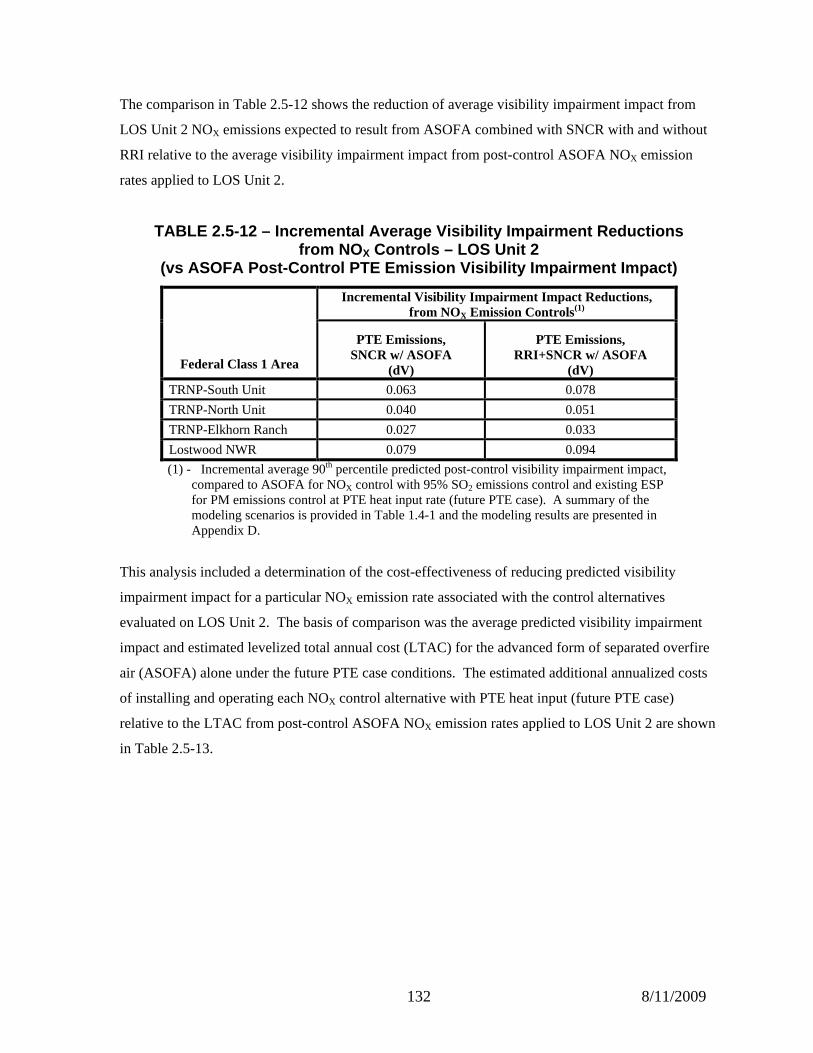
132 8/11/2009
The comparison in Table 2.5-12 shows the reduction of average visibility impairment impact from
LOS Unit 2 NOX emissions expected to result from ASOFA combined with SNCR with and without
RRI relative to the average visibility impairment impact from post-control ASOFA NOX emission
rates applied to LOS Unit 2.
TABLE 2.5-12 – Incremental Average Visibility Impai rment Reductions from NO X Controls – LOS Unit 2
(vs ASOFA Post-Control PTE Emission Visibility Impa irment Impact)
Federal Class 1 Area
Incremental Visibility Impairment Impact Reductions, from NOX Emission Controls(1)
PTE Emissions, SNCR w/ ASOFA
(dV)
PTE Emissions, RRI+SNCR w/ ASOFA
(dV)
TRNP-South Unit 0.063 0.078
TRNP-North Unit 0.040 0.051
TRNP-Elkhorn Ranch 0.027 0.033
Lostwood NWR 0.079 0.094
(1) - Incremental average 90th percentile predicted post-control visibility impairment impact, compared to ASOFA for NOX control with 95% SO2 emissions control and existing ESP for PM emissions control at PTE heat input rate (future PTE case). A summary of the modeling scenarios is provided in Table 1.4-1 and the modeling results are presented in Appendix D.
This analysis included a determination of the cost-effectiveness of reducing predicted visibility
impairment impact for a particular NOX emission rate associated with the control alternatives
evaluated on LOS Unit 2. The basis of comparison was the average predicted visibility impairment
impact and estimated levelized total annual cost (LTAC) for the advanced form of separated overfire
air (ASOFA) alone under the future PTE case conditions. The estimated additional annualized costs
of installing and operating each NOX control alternative with PTE heat input (future PTE case)
relative to the LTAC from post-control ASOFA NOX emission rates applied to LOS Unit 2 are shown
in Table 2.5-13.
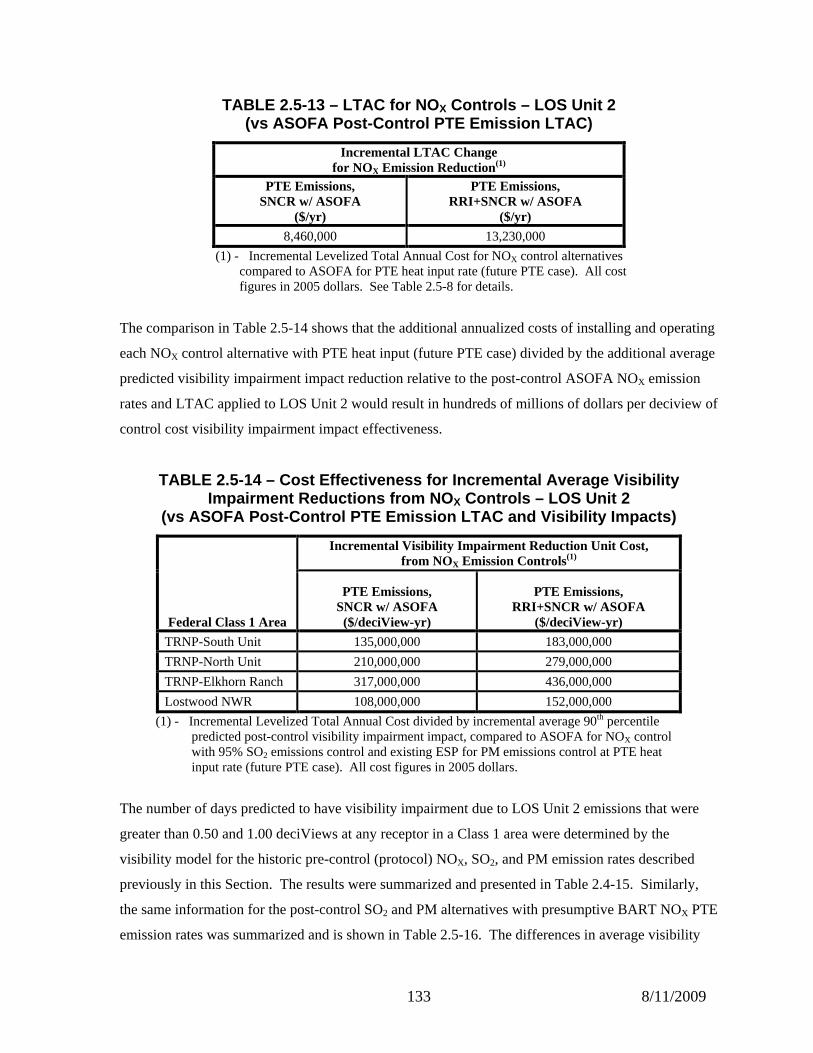
133 8/11/2009
TABLE 2.5-13 – LTAC for NO X Controls – LOS Unit 2 (vs ASOFA Post-Control PTE Emission LTAC)
Incremental LTAC Change for NOX Emission Reduction(1)
PTE Emissions, SNCR w/ ASOFA
($/yr)
PTE Emissions, RRI+SNCR w/ ASOFA
($/yr)
8,460,000 13,230,000
(1) - Incremental Levelized Total Annual Cost for NOX control alternatives compared to ASOFA for PTE heat input rate (future PTE case). All cost figures in 2005 dollars. See Table 2.5-8 for details.
The comparison in Table 2.5-14 shows that the additional annualized costs of installing and operating
each NOX control alternative with PTE heat input (future PTE case) divided by the additional average
predicted visibility impairment impact reduction relative to the post-control ASOFA NOX emission
rates and LTAC applied to LOS Unit 2 would result in hundreds of millions of dollars per deciview of
control cost visibility impairment impact effectiveness.
TABLE 2.5-14 – Cost Effectiveness for Incremental A verage Visibility Impairment Reductions from NO X Controls – LOS Unit 2
(vs ASOFA Post-Control PTE Emission LTAC and Visibi lity Impacts)
Federal Class 1 Area
Incremental Visibility Impairment Reduction Unit Cost, from NOX Emission Controls(1)
PTE Emissions, SNCR w/ ASOFA ($/deciView-yr)
PTE Emissions, RRI+SNCR w/ ASOFA
($/deciView-yr)
TRNP-South Unit 135,000,000 183,000,000
TRNP-North Unit 210,000,000 279,000,000
TRNP-Elkhorn Ranch 317,000,000 436,000,000
Lostwood NWR 108,000,000 152,000,000
(1) - Incremental Levelized Total Annual Cost divided by incremental average 90th percentile predicted post-control visibility impairment impact, compared to ASOFA for NOX control with 95% SO2 emissions control and existing ESP for PM emissions control at PTE heat input rate (future PTE case). All cost figures in 2005 dollars.
The number of days predicted to have visibility impairment due to LOS Unit 2 emissions that were
greater than 0.50 and 1.00 deciViews at any receptor in a Class 1 area were determined by the
visibility model for the historic pre-control (protocol) NOX, SO2, and PM emission rates described
previously in this Section. The results were summarized and presented in Table 2.4-15. Similarly,
the same information for the post-control SO2 and PM alternatives with presumptive BART NOX PTE
emission rates was summarized and is shown in Table 2.5-16. The differences in average visibility
134 8/11/2009
impairment impact and number of days predicted to have visibility impairment greater than 0.50 and
1.00 deciViews at any receptor in a Class 1 area between post-control SO2 and PM alternatives with
SNCR with ASOFA-controlled and RRI+ SNCR with ASOFA-controlled NOX emission rates versus
ASOFA-controlled NOX emission rates are summarized and shown in Table 2.5-15.
The magnitude of predicted visibility impairment and number of days predicted to have visibility
impairment greater than 0.50 and 1.00 deciViews at any receptor in a Class 1 area varied significantly
between years and Class 1 area. The highest number of days in which the predicted visibility
impairment impact above background exceeded 0.5 deciViews was for the pre-control (protocol)
emission case in year 2002 for TRNP’s South Unit. A series of bar charts showing the number of
days with predicted visibility impairment impact greater than 0.50 and 1.00 deciViews for each Class
1 area for the pre-control model results is included in Section 3.5. The pair of post-control SO2 and
PM alternatives combined with SNCR with ASOFA or RRI+SNCR with ASOFA for NOX control
were only slightly lower for the predicted visibility impairment impacts and number of days predicted
to have visibility impairment impacts greater than 0.50 and 1.00 deciViews compared to the same pair
of post-control SO2 and PM conditions with ASOFA-controlled NOX emission rates. A series of bar
charts showing the difference in the number of days with predicted visibility impairment impact
greater than 0.50 and 1.00 deciViews for each Class 1 area for the RRI+SNCR with ASOFA-
controlled PTE emission rates and SNCR with ASOFA-controlled PTE emission rates compared to
ASOFA NOX PTE emission rates with post-control SO2 and PM alternatives is included in Figures
2.5-5, 2.5-6, and 2.5-7.
(The following article is a replacement of the same section in the August 2006 BEPC BART Determination Study final draft report)
2.5.5 SUMMARY OF IMPACTS OF LELAND OLDS STATION NO X
CONTROLS – UNIT 2
Table 2.5-16 summarizes the various quantifiable impacts discussed in Sections 2.5.1 through 2.5.4
for the NOX control alternatives evaluated for LOS Unit 2.
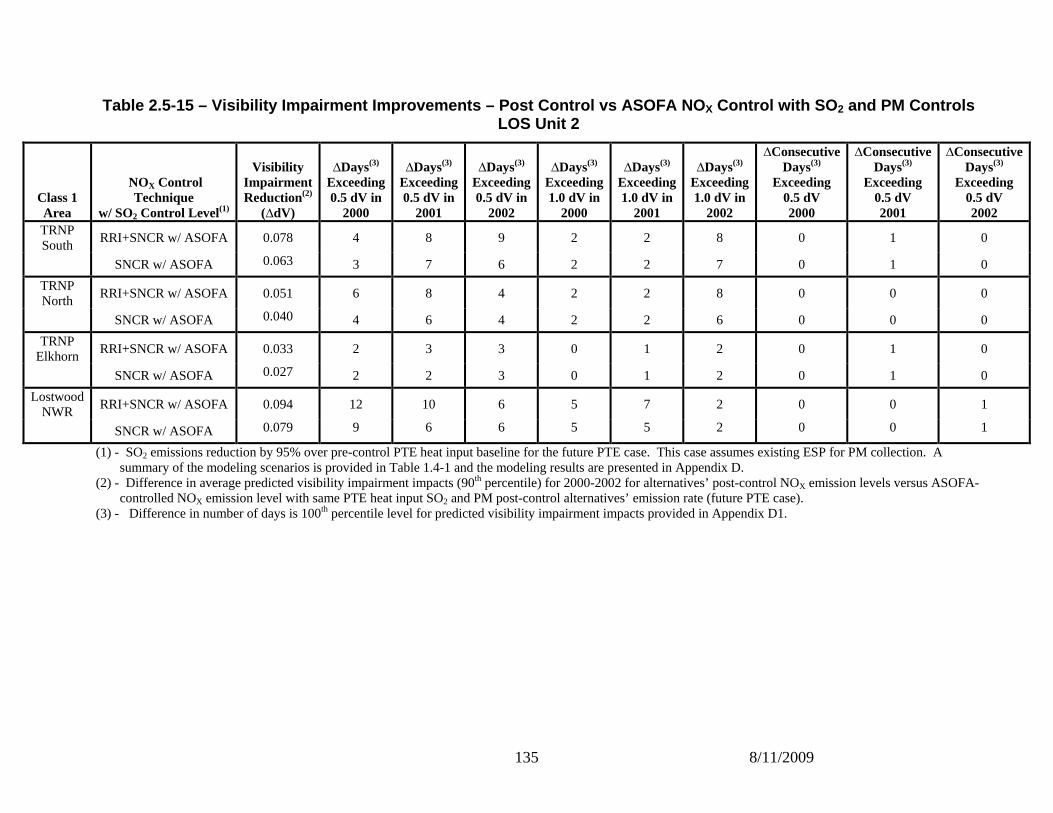
135 8/11/2009
Table 2.5-15 – Visibility Impairment Improvements – Post Control vs ASOFA NO X Control with SO 2 and PM Controls LOS Unit 2
Class 1 Area
NOX Control
Technique w/ SO2 Control Level(1)
Visibility Impairment Reduction(2)
(∆dV)
∆Days(3) Exceeding 0.5 dV in
2000
∆Days(3) Exceeding 0.5 dV in
2001
∆Days(3) Exceeding 0.5 dV in
2002
∆Days(3) Exceeding 1.0 dV in
2000
∆Days(3) Exceeding 1.0 dV in
2001
∆Days(3) Exceeding 1.0 dV in
2002
∆Consecutive Days(3)
Exceeding 0.5 dV 2000
∆Consecutive Days(3)
Exceeding 0.5 dV 2001
∆Consecutive Days(3)
Exceeding 0.5 dV 2002
TRNP South
RRI+SNCR w/ ASOFA 0.078 4 8 9 2 2 8 0 1 0
SNCR w/ ASOFA 0.063 3 7 6 2 2 7 0 1 0
TRNP North
RRI+SNCR w/ ASOFA 0.051 6 8 4 2 2 8 0 0 0
SNCR w/ ASOFA 0.040 4 6 4 2 2 6 0 0 0
TRNP Elkhorn
RRI+SNCR w/ ASOFA 0.033 2 3 3 0 1 2 0 1 0
SNCR w/ ASOFA 0.027 2 2 3 0 1 2 0 1 0
Lostwood NWR
RRI+SNCR w/ ASOFA 0.094 12 10 6 5 7 2 0 0 1
SNCR w/ ASOFA 0.079 9 6 6 5 5 2 0 0 1
(1) - SO2 emissions reduction by 95% over pre-control PTE heat input baseline for the future PTE case. This case assumes existing ESP for PM collection. A summary of the modeling scenarios is provided in Table 1.4-1 and the modeling results are presented in Appendix D.
(2) - Difference in average predicted visibility impairment impacts (90th percentile) for 2000-2002 for alternatives’ post-control NOX emission levels versus ASOFA-controlled NOX emission level with same PTE heat input SO2 and PM post-control alternatives’ emission rate (future PTE case).
(3) - Difference in number of days is 100th percentile level for predicted visibility impairment impacts provided in Appendix D1.
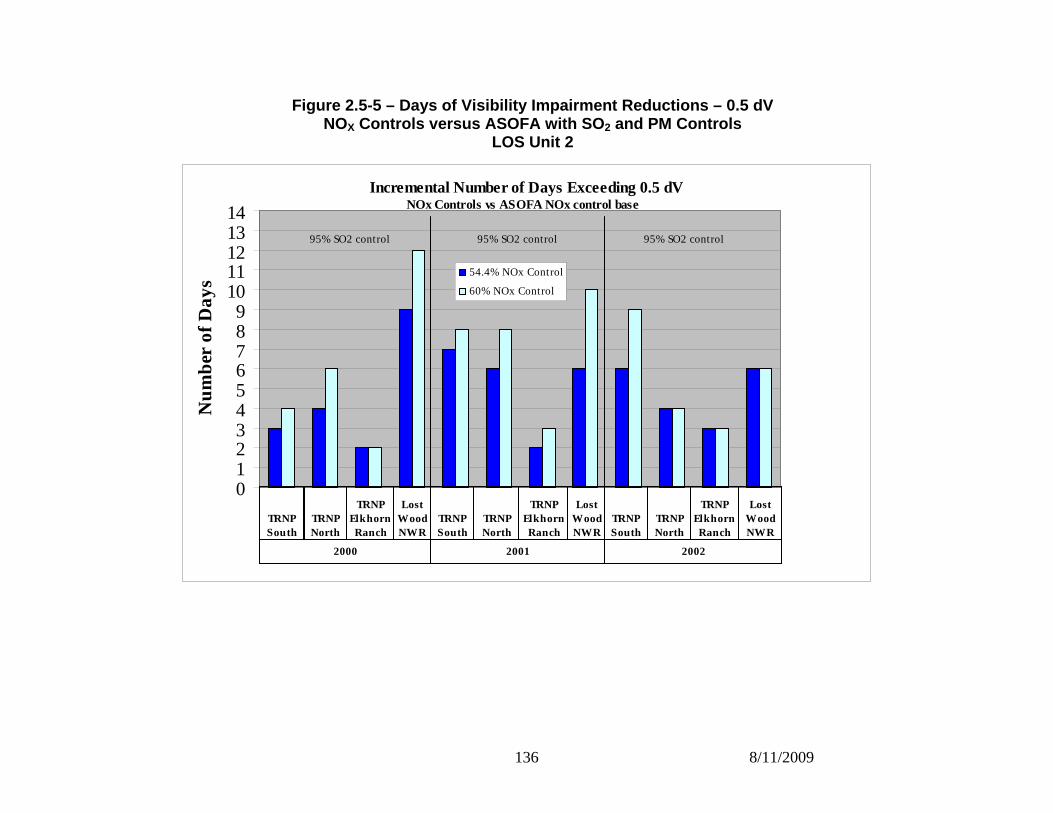
136 8/11/2009
Figure 2.5-5 – Days of Visibility Impairment Reduct ions – 0.5 dV NOX Controls versus ASOFA with SO 2 and PM Controls
LOS Unit 2
Incremental Number of Days Exceeding 0.5 dV
0123456789
1011121314
Nu
mb
er o
f Da
ys
54.4% NOx Control
60% NOx Control
TRNP South
TRNP North
TRNP Elkhorn Ranch
Lost Wood NWR
TRNP South
TRNP North
TRNP Elkhorn Ranch
Lost Wood NWR
TRNP South
TRNP North
TRNP Elkhorn Ranch
Lost Wood NWR
2000 2001 2002
NOx Controls vs ASOFA NOx control base
95% SO2 control 95% SO2 control95% SO2 control
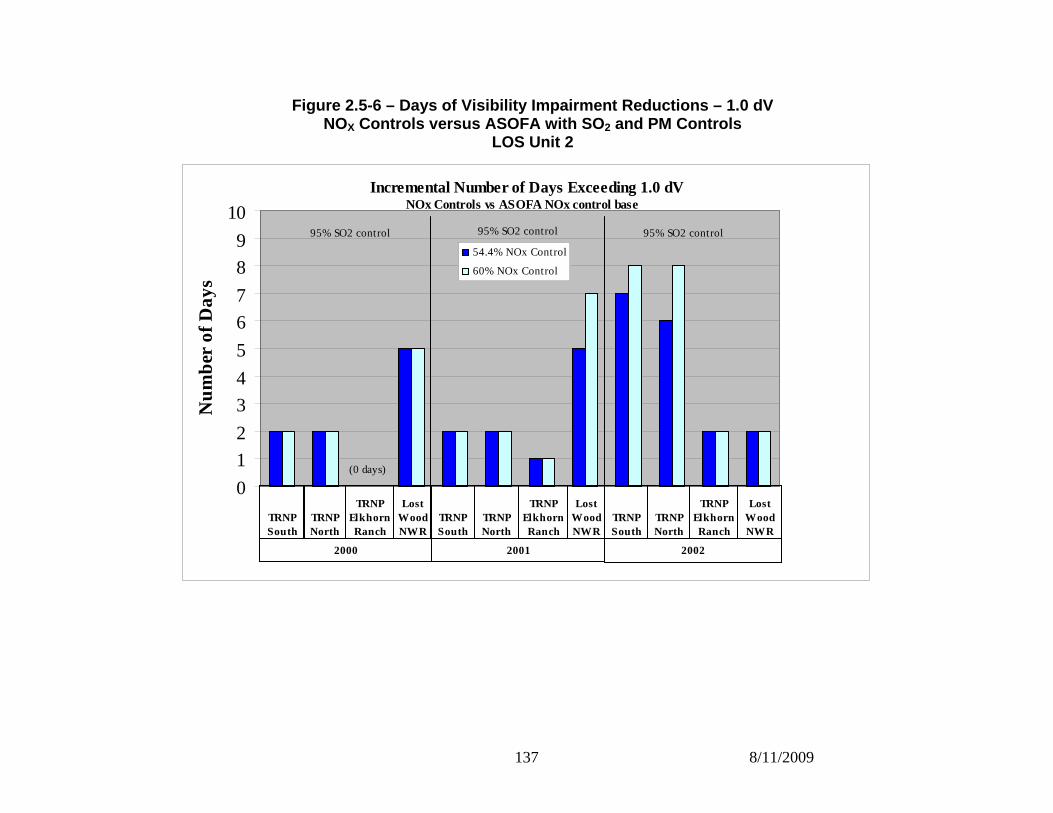
137 8/11/2009
Figure 2.5-6 – Days of Visibility Impairment Reduct ions – 1.0 dV NOX Controls versus ASOFA with SO 2 and PM Controls
LOS Unit 2
Incremental Number of Days Exceeding 1.0 dV
0
1
2
3
4
5
6
7
8
9
10N
um
ber
of D
ays
54.4% NOx Control
60% NOx Control
TRNP South
TRNP North
TRNP Elkhorn Ranch
Lost Wood NWR
TRNP South
TRNP North
TRNP Elkhorn Ranch
Lost Wood NWR
TRNP South
TRNP North
TRNP Elkhorn Ranch
Lost Wood NWR
2000 2001 2002
NOx Controls vs ASOFA NOx control base
95% SO2 control 95% SO2 control95% SO2 control
(0 days)
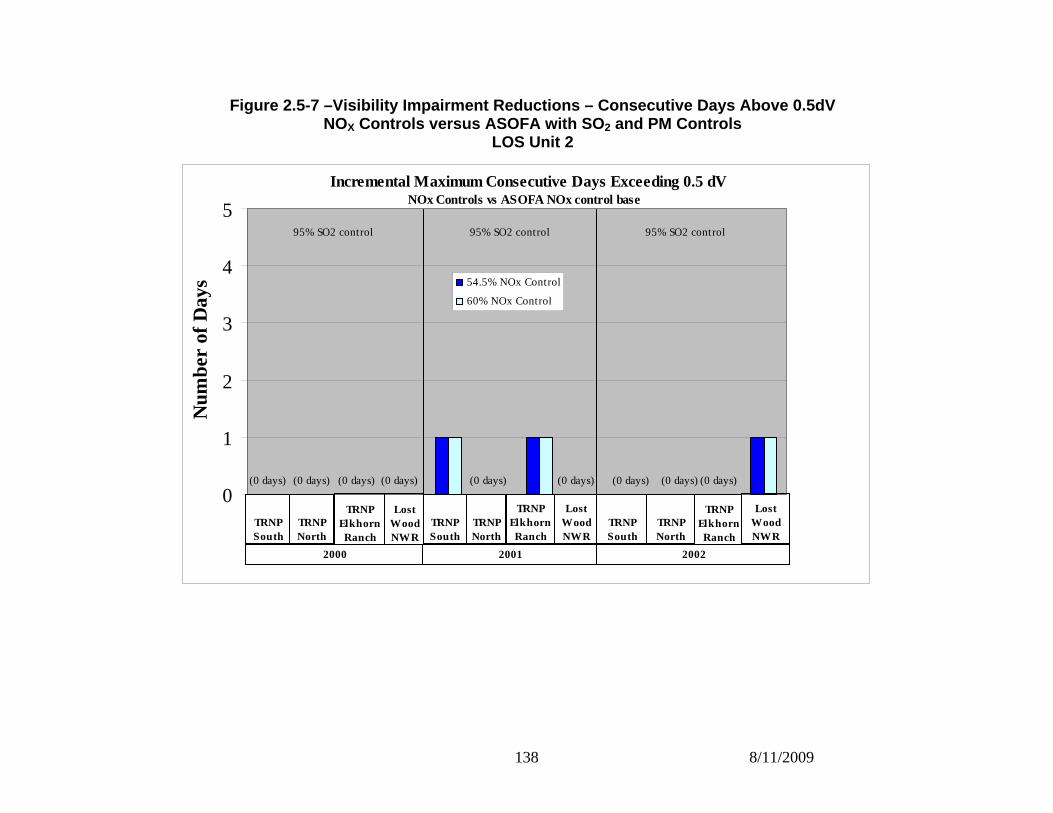
138 8/11/2009
Figure 2.5-7 –Visibility Impairment Reductions – Co nsecutive Days Above 0.5dV NOX Controls versus ASOFA with SO 2 and PM Controls
LOS Unit 2
Incremental Maximum Consecutive Days Exceeding 0.5 dV
0
1
2
3
4
5N
umbe
r of
Day
s 54.5% NOx Control
60% NOx Control
TRNP South
TRNP North
TRNP Elkhorn Ranch
Lost Wood NWR
TRNP South
TRNP North
TRNP Elkhorn Ranch
Lost Wood NWR
TRNP South
TRNP North
TRNP Elkhorn Ranch
Lost Wood NWR
2000 2001 2002
NOx Controls vs ASOFA NOx control base
95% SO2 control95% SO2 control95% SO2 control
(0 days) (0 days)(0 days) (0 days) (0 days)(0 days) (0 days) (0 days) (0 days)
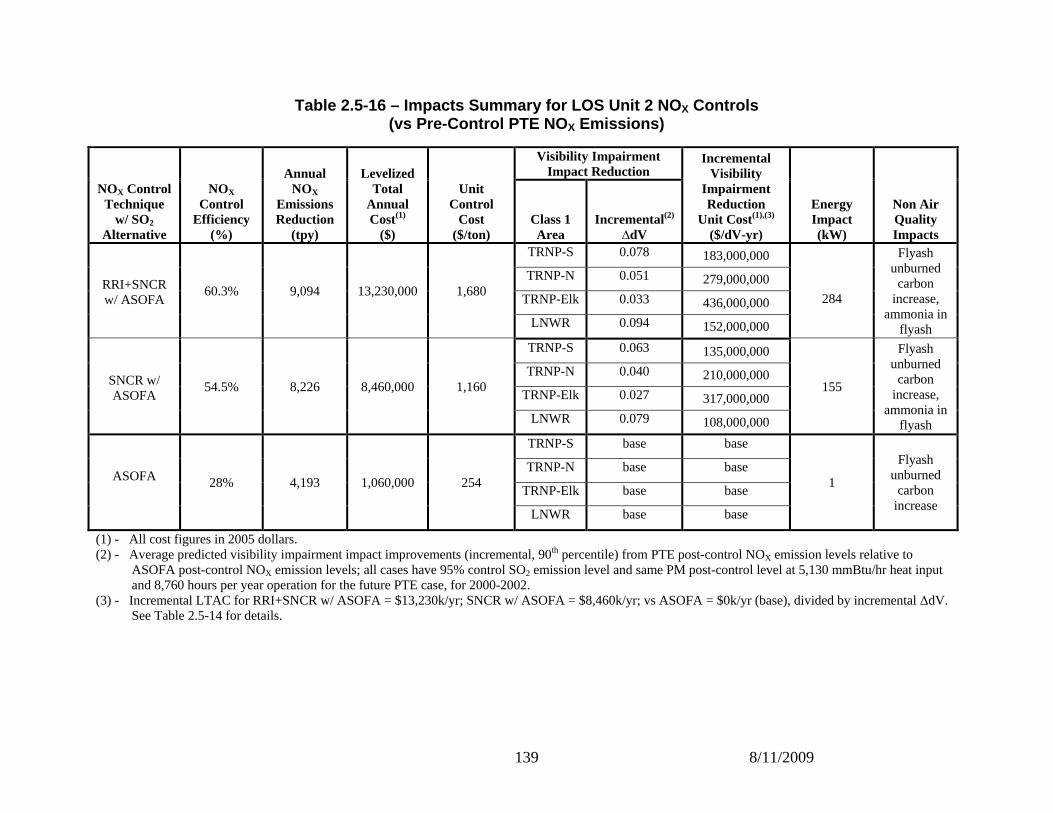
139 8/11/2009
Table 2.5-16 – Impacts Summary for LOS Unit 2 NO X Controls (vs Pre-Control PTE NO X Emissions)
(1) - All cost figures in 2005 dollars. (2) - Average predicted visibility impairment impact improvements (incremental, 90th percentile) from PTE post-control NOX emission levels relative to
ASOFA post-control NOX emission levels; all cases have 95% control SO2 emission level and same PM post-control level at 5,130 mmBtu/hr heat input and 8,760 hours per year operation for the future PTE case, for 2000-2002.
(3) - Incremental LTAC for RRI+SNCR w/ ASOFA = $13,230k/yr; SNCR w/ ASOFA = $8,460k/yr; vs ASOFA = $0k/yr (base), divided by incremental ∆dV. See Table 2.5-14 for details.
NOX Control Technique
w/ SO2 Alternative
NOX Control
Efficiency (%)
Annual NOX
Emissions Reduction
(tpy)
Levelized Total
Annual Cost(1)
($)
Unit Control
Cost ($/ton)
Visibility Impairment Impact Reduction
Incremental Visibility
Impairment Reduction
Unit Cost(1),(3) ($/dV-yr)
Energy Impact (kW)
Non Air Quality Impacts
Class 1 Area
Incremental(2)
∆dV
RRI+SNCR w/ ASOFA
60.3% 9,094 13,230,000 1,680
TRNP-S 0.078 183,000,000
284
Flyash unburned carbon
increase, ammonia in
flyash
TRNP-N 0.051 279,000,000
TRNP-Elk 0.033 436,000,000
LNWR 0.094 152,000,000
SNCR w/ ASOFA
54.5% 8,226 8,460,000 1,160
TRNP-S 0.063 135,000,000
155
Flyash unburned carbon
increase, ammonia in
flyash
TRNP-N 0.040 210,000,000
TRNP-Elk 0.027 317,000,000
LNWR 0.079 108,000,000
ASOFA
28% 4,193 1,060,000 254
TRNP-S base base
1
Flyash unburned carbon increase
TRNP-N base base
TRNP-Elk base base
LNWR base base

140 8/11/2009
NOX SECTION REFERENCES: (see pages 127 -131 in the August 2006 BEPC BART Determination Study final draft report)