Embed Size (px)
Citation preview

1
Impacts of the Pandemic on Young
Children and their Parents: Initial
Findings from NIEER’s May-June
2021 Preschool Learning Activities
Survey Kwanghee Jung and W. Steven Barnett
August 2021

2
Acknowledgments
Funding for survey development and administration was provided by the PNC Foundation.
The authors have sole responsibility for the content of the report.
About NIEER
The National Institute for Early Education Research (NIEER) at the Graduate School of
Education, Rutgers University, New Brunswick, NJ, conducts and disseminates independent
research and analysis to inform early childhood education policy.
Suggested Citation
Jung, K. & Barnett, W.S. (2021). Impacts of the Pandemic on Young Children and their
Parents: Initial Findings from NIEER’s May-June 2021 Preschool Learning Activities
Survey. New Brunswick, NJ: National Institute for Early Education Research.
About the Authors
Kwanghee Jung is an Assistant Research Professor at NIEER. She brings to NIEER an
expertise in quantitative data analysis. Her research interests include school readiness, state
early childhood program policies, and the impact of state funded preschool on children’s
cognitive development and social-emotional well-being.
W. Steven Barnett is a Board of Governors Professor of Education at Rutgers University and
Senior Co-Director of NIEER. His research interests include the economics of early care
and education, the effects of early care and education on children’s learning and
development, program evaluation, and policy analysis focusing on equity and efficiency.

3
KEY LESSONS FROM THE SPRING 2021 PRESCHOOL LEARNING ACTIVITIES SURVEY
1. Important parental supports for early learning continued to decline. From pre-pandemic to Spring
2021 reading three or more times a week declined from 85% to 66%. Teaching letters, words and
numbers three or more times a week declined from 73% to 60%. Reading frequency declined for
all ethnic groups. Hispanic children were particularly hard hit; less than half of Hispanic parents
reported conducting these activities three or more times a week by Spring 2021.
2. Parents reported a higher frequency of their child reading or being read to by someone, 69% at
least once per day in Spring 2021. Parents also reported relatively high frequencies of passive
screen time. Indoor play everyday was reported for 86% and outdoor play everyday for 72%.
3. Preschool participation rates had not yet returned to pre-pandemic levels, though the percentage
of children in remote preschool programs had decreased substantially. Participation rates for
Hispanic children appeared to be particularly low in Spring 2021.
4. Preschool special education services rebounded, with a substantial increase the percentage of
children with an Individualized Education Plan (IEP), though they also are older which may have
contributed to the rise. The percentage of Black children with an IEP was unexpectedly high in
Spring 2021. About 1 in 10 young children with an IEP were still reported to receive no services.
5. Rates of social-emotional problems reported by parents on a standardized scale, continued to rise.
Conduct problems, peer problems, and prosocial behavior problems were all reported at levels
twice or more the 10% normally expected. Elevated rates of problems were reported by parents
from all backgrounds.
6. Parents are more concerned about their children’s social and emotional development and well-
being than they were prior to the pandemic. They also are more concerned about excessive screen
time and lack of access to extracurricular activities. They are less concerned about the child’s
language development than prior to the pandemic.
7. About 1/3 of parents planned to send their child to a summer program in-person.
8. Most parents reported they were very likely or somewhat likely (82%) to send their child to a
preschool or kindergarten in-person in the fall despite concerns about Covid-19. Black and
Hispanic parents less often reported they were very likely to send their child in the fall and
expressed much greater concerns about Covid-19 related issues in deciding about in-person
attendance in the fall compared to White Non-Hispanic parents.
9. For age eligible children, 81% of parents said they would likely use a free, universal pre-K
program if it became available. Black and Hispanic parents more often reported they were highly
likely to participate in such a program than did White Non-Hispanic parents. Parents with annual
incomes below $25,000 also more often reported being very likely to participate than those with
higher incomes (70% v. 59%). Nearly two-thirds of parents said such a program would save them
money while about a third said their child would attend for free anyway.
10. Fewer children were participating in remote preschool and their parents reported lower levels of
frustration with supporting this activity.
11. Parent reports of problems due to the pandemic declined, but 22% still reported they were out of
work or had reduced hours, 9% reported a pay reduction, and 28% reported difficulties getting
their work done because of the child’s care and education. Covid-19 concerns were given as a
reason for not participating in preschool by almost half of parents of children not in preschool.

4
Table 1. Descriptive statistics for total NIEER survey sample (N = 954)
N Percent
Child Age 3 years old 256 26.9% 4 years old 434 45.5% 5 years old 263 27.6%
Pre-K Type Head Start 53 5.6% Private Center 346 36.5% Public Center 95 10.1% Home Based 23 2.4%
None 431 45.5%
Location Public School 112 21.4% Other 411 78.4%
Child Race/Ethnicity White, Non-Hispanic 527 55.2% Black, Non-Hispanic 81 8.5% Other, Non-Hispanic 61 6.4% Hispanic 209 21.9% 2+ Races, Non-Hispanic 77 8.0%
IEP Yes 102 10.7% No 851 89.2%
Home Language English 911 95.5% Spanish 43 4.5%
Parent Education < High school 71 7.5% High school 220 23.0% Some college 297 31.2% BA or higher 366 38.3%
Work Status Working 669 70.1% Not working 285 29.9%
Marital Status Married 781 81.9% Single 173 18.1%
Region Northeast 128 13.4% Midwest 232 24.3% South 362 38.0% West 232 24.3%
Household Income Under $24,999 84 8.8% $25,000 to $49,999 151 15.8% $50,000 to $74,999 170 17.9% $75,000 to $99,999 138 14.5% $100,000 and more 409 43.0%

5
Table 2. Percentage of children ages 3-5 and not yet in kindergarten whose parents
reported participating in home activities with child three or more times in the past week, by
type of child and family characteristics (N = 954)
N Read to the
child
Told a story
Sang songs
Taught letter,
number
Arts and
crafts
Total
954 66% 52% 65% 60% 37%
Child Age 3 years old 256 64% 54% 74% 67% 33% 4 years old 434 64% 48% 58% 55% 36% 5 years old 263 71% 57% 66% 62% 42%
Race/Ethnicity White, Non-Hispanic 527 73% 54% 66% 59% 38% Black, Non-Hispanic 81 63% 57% 69% 89% 55% Other, Non-Hispanic 61 78% 70% 67% 68% 31% Hispanic 209 47% 44% 60% 51% 33% 2+ Races, Non-Hispanic 77 60% 43% 63% 52% 32%
IEP Yes 102 62% 49% 64% 71% 40% No 851 66% 53% 65% 59% 37%
Home Language English 911 68% 53% 65% 61% 38% Spanish 43 24% 30% 54% 46% 21%
Parent Education < High school 71 45% 31% 64% 55% 31% High school 220 48% 44% 61% 58% 42% Some college 297 66% 54% 58% 58% 38% BA or higher 366 81% 60% 72% 64% 35%
Work Status Working 669 67% 55% 65% 58% 39% Not working 285 63% 46% 65% 64% 34%
Marital Status Married 781 68% 53% 65% 58% 36% Single 173 57% 47% 61% 67% 43%
Region Northeast 128 73% 58% 67% 58% 47% Midwest 232 74% 55% 70% 64% 32% South 362 63% 53% 66% 63% 39% West 232 58% 44% 56% 52% 35%
Household Income Under $24,999 84 50% 40% 71% 75% 47% $25,000 to $49,999 151 56% 51% 66% 49% 31% $50,000 to $74,999 170 60% 52% 62% 59% 38% $75,000 to $99,999 138 65% 44% 63% 66% 42% $100,000 and more 409 75% 58% 64% 59% 35%

6
Figure 1. Percentage of children ages 3-5 and not yet in kindergarten whose parents
reported participating in home activities with child three or more times in the past week
(N=954)
Figure 1-1. Parental support for Early Learning by Race/Ethnicity, Spring 2021(N = 954)
85%
38%
67%73%
46%
80%
47%
62% 61%
37%
71%
54%
73%66%
45%
66%
52%
64%60%
37%
0%
10%
20%
30%
40%
50%
60%
70%
80%
90%
100%
Read to the child Told a story Sang songs Taught letters, words,numbers
Worked on arts andcrafts
Pre-pandemic During pandemic, Spring 2020 During pandemic, Fall 2020 During pandemic, Spring 2021
71%
53%
64%59%
35%
58%51%
70%
84%
47%46% 44%
63%
48%
39%
80%
67% 64% 67%
36%
0%
10%
20%
30%
40%
50%
60%
70%
80%
90%
Read to the child Told a story Sang songs Taught letters, words,numbers
Worked on arts andcrafts
White, Non-hispanic Black Hispanic Other, Non-hispanic

7
Figure 1-2. Parental support for Early Learning by Race/Ethnicity, Fall 2020 and Spring
2021(N = 954)
Figure 1-3. Parental support for Early Learning by Household Income, Spring 2021
(N = 954)
Household Income less than $25,000, N = 86
Household Income $25,000 or more, N = 868
77%71%
54% 53%
73%64% 63% 59%
44%35%
55% 58%
40%
51%
76%70% 71%
84%
41%47%
53%46%
52%44%
66% 63% 65%
48% 51%
39%
89%80%
72%67%
84%
64%
75%67%
43%36%
0%10%20%30%40%50%60%70%80%90%
100%
Fall 2020 Spring2021
Fall 2020 Spring2021
Fall 2020 Spring2021
Fall 2020 Spring2021
Fall 2020 Spring2021
Read to the child Told a story Sang songs Taught letters, words,numbers
Worked on arts andcrafts
White, Non-hispanic Black Hispanic Other, Non-hispanic
51%
41%
72% 75%
47%
67%
53%
64%59%
36%
0%
10%
20%
30%
40%
50%
60%
70%
80%
Read to the child Told a story Sang songs Taught letters, words,numbers
Worked on arts andcrafts
Income less than $25,000 Income $25,000 or more
8
Figure 1-4. Parental support for Early Learning by Parent education level, Spring 2021
Less than high school, N = 71; High school, N = 220;Some college, N = 297; BA or more,
N = 366
45%
31%
64%
55%
31%
48%44%
60% 58%
42%
66%
54%58% 58%
38%
81%
60%
72%
64%
35%
0%
10%
20%
30%
40%
50%
60%
70%
80%
90%
Read to the child Told a story Sang songs Taught letters, words,numbers
Worked on arts andcrafts
Less than high school High school Some college BA or more

9
Table 3. Percentage of children ages 3-5 and not yet in kindergarten who engaged in a home learning activity several times
each day in the past week, by child and family characteristics (N=954)
N Read Watch TV Watch videos on
TV
Watch videos on computer or mobile
Play video games
Listen or play
music
make artwork or crafts
Play indoors
Play outdoors
Total
954 41% 37% 19% 29% 16% 38% 16% 77% 51% Child Age 3 years old 256 46% 31% 17% 24% 12% 39% 12% 73% 51%
4 years old 434 39% 39% 21% 32% 21% 36% 18% 80% 49% 5 years old 263 41% 40% 16% 30% 13% 40% 16% 76% 54%
Race/Ethnicity White, Non-Hispanic 527 47% 35% 16% 25% 13% 38% 14% 82% 57% Black, Non-Hispanic 81 37% 55% 38% 55% 33% 44% 20% 63% 40% Other, Non-Hispanic 61 37% 41% 19% 31% 5% 31% 5% 73% 46% Hispanic 209 30% 41% 21% 36% 24% 42% 25% 74% 45% 2+Races, Non-Hispanic 77 40% 20% 9% 13% 3% 26% 11% 73% 45%
IEP Yes 102 46% 45% 26% 46% 25% 43% 17% 77% 40% No 851 41% 36% 18% 27% 15% 37% 16% 77% 52%
Home Language English 911 43% 37% 19% 29% 15% 38% 16% 78% 51% Spanish 43 14% 43% 19% 36% 29% 24% 12% 64% 49%
Parent Education < High school 71 28% 71% 30% 57% 42% 30% 26% 77% 51% High school 220 31% 41% 22% 46% 27% 38% 20% 77% 41% Some college 297 38% 35% 17% 24% 11% 34% 13% 75% 53% BA or higher 366 53% 30% 16% 18% 8% 42% 14% 79% 55%
Work Status Working 669 43% 36% 18% 26% 13% 36% 14% 77% 52% Not working 285 34% 43% 19% 45% 30% 45% 23% 77% 47%
Marital Status Married 781 42% 34% 16% 26% 12% 39% 16% 75% 52% Single 173 40% 46% 25% 37% 25% 34% 17% 81% 48%
Region Northeast 128 53% 39% 14% 18% 7% 44% 26% 85% 63% Midwest 232 47% 36% 20% 26% 11% 41% 12% 82% 59%
South 362 36% 40% 19% 34% 21% 37% 16% 71% 44% West 232 38% 33% 18% 31% 18% 31% 15% 78% 48%
Household Income Under $24,999 84 32% 40% 27% 41% 29% 37% 27% 61% 51% $25,000 to $49,999 151 26% 48% 30% 37% 24% 38% 16% 79% 49% $50,000 to $74,999 170 40% 35% 15% 36% 26% 29% 16% 81% 49% $75,000 to $99,999 138 47% 42% 17% 33% 9% 39% 16% 78% 58% $100,000 and more 409 48% 32% 15% 20% 9% 40% 14% 78% 50%

10
Figure 2. Frequency of home learning activities in the past week: percentage of children
ages 3-5 and not yet in kindergarten whose parents reported engaging in an activity several
times a day, once a day, several times per week, 1-2 times per week, or never (N=954)
4137
19
29
16
38
16
77
51
2825
20 21
13
20 21
9
2118 16 18 16 15
25
31
1217
10 11
20 20 21
13
27
29
2
10
23
14
35
5 50 2
0
10
20
30
40
50
60
70
80
90
Read Watch TV Watchvideos on TV
Watchvideos on
computer ormobile
Play videogames
Listen orplay music
Makeartwork or
crafts
Play indoors Playoutdoors
Several times a day Once a day Several times during the week 1-2 times during the week Never

11
Table 4. Percentage of children ages 3-5 and not yet in kindergarten who participated in
selected remote learning activities at least several times a week by child and family
characteristics (N = 58)
Listenin
g to a
story
Learnin
g app
s
/games
Read
ing alo
ne
or w
ith an
adu
lt
Co
mp
leting
wo
rksheets
Visitin
g with
a
teacher b
y
video
chat
Activitie
s with
classmates b
y
video
chat
Math
or
science
activities
Art
Singin
g, playin
g
or listen
ing to
mu
sic
Ph
ysical
activity
Total
61% 54% 65% 63% 39% 41% 55% 41% 69% 62%
Child Age 3 years old 21% 79% 79% 59% 33% 30% 59% 64% 97% 64% 4 years old 52% 48% 69% 67% 39% 44% 48% 36% 65% 79% 5 years old 68% 56% 61% 61% 39% 40% 58% 43% 69% 51%
Pre-K Type Head Start 50% 55% 63% 60% 39% 51% 49% 53% 51% 55% Private Center 87% 83% 77% 56% 35% 38% 74% 54% 86% 59% Public Center 67% 32% 76% 64% 39% 38% 59% 33% 86% 83% Home Based 30% 30% 30% 81% 45% 28% 30% 2% 57% 53%
Location Public School 65% 46% 85% 72% 45% 45% 59% 47% 86% 79% Other 59% 58% 55% 59% 36% 39% 53% 39% 60% 54%
Race/Ethnicity White, N-H 55% 49% 56% 29% 14% 21% 40% 31% 49% 40% Black, N-H 77% 82% 100% 100% 57% 57% 82% 58% 76% 58% Other, N-H 37% 42% 58% 37% 14% 0% 37% 0% 95% 86% Hispanic 63% 55% 59% 87% 59% 59% 57% 58% 76% 82% 2+ Races, N-H 64% 18% 51% 70% 59% 62% 67% 16% 100% 80%
IEP Yes 23% 27% 41% 23% 33% 27% 26% 31% 39% 30% No 74% 63% 72% 77% 40% 46% 64% 44% 79% 73%
Home Language English 59% 52% 63% 61% 39% 38% 52% 39% 71% 60% Spanish 100% 91% 100% 100% 28% 100% 100% 91% 26% 100%
Parent Education < High school 100% 100% 100% 100% 60% 100% 100% 100% 60% 100% High school 44% 37% 46% 59% 31% 25% 44% 27% 71% 55% Some college 62% 83% 76% 45% 48% 65% 54% 63% 68% 77% BA or higher 80% 52% 81% 72% 40% 38% 62% 35% 67% 52%
Work Status Working 67% 60% 67% 65% 37% 40% 56% 45% 77% 69% Not working 51% 45% 60% 59% 42% 43% 53% 35% 56% 51%
Marital Status Married 54% 48% 57% 62% 38% 40% 50% 33% 60% 59% Single 72% 64% 76% 64% 40% 43% 63% 53% 82% 66%
Region Northeast 24% 16% 65% 24% 55% 16% 25% 24% 65% 67% Midwest 40% 38% 52% 28% 15% 22% 35% 31% 31% 45% South 82% 67% 82% 89% 67% 61% 79% 55% 83% 69% West 63% 63% 54% 71% 20% 41% 51% 37% 84% 66%
HH Income Under $24,999 67% 76% 97% 97% 52% 74% 75% 75% 74% 78% $25,000 to $49,999 53% 54% 58% 76% 43% 36% 50% 53% 86% 86% $50,000 to $74,999 83% 68% 59% 73% 67% 73% 70% 57% 88% 73% $75,000 to $99,999 66% 56% 77% 19% 16% 0% 66% 10% 88% 33% $100,000 and more 53% 37% 55% 44% 22% 27% 40% 17% 35% 36%

12
Figure 3. Percentage reporting each frequency of remote learning activities (everyday,
several times per week, 1-2 times per week, less than once per week) for children ages 3-5
not yet kindergarten whose programs had closed their in-person operations (N = 58, remote
only)
Figure 3-1. Percentage reporting each frequency of remote learning activities (everyday,
less than once per week) for children ages 3-5 not yet kindergarten whose programs had
closed their in-person operations (N = 58, remote only)
38
30
4135
2327
3128
48
40
23 25 2428
16 15
24
13
21 2218
107
1419 17
13
40
19
26
1621
11
1
17
4
19
10 8
15
1518
2225
37
1410
4
11
05
101520253035404550
Every day Several times each week Once or twice a week Less than once a week Never
38%
30%
41%
35%
23%
27%
31%
28%
48%
40%
21%
36%
29%
23%
42%
41%
33%
19%
12%
12%
0% 10% 20% 30% 40% 50% 60%
Listening to a story
Learning apps or games
Reading alone or with an adult
Completing worksheets
Visiting with a teacher by video chat
Activities w classmates by video chat
Math or science activities
Art or crafts
Singing, playing, listening music
Physical activity either indoors or outdoors
Everyday Less than once a week

13
Figure 4. Program supports remote learning (N = 58, remote only)
31%
55%60%
64%
0%
10%
20%
30%
40%
50%
60%
70%
Internet access A laptop, netbook or otherelectronic device
Books or other printmaterials
Construction or artmaterials, blocks, or other
toys
14
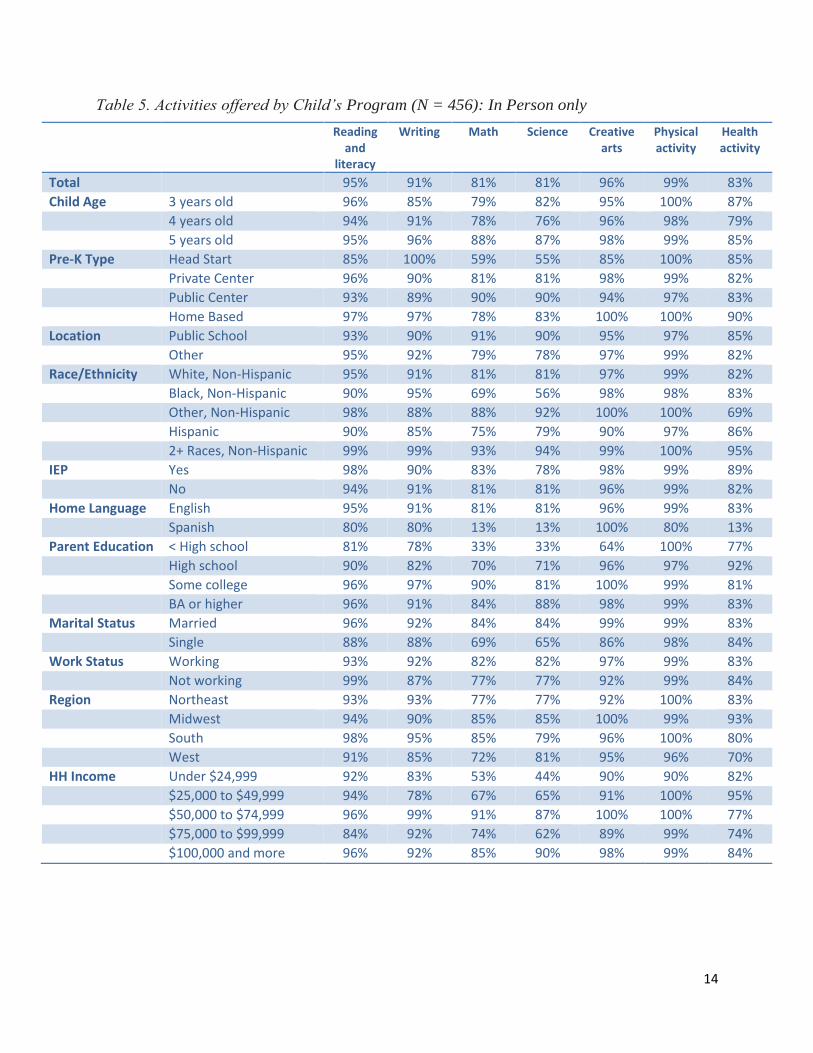
Table 5. Activities offered by Child’s Program (N = 456): In Person only
Reading and
literacy
Writing Math Science Creative arts
Physical activity
Health activity
Total
95% 91% 81% 81% 96% 99% 83%
Child Age 3 years old 96% 85% 79% 82% 95% 100% 87% 4 years old 94% 91% 78% 76% 96% 98% 79% 5 years old 95% 96% 88% 87% 98% 99% 85%
Pre-K Type Head Start 85% 100% 59% 55% 85% 100% 85% Private Center 96% 90% 81% 81% 98% 99% 82% Public Center 93% 89% 90% 90% 94% 97% 83% Home Based 97% 97% 78% 83% 100% 100% 90%
Location Public School 93% 90% 91% 90% 95% 97% 85% Other 95% 92% 79% 78% 97% 99% 82%
Race/Ethnicity White, Non-Hispanic 95% 91% 81% 81% 97% 99% 82% Black, Non-Hispanic 90% 95% 69% 56% 98% 98% 83% Other, Non-Hispanic 98% 88% 88% 92% 100% 100% 69% Hispanic 90% 85% 75% 79% 90% 97% 86% 2+ Races, Non-Hispanic 99% 99% 93% 94% 99% 100% 95%
IEP Yes 98% 90% 83% 78% 98% 99% 89% No 94% 91% 81% 81% 96% 99% 82%
Home Language English 95% 91% 81% 81% 96% 99% 83% Spanish 80% 80% 13% 13% 100% 80% 13%
Parent Education < High school 81% 78% 33% 33% 64% 100% 77% High school 90% 82% 70% 71% 96% 97% 92% Some college 96% 97% 90% 81% 100% 99% 81% BA or higher 96% 91% 84% 88% 98% 99% 83%
Marital Status Married 96% 92% 84% 84% 99% 99% 83% Single 88% 88% 69% 65% 86% 98% 84%
Work Status Working 93% 92% 82% 82% 97% 99% 83% Not working 99% 87% 77% 77% 92% 99% 84%
Region Northeast 93% 93% 77% 77% 92% 100% 83% Midwest 94% 90% 85% 85% 100% 99% 93% South 98% 95% 85% 79% 96% 100% 80% West 91% 85% 72% 81% 95% 96% 70%
HH Income Under $24,999 92% 83% 53% 44% 90% 90% 82% $25,000 to $49,999 94% 78% 67% 65% 91% 100% 95% $50,000 to $74,999 96% 99% 91% 87% 100% 100% 77% $75,000 to $99,999 84% 92% 74% 62% 89% 99% 74% $100,000 and more 96% 92% 85% 90% 98% 99% 84%

15
Figure 5. Child’s program offered the following activities (N = 456); In-person only
Figure 6. Preschool participation before and during the pandemic
95%91%
81% 81%
96% 99%
83%
0%
10%
20%
30%
40%
50%
60%
70%
80%
90%
100%
Reading andliteracy
Writing Mathematics Science Creative arts Physical activity Health activity
61%
8%
30%
36%
47%48%
54%
0%
10%
20%
30%
40%
50%
60%
70%
Pre-Pandemic During Pandemic Including Remote/Hybrid
Spring 2020 Fall 2020 Spring 2021

16
Figure 6-1. Preschool participation before and during the pandemic by Race/Ethnicity
Figure 6-2. Preschool participation before and during pandemic by age
10%
44%
53%
27%
51%
57%
10%
30%
49%
29%
49%
59%
3%
18%
26% 27%29%
36%
9%
32%
61%
45%
57%
66%
0%
10%
20%
30%
40%
50%
60%
70%
Spring 2020 Fall 2020 Spring 2021 Spring 2020 Fall 2020 Spring 2021
In-person During Pandemic Including Remote/Hybrid
White, Non-hispanic Black Hispanic Other, Non-hispanic
51%
71%
9% 7%
32%
40% 40%
51%
24%
36%39%
54%
41%
56%
0%
10%
20%
30%
40%
50%
60%
70%
80%
3 yr 4 yr 3 yr 4 yr 3 yr 4 yr 3 yr 4 yr 3 yr 4 yr 3 yr 4 yr 3 yr 4 yr
Spring 2020 Fall 2020 Spring 2021 Spring 2020 Fall 2020 Spring 2021
Pre-pandemic During Pandemic Including Remote/Hybrid

17
Table 6. Percentage in each type of preschool arrangement for children ages 3-5 and not yet in kindergarten by child and
family characteristics (N = 954)
Head Start Private Center Public Center Home Based All Programs No preschool N Percent N Percent N Percent N Percent N Percent N Percent
Total
53 6% 346 37% 95 10% 23 2% 523 55% 431 45%
Child Age 3 years old 2 1% 84 33% 15 6% 3 1% 110 41% 146 59% 4 years old 29 7% 158 36% 39 9% 17 4% 244 56% 190 44% 5 years old 21 8% 104 40% 41 15% 3 1% 169 64% 94 36%
Race/Ethnicity White, Non-Hispanic 22 4% 218 42% 46 9% 11 2% 305 57% 222 43% Black, Non-Hispanic 17 21% 15 18% 9 11% 3 4% 44 55% 37 45% Other, Non-Hispanic 0 1% 18 30% 19 32% 0 0% 38 62% 23 38% Hispanic 12 6% 52 25% 11 5% 9 4% 83 40% 125 60% 2+ Races, Non-Hispanic 1 2% 42 55% 9 12% 0 0% 53 69% 24 31%
IEP Yes 16 16% 27 26% 32 31% 2 2% 76 74% 26 26% No 36 4% 319 38% 63 7% 21 3% 446 52% 404 48%
Home Language English 51 6% 345 38% 94 10% 23 3% 520 57% 391 43% Spanish 2 5% 0 1% 1 2% 0 0% 3 8% 40 92%
Parent Education < High school 16 23% 6 8% 4 5% 5 7% 30 43% 41 57% High school 16 7% 48 23% 16 8% 6 3% 93 41% 127 59% Some college 18 6% 104 35% 27 9% 2 1% 152 51% 146 49% BA or higher 3 1% 188 51% 48 13% 9 3% 248 68% 118 32%
Work Status Working 16 2% 304 39% 69 9% 19 3% 414 53% 367 47% Not working 37 22% 42 24% 27 15% 3 2% 109 63% 64 37%
Marital Status Married 31 5% 286 43% 73 11% 16 2% 412 61% 256 39% Single 22 8% 60 21% 22 8% 7 2% 111 39% 174 61%
Region Northeast 10 8% 67 52% 9 7% 1 1% 88 68% 41 32% Midwest 14 6% 93 40% 45 19% 5 2% 157 68% 75 32% South 23 6% 115 32% 26 7% 10 3% 180 50% 182 51% West 6 3% 71 31% 15 6% 7 3% 99 43% 133 57%
Household Income Under $24,999 18 22% 5 6% 10 11% 1 1% 34 40% 50 60% $25,000 to $49,999 11 8% 36 25% 13 9% 8 6% 74 49% 77 53% $50,000 to $74,999 3 2% 56 33% 19 11% 6 3% 84 49% 86 51% $75,000 to $99,999 5 3% 44 32% 9 6% 1 1% 58 42% 80 58% $100,000 and more 16 4% 205 50% 45 11% 8 2% 273 67% 136 33%

18
Figure 7. Percent with IEP Spring and Fall 2020, Spring 2021
Figure 7-1. Percent with IEP Spring and Fall 2020, Spring 2021
Figure 8. Services to children with special needs
9%
7%
11%
0%
2%
4%
6%
8%
10%
12%
Spring 2020 Fall 2020 Spring 2021
6%
15%
12% 12%
7%6% 6%
11%10%
22%
10%8%
0%
5%
10%
15%
20%
25%
White, Non-hispanic Black Hispanic Other, Non-hispanic
Spring 2020 Fall 2020 Spring 2021
37% 39%
23%
57%
37%
7%
55%
34%
11%
0%
10%
20%
30%
40%
50%
60%
Full support Partial support No support
Spring 2020, N = 87 Fall 2020, N = 69 Spring 2021, N = 94

19
Figure 8-1. IEP Support, Spring 2021 (N = 94)
Figure 9. Social and Emotional Problems, Fall 2020 and Spring 2021
55%34%
11%
Full Support Partial Support No Support
6%
22%
15%17%
12% 11%
7%
27%
16%
20%
17%
21%
0%
5%
10%
15%
20%
25%
30%
EmotionalSymptoms
Conduct Problem Hyperactivity Peer Problem Total Difficulties Prosocial Behavior
Fall 2020 Spring 2021

20
Figure 9-1. Social and Emotional Problems by Race/Ethnicity, Spring 2021
Figure 10. Satisfaction with the Child’s Program (N = 523)
6%
26%
15% 15% 15% 15%
11%
28%
16%
31%
24% 23%
5%
25%
15%
23%
17%
35%
13%
28%
21%
36%
22%
29%
0%
5%
10%
15%
20%
25%
30%
35%
40%
EmotionalSymptoms
Conduct Problem Hyperactivity Peer Problem Total Difficulties Prosocial behavior
White, Non-Hispanic Black Hispanic Other, Non-Hispanic
72% 74% 71% 70%
20% 21% 23% 23%
2% 3% 5% 5%2% 0% 0.40% 1%0%
10%
20%
30%
40%
50%
60%
70%
80%
90%
100%
Handling Instruction Prevent the spread ofcoronavirus
Communicates with families Addressing caregivers'concerns and questions
Very satisfied Somewhat satisfied Somewhat dissatisfied Very dissatisfied

21
Figure 11. How concerned are you about child being exposed to the coronavirus in the
child’s program? (N = 527)
Figure 12. Compared to before the coronavirus outbreak, are you more concerned, less
concerned, or just as concerned about the child in each of the following areas (N = 954)
10%
14%
29%
19%
39% 38%
22%
29%
0%
5%
10%
15%
20%
25%
30%
35%
40%
45%
Being exposed to the coronavirus Falling behind in their learning and development
Very concerned Somewhat concerned Not too concerned Not at all concerned
39%43%
31%34%
16%12%
19% 20% 19%
25%
34%38%
41%37%
49%
40%
50% 50%
0%
10%
20%
30%
40%
50%
60%
Having too muchscreen time
Maintaining socialconnections and
friendship
The child’s emotional well-
being
Having access toextracurricular
activities
Not getting enoughexercise
Spending too muchtime unsupervised
More concerned Less concerned Just as concerned

22
Figure 13. Compared to before the coronavirus outbreak, are you more concerned, less
concerned, or just as concerned about the child’s skill level in each of the following area (N
= 954)
Figure 14. Plan to send to a summer program (N = 954)
32%
15%12%
24%
33% 34%
44%
51%54%
0%
10%
20%
30%
40%
50%
60%
Social skills Language skills Physical or motor skills
More concerned Less concerned Just as concerned
34%
1%
65%
Yes, in-person Yes, virtually No

23
Figure 14-1. Plan to send to a summer program by race/ethnicity (N = 954)
Figure 14-2. Plan to send to a summer program by household income (N = 954)
Figure 14-3. Plan to send to a summer program by parent education (N = 954)
32%
49%
23%
53%
0%7%
2% 0%
68%
43%
74%
47%
0%
10%
20%
30%
40%
50%
60%
70%
80%
White, Non-hispanic Black Hispanic Other, Non-hispanic
Yes, in-person Yes, virtually No
31% 34%
8%1%
60%65%
0%
10%
20%
30%
40%
50%
60%
70%
Less than $25,000 $25,000 or above
Yes, in-person Yes, virtually No
20%25% 25%
49%
1% 2% 2% 0%
80%73% 73%
51%
0%
10%
20%
30%
40%
50%
60%
70%
80%
90%
Less than high school High school Some college BA or higher
Yes, in-person Yes, virtually No

24
Figure 15. Plan to send in-person program in the fall (N = 954)
Figure 15-1. Plan to send in-person program in the fall by race/ethnicity (N = 954)
73%
14%
4%9%
Very likely Somewhat likely Not very likely Not likely at all
76%
66% 65%
83%
9%
31%
22%
9%4%
0%6%
2%
11%
3%8% 6%
0%
10%
20%
30%
40%
50%
60%
70%
80%
90%
White, Non-hispanic Black Hispanic Other, Non-hispnaic
Very likely Somewhat likely Not very likely Not likely at all

25
Figure 15-2. Plan to send in-person program in the fall by Household Income (N = 954)
Figure 15-3. Plan to send in-person program in the fall by parent education (N = 954)
63%
74%
22%
13%
1% 4%
15%9%
0%
10%
20%
30%
40%
50%
60%
70%
80%
Less than $25,000 $25,000 or above
Very likely Somewhat likely Not very likely Not likely at all
68%
54%
73%
87%
16%23%
16%
6%10%
5% 4% 2%7%
18%
8% 5%
0%
10%
20%
30%
40%
50%
60%
70%
80%
90%
100%
Less than high school High school Some college BA or higher
Very likely Somewhat likely Not very likely Not likely at all

26
Figure 16. Factors that would affect your decision about in-person classes in the fall
(N = 954)
Figure 16-1. Major factors that would affect decision about in-person classes in the fall by
race/ethnicity (N = 954)
30% 29%35%
29%
14% 12%
31% 32%26% 27% 28%
23%
39% 39% 38%
45%
57%
65%
0%
10%
20%
30%
40%
50%
60%
70%
Level of Covid-19in the fall of 2021
Program/school’s resources
Program’s COVID-19 safety and
prevention plans for in-person
learning
Whether teachersare vaccinated
Whether childrenare vaccinated
Program’s virtual learning option
Major factor Minor factor Not a factor at all
21% 24% 24% 21%
8%4%
52%
41%
62%
35%28% 28%
46%39%
56%
46%
27% 29%
39%
30%34%
43%
9% 7%
0%
10%
20%
30%
40%
50%
60%
70%
Level of Covid-19in the fall of 2021
Program/school’s resources
Program’s COVID-19 safety and
prevention plans for in-person
learning
Whether teachersare vaccinated
Whether childrenare vaccinated
Program’s virtual learning option
White, Non-hispanic Black Hispanic Other, non-hispanic

27
Figure 16-2. Major factors that would affect decision about in-person classes in the fall by
Household Income (N = 954)
Figure 16-3. Major factors that would affect decision about in-person classes in the fall by
Parent Education (N = 954)
42%
31%
49%
39% 38%
25%29% 29%
34%
28%
11% 10%
0%
10%
20%
30%
40%
50%
60%
Level of Covid-19in the fall of 2021
Program/school’s resources
Program’s COVID-19 safety and
prevention plans for in-person
learning
Whether teachersare vaccinated
Whether childrenare vaccinated
Program’s virtual learning option
Less than $25,000 $25,000 or above
50%42%
58%52%
34%
46%
35%
25%
36%
25%17% 15%
23% 24%31%
21%13%
9%
30% 33% 33% 33%
9%5%
0%
10%
20%
30%
40%
50%
60%
70%
Level of Covid-19in the fall of 2021
Program/school’s resources
Program’s COVID-19 safety and
prevention plans for in-person
learning
Whether teachersare vaccinated
Whether childrenare vaccinated
Program’s virtual learning option
Less than high school High school Some college BA or higher

28
Figure 17. If you could enroll the child in free, high quality pre-K this fall, would you take
advantage of this opportunity? (N = 794, only those not entering kindergarten in the fall)
Figure 17-1. If you could enroll the child in free, high quality pre-K this fall, would you take
advantage of this opportunity?: By Race/Ethnicity (N = 794)
60%21%
7%
13%
Very likely Somewhat likely Not very likely Not likely at all
54%
77%
68%
57%
23%
14% 16%
24%
7%4% 6%
10%16%
4%10% 9%
0%
10%
20%
30%
40%
50%
60%
70%
80%
90%
White, Non-hispanic Black Hispanic Other, non-hispanic
Very likely Somewhat likely Not very likely Not likely at all

29
Figure 17-2. If you could enroll the child in free, high quality pre-K this fall, would you take
advantage of this opportunity? By Household Income (N = 794)
Figure 17-3. If you could enroll the child in free, high quality pre-K this fall, would you take
advantage of this opportunity? By Parent Education (N = 794)
70%
19%
0%
11%
59%
21%
8%13%
0%
10%
20%
30%
40%
50%
60%
70%
80%
Very likely Somewhat likely Not very likely Not likely at all
Less than $25,000 $25,000 or above
69%
53%
62%59%
2%
23% 23% 21%16%
5% 4%9%
13%18%
11% 11%
0%
10%
20%
30%
40%
50%
60%
70%
80%
Less than high school High school Some college BA or higher
Very likely Somewhat likely Not very likely Not likely at all

30
Figure 18. Would the availability of universal free pre-K save your family from otherwise
paying for it, or would the child be attending pre-K for free regardless? (N = 638)
Figure 18-1. Would the availability of universal free pre-K save your family from otherwise
paying for it, or would the child be attending pre-K for free regardless? By Race/Ethnicity
(N = 638)
65%
34%
0% 10% 20% 30% 40% 50% 60% 70%
Save family or the child's guardian(s) from paying
Child would have attended pre-K for free regardless
67%
33%
49%
51%
65%
33%
73%
27%
0% 10% 20% 30% 40% 50% 60% 70% 80% 90% 100%
Save family or the child's guardian(s) from paying
Child would have attended pre-K for free regardless
White, Non-hispanic Black Hispanic Other, non-hispanic

31
Figure 18-2. Would the availability of universal free pre-K save your family from otherwise
paying for it, or would the child be attending pre-K for free regardless? By Household
Income (N = 638)
Figure 18-3. Would the availability of universal free pre-K save your family from otherwise
paying for it, or would the child be attending pre-K for free regardless? By Parent
Education (N = 638)
35%
59%
68%
32%
0% 10% 20% 30% 40% 50% 60% 70% 80% 90% 100%
Save family or the child's guardian(s) from paying
Child would have attended pre-K for free regardless
Less than $25,000 $25,000 or above
39%
61%
53%
45%
62%
38%
80%
20%
0% 10% 20% 30% 40% 50% 60% 70% 80% 90% 100%
Save family or the child's guardian(s) from paying
Child would have attended pre-K for free regardless
Less than high school High school Some college BA or higher

32
Figure 19. Percent of parents who are overwhelmed supporting Remote/Hybrid preschool
Figure 19-1. Percent of parents who are overwhelmed supporting Remote/Hybrid
preschool, Spring 2021: By Race and Ethnicity
47%
23%
5%
21%
31%
20%
27%
23%
0%
5%
10%
15%
20%
25%
30%
35%
40%
45%
50%
Very Moderately Slightly Not at all
Fall 2020, N = 105 Spring 2021, N = 52
38%
7%
32%
24%
37%32% 31%
0%
17%
24%21%
37%34%
46%
20%
0%0%
10%
20%
30%
40%
50%
Very ModeratelySlightly Not at all
White, Non-hispanic Black Hispanic Other, Non-hispanic

33
Figure 20. Most common problem working parents reported: Getting less work done
because of ECE issues
Figure 21. Reasons contributed to household decision against sending the child to some
type of program (N = 428)
11%
23%
12%
32%
7%
15%
9%
28%
0%
5%
10%
15%
20%
25%
30%
35%
Laid off/Closed buiness Work hours reduced Pay reduced Less work done due to childcare/education
Fall 2020 (N = 697) Spring 2021 (N = 669)
14%16%
46%
0%
5%
10%
15%
20%
25%
30%
35%
40%
45%
50%
Program not offered in person Program not offered remotely Worried about possible coronavirusexposure

34
Figure 21-1. Reasons contributed to household decision against sending the child to some
type of program by Race/Ethnicity (N = 428)
12% 10%
29%26%
37%
70%
16% 15%
70%
5%
39%
58%
0%
10%
20%
30%
40%
50%
60%
70%
80%
Program not offered in person Program not offered remotely Worried about possible coronavirusexposure
White, Non-hispanic Black Hispanic Other, Non-hispanic