Embed Size (px)
Citation preview
p. 1
Impacts on Rooftop Solar Adoption from Proposed Changes
to California’s Net Metering Policy
Justin McCrary University of California, Berkeley
National Bureau of Economic Research
Executive Summary ........................................................................................................................ 3
I. Qualifications .......................................................................................................................... 6
II. Background on the rooftop solar industry .............................................................................. 8
A. General background ......................................................................................................... 8
B. Description of the current NEM system ........................................................................... 9
C. Summary of proposals by IOUs and ORA ..................................................................... 11
1. Pacific Gas and Electric Company ............................................................................. 12
2. San Diego Gas and Electric Company ....................................................................... 14
3. Southern California Edison ........................................................................................ 16
4. Office of Ratepayer Advocates ................................................................................... 17
III. The economics of rooftop solar panel adoption ................................................................. 18
A. Economic theories of decision-making .......................................................................... 18
1. Discount rates and present orientation ........................................................................ 19
2. Risk aversion .............................................................................................................. 21
3. Limited attention and bounded rationality .................................................................. 22
4. The chilling effect of policy uncertainty .................................................................... 24
B. The decision to install a rooftop solar system ................................................................ 25
1. High up-front fixed cost ............................................................................................. 25
p. 2
2. A stream of future benefits ......................................................................................... 27
C. The Salt River Project .................................................................................................... 28
1. Changes in the rate structure applied to would-be rooftop solar adopters reduced
adoption to almost zero ......................................................................................................... 28
2. The SRP example cannot be used to calculate the elasticity of demand .................... 29
IV. Changes to net-metering policies are likely to impact rooftop solar adoption .................. 32
A. A decrease in the stream of future revenues .................................................................. 32
B. An increase in uncertainty .............................................................................................. 34
1. An asymmetry between rates paid to the IOU and rates received from the IOU
increases uncertainty ............................................................................................................. 34
2. A demand charge increases uncertainty ..................................................................... 36
3. The installed capacity fee as proposed by ORA increases uncertainty ...................... 37
4. Consumers will not benefit from NEM as a hedge against electricity price increase 37
C. A virtue of NEM is simplicity ........................................................................................ 38
V. A way forward ...................................................................................................................... 40
p. 3
Executive Summary
This report is focused on the economics of rooftop solar photovoltaic (“PV”) adoption by California residential consumers. Economics is the study of choice under scarcity. Environmental considerations play a role in consumers’ decisions, yet adoption of rooftop solar is undoubtedly in great part an economic choice. This report addresses the following questions:
• What are the costs of rooftop solar systems from the perspective of a residential consumer contemplating adoption? What are the benefits? And how are these weighed against each other in light of the certain up-front costs and uncertain future benefits?
• What are the likely impacts on residential rooftop solar adoption of changes proposed by the investor-owned utilities (“IOUs”) and the Office of Ratepayer Advocates (“ORA”) to California’s existing net energy metering (“net metering” or “NEM”) policy?
The decision to install a rooftop solar system for a California residential consumer is characterized by the following features:
• The consumer must bear either a large up-front cost of purchasing and installing the rooftop solar system, or must commit to a long-term payment plan (e.g., a 20-year solar lease or similar commitment, such as offered by various solar providers).1
• The consumer may stand to benefit from savings on future electricity expenses, to the extent that (a) the consumer faces a lower energy bill due to direct reductions in electricity purchased from their utility and (b) net metering compensates a consumer for excess electricity exported to the grid.
Insights from psychology inform current economic theories of decision-making. To understand the consumer’s decision to adopt rooftop solar requires investigating the following concepts which are well established in the academic literature:
• discount rates and present orientation,
• risk aversion given uncertainty, and
• limited attention and bounded rationality. Discount rates and present orientation
Due to the time value of money, the benefits to consumers of reduced power expenses in the future are not worth as much as they would be, were they realized in the present. A standard approximation for how much a consumer values a flow of future benefits is exponential discounting. This approach, which is used as part of the California Public Utilities Commission’s (“CPUC”) Public Tool in the current proceeding (Rulemaking 14-07-002),
1 See for example SolarCity, “SolarLease: simple and predictable,” http://www.solarcity.com/residential/how-much-do-solar-panels-cost#solarlease, accessed on 10/18/2015 and Sunrun, “Solar Services and Plans,” http://www.sunrun.com/our-plans-and-services, http://www.sunrun.com/our-plans-and-services, accessed on 10/20/2015.
p. 4
imputes to consumers a certain degree of between-period internal consistency.2 However, a large body of evidence from economics and psychology suggests that consumers may discount the future in ways that depart from exponential discounting. These departures have the result that many consumers may be more present-oriented than the Public Tool might suggest.
Risk aversion given uncertainty Another aspect of consumer behavior that is not appreciated by the Public Tool is risk aversion. Just as future benefits are discounted by consumers due to the time value of money, uncertain benefits are discounted by consumers due to risk aversion.3 To appreciate that considerations of risk are relevant to the policy decision the CPUC confronts, note that the current ORA NEM successor tariff proposal guarantees a particular rate structure for only the first 10 years, at which point consumers would be placed on a new rate. The new rate is unpredictable for consumers and may additionally be associated with a higher fixed charge. Consumers have no ability to control that new rate through their own behavior — and thus bear risk under that plan that may make adoption less attractive. It may be particularly difficult to predict the impact on consumer adoption of rooftop solar to the extent that the ORA proposal imposes on consumers large new risks with which there is very little experience.
The ORA proposal is not alone in giving consumers large risks with which they have little experience. Relative to the ORA proposal, the IOU proposals make it even harder for consumers to predict whether they would see any savings from rooftop solar adoption. Some of the IOU proposals involve new charges, such as demand charges, and simultaneously introduce new systems, such as time-of-use (“TOU”) pricing or an asymmetry to net metering. Consumers have experience with none of these features.
Limited attention and bounded rationality In addition, consumers may display bounded rationality when facing complex decisions. Consumers have a limited ability to perform complicated calculations and generally dislike time spent investigating and understanding choices. When faced with a difficult calculation, consumers tend to use heuristics — strategies for simplifying a complex decision by reducing it to a simple decision (for example, “to avoid getting a speeding ticket, mimic the speed of the cars around you”). Consumers contemplating a complex investment decision may exhibit a bias towards a default, such as the status quo (failure to adopt). All of the changes to California’s current NEM program proposed by the IOUs and ORA entail substantial additional complexity.
Aspects of decision-making may interact with one another in unpredictable ways
Moreover, discounting, risk and complexity may intersect in meaningful ways to discourage adoption. For example, consumers considering making a large up-front investment in order to reduce future costs will often wonder about their “break-even date.” They may be particularly troubled by the mere existence of a worst-case scenario in which they never recoup their investment. If consumers do generally apply to rooftop solar adoption heuristics such as “avoid
2 I take no position on the accuracy of the assumptions made as part of the Public Tool calculations, nor of the predictions made by it. I understand that various parties take issue with its assumptions and calculations. 3 A risk averse person is less apt to install a rooftop solar system than would be a similarly situated person who does not mind some level of risk.
p. 5
the worst-case scenario,” then it is predictable that adoption would be hindered by increases in risk and complexity.
In summary, the riskiness and complexity of the choice confronting consumers should be central considerations for the CPUC. One cannot assume that solar adoption will continue simply because the Public Tool or any particular net present value or discounted cash flow analysis suggests that it is cost-beneficial to adopt. Consumer demand is nuanced and hard to predict in the face of new proposals. It may be possible to estimate changes to consumer demand when new proposals represent minor departures from incumbent policies, but this can hardly be said of the IOU and ORA proposals. I understand that there is a statutory requirement that successor tariffs “ensure that customer-sited renewable distributed generation continues to grow sustainably.” 4 I conclude that there may be substantial conflict between the IOU and ORA proposals and the statutory mandate.
Even if there were no increase in the complexity of the rooftop solar adoption decision — that is, even if the IOU and ORA proposals more closely resembled the existing NEM system — the proposed changes all reduce the savings from rooftop solar adoption, by design. A risk is that even highly informed, rational, and risk-neutral consumers may determine that it is not in their financial interest to adopt rooftop solar if the CPUC inadvertently “overshoots” and adopts a rate that makes the economics untenable. In such a scenario, one cannot assume that consumer adoption would rebound to the same rate it would have been, in the event the CPUC recognizes the overshooting and adjusts course. Sizable changes and their potential reversals, rather than incremental, measured ones, are likely to contribute to policy uncertainty, which discourages large investments. A great deal of evidence supports the idea that when policy uncertainty is high, investment falls. Moreover, as I underscore below, if consumer adoption were to fall precipitously due to stark departures from the current NEM system, a variety of factors would lead to dampened future adoption. This underscores the need to move deliberately and incrementally in order to avoid fully and durably throttling consumer adoption of rooftop solar. Policy changes adapted in such a fashion would provide a clearer sense of how these changes are likely to affect the behavior of market participants. Thus moving carefully now may position the CPUC to be able to move forward in the future with the information it may want to make the best choices for the state.
4 California Public Utilities Code, Division 1, Part 2, Chapter 7, Article 3, Section 2827.1.(b).(1).
p. 6
I. Qualifications
I am an economist with expertise in economic modeling and statistical methods, among
other subjects. I received my A.B. in Public Policy from Princeton University in 1996 and
obtained my Ph.D. in Economics at the University of California, Berkeley (“Berkeley”) in 2003.
After close to five years as Assistant Professor of Public Policy and Assistant Professor of
Economics (courtesy) at the University of Michigan, I became an Assistant Professor of Law at
Berkeley in January 2008 and was promoted to Professor in July 2010. At Michigan, I taught
courses on introductory statistics and advanced economic theory to M.P.P. students and on
advanced econometrics to Ph.D. students. At Berkeley, I teach courses on introductory,
intermediate, and advanced statistics to J.D. students, L.L.M. students, and Ph.D. students; on
law and economics to J.D. students as well as undergraduates; and on business law to J.D.,
L.L.M., and M.B.A. students.
In addition to my post as Professor, I am the Founding Director of D-Lab, the Social
Sciences Data Laboratory at Berkeley. At D-Lab, I lecture on and advise graduate students and
faculty regarding high-performance computing, statistical software, and statistical techniques.
From September 2009 until July 2014, when I began to direct the D-Lab, I co-directed
the Law and Economics Program at Berkeley Law with Bob Cooter and Dan Rubinfeld
(2008−2011) and with Bob Cooter and Eric Talley (2012−2014).
Since 2008, I have codirected the Economics of Crime Working Group of the National
Bureau of Economic Research (“NBER”). The NBER is the preeminent professional association
of economists in the world, with approximately 1,300 members worldwide. I was invited to
become a Faculty Research Fellow of the NBER in 2006 and remained in that position until
2012, when I was invited to become a Faculty Research Associate.

p. 7
My research spans a diverse range of topics, including antitrust, crime, employment
discrimination, econometric and statistical methodology, education, fertility, financial markets,
income inequality, and monetary policy. Many of my articles have been published in leading
field journals within economics, such as the Review of Economics and Statistics and the Journal
of Econometrics. In addition, I have written or co-written three papers that were published in the
top economics journal in the world, the American Economic Review, and have co-edited a book,
Controlling Crime: Strategies and Tradeoffs, published by the University of Chicago Press. Over
the years, my research has been supported by the University of Michigan, the University of
California, Berkeley, the MacArthur Foundation, the NBER, the National Institutes of Health,
the National Science Foundation, and the Robert Wood Johnson Foundation.
I am frequently asked to review articles for the leading journals within economics,
including Econometrica, the American Economic Review, the Quarterly Journal of Economics,
the Journal of Political Economy, the Review of Economic Studies, the Review of Economics
and Statistics, and the American Law and Economics Review.
This report was prepared at the request of SolarCity Corporation. I have been assisted by
staff of Cornerstone Research, who worked under my direction. My compensation in this matter
is in no way contingent or based on the content of my opinion or the outcome of this or any other
matter.

p. 8
II. Background on the rooftop solar industry
A. General background
As part of California’s effort to install 3,000 MW of new solar energy over the period
2007–2017, the CPUC oversees the California Solar Initiative (“CSI”).5 The goal of the CSI
program is the installation of 1,940 MW of solar capacity by the end of 2016.6 The CSI program
is a product of former Governor Schwarzenegger’s “Million Solar Roofs” objective for
California.7 In its Annual Program Assessment of the CSI program, the CPUC noted that “many
of the IOU’s CSI General Market rebate programs are now closed” and that “NEM and the
Federal Investment Tax Credit (ITC) are playing a larger role in making customer-sited solar
generation cost-effective relative to available CSI incentives.”8
As of December of 2014, only 9% of customer-sited solar PV capacity in California did
not take service under a NEM tariff. But these 9% represent only 0.17% of solar customers
interconnected. Therefore, projects eligible for NEM that tend to not take service under a NEM
tariff are typically large projects that are “unlikely to export generation to the electric grid.”9
California Assembly Bill 327 (“AB 327”), signed into law in 2013, requires the IOUs to
offer NEM tariffs to eligible customers until July 1, 2017 or until the date when a utility reaches
5 California Public Utilities Commission, “About the California Solar Initiative,”
http://www.cpuc.ca.gov/puc/energy/solar/aboutsolar.htm, accessed on 10/18/2015. 6 California Public Utilities Commission, California Solar Initiative, Annual Program Assessment, 06/2015, p. 7. 7 California Public Utilities Commission, “About the California Solar Initiative,”
http://www.cpuc.ca.gov/puc/energy/solar/aboutsolar.htm, accessed on 10/18/2015. 8 As I discussed below, the ITC is scheduled to step down on December 31, 2016. In this context, it seems that the
importance of NEM in rooftop solar adoption is even greater. California Public Utilities Commission, California
Solar Initiative, Annual Program Assessment, 06/2015, p. 8. 9 California Public Utilities Commission, California Solar Initiative, Annual Program Assessment, 06/2015, p. 19.
p. 9
its 5% NEM program cap, whichever is earlier. I understand that as of September 2015, the
installed solar capacity for Pacific Gas and Electric Company (“PG&E”) customers represents
3.46% of their aggregate peak demand; for Southern California Edison (“SCE”), this number is
2.86%; and for San Diego Gas and Electric Company (“SDG&E”), it is 3.67%.10 AB 327
requires the CPUC to adopt an uncapped successor tariff by December 31, 2015 that will apply
to new IOU customers who go solar after their utility has reached its 5% NEM program cap.11
Pursuant to a 2014 CPUC decision, IOU customers who go solar before their utility reaches its
5% NEM program cap (or before July 1, 2017, whichever comes first) are grandfathered onto the
current NEM rules for a 20-year period.12
On July 10, 2014, the CPUC initiated Rulemaking 14-07-002 to “develop a successor to
existing net energy metering (NEM) tariffs as required in Assembly Bill 327.”13 As part of these
proceedings, parties were invited to submit proposals for the NEM successor tariff, several of
which I discuss in this report.
B. Description of the current NEM system
Currently, savings from rooftop solar arrays come to consumers in two forms:
10 The installation rates are calculated as the ratio of the total installed NEM capacity to the aggregate customer peak
demand for each of the IOUs. 11 California Public Utilities Commission, California Solar Initiative, Annual Program Assessment, 06/2015, p. 19.
Jeff St. John, “AB 327: From California Solar Killer to Net Metering Savior?,” GreenTech Media, 09/03/2103,
http://www.greentechmedia.com/articles/read/ab-327-from-california-solar-killer-to-net-metering-savior accessed
on 10/25/2015. 12 California Public Utilities Commission, Decision establishing a Transition Period Pursuant to Assembly Bill 327
for Customers enrolled in Net energy Metering Tariffs, 03/27/2014. 13 California Public Utilities Commission, Order Instituting Rulemaking to Develop a Successor to Existing Net
Energy Metering Tariffs Pursuant to Public Utilities Code Section 2827.1, and to Address Other Issues Related to
Net Energy Metering, 07/10/2014, p. 1.
p. 10
• when energy from a solar system is produced at the same time as it is consumed,
consumers do not need to rely on energy providers for electric generation. Consumers
thus save money they would have otherwise spent on obtaining energy; and
• when the supply of energy from a solar system is greater than the consumer’s
instantaneous energy demands, energy is sent back to the grid and is credited to the
consumer on a one-for-one basis according to the retail rate schedule.
Under the current NEM system, both types of savings are priced in the same way, at the
retail rate. Therefore, from the point of view of the consumer under the current NEM system,
whether the energy from the solar system is produced at the same time as she consumes it does
not impact her savings. The calculation of the impact of solar panel adoption on a consumer’s
bill only depends on the balance between the total amount of energy consumed in a month by the
consumer (independent of what the source for this energy is) and the total amount of energy
produced by the solar system (independent of when this energy was produced and whether it was
immediately consumed by the consumer or sent back to the grid). The balance of energy is then
priced at the applicable retail rate.14
I understand that the current non-CARE residential rates for electricity are tiered and
cover the following range:
• For PG&E, from 16.7¢ per kWh to 32.1¢ per kWh,15
• For SDG&E, from 16.5¢ per kWh to 39.6¢ per kWh,16
14 I understand that NEM customers can opt-in to TOU rates, in which case the previous reasoning does strictly not
apply. 15 The tariff schedule for PG&E can be found at: http://www.pge.com/tariffs/tm2/pdf/ELEC_SCHEDS_E-1.pdf
p. 11
• For SCE, from 15.1¢ per kWh to 30.2¢ per kWh.17
The CPUC recently adopted a decision overhauling the retail rate structure for residential
customers of the IOUs in a way that will significantly affect the economics of installing rooftop
solar in California.18 The new structure does away with the current 4-tier inclining block rate
system where the per-kWh charge in the highest tier is more than twice the per-kWh charge in
the lowest tier. Between 2015 and 2019, the tiers will gradually be “flattened” to a two-tier
structure where the energy charge in the top tier is only 25% higher than the energy charge in the
bottom tier, plus a third “super-user” tier that is expected to apply to relatively few customers.
The effect of this change on the economics of rooftop solar is significant. In PG&E territory, bill
credits for high tier users will be reduced from 33.5¢ per kWh today to 23.7¢ per kWh in 2019, a
30% reduction. In addition, the new rate structure includes a monthly $10 minimum bill and the
IOUs are expected to propose monthly fixed charges of up to $10 in future rate cases.
C. Summary of proposals by IOUs and ORA
In this section I summarize proposed changes to the current NEM system by the IOUs
and ORA.19 A summary table is provided below, but the following section details the proposals.
16 The tariff schedule for SDG&E can be found at: http://regarchive.sdge.com/tm2/pdf/ELEC_ELEC-
SCHEDS_DR.pdf 17 The tariff schedule for SCE can be found at: https://www.sce.com/NR/sc3/tm2/pdf/ce12-12.pdf 18 California Public Utilities Commission, Decision on Residential Rate Reform for Pacific Gas and Electric
Company, Southern California Edison Company, and San Diego Gas & Electric Company and Transition to Time-
Of-Use Rates, 07/03/2015. 19 This section is based my review of: Pacific Gas and Electric Company’s (U 39 E) Proposal for Net Energy
Metering Successor Tariff, 08/03/2015; San Diego Gas & Electric Company (U 902 E) Proposal for Successor Net
Energy Metering Tariff, 08/03/2015; Southern California Edison Company’s (U 338-E) Response to the
Administrative Law Judge’s Ruling Seeking Party Proposals for the Successor Tariff or Contract, 08/03/2015; and
p. 12
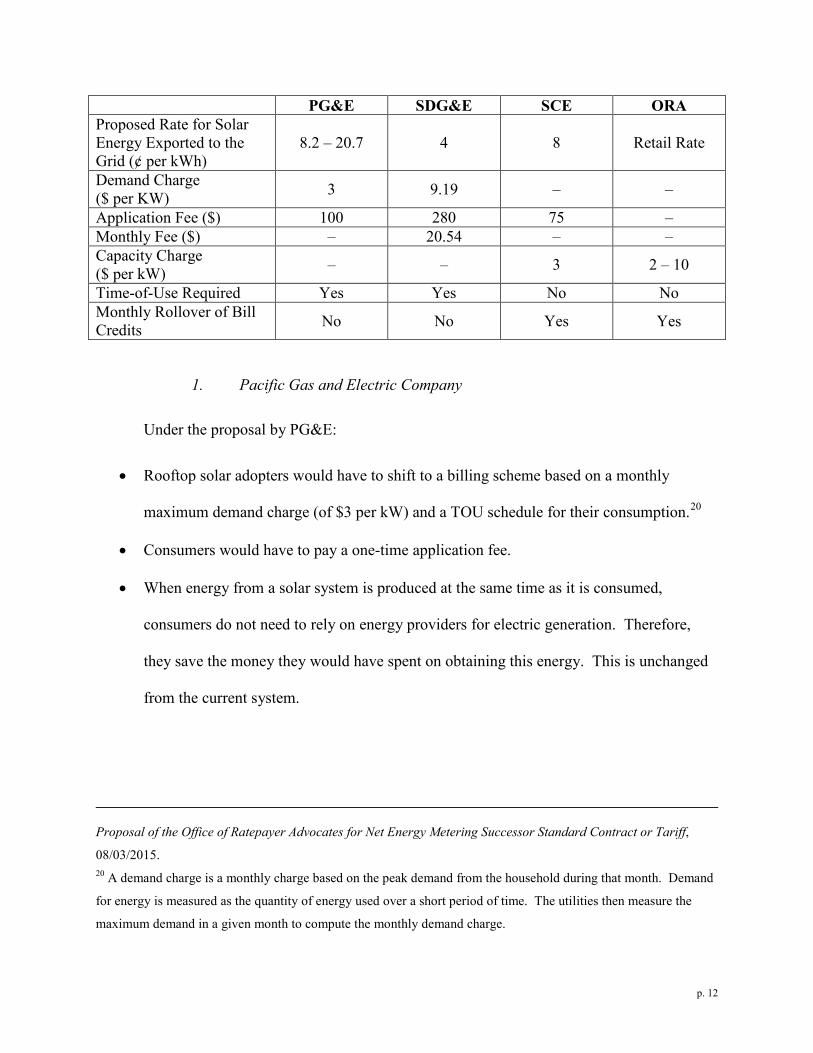
PG&E SDG&E SCE ORA Proposed Rate for Solar Energy Exported to the Grid (¢ per kWh)
8.2 – 20.7 4 8 Retail Rate
Demand Charge ($ per KW) 3 9.19 – –
Application Fee ($) 100 280 75 – Monthly Fee ($) – 20.54 – – Capacity Charge ($ per kW) – – 3 2 – 10
Time-of-Use Required Yes Yes No No Monthly Rollover of Bill Credits No No Yes Yes
1. Pacific Gas and Electric Company
Under the proposal by PG&E:
• Rooftop solar adopters would have to shift to a billing scheme based on a monthly
maximum demand charge (of $3 per kW) and a TOU schedule for their consumption.20
• Consumers would have to pay a one-time application fee.
• When energy from a solar system is produced at the same time as it is consumed,
consumers do not need to rely on energy providers for electric generation. Therefore,
they save the money they would have spent on obtaining this energy. This is unchanged
from the current system.
Proposal of the Office of Ratepayer Advocates for Net Energy Metering Successor Standard Contract or Tariff,
08/03/2015. 20 A demand charge is a monthly charge based on the peak demand from the household during that month. Demand
for energy is measured as the quantity of energy used over a short period of time. The utilities then measure the
maximum demand in a given month to compute the monthly demand charge.
p. 13
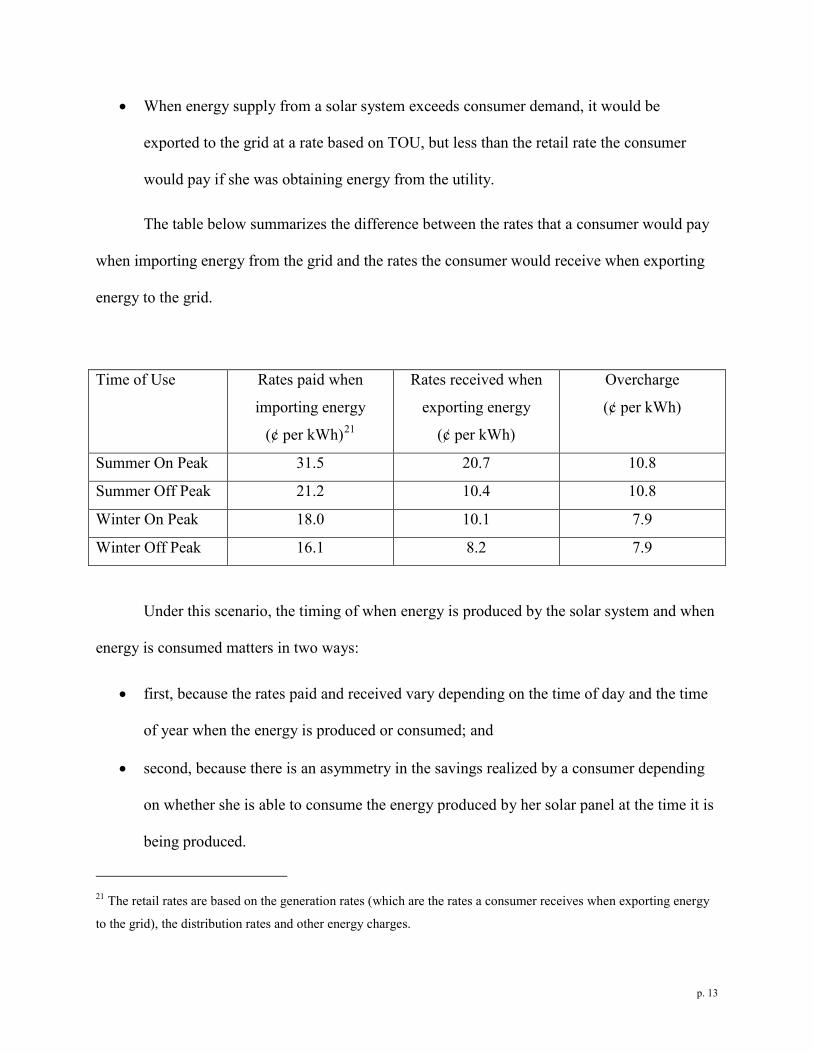
• When energy supply from a solar system exceeds consumer demand, it would be
exported to the grid at a rate based on TOU, but less than the retail rate the consumer
would pay if she was obtaining energy from the utility.
The table below summarizes the difference between the rates that a consumer would pay
when importing energy from the grid and the rates the consumer would receive when exporting
energy to the grid.
Time of Use Rates paid when
importing energy
(¢ per kWh)21
Rates received when
exporting energy
(¢ per kWh)
Overcharge
(¢ per kWh)
Summer On Peak 31.5 20.7 10.8
Summer Off Peak 21.2 10.4 10.8
Winter On Peak 18.0 10.1 7.9
Winter Off Peak 16.1 8.2 7.9
Under this scenario, the timing of when energy is produced by the solar system and when
energy is consumed matters in two ways:
• first, because the rates paid and received vary depending on the time of day and the time
of year when the energy is produced or consumed; and
• second, because there is an asymmetry in the savings realized by a consumer depending
on whether she is able to consume the energy produced by her solar panel at the time it is
being produced.
21 The retail rates are based on the generation rates (which are the rates a consumer receives when exporting energy
to the grid), the distribution rates and other energy charges.
p. 14
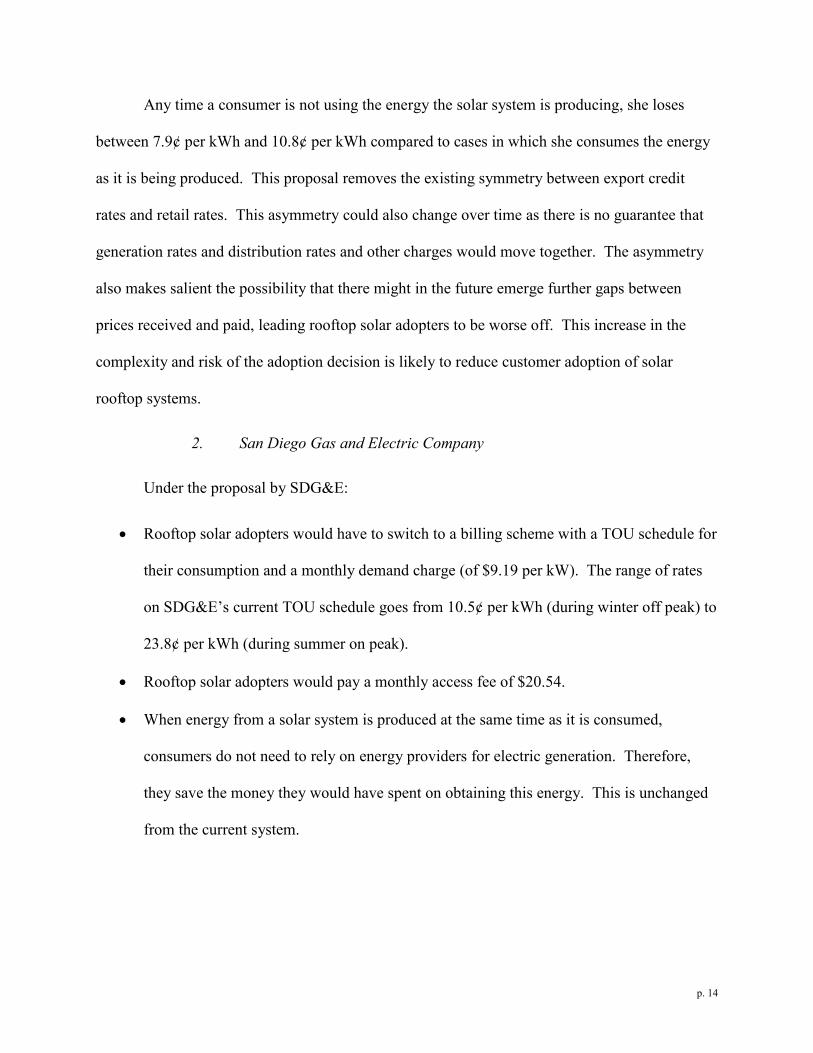
Any time a consumer is not using the energy the solar system is producing, she loses
between 7.9¢ per kWh and 10.8¢ per kWh compared to cases in which she consumes the energy
as it is being produced. This proposal removes the existing symmetry between export credit
rates and retail rates. This asymmetry could also change over time as there is no guarantee that
generation rates and distribution rates and other charges would move together. The asymmetry
also makes salient the possibility that there might in the future emerge further gaps between
prices received and paid, leading rooftop solar adopters to be worse off. This increase in the
complexity and risk of the adoption decision is likely to reduce customer adoption of solar
rooftop systems.
2. San Diego Gas and Electric Company
Under the proposal by SDG&E:
• Rooftop solar adopters would have to switch to a billing scheme with a TOU schedule for
their consumption and a monthly demand charge (of $9.19 per kW). The range of rates
on SDG&E’s current TOU schedule goes from 10.5¢ per kWh (during winter off peak) to
23.8¢ per kWh (during summer on peak).
• Rooftop solar adopters would pay a monthly access fee of $20.54.
• When energy from a solar system is produced at the same time as it is consumed,
consumers do not need to rely on energy providers for electric generation. Therefore,
they save the money they would have spent on obtaining this energy. This is unchanged
from the current system.

p. 15
• When energy supply from a solar system exceeds consumer demand, it would be
exported to the grid at a rate based SDG&E’s Default Load Aggregation Point rate which
is comparable to the wholesale rate. In SDG&E’s proposal, this rate is 4.0¢ per kWh.22
Again, under this scenario, the timing of when energy is produced by the solar system
and when energy is consumed by the consumers matters in two ways:
• first, because the rates paid and received vary depending on the time of day and the time
of year when the energy is produced or consumed; and
• second, because there is an asymmetry in the savings realized by a consumer depending
on whether she is able to consume the energy produced by her solar system at the time it
is being produced.
Any time a consumer is not using the energy the solar system is producing, she loses
between 6.5¢ per kWh and 19.8¢ per kWh compared to cases in which she consumes the energy
as it is being produced. This proposal removes the existing symmetry between export credit
rates and retail rates. The asymmetry also makes salient the possibility that there might in the
future emerge further gaps between prices received and paid, leading rooftop solar adopters to be
22 This rate is far less than half of the current lowest NEM rate. A recent poll of California consumers
commissioned by the California Solar Energy Industries Association and Brightline Defense has shown that: “8 in
10 Californians disapprove of utility efforts to reduce compensation for surplus electricity generated by rooftop solar
panels by more than 50%.” CalSEIA, “New Poll: Overwhelming Support for Rooftop Solar Power and related
Policies Among California Voters,” 10/14/2015,
http://www.calseia.org/index.php?option=com_content&view=article&id=265:new-poll--overwhelming-support-
for-rooftop-solar-power-and-related-policies-among-california-voters&catid=25:news&Itemid=120, accessed on
10/18/2015.
p. 16
worse off. Again, this increase in the complexity and risk of the adoption decision is likely to
reduce customer adoption of rooftop solar.
3. Southern California Edison
Under the proposal by SCE:
• Consumers would have to pay a monthly “Grid Access Charge” at a rate of $3 per kW
and based on the capacity of the system.
• When energy from a solar system is produced at the same time as it is consumed,
consumers do not need to rely on energy providers for electric generation. Therefore,
they save the money they would have spent on obtaining this energy. This is unchanged
from the current system.
• When the energy supply from a solar system exceeds consumer demand, electricity
would be exported to the grid at a rate of 8¢ per kWh.23
Again, under this scenario, the timing of when energy is produced by the solar system
and when energy is consumed by the consumers matters in two ways:
• first, because the rates paid and received vary depending on the time of day and the time
of year when the energy is produced or consumed; and
• second, because there is an asymmetry in the savings realized by a consumer depending
on whether she is able to consume the energy produced by her solar panel at the time it is
being produced.
23 This rate is roughly half of the current lowest NEM rate. See poll results, supra.
p. 17
Any time a consumer is not using the energy the solar system is producing, she loses
between 7.1¢ per kWh and 22.2¢ per kWh compared to cases in which she consumes the energy
as it is being produced.24 This asymmetry could also change over time as there is no guarantee
that rates paid and received would move together. Again, this makes salient the possibility of
future divergence between the retail rate and the export rate and the potential risk associated with
this asymmetry.
4. Office of Ratepayer Advocates
Under the proposal by the ORA, consumers would have to pay a monthly installed
capacity charge at a rate depending on NEM adoption at the time the consumer adopts the solar
system. This monthly charge ranges between $2 per kW of capacity (until the proportion of
solar panel adopters surpasses 6% of a utility aggregate customer peak demand) and $10 per kW
of capacity (after the proportion of solar panel adopters surpasses 7% of a utility aggregate
customer peak demand). Each consumer’s rate would be fixed for 10 years after the consumer
adopts rooftop solar at which point the rate would become the current rate given the proportion
of rooftop solar adopters compared to the aggregate customer peak demand of the utility or the
current installed capacity fee after 10 years.
First, one must note that a $10 per kW monthly installed capacity fee is substantial. For a
5 kW residential solar system, it represents an annual additional cost of $600, for 20 to 30
years.25 At this point, given how little is known about the elasticity of demand for solar panels,
one cannot know with certainty the impact that this fee would have on rooftop solar adoption.
24 The tariff schedule for SCE can be found at: https://www.sce.com/NR/sc3/tm2/pdf/ce12-12.pdf 25 This range of years reflects the fact that 20 years is a common solar lease term and 30 years is the typical life
expectancy of a solar panel.
p. 18
Furthermore, from the point of view of the consumer, a ten-year lock-in period carries a lot of
uncertainty. I understand that typical solar leases last for 20 years and the conservative life
expectancy of a solar panel is 30 years. Therefore a fixed cost for only 10 years exposes
consumers to 10 to 20 years of complete uncertainty. Indeed, no one can predict accurately what
the adoption for rooftop solar will be 10 years from the day they deploy a solar system. In
addition, there is no guarantee that 10, 20 or 30 years from now the schedule currently proposed
by the ORA will still be in place, since it does not address how the installed capacity charge will
evolve after the total installed capacity surpasses 8% of aggregate peak demand for each utility.
Therefore, there is no visibility for a consumer over the adequate time horizon for the adoption
of a solar system.
III. The economics of rooftop solar panel adoption
A. Economic theories of decision-making
At its core, economics is the study of decision-making under constraints and the
behaviors of individuals, firms, and organizations that emerge from such a context.26 A standard
approximation for consumer behavior specifically is that consumers engage in a transaction if it
passes a cost-benefit test, or if the benefits of the transaction outweigh its costs. However,
consumers often have to choose between transactions that may entail evaluation of costs and
benefits over time; evaluation of the scope for uncertainty; or evaluation of a particularly
complex decision. In the following section, I detail findings from economics that shed light on
26 “Microeconomics explains how and why these units make economics decisions.” Robert S. Pindyck, and Daniel
L. Rubinfeld, Microeconomic, Third Edition, Prentice-Hall: Englewood Cliffs, NJ, 1995, p.3.
p. 19
all three of these considerations, as all three are part of the decision to deploy a rooftop solar
system.
1. Discount rates and present orientation
An economic agent considering an investment today that may entail benefits in the future
has to compute the value to her in the present of those future benefits. A standard approximation
for the value to a consumer today of benefits in the future is the present discounted value
(“PDV”). Suppose that the flow of benefits in period t is 𝐵𝑡. Then the PDV of benefits from
periods 1 to T is ∑ 𝛿𝑡𝐵𝑡𝑇𝑡=1 . The quantity 𝛿 is known as a discount factor and is functionally
related to the discount rate, 𝑟, as 𝛿 = 1/(1 + 𝑟). The Public Tool implements calculations of
this type using a discount rate of 9%. Since for larger values of t, 𝛿𝑡 will be smaller, the effect of
discounting will be larger, the further away in the future the benefits materialize. This
summarizes the basic and intuitive phenomenon of the time value of money using a particular
functional form. The functional form of this discounting can be understood in different ways.
For example,
• savings will have a positive return against which any benefit will have to be compared,
since investing now to obtain the benefits of the investment entails an opportunity cost —
one cannot simultaneously save the investment and invest it and must instead choose one
or the other;
• inflation means that a given amount of money will allow an agent to buy less tomorrow
than she would be able to buy today;
• agents are impatient, and therefore, they value benefits in the future less than the same
benefits in the present;
p. 20
• agents account for the possibility that they will not survive until the benefits or costs are
realized; and
• agents think there is a constant per-period chance that benefits cease altogether, for
whatever reason (death is one example, but a qualitatively different one is a regulatory
change).
For this reason, the time-structure of costs and benefits is important in an agent’s
evaluation of an investment and in her decision to undertake this investment. Changes to the
temporal structure of benefits (e.g., whether they accrue early or late) will modify the PDV of
benefits and therefore affect the trade-off between investment and benefits. This makes an
investment more attractive, if the benefits are front-loaded and less attractive if the benefits are
back-loaded.
A wide body of evidence from economics, psychology, and other fields shows that
consumers often have a present orientation that is inconsistent with exponential discounting.
Individuals with a present orientation do not necessarily exhibit the internal consistency with
respect to time that is implied by exponential discounting. For example, a person might put off a
task until tomorrow, because they prefer to do it tomorrow, and yet when tomorrow comes they
may again put it off until the next day, because their preferences have shifted and they prefer to
do it the next day. Moreover, such an individual may put off doing the task (e.g., filing taxes,
losing weight, or writing a will) for a very long period of time, believing throughout that they
should and will do it “soon.”27 This is often thought of as a problem of self-control.28
27 David Laibson, “Golden Eggs and Hyperbolic Discounting,” The Quarterly Journal of Economics, Vol. 112, No.
2, 05/1997, pp. 443–477.
p. 21
When individuals have such a present orientation, they tend to engage in fewer
transactions that involve effort today and deliver rewards in the future, and they tend to engage
in more transactions that provide an immediate reward at future costs, relative to what a person
without such a present orientation would transact in.
2. Risk aversion
In the previous section, I detailed how agents make intertemporal trade-offs. This
framework assumes that agents know when and how costs and benefits are going to materialize.
However, there are many situations in which agents face a choice where the costs and/or benefits
are uncertain. The agent does not know with certainty what the outcome will be, whether in the
present or the future. In these settings, individuals display risk aversion: when they have a
choice between getting $0.50 with certainty or $1 with a 50% probability, they prefer the former.
In fact, economists have defined the concept of the “certainty equivalent,” which is the amount
of money at which one is indifferent between this amount of money with no risk and the
expected return from a lottery. The existence of risk aversion means that the “certainty
equivalent” is lower than the expected returns from a lottery. In other words, agents will only
choose risk over certainty when they think that the returns of these risks will be higher than the
returns they can get with certainty.29
Risk aversion is at the core of the insurance market: agents are willing to pay a premium
to an insurance company to not suffer very rare losses. Agents want to avoid low probability
28 R. H. Strotz, “Myopia and Inconsistency in Dynamic Utility Maximization,” The Review of Economic Studies,
Vol. 23, No. 3, 1955–1956, pp. 165–180. 29 Andreu Mas-Collel, Michael D. Whinston and Jerry R. Green, Microeconomic Theory, Oxford University Press:
New York, 1995, p. 186.
p. 22
losses so much that they are willing to pay more to not be exposed to them than what the losses
from these small probability events is, on average. Therefore, an increase in risk, even holding
average value constant, will diminish an agent’s valuation of a specific trade-off.
3. Limited attention and bounded rationality
Finally, in the previous sections, agents are assumed to be able to perfectly process all the
information relevant to the decision, perform difficult calculations and solve the maximization
problems they confront. However, recent findings have shown that agents have a limited amount
of attention and limited capacities to perform complex calculations and trade-offs.30 For
example, DellaVigna (2009) writes that agents “simplify a complex decision by being inattentive
to less salient features of a problem.”31
Economic agents tend “to resort to heuristics instead of solving the complex
maximization problem.”32 A heuristic is a simplified way of thinking about a decision problem
that has some complexity to it. It can be thought of as a mental shortcut or a rule-of-thumb. In
the executive summary, I gave one example of a heuristic pertaining to speeding. Another
example that is familiar to many pertains to phone calls received on a home telephone number.
Many calls are received — most of them from telemarketers. Prior to fielding the phone call,
many people look to see if they recognize the number calling and only field the phone call if they
30 The idea of bounded rationality, while not incorporated into standard economic theory, had already been offered
by Hebert Simon in 1955. Herbert A. Simon, “A Behavioral Model of Rational Choice,” The Quarterly Journal of
Economics, Vol. 69, No. 1, 02/1955, pp. 99–118. 31 Steffano DellaVigna, “Psychology and Economics: Evidence from the Field,” Journal of Economic Literature,
Vol. 42, No. 2, pp. 315–372, at p. 317. 32 Steffano DellaVigna, “Psychology and Economics: Evidence from the Field,” Journal of Economic Literature,
Vol. 42, No. 2, pp. 315–372, at p. 317.
p. 23
do. This is a rule-of-thumb that is often — but not always — correct and is quick to implement.
It is not hard to see, in light of the myriad decision problems confronting a typical individual,
why heuristics are prevalent.
However, even when sensible in some contexts, heuristics can lead to systematic errors.33
DellaVigna (2009) identifies at least five suboptimal heuristics agents use to simplify complex
decisions.34 Two of these are a “preference for the familiar,” and “choice avoidance.”35 Choice
avoidance happens when agents refuse the choice altogether, possibly in favor of a simple
default action, rather than make a difficult decision. This phenomenon has been found in several
settings, from choices of jam at a supermarket to enrollment in a 401(k) plan. Taken together,
these two heuristics form a basis for a well-known bias in decision making: the status quo bias.
As Samuelson and Zeckhauser (1988) have found, “faced with new options, decision makers
often stick with the status quo alternative, for example, to follow customary company policy, to
elect an incumbent to still another term in office, to purchase the same product brands, or to stay
in the same job.”36
In turn, the existence of these heuristics and their contribution to the status quo bias
means that when a decision becomes more complex, agents will tend to stick with the status quo
more often.
33 Sendhil Mullainathan, and Richard H. Thaler, “Behavioral Economics,” International Encyclopedia of the Social
and Behavioral Sciences, Volume 20, ed. Neil J. Smelser and Paul B. Baltes, 2001, pp. 1094–1100. 34 Steffano DellaVigna, “Psychology and Economics: Evidence from the Field,” Journal of Economic Literature,
Vol. 42, No. 2, pp. 315–372, at p. 353. 35 Steffano DellaVigna, “Psychology and Economics: Evidence from the Field,” Journal of Economic Literature,
Vol. 42, No. 2, pp. 315–372, at p. 355. 36 William Samuelson, and Richard Zeckhauser, “Status Quo Bias in Decision Making,” Journal of Risk and
Uncertainty, Vol. 1, 1988, pp. 7–59, at p.8.
p. 24
Finally, it is important to point out that these three features of decision-making —
discounting of the future, risk aversion and bounded rationality — can also intersect and interact
in important ways. When evaluating complex and uncertain future gains, consumers might focus
on worst-case scenarios.37 In particular, they might compare the worst case if they refrain from
adopting to the worst case if they decide to adopt rooftop solar. And the worst case scenario
after adoption might entail a pure loss if the up-front investment is never recouped. This is a
very salient feature of a choice, with agents often computing the point in time at which they
would “break even” after an important investment. In the case of solar rooftop and under a
worst-case scenario, it is possible that they would never break even under the IOU and ORA
proposals. This possibility would dissuade consumers from adopting rooftop solar.
4. The chilling effect of policy uncertainty
Insights from psychology are not the only reason economists would expect some decision
makers to avoid making decisions. In a dynamic context, where an investment decision that
could be made today could be deferred until tomorrow, the optimal investment plan of a
sophisticated individual adhering to exponential discounting entails many scenarios in which it is
optimal to do nothing. This makes good sense intuitively, because a decision not made today
could always be made tomorrow. In such a framework, a major effect of policy uncertainty is to
increase the number of scenarios in which a rational, optimizing agent would conclude that the
best decision was to make no new investments. This theoretical conclusion is robustly supported
37 For example, Gilboa and Schmeidler (1989) write that an economic agent “takes into account the minimal
expected utility […] when evaluating a bet” (original emphasis). Itzhak Gilboa and David Schmeidler, “Maxmin
Expected Utility with Non-unique Prior,” Journal of Mathematical Economics, Vol. 18, 1989, pp. 141–153.
p. 25
by empirical evidence.38 This research area has become of particular interest in understanding
investment decisions in uncertain environments such as those that prevail today, as the U.S.
economy emerges from the financial crisis with a great deal of uncertainty regarding many
factors that might affect a consumer’s long-run perspective.
Furthermore, once a policy change is made, policy uncertainty is introduced and durably
affects investment decisions. Even a reversal of the policy in face of a backlash or unexpected
reaction from investors cannot dispel the inherent uncertainty that the mere existence of the
policy change has introduced. Therefore, when considering policy changes, one must be
cautious and make sure that the changes introduced are not so large that one might regret them
and seek to reverse them, since by the time the policy itself is reversed, the die may have been
cast already.39
B. The decision to install a rooftop solar system
1. High up-front fixed cost
The adoption of rooftop solar entails an initial investment. This investment may either be
made directly by a consumer (e.g., those engaging in an outright purchase), or by a financing
38 Nicholas Bloom, “The Impact of Uncertainty Shocks,” Econometrica, Vol. 77, No. 3, 05/2009, pp. 623–685. 39 For example, in the face of uncertainty around the future of the Export-Import Bank, G.E. has decided to close its
Waukesha, Wisconsin, plant. A New York Times article devoted to this decision reads: “If funding for the Export-
Import Bank is quickly restored, will the Waukesha plant and its workers be spared? No, Mr. Rice [G.E.’s vice
chairman for global operations] said, the decision is irreversible. An extension of Export-Import Bank funding, he
said, would not remove the business risk that the bank might be killed a few years later.” Steve Lohr, “Ex-Im Bank
Dispute Threatens G.E. Factory that Obama Praised,” The New York Times, 10/25/2015,
http://www.nytimes.com/2015/10/26/business/ex-im-bank-dispute-threatens-ge-factory-that-obama-
praised.html?_r=0 accessed on 10/25/2015.

p. 26
entity (e.g., a solar rooftop provider).40 The investment level required may differ depending on
the size of the installed system and may decrease in future years due to improving technology.
On the other hand, other costs of installation may be less likely to decrease.41
Moreover, the federal government provides investment tax credits for solar installation,
but this incentive to adoption is due to step down on December 31, 2016. The current federal
investment tax credit represents 30% of the total system cost, which is a very significant share of
the cost.42 It can be carried forward (and possibly back) if the customer’s tax liability is smaller
than the credit in the tax year of installation.43 The 2008 Emergency Economic Stabilization Act
extended the solar investment tax credits through December 31, 2016.44 After this date, the tax
credit for individuals under Section 25D will drop to zero and the tax credit for businesses
(which I understand is used for solar leases) under Section 48 will drop to 10%.45 In the absence
of currently unanticipated changes, such as new tax credits for solar, or unanticipated cost 40 See generally Jeff Brady, “The Great Solar Panel Debate: To Lease or To Buy?” National Public Radio, February
10, 2015, available at http://www.npr.org/2015/02/10/384958332/the-great-solar-panel-debate-to-lease-or-to-buy.
Purchase, financing, and lease options are typically advertised on a provider website. See, for example,
http://www.solarcity.com/residential/how-much-do-solar-panels-cost, http://www.sungevity.com/financing-options,
or http://www.sunrun.com/our-plans-and-services. 41 I understand that a significant part of the cost of a solar system is soft cost and customer acquisition which may be
unlikely to decrease significantly at least in the short term. 42 Go Solar California, “Tax Credits for Solar System Purchase,”
http://www.gosolarcalifornia.ca.gov/consumers/taxcredits.php, accessed on 10/23/2015. 43 I understand that when a customer leases a solar system, the solar system owner can claim the tax credit and that
the savings are passed on to the customer, because of competitive pressures. Go Solar California, “Tax Credits for
Solar System Purchase,” http://www.gosolarcalifornia.ca.gov/consumers/taxcredits.php, accessed on 10/23/2015. 44 Go Solar California, “Tax Credits for Solar System Purchase,”
http://www.gosolarcalifornia.ca.gov/consumers/taxcredits.php, accessed on 10/23/2015. 45 Solar Energy Industries Association, The Solar Investment Tax Credit (ITC), 01/27/2015,
http://www.seia.org/sites/default/files/ITC%20101%20Fact%20Sheet%20-%201-27-15.pdf, accessed on
10/23/2015.
p. 27
reductions for solar, this change to federal tax policy will likely reduce, potentially substantially,
the rate of adoption of rooftop solar panels.
In addition, every consumer contemplating an investment entailing a high up-front fixed
cost must consider interest rates today and in the future to determine what is in her financial
interest. Rooftop solar is a significant up-front investment that produces a long-term stream of
benefits; many solar customers finance their systems either through a bank loan, their solar
provider or other means. Should interest rates rise from their current levels, one could
reasonably expect those higher interest rates to increase the cost of capital for all financing
options, further reducing the incentives to adopt rooftop solar.
2. A stream of future benefits
The primary driver behind solar rooftop adoption is the prospect of a reduced energy bill
in the future. Under the NEM program, the mechanism for reduced future energy bills is clearer
than under contemplated changes to the NEM program. In addition to IOU proposals to reduce
the rate at which rooftop solar adopters can sell electricity back to the grid, both the IOUs and
ORA propose fixed charges that would greatly diminish the value of the future benefits of
rooftop solar adoption.
For example, some of the IOUs’ proposed demand charges are not currently imposed at
any level on their residential customers. The ORA proposes a capacity charge, distinct from a
demand charge, which also would be substantial. Between the sunsetting of the federal
investment tax credit and the impact of residential rate reform and proposed changes to the NEM
program, the stream of future benefits associated with rooftop solar adoption will become (a)
smaller, (b) less certain, and (c) more complex. Any three of these changes on its own should be
expected to reduce solar adoption. Moreover, these changes might operate in concert to
p. 28
significantly reduce rooftop solar adoption. It is simply not known how consumers will react to
the prospect of higher complexity and less certainty in conjunction with the prospect of a smaller
stream of benefits.
C. The Salt River Project
1. Changes in the rate structure applied to would-be rooftop solar adopters
reduced adoption to almost zero
Earlier this year, the Salt River Project (“SRP”), the second largest electric utility in
Arizona, added new fees and rate structures for rooftop solar adopters in its service territory.
This change introduced monthly demand charges for new adopters that could reach $136 a
month for a typical residential unit during the Summer Peak (July and August), as well as a
significant fixed monthly charge of $32.44, among other changes.46 These charges were unique
to solar adopters, even though, due to their use of solar energy, the costs of serving them might
be lower than other consumers.47
Following this change, adoption of solar collapsed in SRP’s service territory. In fact, I
understand that the demand for new solar panels was reduced to almost zero. Specifically, the
number of applications for the first seven months of 2015 (the first months after the change in
tariffs) was only 6% of what it had been in the first seven months of 2014.48
46 Salt River Project, “Customer Generation Price Plan,”
http://www.srpnet.com/prices/home/customergenerated.aspx, accessed on 10/18/2015. 47 For example, households with solar arrays tend to demand less electricity from the grid in periods of peak
demand, since these are also periods of high generation from solar arrays due to high solar exposure at these times. 48 Comments of the Alliance for Solar Choice, Solar Energy Industries Association, California Solar Energy
Industries Association and Vote Solar on Party Proposals, 09/01/2015, p. 44.
p. 29
This demonstrates that demand for rooftop solar is elastic. In the case of SRP, the change
was so radical that demand collapsed and was reduced to almost zero.
In this report, I do not address whether this is a desirable outcome from the point of view
of the society as a whole. I do not opine on whether solar energy is the most efficient renewable
energy and on whether adoption of solar should be encouraged. I simply conclude that a
statutory requirement of the successor California tariff is to “ensure that customer-sited
renewable distributed generation continues to grow sustainably” and that, with respect to this
objective alone, changes in tariffs have an impact on adoption rates and a potentially large,
negative impact in particular.49
2. The SRP example cannot be used to calculate the elasticity of demand
One might try to infer from the SRP example the elasticity of demand of solar adopters
with respect to the cost-benefit balance of a solar array. This approach does not work for two
reasons:
• First, because solar adoption on the territories served by SRP went to almost zero, one
cannot infer the minimum decrease in benefits that would have been needed to drive
demand to almost zero. One can only conclude that this decrease was sufficient.
• Second, because the SRP proposal reflected both a decrease in residential customer
benefits but also an increase in uncertainty and complexity, one cannot attribute the drop
in demand solely to a cost-benefit analysis conducted by solar customers.
In this section, I detail briefly these two mechanisms.
49 California Public Utilities Code, Division 1, Part 2, Chapter 7, Article 3, Section 2827.1.(b).(1).
p. 30
To develop intuition for why a drop to virtually no demand constitutes an obstacle to
estimating the elasticity of demand, consider a simple linear demand for a given good. In this
case the demand function is a linear function of the price, yet by definition is bounded below by
zero. In other words, it takes the following functional form: 𝑞 = max (0,𝛼 + 𝛽 × 𝑝).
Suppose we start at an equilibrium where at a price p0 the quantity demanded of that good
is q0, where q0 is strictly greater than 0. When the price is increased to p1 one can observe the
decrease in quantity demanded (q0-q1) and infer from the change the parameters α and β — but
only if q1 is strictly greater than 0. If q1 is equal to 0 (this is approximately the case of SRP),
then one can only infer that there is a price point between p0 and p1 at which demand becomes
null and that any price beyond this point (including p1) will result in a null demand. However,
one cannot infer where this price point is, only that it is smaller than p1. Therefore one cannot
calculate the parameters α and β but only bounds on their relative values. In other words, the
simple approach that would consist in drawing a straight line between the demand for rooftop
solar before the change in tariffs and the demand after the change in tariffs would underestimate
how price-sensitive consumers are. It is possible that smaller price changes than the one
performed by SRP might have resulted in the demand going to zero.
In other words, the only lesson one can draw from the SRP experience is that consumers
do respond to changes in the utilities’ policies and rate structures, but one cannot quantify the
minimum change to those structures that would make the demand go to zero or almost zero. One
can only infer that the change in SRP was large enough to induce a drop of adoption to almost
zero.
This insight also creates a sense of what kind of policy changes are most amenable to
estimating demand elasticities that would be relevant to understanding better consumer
p. 31
responsiveness to those policy changes. The right kind of policy change for understanding how
consumers might react to additional costs is small and incremental. Large policies that result in a
throttling of demand are not helpful for estimating demand elasticities, as a general matter.
Furthermore, SRP did not just modify the cost-benefit analysis of consumers. SRP
introduced substantial changes (in particular, a solar-specific demand charge) in its rate structure,
and not simply in the amounts rooftop solar customers might pay. For reasons that I detail
below, a demand charge is a mechanism that increases the risk borne by the consumer and
certainly increases complexity. In fact, a demand charge is so difficult to understand that SRP
dedicated an entire section of their website to explaining what it is, how it is calculated and how
it can be reduced. This section includes a 3-minute video entitled “Understanding Electricity
Demand,” several graphs and an interactive demand calculator.50 This complexity may be
appropriate for other sectors of the electricity market, where demand charges may be common
due to the sophistication of the customers (e.g., commercial), yet are clearly beyond the
sophistication of the typical residential customer contemplating solar adoption.
As I have discussed above, consumers put a large weight on the uncertainty and the
complexity of a decision. And, in general, they try to avoid both. Since it is extremely difficult
for residential customers to predict and control demand, especially at the very granular levels
required by the demand charge imposed by SRP, the introduction of a demand charge resulted in
an increase in uncertainty for solar rooftop adopters. Therefore, it is reasonable to infer that the
introduction of a demand charge contributed to the drop in demand beyond its effect on the
expected revenue from the installation of a solar system. Based on my understanding of the
Public Tool, these considerations are not taken into account and hence are not an appropriate 50 This section can be accessed at: http://www.srpnet.com/prices/home/customergenerated.aspx
p. 32
basis for estimating what consumers might do in the presence of proposed changes to
California’s NEM program.
IV. Changes to net-metering policies are likely to impact rooftop solar adoption
A. A decrease in the stream of future revenues
In the following table, I summarize the additional charges that customers would face
under each of the proposals under study in this report. In order to compute these estimates, I
make the following assumptions:
• a typical residential solar array of 5 kW produces 7,500 kWh per year,51
• half of this energy is immediately used by the household, the other half is sent back to the
grid,52
• the energy sent back to the grid is currently priced at 17¢ per kWh,53
• the typical peak demand for a household is 7.5kW,54
51 Annual production from a solar system varies depending on the specifics of the location. However, I understand
that a good approximation is to multiply the number of hours in a year (8,760), with a production factor (that can
vary between 0.15 and 0.20, for this exercise I use 0.17) and the capacity of the system. 52 If I change this assumption to only a quarter of the energy being sent back to the grid, the total cost of PG&E’s
proposal over 20 years becomes $3,782 and the total cost of SDG&E’s proposal over 20 years becomes $13,622. I
understand that as part of PG&E and SDG&E’s proposals, solar panel adopters would shift to a TOU tariff. The
rates, for PG&E for example, would range from 10.5¢ per kWh to 31.5¢ per kWh. And therefore, the 17¢ per kWh
that I assume consumers pay still holds for this exercise. 53 I understand that this price currently depends on the consumption-tier of the household and on the specific utility.
Rates range from 15.1 to 39.6¢ per kWh and therefore 17¢ per kWh is a rather conservative estimate. In fact, for
example, PG&E estimates an average total rate of 20.3¢ per kWh which is well above 17¢ per kWh. See
http://www.pge.com/nots/rates/tariffs/ResElecCurrent.xls
p. 33
• the typical capacity of a residential solar array is 5kW,55
• the discount factor is 0.92.56
Furthermore, I compute the total additional costs from the different proposals for 20 years
as I understand that solar lease agreements typically last for 20 years and therefore this is the
relevant timeframe.
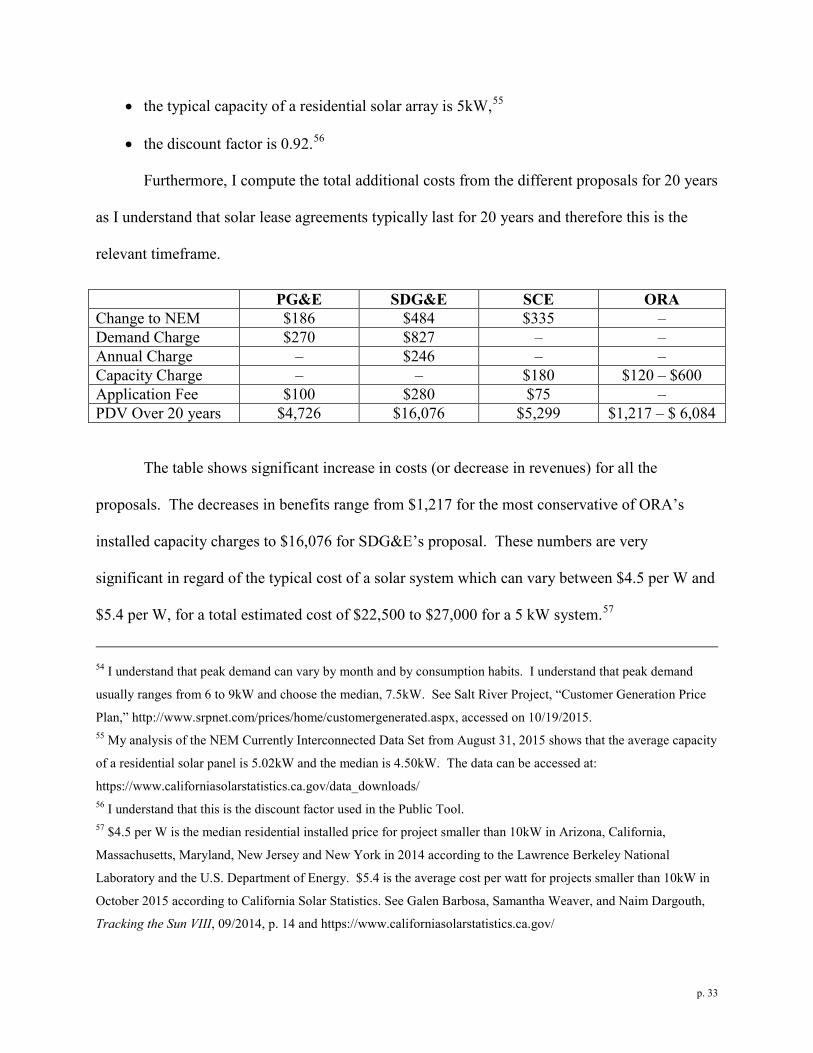
PG&E SDG&E SCE ORA Change to NEM $186 $484 $335 – Demand Charge $270 $827 – – Annual Charge – $246 – – Capacity Charge – – $180 $120 – $600 Application Fee $100 $280 $75 – PDV Over 20 years $4,726 $16,076 $5,299 $1,217 – $ 6,084
The table shows significant increase in costs (or decrease in revenues) for all the
proposals. The decreases in benefits range from $1,217 for the most conservative of ORA’s
installed capacity charges to $16,076 for SDG&E’s proposal. These numbers are very
significant in regard of the typical cost of a solar system which can vary between $4.5 per W and
$5.4 per W, for a total estimated cost of $22,500 to $27,000 for a 5 kW system.57
54 I understand that peak demand can vary by month and by consumption habits. I understand that peak demand
usually ranges from 6 to 9kW and choose the median, 7.5kW. See Salt River Project, “Customer Generation Price
Plan,” http://www.srpnet.com/prices/home/customergenerated.aspx, accessed on 10/19/2015. 55 My analysis of the NEM Currently Interconnected Data Set from August 31, 2015 shows that the average capacity
of a residential solar panel is 5.02kW and the median is 4.50kW. The data can be accessed at:
https://www.californiasolarstatistics.ca.gov/data_downloads/ 56 I understand that this is the discount factor used in the Public Tool. 57 $4.5 per W is the median residential installed price for project smaller than 10kW in Arizona, California,
Massachusetts, Maryland, New Jersey and New York in 2014 according to the Lawrence Berkeley National
Laboratory and the U.S. Department of Energy. $5.4 is the average cost per watt for projects smaller than 10kW in
October 2015 according to California Solar Statistics. See Galen Barbosa, Samantha Weaver, and Naim Dargouth,
Tracking the Sun VIII, 09/2014, p. 14 and https://www.californiasolarstatistics.ca.gov/
p. 34
In this calculation, I have not taken into account the scheduled step-down of the federal
solar ITC. As I explained above, this substantial increase in the cost to consumers of solar
systems will take place at the beginning of 2017. This will create a substantial disincentive for
adoption of solar systems that is not reflected in the calculation above.
Given how little is known about demand for rooftop solar, it is possible that the large
changes proposed by the IOUs and ORA will already be enough to throttle demand. This will be
even more likely in the context of the scheduled step-down of the federal solar ITC.
Furthermore, as I explain below, other factors of consumers’ decision-making process will make
it even more likely that the changes discussed in this report will significantly, negatively affect
rooftop solar adoption rates.
B. An increase in uncertainty
In this section, I detail the different ways in which the risk that consumers have to face
when they decide to deploy a solar system will increase under the scenarios proposed by the
IOUs and ORA. Given this increase in risk and the well-known risk aversion described earlier,
consumers’ valuation of the benefits of solar adoption will decrease, which will negatively
impact adoption and impede the growth of residential solar in California.
1. An asymmetry between rates paid to the IOU and rates received from the
IOU increases uncertainty
In the three proposals made by the IOUs, there is an asymmetry between the savings
realized from the self-generated energy used by the consumers themselves or sent to the grid.
The savings accruing to consumers by virtue of their solar systems allowing them to buy less
electricity from the IOUs are calculated using the retail rates they would have paid to their
p. 35
utility. However, the savings accruing to customers when they are sending the energy they
produce to the grid are calculated under a different rate schedule.
In the current system, there is no such asymmetry. To calculate her savings, a consumer
needs only to know how much she consumes in a month and how much her solar system
produces in a month. Under the scenarios offered by the IOUs, she will also need to know when
her solar system produces energy and whether this timing coincides with her consumption. Most
consumers do not know when exactly their solar systems produce energy. Furthermore, a
consumer also needs to know the timing of her consumption, which she might not know and is
not readily available (for example it is not always included on billing statements).
Finally, even if the timing of production and consumption can be predicted on average,
whether in each specific instance they will coincide is even harder to predict. For example, the
weather might reduce energy production on the exact day a consumer consumes more than usual,
even though her usual consumption coincides with the usual production. Therefore, it is clear
that there will be an increase in uncertainty induced by the asymmetry of the consumer’s savings
depending on the usage of the produced energy. Whether consumption and production will
coincide is much harder to predict than average consumption and production and more variable.
Therefore, under these scenarios proposed by the IOUs, the risk the consumer has to take will be
greater than under the current system.58
58 Other features induce a greater risk. For example, some proposals include a TOU component. TOU schedules
contain more uncertainty for the consumer since they do not only rely on how much a consumer consumes but also
the time at which she does. These patterns are less stable and more uncertain than aggregate consumption over a
month. Furthermore, TOU schedules depend on aggregate demand for electricity. Therefore, even in the unlikely
case where a consumer has a perfectly stable consumption pattern for 20 years, if the aggregate demand changes, the
definitions of “peak times” can be expected to change and therefore her bill will change. With TOU billing
p. 36
2. A demand charge increases uncertainty
Some of the proposals made by the IOUs introduce a demand charge. In order to
compute the impact of a demand charge on her electricity bill, a consumer has to know or
evaluate her peak demand. However, her peak demand is not readily available to a consumer.
For example, it is usually not included on a consumer’s bill. Furthermore, it can be very
unpredictable. As one example, many consumers live in households with multiple members. In
such households, it might be hard to coordinate who uses which appliance when, and this may
lead to a spike in electricity demand. As another example, a houseguest might turn on many
lights, turn on a space heater to warm up, run a load of laundry, and take a long hot shower
followed by blow-drying her hair, resulting in an enormous spike to usage that might be hard for
the consumer to predict and control. This is in contrast to monthly electric usage, which is more
stable since it is aggregated over a longer period of time. Therefore, a consumer will have to
make predictions on her future peak demand in each month. When making these predictions, the
consumer has to assign probabilities to different scenarios, but might not even be confident in
these probabilities or these scenarios. For these reasons, it is clear to me that demand charges are
inherently less predictable than total consumption and therefore, from the point of view of a
residential consumer, riskier. Under scenarios containing a demand charge, the consumer will
perceive that she is taking more risks than under the current NEM system, which will decrease
her valuation of the benefits of deploying a rooftop solar system.
arrangements, a consumer’s bill depends on the demand from the rest of society and supply from energy providers,
something over which any single consumer has no control. This means that the risk associated with TOU billing
schemes is greater than under the current system.
p. 37
3. The installed capacity fee as proposed by ORA increases uncertainty
In the proposal put forward by ORA, it is written that:
“To ensure a predictable payback period, customers who take the successor tariff
will be grandfathered at that [Installed Capacity Fee] for a 10 year period, after
which the customer will transition to the ICF that is applicable at that time.”
However, solar lease commitments usually last for 20 years. Consumers will therefore be
exposed to a completely unknown and unpredictable parameter: what will the Installed Capacity
Fee be ten years after the customer decides to adopt solar? This is obviously outside of a
consumer’s control and therefore increases the risk a consumer will have to bear under this
scenario.
4. Consumers will not benefit from NEM as a hedge against electricity price
increase
Finally, the current NEM system limits a consumer’s exposure to increases in the price of
electricity. For example, consider two consumers with the same consumption, but one of whom
has installed a rooftop solar system, which covers 50% of her expenses. If the price of electricity
increases, the consumer who does not have a solar system will be impacted twice as much as the
consumer with the solar system. In this sense, solar adoption serves as a hedge against future
increases in the price of electricity. However, under the scenarios offered by the IOUs, this
would not be the case. Indeed, since the IOUs’ proposals all imply an asymmetry between the
retail rates paid by the consumer and the rates received for solar generated energy exported to the
grid, there is no guarantee that these rates would move together. In the event of an increase in
retail energy rates but not in rates received for exported energy, a consumer would suffer more
from the increase in retail rates than under the current NEM regime. Therefore, by increasing the
p. 38
exposure of solar system adopters to future increases in energy rates, the proposals of the IOUs
increase the risk to which consumers are exposed.
Finally, a consumer contemplating rooftop solar adoption might be concerned that the
risk and complexity of the proposed changes to the current NEM regime might not be understood
by a prospective buyer of the home. The consumer might reasonably worry that prospective
buyers would not want to investigate solar rooftop rates structure or would value rooftop solar
differently. From this perspective, the proposed changes studied in this report may make it
harder for a rooftop solar adopter to predict how her system will impact the resale value of the
house.
To summarize, there is an inherent unpredictability in trying to have one’s consumption
coincide with a solar system’s production, in attempting to control a very volatile demand, in
depending on the aggregate demand for electricity and the aggregate demand for solar and in
being more exposed to changes in electricity prices. For all these reasons, the proposals from the
IOUs and ORA increase the risk that consumers have to face. Given their risk aversion,
consumers would be expected to be driven away from solar adoption if these proposals are
adopted.
C. A virtue of NEM is simplicity
One of the main characteristics of the current NEM program is its simplicity: it is easy to
understand that no matter how the energy produced by the solar system is used, it will result in a
deduction on a consumer’s total bill. However, in the proposals put forth by the IOUs and the
ORA, the impact of the solar system on one’s bill depends on many more parameters. For
example, a residential customer’s bill will depend on how the electricity is used, when it is
produced, a consumer’s peak demand, the aggregate demand by the rest of society and the
p. 39
supply from electricity providers, and the rate of adoption of solar in California as a whole and in
specific areas.
In particular, the concept of a demand charge is very difficult to understand and requires
a very high sophistication. As I have described below, its introduction by SRP was accompanied
by lengthy explanations on their website. Furthermore, even if the concept is understood,
consumers will require a lot of information on which appliances in particular trigger a high
demand for power. Even this knowledge may not help residential consumers with families
(small children often fail to turn off lights) or who have houseguests or repairpersons, etc., who
may avail themselves of the electricity. Furthermore, some of the steps to avoid a high demand
charge might be difficult and costly. For example, some of the means to control costs due to the
demand charge offered on SRP’s website are “use a programmable thermostat” and “set a timer
on your water heater and pool pump,” both of which are costly.
The proposed changes to California’s NEM program by the IOUs and ORA will greatly
increase the complexity of the decision that consumers face when considering rooftop solar
adoption. Even sophisticated parties might choose not to adopt, simply due to the policy
uncertainty and complexity surrounding rooftop solar. Moreover, residential consumers with
limited attention and capacity to understand such a complex, multi-dimensional problem will
tend to use heuristics to make this decision. As I have explained above, when agents are faced
with very difficult problems, some of the heuristics they use lead them to prefer the status quo.
This means that potential solar adopters will tend to not adopt them because the decision they
will face will be so much more difficult and complex than it had been under the previous NEM
regime. They will tend to stick to the status quo and choose their default option, which is to not
deploy a solar system. In short, consumers will be discouraged from adopting by the sheer
p. 40
complexity of the choice they will face. Furthermore, the appeal of the status quo will even be
greater when considering decreases in future revenues, increases in uncertainty and increases in
complexity. As I explained above, the three components would interact to negatively affect
demand even more than each behavior would predict separately.
V. A way forward
None of the proposed changes to California’s NEM program reviewed here have any
upside for potential solar system adopters. Consequently, it is clear that all things being equal
there will be a reduced incentive for rooftop solar adoption. It is possible that this reduced
incentive will be offset to some extent by the projected reduced costs of solar systems, but it is
also likely that all of the proposals will “overshoot” and reduce, potentially substantially, the
incentive to adopt and actual adoption.
Leading industry analysts have found that a key factor in consumers’ decision to adopt
rooftop solar is “whether solar can offer a customer 10-percent net savings in year one.”59 In
fact, they consider 10-percent savings in year one as a “tipping point,” that decisively shape
consumers’ decisions. This is a perfect example of the behaviors described earlier. First,
consumers are impatient and present-biased — they want savings as soon as year one and in fact
it seems to be a crucial factor in their decision. Second, they do not want to break even, they
want 10-percent savings, to compensate them for the risk they are taking linked to uncertainty
about energy generation from rooftop solar systems, for example due to weather conditions.
59 Eric Wesoff, “GTM Research: Ten Slides that Show the Complex Future and ‘Tipping Point’ of US Solar,”
GreenTech Media, 12/09/2014, http://www.greentechmedia.com/articles/read/Shayle-Kann-and-the-Bratwurst-
Problem accessed on 10/25/2015.
p. 41
Finally, when confronting a difficult decision, they use a heuristic — the “10-percent savings in
year one” rule is definitely a rule-of-thumb and not the result of a complex calculation.
Furthermore, it seems unlikely that this rule would be enough to predict profitability of rooftop
solar for all types of consumers and installations, yet it has been found to be used across different
types of consumers. What this “tipping point” also shows is that demand for rooftop solar is
fragile. Changes in rates or pricing schemes that would threaten to reduce savings below 10
percent in the first year after adoption could potentially reduce demand significantly by “tipping”
potential adopters towards refraining from adopting. Therefore, all the proposals reviewed in
this report, since they only have downsides for potential rooftop solar adopters, could threaten to
restrain demand.
Of the proposals I have reviewed, the ORA proposal is the least likely to fully throttle
demand for rooftop solar. Yet the ORA proposal itself burdens residential customers with a
more complex system that entails small downside risks in the short term and very substantial
downside risks at longer-term horizons. For example, consumers contemplating solar adoption
might not know the exact capacity of their future installation, which will make their choice of
deploying a solar system more difficult and uncertain.60 The risk is greater at longer horizons.
Under the ORA proposal, after ten years — only half-way through a typical lease term — the
solar adopter could in principle see her capacity charge multiplied by a factor of 5. Furthermore,
the ORA proposal does not specify what will happen if NEM adoption is faster than expected. Is
$10/kW/month the maximum a consumer will ever be charged for their capacity? If not, what
60 It might not be difficult to determine what the potential capacity of a system might be, but consumers might be
dissuaded to even investigate, given that this creates additional uncertainty and complexity for a uninformed
consumer.
p. 42
will the installed capacity fee be in 10 years? And in 15 years? These are the risks that a
consumer contemplating the installation of a solar system will have to keep in mind, and in turn,
will try to avoid.
In addition, the highest installed capacity charge under the ORA proposal,
$10/kW/month, would saddle a typical residential solar customer with a minimum monthly
utility bill of $50 (assuming a 5 kW system and no other monthly charges or fees) per month in
addition to the payment on their solar PV array — even if the customer consumes no energy
from the utility. Even if it does not eliminate a customer’s potential savings, this fee is likely
sufficient to dissuade at least some customers, and potentially many, from installing solar.
Moreover, it may be hard to revert back to a steady adoption rate after imposing a fee
large enough to dissuade potential customers from adopting. Suppose after hitting the $10 point
and substantially reducing adoption, the rate was subsequently decreased in order to encourage
adoption. Under such a scenario, the effects of the $10/kW/month installed capacity charge may
well linger — meaning the adoption might not rebound fully. To see why, consider a
consumer’s perspective. First, it might modify consumers’ perceptions of rooftop solar
generally. If press articles highlighted the unprofitability of rooftop solar adoption, or if there
were public outrage from frustrated rooftop solar adopters following a spike in fees, potential
adopters might be less inclined to investigate rooftop solar as an option — even if the policy
were reversed. They might simply rely on their last impressions of rooftop solar as not profitable
and not attempt to gather current information on rooftop solar. Second, a large change in policy
introduces significant policy uncertainty. Consumers might be afraid that even though charges
are reasonable at the moment (for example after a change in policy has been reversed), they
might not be in the future. This uncertainty would discourage them from adopting rooftop solar.
p. 43
Therefore, demand for solar panels might be negatively affected for a long time, even though the
spike in fees was short-lived.
Furthermore, the step-down of the federal solar ITC at the end of 2016 is likely to be an
additional shock to solar adoption. Given how little we currently know about the price elasticity
of demand for solar systems, as well as the potential for cost reductions that could offset some of
the lost credit, it is difficult to quantitatively predict the impact this will have on solar panel
adoption rates, but the size of the price increase makes it unlikely that the impact will be
insignificant, especially in the near-term.
Precisely because we do not have much information about how residential consumers
contemplating adoption of rooftop solar might react to these changes, to the extent changes are
needed at all, there is value in moving incrementally and with staggered implementation of any
incremental increases. The reason for this approach is that it may be possible to use the
staggered implementation of incremental changes to estimate how responsive individuals might
be to those changes. I would not be surprised to learn that residential customers are highly
responsive to the capacity charges contemplated by the ORA proposal, for example. To a certain
extent, the fact that the different utilities will reach the 5% threshold at different times means that
staggered implementation is built into the default structure of upcoming regulatory changes. The
ORA proposal does not take full advantage of this fact. If the CPUC adopted a proposal that (a)
gave customers certainty over a 20 year horizon, rather than 10 years and (b) gave smaller
capacity charges over that period to all customers, then it might be possible to use such a
proposal to estimate how responsive customers might be to future changes to the regulatory

p. 44
framework.61 If the CPUC adopted a proposal that coupled the longer-term lock-in with
different capacity charges to different groups of customers, then the ability to estimate the effects
of such a policy would be further enhanced.
In light of the great uncertainty over the extent to which proposed changes to California’s
NEM program will affect residential customer adoption of rooftop solar and the potential of even
short-lived changes to affect demand durably, I would encourage the CPUC to move carefully,
with an eye not only towards evaluating whether changes are necessary but also towards
estimating the impacts of the changes it implements.
Executed this 28th of October, 2015.
61 Furthermore, I would encourage the first change to be implemented after the expiration of the ITC has been fully
absorbed and the rate of solar adoption has returned to its level before the expiration of the ITC. I understand that
the length of this period is uncertain, but, once again, I would encourage the CPUC to move with caution since two
coincidental negative shocks to the economics of solar panel adoption could hurt the rates of adoption durably.