Embed Size (px)
Citation preview
1
Impaired exercise performance and muscle Na+,K+-pump activity in renal transplantation
and haemodialysis patients.
Aaron C Petersen1,2, Murray J Leikis3, Lawrence P McMahon4, Annette B Kent4, Kate T Murphy1,
Xiaofei Gong1, Michael J McKenna1.
1Muscle, Ions and Exercise Group, Institute of Sport, Exercise and Active Living (ISEAL), Victoria
University, Melbourne; Australia
2School of Sport and Exercise Science, Victoria University, Melbourne; Australia
3Department of Nephrology, Royal Melbourne Hospital and Western Hospitals, Melbourne,
Australia
4Department of Renal Medicine, Eastern Health Clinical School, Monash University, Melbourne,
Australia
Running head: Exercise and Na+ ,K+ -pumps in HD and RTx
Word count: 3399
Author for Correspondence:
Professor Michael J. McKenna
Institute of Sport, Exercise and Active Living,
Victoria University,
PO Box 14428, MCMC, Melbourne, Victoria, Australia, 8001.
E-mail: [email protected]
Phone: +61-3-9919-4499
Fax: +61-3-9919-4891

2
ABSTRACT
Background: We examined whether abnormal skeletal muscle Na+,K+-pumps underlie impaired
exercise performance in haemodialysis patients (HDP), and whether these are improved in renal
transplant recipients (RTx).
Methods: Peak oxygen consumption ( V•
O2peak) and plasma [K+] were measured during incremental
exercise in 9 RTx, 10 HDP, and 10 healthy controls (CON). Quadriceps peak torque, fatigability
(decline in strength during thirty contractions), thigh muscle cross-sectional area (TMCSA) and
vastus lateralis Na+,K+-pump maximal activity, content, and isoform (α1-α3, β1-β3) abundance were
measured. Results: V•
O2peak was 32% and 35% lower in RTx and HDP than CON, respectively
(P<0.05). Peak torque was less in RTx and HDP than CON (P<0.05) but did not differ when
expressed relative to TMCSA. Fatigability was ~1.6-fold higher in RTx (24±11%) and HDP
(25±4%) than CON (15±5%), P<0.05). Na+,K+-pump activity was 28% and 31% lower in RTx and
HDP, respectively than CON (P<0.02), whereas content and isoform abundance did not differ.
Pooled (n=28) V•
O2peak correlated with Na+,K+-pump activity (r=0.45, P=0.02).
Conclusions: V•
O2peak and muscle Na+,K+-pump activity were depressed and muscle fatigability
increased in HDP, with no difference observed in RTx. These findings are consistent with the
possibility that impaired exercise performance in HDP and RTx may be partially due to depressed
muscle Na+,K+-pump activity and relative TMCSA.
Keywords: extrarenal potassium regulation, fatigue, muscle mass, strength, V•
O2peak
Summary
We show that peak oxygen consumption, quadriceps strength and fatigability are not different
between haemodialysis patients (HDP) and renal transplant recipients (RTx) with similar

3
[ Hb] , however they are reduced in both groups compared to matched healthy control
subjects (CON). Skeletal muscle maximal Na+ ,K+ -pump activity was depressed in HDP and
RTx compared to CON, whereas skeletal muscle Na+ ,K+ -pump content and isoform
abundance did not differ. When all results were pooled, peak oxygen consumption correlated
with Na+ ,K+ -pump activity, suggesting that impaired exercise performance in HDP and RTx
may be partially due to depressed muscle Na+ ,K+ -pump activity.

4
INTRODUCTION
Patients with chronic kidney disease have grossly impaired exercise tolerance [1], but differences in
exercise capacity between haemodialysis patients (HDP) and renal transplantation recipients (RTx)
are poorly defined. Following renal transplantation, the V•
O2peak of previously anaemic HDP has
been reported to increase by 25–38% [2, 3]. Post-transplantation increases in haemoglobin
concentration ([Hb]) and haematocrit (Hct) may account for much of the improvement, as increases
in V•
O2peak of 19-33% have been reported in HDP following treatment with erythropoietic
stimulating agents (ESA) [4, 5]. Nonetheless, no studies have investigated V•
O2peak in RTx and HDP
with similar [Hb] to properly compare these groups.
Muscle strength and fatigability are important determinants of exercise capacity [6, 7]. Muscle
strength is impaired in non ESA-treated HDP [8], likely due to reduced muscle mass [9], and is
unlikely to improve with ESA treatment [10]. However, RTx does not improve muscle strength [8,
11], possibly due to the muscle wasting effects of glucocorticoid therapy [12]. Muscle fatigability
during repeated maximal isometric hand-grip contractions was greater, and Hct lower in non ESA-
treated HDP than RTx [13]. No studies have examined fatigability during dynamic contractions in
RTx, or between RTx and ESA-treated HDP with similar [Hb].
If exercise performance remains impaired in RTx, an underlying muscle defect may persist,
contributing to greater fatigability. A possible mechanism of fatigue is impaired muscle membrane
excitability, caused by elevated interstitial [K+] [14], which is likely exacerbated in HDP. Anaemic
HDP exhibited pronounced hyperkalaemia during exercise, which was inversely correlated with V•
O2peak [15]. A reduced muscle compound action potential in HDP [16] suggests impaired membrane
excitability. Hence, abnormal K+ regulation might enhance fatigue and reduce exercise
performance. We tested the hypothesis that regulation of plasma [K+] during incremental exercise
would be impaired in both HDP and RTx.

5
Skeletal muscle contains the largest pool of Na+,K+-pumps [17], and is vital in extrarenal K+
regulation [18]. Reduced Na+,K+-pump activity was found in muscle from uremic rats [19] despite
normal content and isoform abundance [19, 20], suggesting an underlying defect in existing pumps.
Thus, impaired muscle Na+,K+-pump activity could underlie the abnormal plasma K+ responses in
HDP [15]. Possible abnormalities in skeletal muscle Na+,K+-pump activity, content or isoform
abundance, have not been investigated in uremic humans. Erythrocytic Na+,K+-pump activity was
improved following renal transplantation [21], but whether skeletal muscle Na+,K+-pump activity in
RTx is impaired is not known.
This study tested the hypothesis that V•
O2peak, muscular strength and fatigability would be worsened
compared to CON, but would not be different between RTx and ESA-treated HDP with similar
[Hb]. We also tested the hypotheses that muscle Na+,K+-pump activity would be depressed in both
HDP and RTx, with normal Na+,K+-pump content and isoform abundance. Finally we explored
whether depressed muscle Na+,K+-pump activity in HDP and RTx would be related to their poor K+
regulation and exercise performance.
METHODS
Subjects
Nine RTx, ten HDP, and ten CON gave written informed consent and participated in the study. One
HDP underwent all tests except the muscle biopsy. Subjects were matched for sex, age, height,
bodymass and bodymass index (BMI) (Table 1). Selection criteria for RTx were: transplanted at
least 12 mo prior to testing (range 16–171, 63±53 mo), had a stable creatinine, and a calculated
CrCl (Cockcroft-Gault) of >40 ml.min-1. Selection criteria for HDP were: stable and had been
dialyzing for at least 6 mo (range 7–71, 38±23). All HDP were anuric and urea reduction ratio was
65±5%. Ultrafiltration rate was 0.4-0.7 l.h-1 according to patient size, intradialytic time, and pre-
dialysis weight. All subjects had [Hb] >110 g.l-1. Subjects were excluded if they had symptomatic
ischemic heart disease, peripheral vascular disease, disabling arthritis, chronic airflow obstruction,

6
or were pregnant. Subject medications are shown in Table 3. The RTx received kidneys from living
related donors (n=2), living non-related donors (n=2), and from deceased donors (n=5). This study
was approved by the Human Research Ethics Committees at Victoria University and Melbourne
Health.
Exercise tests
For HDP, all exercise tests were performed on a non-dialysis day with a mean time of 31±14 h) post
dialysis.
Peak oxygen consumption ( V•
O2peak): Subjects cycled (≥60 rpm) on an electronically braked cycle
ergometer (Lode, Groningen, Holland), with increments of 15 W each minute until volitional
exhaustion [22], with expired gases and ventilation continuously measured to calculate V•
O2 [23].
Quadriceps torque-velocity test: Subjects performed three maximal isokinetic contractions at 0, 60,
120, 180, 240, 300, and 360°.s-1, with 60 s recovery between sets, on an isokinetic dynamometer
(Cybex Norm-770, Henley HealthCare, Massachusetts) [24]. The highest value of each set of three
was defined as the peak torque (PT) and expressed relative to body mass (Nm.kg-1) and TMCSA
(Nm.cm-2), to correct for differences in body size and muscle mass, respectively.
Quadriceps fatigue test: Subjects performed 30 maximal isokinetic contractions at 180°.s-1, with ~1
s pause between repetitions [24]. The fatigue index (FI,%) was calculated as [(starting PT - final
PT)/ starting PT] x 100, where starting PT is the average of the highest three of the first five
repetitions; final PT is the average of the highest three of the last five repetitions.
Blood sampling and processing
Blood was sampled before, during and after the V•
O2peak test from an arterio-venous fistula in all
HDP, and in four RTx; in all other subjects, arterialised venous blood was sampled from a heated
dorsal hand-vein [25]. The different blood sampling sites used are unlikely to have impacted on
[K+], since arterialised venous [K+] did not differ from arterial [K+] during low-to-moderate

7
intensity exercise, and was only marginally higher (4%) during high intensity exercise [26]. Blood
was analysed in duplicate for [Hb] and Hct (Sysmex, K-800, Kobe, Japan) and for plasma [K+]
(865pH/Blood Electrolyte and Gas Analyzer, Bayer, MA, USA). ΔPV was calculated [27] and used
to correct [K+] for fluid shifts [28]. Additional calculations were ∆[K+] and ∆[K+].work-1 ratio [28-
30]. Possible medication effects on plasma [K+] were considered. Whilst non-selective β-blockers
increase plasma [K+] during exercise [31], only β1-blockers were taken by subjects in this study,
which do not affect [K+] during exercise [32]. Prednisone increases skeletal muscle Na+,K+-pump
content [33], which could lower plasma [K+] during exercise. However, in the present study, plasma
[K+] during exercise was not different within groups between the patients taking prednisone and
those who were not (data not shown).
Computerised Tomography scan
TMCSA of the dominant leg was measured by single slice Computerised Tomography (CT) scan,
taken 20 cm above the medial femoral condyle. Muscle area was calculated as the total muscle
compartment area minus the femur area [24].
Muscle biopsy
Prior to the torque-velocity and fatigue tests, a muscle sample was collected from the vastus
lateralis under local anaesthesia (1% Xylocaine) by percutaneous needle biopsy technique.
Muscle Na+,K+-pump analyses
Maximal activity and total content: The maximal in-vitro Na+,K+-pump activity was measured in
muscle homogenates using the maximal K+-stimulated 3-O-methylfluorescein phosphatase
(3-O-MFPase) assay, specific for the Na+,K+-pump and adapted for human skeletal muscle [25, 34].
Total Na+,K+-pump content was determined by vanadate-facilitated [3H]ouabain binding site
content analysis [25, 35].
Isoform abundance: Western blotting was performed for the α1, α2, α3, β1, β2, and β3 Na+,K+-pump
isoforms as detailed [36], with the modification that the muscle homogenate was deglycosylated

8
prior to electrophoresis, to enhance β-isoform identification. This involved incubating the
homogenate for 1 h at 37°C with 0.5% (v/v) Nonidet P40 and 3 units N-Glycosidase F (Boehringer
Mannheim) per 0.5 mg protein. The final blot intensity was normalised to the same human muscle
standard which was run in all gels.
Antibodies: Antibodies specific to each isoform were for α1: monoclonal α6F (developed by D.
Fambrough and obtained from the Developmental Studies Hybridoma Bank developed under the
auspices of the NICHD and maintained by the University of Iowa, Department of Biological
Sciences, Iowa City, IA); α2: polyclonal anti-HERED (kindly donated by T. Pressley, Texas Tech
University); α3: monoclonal MA3-915 (Affinity Bioreagents, Golden, Colorado); β1: monoclonal
MA3-930 (Affinity Bioreagents); β2: monoclonal 610915 (Transduction Laboratories, Lexington,
Kentucky); and β3: monoclonal 610993 (Transduction Laboratories).
Statistics
Data are mean ± SD. A one-way ANOVA was used except when repeated measures were taken
(e.g. [K+] data) for which a mixed-design two-way ANOVA was used. The Least Significant
Difference post-hoc test was used because of the unequal group sizes. Correlations were determined
by linear regression. Significance was accepted at P<0.05.
RESULTS
Physical characteristics
Physical characteristics did not differ between groups (Table 1) except lower TMCSA expressed
relative to bodymass in RTx (P=0.017) and HDP (P=0.006) than in CON. Calculated CrCl was also
lower in RTx (P=0.001) than CON. When data from all groups were pooled, relative TMCSA was
correlated with estimated CrCl (r=0.44, P=0.026, n=28).
Exercise performance

9
Quadriceps torque-velocity: PT (Nm.kg-1) was ~25% lower in RTx and HDP than CON (P<0.05) at
all velocities except 120°.s-1, where only RTx was lower (Fig.1). However, PT (Nm.cm-2) did not
differ between groups (Fig.1).
Quadriceps fatigue: The FI was higher in RTx (24%, P=0.010) and HDP (25%, P=0.003) than in
CON (15%), with no difference between RTx and HDP.
Peak oxygen consumption: V•
O2peak was less in RTx (27.0±9.6 ml.kg-1.min-1, P=0.012) and HDP
(26.4±6.5 ml.kg-1.min-1, P=0.006), respectively than CON (35.7±4.0 ml.kg-1.min-1), with no
difference between RTx and HDP. Peak workrate similarly was lower by 29 and 31%, respectively
in RTx (P=0.005) and HDP (P=0.003) than CON (Fig.2). Total work done was also lower in RTx
(60.6 ±41, P=0.009) and HDP (56.8±23, P=0.004) than CON (114.8±54 kJ). RER at V•
O2peak was
not different between groups (RTx 1.17±0.08, HD 1.25±0.10, and CON 1.19±0.06. For pooled data,
V•
O2peak was correlated with TMCSA (Fig. 5), relative TMCSA (r=0.72, P=0.001, n=28) and PT
(r=0.83, P=0.001, n=29) and inversely correlated with FI (r=-0.53, P=0.004, n=29). TMCSA was
correlated with PT (r=0.75, P=0.001, n=28) but not FI.
Plasma [K+] and fluid shifts
The change in plasma volume from rest (ΔPV), during incremental exercise to peak workrate was
less in RTx (-12.7±2.5) than in both HDP (-15.8±2.9, P=0.032) and CON (-16.2±3.1%, P=0.014).
Therefore, plasma [K+] was corrected for the ΔPV. Corrected plasma [K+] was higher (P<0.05) in
HDP than in RTx and CON at rest, during exercise and at 10 min post-exercise (Fig.2). The rise in
plasma [K+] above rest (∆[K+]) did not differ between groups during common submaximal
workrates, but was less in RTx (P=0.014) and HDP (P=0.004) at peak workrate compared to CON
(Fig.2). To correct for the greater peak workrate in CON, Δ[K+] was expressed relative to the total
work done (Δ[K+].work-1 ratio). No difference was found between the groups in Δ[K+].work-1 ratio

10
(RTx 20.8±15.6, HDP 14.9±8.5, CON 15.6±10.4 nmol.l-1.J-1). When data were pooled, V•
O2peak was
inversely correlated with the Δ[K+].work-1 ratio (r=-0.42, P=0.030, n=29).
Muscle Na+,K+-pump activity, content and isoforms
Total muscle protein content: Muscle protein content did not differ between groups (RTx
0.18±0.02, HDP 0.17±0.03, CON 0.19±0.03 mg protein.mg muscle (wet weight)-1).
Maximal activity and content: Muscle maximal 3-O-MFPase activity was 28% and 31% lower in
RTx (P=0.020) and HDP (P=0.010) than CON, respectively (Fig.3). In contrast, the [3H]ouabain
binding site content did not differ between the groups (Fig.3). Within HDP, 3-O-MFPase activity
was positively correlated with V•
O2peak (r=0.73, P<0.05, n=9) and isometric PT (r=0.84, P<0.0 5,
n=9). No significant correlations were found within RTx or CON between 3-O-MFPase activity and
any exercise performance variables. For pooled data, 3-O-MFPase activity correlated with V•
O2peak
(Fig.4) and [3H]ouabain binding site content (r=0.42, P=0.026, n=28).
Isoform abundance: Each of the Na+,K+-pump α1, α2, α3, β1, β2, and β3 isoforms were expressed in
muscle from all HDP and RTx patients and CON. There was no significant difference between
groups in protein abundance for any Na+,K+-pump isoform (Table 2).
DISCUSSION
This study identifies two possible mechanisms underlying impaired muscle function and exercise
performance in renal transplantation recipients and haemodialysis patients, namely reduced skeletal
muscle Na+,K+-pump activity and reduced TMCSA relative to bodymass. Furthermore, both
Na+,K+-pump maximal activity and relative TMCSA, as well as muscle fatigability and exercise
performance did not differ between RTx and HDP with normal [Hb]. Significant inter-relationships
further strengthen the possibility that the impaired exercise performance in RTx and HDP may be
linked to reduced Na+,K+-pump maximal activity and relative TMCSA.
Reduced maximal Na+,K+-pump activity but not abundance
11
This is the first study to measure skeletal muscle Na+,K+-pump activity, content or isoforms in
uraemic patients. Muscle maximal Na+,K+-pump activity was reduced by ~30% in RTx and HDP.
This is consistent with reports in uraemic patients of reduced Na+,K+-pump activity in other tissues
[37, 38], reduced muscle intracellular [K+] [39], muscle membrane depolarization [40], and
impaired muscle membrane excitability [16]. Surprisingly, there was no difference in maximal 3-O-
MFPase activity between RTx and HDP. We hypothesized that Na+,K+-pump activity would be
normal in RTx, based on findings in erythrocytes of normal or elevated Na+,K+-pump activity after
RTx in many [21, 41, 42] although not all studies [43].
We confirmed the expression of the Na+,K+-pump α1, α2, α3, β1, β2, and β3 isoforms [36] in muscle
from RTx and HDP, and demonstrate an unchanged relative isoform abundance compared to CON.
These results support the findings of unchanged Na+,K+-pump isoform mRNA expression or protein
abundance in skeletal muscle of nephrectomized and sham-operated rats [20]. There was a non-
significant ~2-fold difference between HDP and CON in the relative abundance of the α1 and α3
isoforms. Thus, we cannot exclude the possibility that some differences in isoform expression exist
but that these were not detectable due to the intrinsic variability of Western blotting. However,
failure to detect significant differences between groups for isoform abundance was unlikely due to
the small sample size as effect sizes were very small (range 0.03–0.15).
Possible mechanisms of impaired maximal Na+,K+-pump activity
As muscle Na+,K+-pump content and isoform expression were not reduced in RTx and HDP, their
depressed Na+,K+-pump activity appears to be due to defective Na+,K+-pump function. We show
that Na+,K+-pump content is normal in uraemic human skeletal muscle, consistent with findings in
uraemic rats [19]. The lower activity in HDP and RTx did not abolish the previously described
positive association between maximal 3-O-MFPase activity and [3H]ouabain binding site content
[30]. As the HDP were hyperkalaemic, which increases Na+,K+-pump content in rat muscle [44],
possible hyperkalaemic effects on Na+,K+-pump content and activity cannot be excluded.

12
Normal muscle Na+,K+-pump content in these patients suggests that their depressed maximal
Na+,K+-pump activity is due to reduced molecular activity per pump, or grossly impaired activity in
some pumps. This is consistent with a previous finding in erythrocytes from HDP of reduced
ouabain-sensitive 86Rb+ uptake but normal [3H]ouabain binding site content [45]. We cannot
compare the molecular activities with previous reports, which were calculated using different 3-O-
MFPase assay conditions [46]. With numerous myopathies identified in RTx and HDP, the cause of
reduced Na+,K+-pump activity is likely to be multi-factorial. Changes in membrane lipid
composition can alter Na+,K+-pump activity without altering Na+,K+-pump content [47] and
abnormal membrane lipid composition has been found in erythrocytes from HDP [37] and RTx
[48], as well as in kidney, liver and testis microsomal membranes from rats following renal
transplantation [49]. In uraemia, endogenous digitalis-like factors [37] and uraemic toxins [50] in
plasma can depress Na+,K+-pump activity. In RTx, calcineurin inhibitors reduce Na+,K+-pump
activity in heart [51] and kidney [52]. Conversely, prednisolone, increases muscle Na+,K+-pump
content [33] and possibly also activity [53]. Further research is required to determine the
mechanisms inhibiting Na+,K+-pump activity in skeletal muscle in RTx and HDP.
Reduced relative TMCSA and impaired exercise performance in HDP and RTx with normal [Hb]
This is the first report demonstrating exacerbated muscle fatigability during repeated dynamic
contractions in RTx compared to CON. Further, we show similar fatigability between RTx and
HDP. This contrasts findings of greater fatigability in HDP than RTx during repeated isometric
hand-grip contractions [13], possibly due to a lower Hct in HDP in that study.
This is the first study comparing V•
O2peak in RTx and HDP with similar [Hb], revealing that V•
O2peak
did not differ between RTx and HDP, but was ~25% less than CON. This confirms the poor
exercise performance in RTx and HDP, which persists despite normalisation of [Hb] [5, 54] and is
consistent with greater muscle fatigability. In addition, we found an apparent relationship between
maximal exercise performance ( V•
O2peak) and, muscle Na+,K+-pump maximal activity (3-O-MFPase

13
activity). This is consistent with the possibility that impaired exercise performance in RTx and HDP
may be related to reduced muscle function associated with lower Na+,K+-pump activity. Since the
Na+,K+-pump protects muscle membrane excitability and delays fatigue [14, 18], depressed
maximal Na+,K+-pump activity in HDP and RTx may impair exercise performance and V•
O2peak. It
should be noted that Na+,K+-pump maximal activity explained 20% of the variance in V•
O2peak, and
thus other factors must also contribute to their poor exercise performance, including limb muscle
atrophy [9], altered muscle fibre type [55], impaired blood flow [56], reduced muscle capillarity
[56] and mitochondrial function[9].
Quadriceps strength was subnormal in RTx and HDP when corrected for bodymass but not when
expressed relative to TMCSA. This suggests that muscle contractile function is normal in RTx and
HDP with normal [Hb] and that their strength deficit may be entirely due to reduced lean bodymass
[57]. This is an important finding as it indicates that strategies to improve physical functioning in
HDP and RTx should focus on increasing muscle mass. It is also consistent with our finding of
reduced TMCSA relative to bodymass in RTx and HDP. We also report no difference in quadriceps
strength in RTx compared to HDP, which supports previous studies [8, 11]. Not surprisingly, V•
O2peak was correlated with relative TMCSA and peak torque. This is the first report of a relationship
between muscle strength and V•
O2peak in RTx. We also found an inverse relationship between V•
O2peak and the FI. These data, together with a lack of correlation between V•
O2peak and [Hb], support
the concept that reduced muscle mass plays a vital role in limiting V•
O2peak and strength in RTx and
HDP.
Normal plasma K+ regulation during exercise in HDP and RTx
Our finding of normal Δ[K+] during exercise and Δ[K+].work-1 ratio at peak workrate in RTx and
HDP contrasts with our earlier reports of elevated values in HDP compared to CON [15, 58]. The
difference in V•
O2peak between the HDP and controls in our previous studies was 44 and 37%,

14
respectively [15, 58], whereas here it was ~25%. As V•
O2peak was related to the Δ[K+].work-1 ratio in
each study, this may explain the contrasting K+ regulation data. The small sample size is unlikely to
have limited our ability to detect a difference between HDP, RTx and CON as the effect size was
very small (effect size =0.03). At peak workrate, the lesser Δ[K+] in RTx and HDP compared to
CON reflects their lower workrates and presumably lower muscle K+ release during the incremental
exercise test.
Changes in plasma [K+] may not accurately reflect changes in net muscle K+ efflux [59] due to K+
uptake by inactive tissues, and incomplete K+ equilibration between the muscle cell, interstitium,
and blood [60]. For example, muscle interstitial [K+] can exceed arterial or venous [K+] by 4-8 mM
during exercise [61, 62]. This likely explains the unchanged rise in plasma K+ in RTx and HDP
during exercise despite their substantially reduced muscle Na+,K+-pump maximal activity and also
the lack of correlation between plasma [K+] variables and Na+,K+-pump maximal activity (data not
shown). Furthermore, the possibly confounding effects of hyperkalaemia at rest in HDP may have
contributed to the apparent disconnect between plasma [K+] and Na+,K+-pump maximal activity in
these patients.
In conclusion, maximal exercise performance was similarly reduced in RTx and HDP with near
normal [Hb], as was muscle maximal Na+,K+-pump activity and relative TMCSA. The depressed
Na+,K+-pump activity is likely due to direct inhibition of Na+,K+-pumps, since muscle
Na+,K+-pump content and isoform abundance did not differ between RTx and HDP. Finally,
impaired exercise performance in HDP and RTx may be partially due to depressed muscle
Na+,K+-pump activity and relative TMCSA.
Acknowledgements
We sincerely thank our participants for their time and effort.

15
K.T. Murphy current address: Department of Physiology, University of Melbourne, Melbourne,
Victoria, Australia.
M.J. Leikis current address: Department of Renal Medicine, Wellington Hospital, Wellington, New
Zealand.
Disclosure statement
The authors have no conflicts of interest to disclose. The results of this paper have not been
published previously in whole or part, except in abstract form.
This research was supported by funding from Janssen-Cilag, Australia.

16
REFERENCES
1. Painter P, Messer-Rehak D, Hanson P, et al. Exercise capacity in hemodialysis, CAPD, and
renal transplant patients. Nephron 1986;42(1):47-51.
2. Gallagher-Lepak S. Functional capacity and activity level before and after renal
transplantation. Anna Journal 1991;18(4):378-82.
3. Painter P, Hanson P, Messer-Rehak D, et al. Exercise tolerance changes following renal
transplantation. American Journal of Kidney Diseases 1987;10(6):452-6.
4. Marrades RM, Roca J, Campistol JM, et al. Effects of erythropoietin on muscle O2 transport
during exercise in patients with chronic renal failure. Journal of Clinical Investigation
1996;97(9):2092-100.
5. McMahon LP, McKenna MJ, Sangkabutra T, et al. Physical performance and associated
electrolyte changes after haemoglobin normalization: a comparative study in haemodialysis
patients. Nephrology, Dialysis, Transplantation 1999;14(5):1182-7.
6. Diesel W, Noakes TD, Swanepoel C, et al. Isokinetic muscle strength predicts maximum
exercise tolerance in renal patients on chronic hemodialysis. American Journal of Kidney Diseases
1990;16(2):109-14.
7. Kempeneers G, Noakes TD, van Zyl Smit R, et al. Skeletal muscle limits the exercise
tolerance of renal transplant recipients: effects of a graded exercise training program. American
Journal of Kidney Diseases : the Official Journal of the National Kidney Foundation 1990;16(1):57-
65.
8. van den Ham ECH, Kooman JP, Schols AMWJ, et al. Similarities in skeletal muscle
strength and exercise capacity between renal transplant and hemodialysis patients. American
Journal of Transplantation 2005;5(8):1957-1965.
17
9. Kemp GJ, Crowe AV, Anijeet HK, et al. Abnormal mitochondrial function and muscle
wasting, but normal contractile efficiency, in haemodialysed patients studied non-invasively in
vivo. Nephrol Dial Transplant 2004;19(6):1520-7.
10. Norager CB, Jensen MB, Madsen MR, et al. Effect of darbepoetin alfa on physical function
in patients undergoing surgery for colorectal cancer. A randomized, double-blind, placebo-
controlled study. Oncology 2006;71(3-4):212-20.
11. Nyberg G, Hallste G, Norden G, et al. Physical performance does not improve in elderly
patients following successful kidney transplantation. Nephrology, Dialysis, Transplantation
1995;10(1):86-90.
12. Horber FF, Scheidegger JR, Grunig BE, et al. Thigh muscle mass and function in patients
treated with glucocorticoids. Eur J Clin Invest 1985;15(6):302-7.
13. Moore GE, Bertocci LA, Painter PL. 31P-magnetic resonance spectroscopy assessment of
subnormal oxidative metabolism in skeletal muscle of renal failure patients. Journal of Clinical
Investigation 1993;91(2):420-4.
14. McKenna MJ, Bangsbo J, Renaud J-M. Muscle K+, Na+, and Cl disturbances and Na+-K+
pump inactivation: implications for fatigue. J Appl Physiol 2008;104(1):288-295.
15. Sangkabutra T, Crankshaw DP, Schneider C, et al. Impaired K+ regulation contributes to
exercise limitation in end-stage renal failure. Kidney International 2003;63(1):283-290.
16. Johansen KL, Doyle J, Sakkas GK, et al. Neural and metabolic mechanisms of excessive
muscle fatigue in maintenance hemodialysis patients. Am J Physiol Regul Integr Comp Physiol
2005;289(3):R805-813.
17. Kjeldsen K, Nørgaard A, Clausen T. The age-dependent changes in the number of 3H-
ouabain binding sites in mammalian skeletal muscle. Pflugers Archiv : European Journal of
Physiology 1984;402:100-108.

18
18. Clausen T. Na+-K+ pump regulation and skeletal muscle contractility. Physiol. Rev.
2003;83(4):1269-1324.
19. Druml W, R.A. Kelly, R.C. May, and W.E. Mitch. Abnormal cation transport in uremia.
Mechanisms in adipocytes and skeletal muscle from uremic rats. J. Clin. Invest. 1988;81:1197-
1203.
20. Greiber S, England BK, Price SR, et al. Na pump defects in chronic uremia cannot be
attributed to changes in Na-K-ATPase mRNA or protein. American Journal of Physiology
1994;266(4 Pt 2):F536-42.
21. Sigstrom L. Characteristics of active sodium and potassium transport in erythrocytes in
children with different stages of symptomatic uremia. Acta Paediatrica Scandinavica
1981;70(3):361-8.
22. Petersen AC, Leikis MJ, McMahon LP, et al. Effects of endurance training on extrarenal
potassium regulation and exercise performance in patients on haemodialysis. Nephrol Dial
Transplant 2009;24(9):2882-8.
23. Li JL, Wang XN, Fraser SF, et al. Effects of fatigue and training on sarcoplasmic reticulum
Ca2+ regulation in human skeletal muscle. J Appl Physiol 2002;92(3):912-922.
24. Leikis M, McKenna M, Petersen A, et al. Exercise performance falls over time in patients
with chronic kidney disease despite maintenance of hemoglobin concentration. Clin J Am Soc
Nephrol 2006;1:488-495.
25. Petersen AC, Murphy KT, Snow RJ, et al. Depressed Na+-K+-ATPase activity in skeletal
muscle at fatigue is correlated with increased Na+-K+-ATPase mRNA expression following intense
exercise. Am J Physiol Regul Integr Comp Physiol 2005;289(1):R266-274.
26. McLoughlin P, Popham P, Linton RA, et al. Use of arterialized venous blood sampling
during incremental exercise tests. J Appl Physiol 1992;73(3):937-40.

19
27. Harrison MH. Effects of thermal stress and exercise on blood volume in humans.
Physiological Reviews 1985;65(1):149-209.
28. McKenna MJ, Heigenhauser GJ, McKelvie RS, et al. Sprint training enhances ionic
regulation during intense exercise in men. Journal of Physiology 1997;501 ( Pt 3):687-702.
29. McKenna MJ, Schmidt TA, Hargreaves M, et al. Sprint training increases human skeletal
muscle Na+-K+-ATPase concentration and improves K+ regulation. Journal of Applied Physiology
1993;75(1):173-80.
30. Fraser SF, Li JL, Carey MF, et al. Fatigue depresses maximal in vitro skeletal muscle Na+-
K+-ATPase activity in untrained and trained individuals. J Appl Physiol 2002;93(5):1650-1659.
31. Hallén J, Gullestad L, Sejersted OM. K+ shifts of skeletal muscle during stepwise bicycle
exercise with and without beta-adrenoceptor blockade. J Physiol 1994;477 ( Pt 1):149-59.
32. Gullestad L, Birkeland K, Nordby G, et al. Effects of selective beta 2-adrenoceptor blockade
on serum potassium and exercise performance in normal men. Br J Clin Pharmacol 1991;32(2):201-
7.
33. Ravn HB, Dørup I. The concentration of sodium, potassium pumps in chronic obstructive
lung disease (COLD) patients: the impact of magnesium depletion and steroid treatment. Journal of
Internal Medicine 1997;241(1):23-9.
34. Fraser SF, McKenna MJ. Measurement of Na+, K+-ATPase activity in human skeletal
muscle. Analytical Biochemistry 1998;258(1):63-7.
35. Nørgaard A, Kjeldsen K, Clausen T. A method for the determination of the total number of
3H-ouabain binding sites in biopsies of human skeletal muscle. Scandinavian Journal of Clinical
and Laboratory Investigation 1984;44(6):509-18.
36. Murphy KT, Snow RJ, Petersen AC, et al. Intense exercise up-regulates Na+,K+-ATPase
isoform mRNA, but not protein expression in human skeletal muscle. J Physiol (Lond)
2004;556(2):507-519.

20
37. Vasarhelyi B, Sallay P, Balog E, et al. Altered Na+-K+ ATPase activity in uraemic
adolescents. Acta Paediatrica 1996;85(8):919-22.
38. Aparicio M, Vincendeau P, Combe C, et al. Improvement of leucocytic Na+ K+ pump
activity in uremic patients on low protein diet. Kidney International 1991;40(2):238-42.
39. Bergström J, Alvestrand A, Furst P, et al. Muscle intracellular electrolytes in patients with
chronic uremia. Kidney International. Supplement 1983;16:S153-60.
40. Cotton JR, Woodard T, Carter NW, et al. Resting skeletal muscle membrane potential as an
index of uremic toxicity. A proposed new method to assess adequacy of hemodialysis. Journal of
Clinical Investigation 1979;63(3):501-6.
41. Zannad F, Royer RJ, Kessler M, et al. Cation transport in erythrocytes of patients with renal
failure. Nephron 1982;32(4):347-50.
42. Cole CH, Maletz R. Changes in erythrocyte membrane ouabain-sensitive adenosine
triphosphatase after renal transplantation. Clin Sci Mol Med 1975;48(3):239-42.
43. Ferrer-Martinez A, Felipe A, Barcelo P, et al. Lack of effect of clinical doses of cyclosporin
A on erythrocyte Na+/K+-ATPase activity. Clin Sci (Lond) 1999;97(3):283-90.
44. Bundgaard H, Schmidt TA, Larsen JS, et al. K+ supplementation increases muscle Na+-K+-
ATPase and improves extrarenal K+ homeostasis in rats. Journal of Applied Physiology
1997;82(4):1136-44.
45. Fervenza FC, Hendry BM, Ellory JC. Effects of dialysis and transplantation on red cell Na
pump function in renal failure. Nephron 1989;53(2):121-8.
46. Nørgaard A, Kjeldsen K, Hansen O. (Na+ + K+)-ATPase activity of crude homogenates of
rat skeletal muscle as estimated from their K+-dependent 3-O-methylfluorescein phosphatase
activity. Biochimica Et Biophysica Acta 1984;770(2):203-9.

21
47. Wu BJ, Hulbert AJ, Storlien LH, et al. Membrane lipids and sodium pumps of cattle and
crocodiles: an experimental test of the membrane pacemaker theory of metabolism. Am J Physiol
Regul Integr Comp Physiol 2004;287(3):R633-641.
48. Phair PG, Powell HR, McCredie DA, et al. Low red cell arachidonic acid in cyclosporine-
treated patients. Clin Nephrol 1989;32(2):57-61.
49. Lausada N, de Gomez Dumm Nelva T, Georgina L, et al. Effect of different
immunosuppressive therapies on the lipid pattern in kidney-transplanted rats. Transplant
International 2005;18(5):524-531.
50. Kaji DM, Lim J, Shilkoff W, et al. Urea inhibits the Na-K pump in human erythrocytes.
Journal of Membrane Biology 1998;165(2):125-31.
51. Mardini M, Mihailidou AS, Wong A, et al. Cyclosporine and FK506 differentially regulate
the sarcolemmal Na+-K+ pump. J Pharmacol Exp Ther 2001;297(2):804-810.
52. Lea JP, Sands JM, McMahon SJ, et al. Evidence that the inhibition of Na+/K+-ATPase
activity by FK506 involves calcineurin. Kidney Int 1994;46(3):647-52.
53. McKenna MJ, Fraser SF, Li JL, et al. Impaired muscle Ca2+ and K+ regulation contribute to
poor exercise performance post-lung transplantation. J Appl Physiol 2003;95(4):1606-1616.
54. van den Ham EC, Kooman JP, Christiaans MH, et al. Relation between steroid dose, body
composition and physical activity in renal transplant patients. Transplantation 2000;69(8):1591-8.
55. Ahonen RE. Light microscopic study of striated muscle in uremia. Acta Neuropathologica
1980;49(1):51-5.
56. Bradley JR, Anderson JR, Evans DB, et al. Impaired nutritive skeletal muscle blood flow in
patients with chronic renal failure. Clinical Science 1990;79(3):239-45.
57. Heaf J, Jakobsen U, Tvedegaard E, et al. Dietary habits and nutritional status of renal
transplant patients. Journal of Renal Nutrition 2004;14(1):20-25.

22
58. Petersen AC, Leikis MJ, McMahon LP, et al. Effects of endurance training on extrarenal
potassium regulation and exercise performance in patients on haemodialysis. Nephrol. Dial.
Transplant. 2009;In Press.
59. Sejersted OM, Sjøgaard G. Dynamics and consequences of potassium shifts in skeletal
muscle and heart during exercise. Physiological Reviews 2000;80(4):1411-81.
60. Juel C, Pilegaard H, Nielsen JJ, et al. Interstitial K+ in human skeletal muscle during and
after dynamic graded exercise determined by microdialysis. Am J Physiol Regulatory Integrative
Comp Physiol 2000;278(2):R400-406.
61. Nielsen JJ, Mohr M, Klarskov C, et al. Effects of high-intensity intermittent training on
potassium kinetics and performance in human skeletal muscle. J Physiol (Lond) 2004;554(3):857-
870.
62. Street D, Nielsen J-J, Bangsbo J, et al. Metabolic alkalosis reduces exercise-induced
acidosis and potassium accumulation in human skeletal muscle interstitium. J Physiol (Lond)
2005;566(2):481-489.

23
Tables
Table 1. Physical characteristics in renal transplant recipients, hemodialysis patients and healthy
controls.
RTx HDP CON n 9 10 10
Age (years) 41.3 ± 10.6 39.2 ± 8.6 39.8 ± 8.8
Sex (F:M) 3:6 3:7 3:7
Body mass (kg) 75.6 ± 15.7 76.8 ± 17.1 72.4 ± 16.0
Height (m) 1.71 ± 0.13 1.75 ± 0.11 1.75 ± 0.09
BMI (kg.m-2) 25.8 ± 3.3 25.2 ± 5.0 23.4 ± 3.7
[ Hb] (g.l-1) 134 ± 9 133 ± 14 145 ± 13
Hct (%) 38.7 ± 2.5 38.3 ± 5.1 41.0 ± 3.2
Systolic BP (mmHg) 132 ± 15 127 ± 19 124 ± 10
Diastolic BP (mmHg) 86 ± 6 83 ± 13 81 ± 8
Creatinine clearance (ml.min-
1) 75.5 ± 21.6* 108.5 ± 19.2
TMCSA (cm2) 118 ± 22 113 ± 20 131 ± 24
Relative TMCSA (cm2.kg-1) 1.58 ± 0.23* 1.53 ± 0.22* 1.82 ± 0.16
Values are mean ± SD; RTx, renal transplant recipients; HDP, hemodialysis patients; CON, healthy
controls; BMI, body mass index; TMCSA, thigh muscle cross-sectional area; * less than CON, P <
0.05.

24
Table 2. Vastus lateralis Na+,K+-pump isoform expression in RTx, HDP and CON
RTx HDP CON
α1 2.3 ± 2.3 1.3 ± 1.1 2.1 ± 2.3
α2 1.2 ± 0.8 1.7 ± 0.9 1.4 ± 0.6
α3 3.2 ± 1.2 3.0 ± 1.5 4.8 ± 3.4
β1 2.5 ± 1.7 1.6 ± 0.6 2.0 ± 1.0
β2 1.5 ± 1.2 1.4 ± 0.5 1.8 ± 0.9
β3 0.8 ± 0.8 0.7 ± 0.5 0.7 ± 0.3
Values are mean ± SD; RTx, renal transplant recipient, n = 9; HDP, hemodialysis patient, n = 10;
CON, healthy controls, n = 10. All values are normalized to the same human muscle standard that
was run in all gels.

25
Table 3. Patient medications
RTx HDP
Medication n Dose n Dose
Darbepoetin (µg.fortnight-1) 1 40 6 30 ± 17
A tenolol (mg.d-1) 2 38 ± 18 1 25
Metoprolol (mg.d-1) 2 125 ± 106
Ramipril (mg.d-1) 3 10 ± 0
Irbesartan (mg.d-1) 3 53 ± 39 1 300
Nifedipine (mg.d-1) 3 43 ± 15
Cyclosporine (mg.d-1)
Blood concentration (ng.ml-1) 4
138 ± 66
636 ± 225
Prednisolone (mg.d-1) 7 5 ± 0.5 1 2.5
Azathioprine (mg.d-1) 3 58 ± 38
Tacrolimus (mg.d-1)
Blood concentration (ng.ml-1) 5
4 ± 1
10.7 ± 3.8
Mycophenolate mofetil (mg.d-1) 5 1338 ± 483
Values are mean ± SD; RTx, renal transplant recipient; HDP, haemodialysis patient.

26
Table 4 Plasma acid-base and electrolyte concentrations in hemodialysis patients, renal transplant recipients and healthy controls at rest and peak workrate RTx HDP CON
Rest Peak Rest Peak Rest Peak
pH 7.41 ± 0.02 7.32 ± 0.06 7.44 ± 0.05 7.35 ± 0.03 7.42 ± 0.02 7.30 ± 0.03
HCO3- (mmol.l-1) 24.1 ± 2.2 16.2 ± 2.9£ 27.1 ± 1.8‡ 19.2 ± 2.8 26.4 ± 2.2‡ 16.1 ± 2.8£
Na+ (mmol.l-1) 139 ± 3 147 ± 3 138 ± 5 144 ± 6 140 ± 2 148 ± 2
Cl- (mmol.l-1) 108 ± 3§ 110 ± 3§ 98 ± 5 100 ± 5 105 ± 2§ 108 ± 2§
Ca2+ (mmol.l-1) 2.43 ± 0.16 2.57 ± 0.16
PO4 (mmol.l-1) 0.79 ± 0.16 1.62 ± 0.29‡
Values are mean ± SD; RTx, renal transplant recipient; HDP, haemodialysis patient; ‡ greater than RTx, P < 0.05; § greater than HDP, P < 0.05;
£ less than HDP, P < 0.05
27
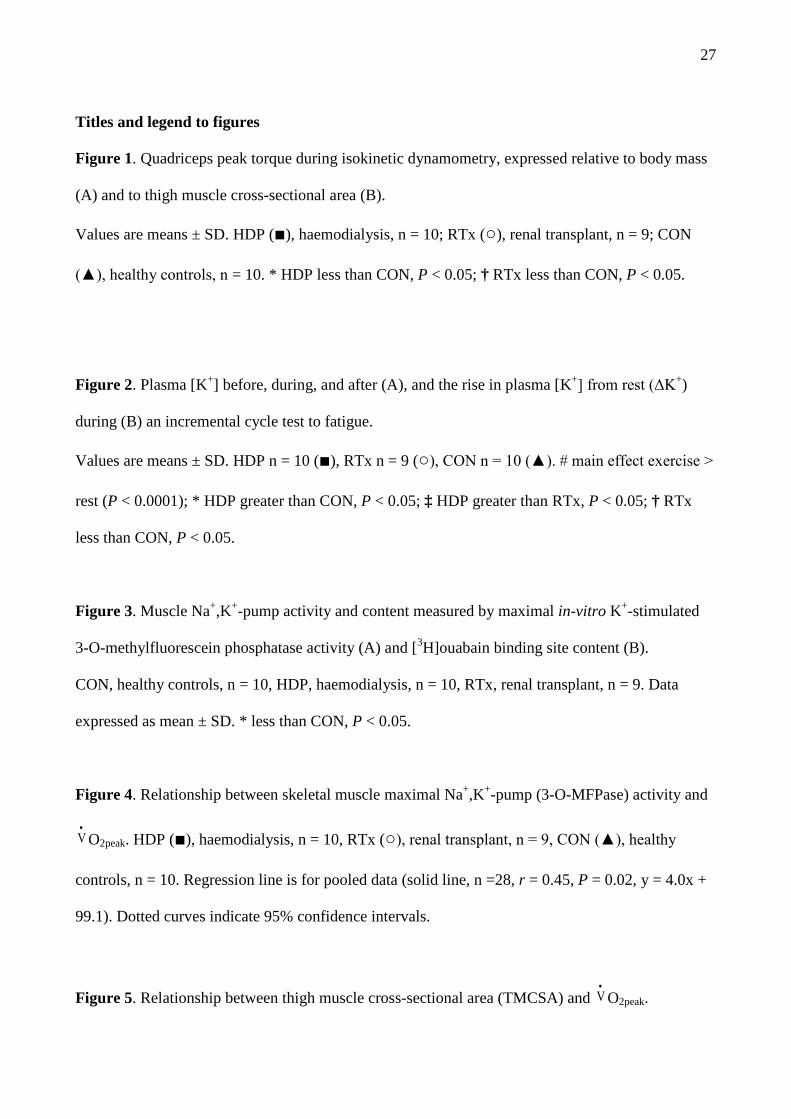
Titles and legend to figures
Figure 1. Quadriceps peak torque during isokinetic dynamometry, expressed relative to body mass
(A) and to thigh muscle cross-sectional area (B).
Values are means ± SD. HDP (■), haemodialysis, n = 10; RTx (○), renal transplant, n = 9; CON
(▲), healthy controls, n = 10. * HDP less than CON, P < 0.05; † RTx less than CON, P < 0.05.
Figure 2. Plasma [K+] before, during, and after (A), and the rise in plasma [K+] from rest (ΔK+)
during (B) an incremental cycle test to fatigue.
Values are means ± SD. HDP n = 10 (■), RTx n = 9 (○), CON n = 10 (▲). # main effect exercise >
rest (P < 0.0001); * HDP greater than CON, P < 0.05; ‡ HDP greater than RTx, P < 0.05; † RTx
less than CON, P < 0.05.
Figure 3. Muscle Na+,K+-pump activity and content measured by maximal in-vitro K+-stimulated
3-O-methylfluorescein phosphatase activity (A) and [3H]ouabain binding site content (B).
CON, healthy controls, n = 10, HDP, haemodialysis, n = 10, RTx, renal transplant, n = 9. Data
expressed as mean ± SD. * less than CON, P < 0.05.
Figure 4. Relationship between skeletal muscle maximal Na+,K+-pump (3-O-MFPase) activity and
V•
O2peak. HDP (■), haemodialysis, n = 10, RTx (○), renal transplant, n = 9, CON (▲), healthy
controls, n = 10. Regression line is for pooled data (solid line, n =28, r = 0.45, P = 0.02, y = 4.0x +
99.1). Dotted curves indicate 95% confidence intervals.
Figure 5. Relationship between thigh muscle cross-sectional area (TMCSA) and V•
O2peak.

28
HDP (■), haemodialysis, n = 10, RTx (○), renal transplant, n = 9, CON (▲), healthy controls, n =
10. Regression line is for pooled data (solid line, n =28, r = 0.46, P = 0.02, y = 0.0016x + 10.8).
Dotted curves indicate 95% confidence intervals.

29
Figure 1
Velocity (deg.s-1)
0 60 120 180 240 300 360
Torq
ue.m
uscl
e C
SA-1
(Nm
.cm
-2)
0.0
0.4
0.6
0.8
1.0
1.2
1.4
1.6
1.8
2.0
0 60 120 180 240 300 360
Torq
ue.b
ody
mas
s-1
(Nm
.kg-1
)
0.0
0.5
1.0
1.5
2.0
2.5
3.0
3.5 HDPRTxCON
*†*†
*†
*†
*†
†
A
*†

30
Figure 2
A
B
Workrate (W)
0 50 150 200 250
∆ [K+ ] (
mm
ol.l-1
)
0.0
0.5
1.0
1.5
†
Workrate (W)0 50 150 200 250
[K+ ] (
mm
ol.l-1
)
0.0
4.0
4.5
5.0
5.5
6.0
6.5 *†
* * * * * *
‡ ‡ ‡ ‡ ‡ ‡
Recovery(min)
0 2 4 6 10
HDRTxCon
*
#

31
Figure 3
CON HDP RTx
[3 H]o
uaba
in b
indi
ng s
ites
(pm
ol.(g
wet
wt)-1
)
0
50
100
150
200
250
300
350
400B
3-O
-MFP
ase
activ
ity(n
mol
.min
-1.(g
wet
wt)-1
)
0
50
100
150
200
250
300
350
*
A
*

32
Figure 4
3-O-MFPase activity(nmol.min-1.(g wet wt)-1)
0 50 100 150 200 250 300 350 400 450
VO
2 pe
ak (m
l.kg-1
.min
-1)
0
15
20
25
30
35
40
45
50 HDPRTxCON

33
Figure 5
TMCSA (mm2)
0 8000 10000 12000 14000 16000 18000
VO
2 pe
ak (m
l.kg-1
.min
-1)
0
15
20
25
30
35
40
45
50 HDPRTxCON