Embed Size (px)
Citation preview
Impedance calculation of PSB cavityImpedance calculation of PSB cavity(HFSS : Frequency Domain)( q y )
14.Dec.2012K t hi H (KEK)Katsushi Hasegawa (KEK)
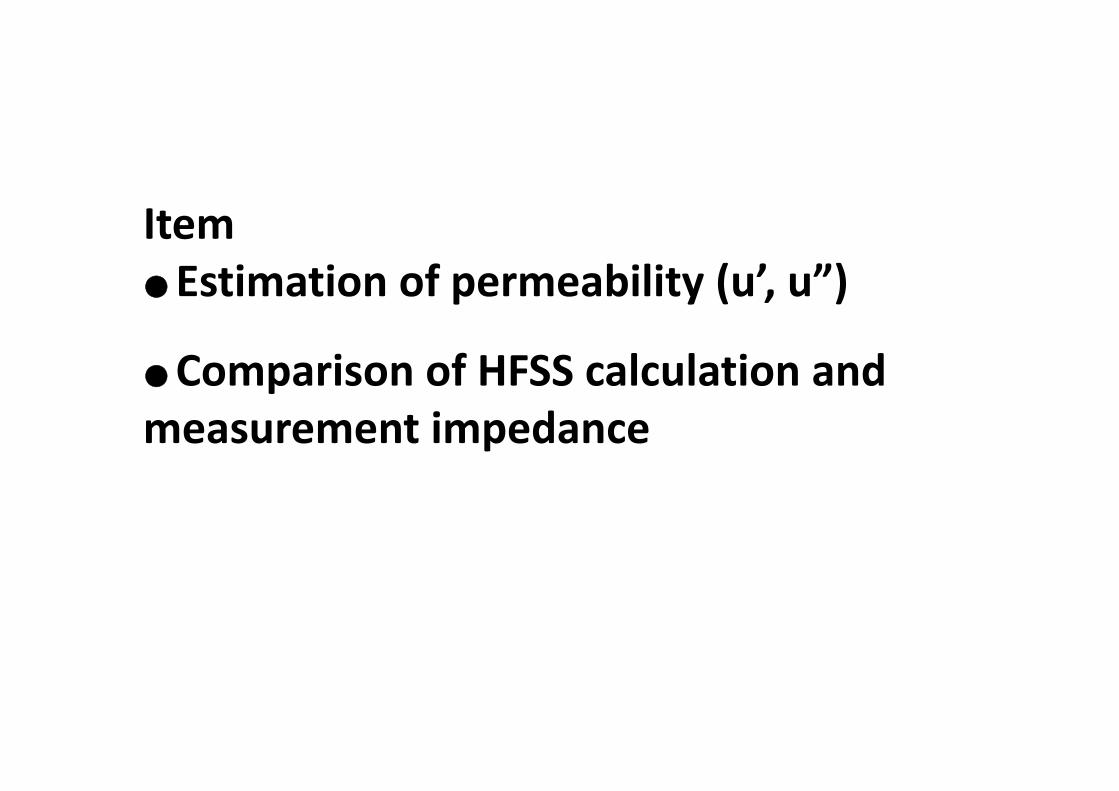
ItemItem● Estimation of permeability (u’, u”)
● Comparison of HFSS calculation and measurement impedance
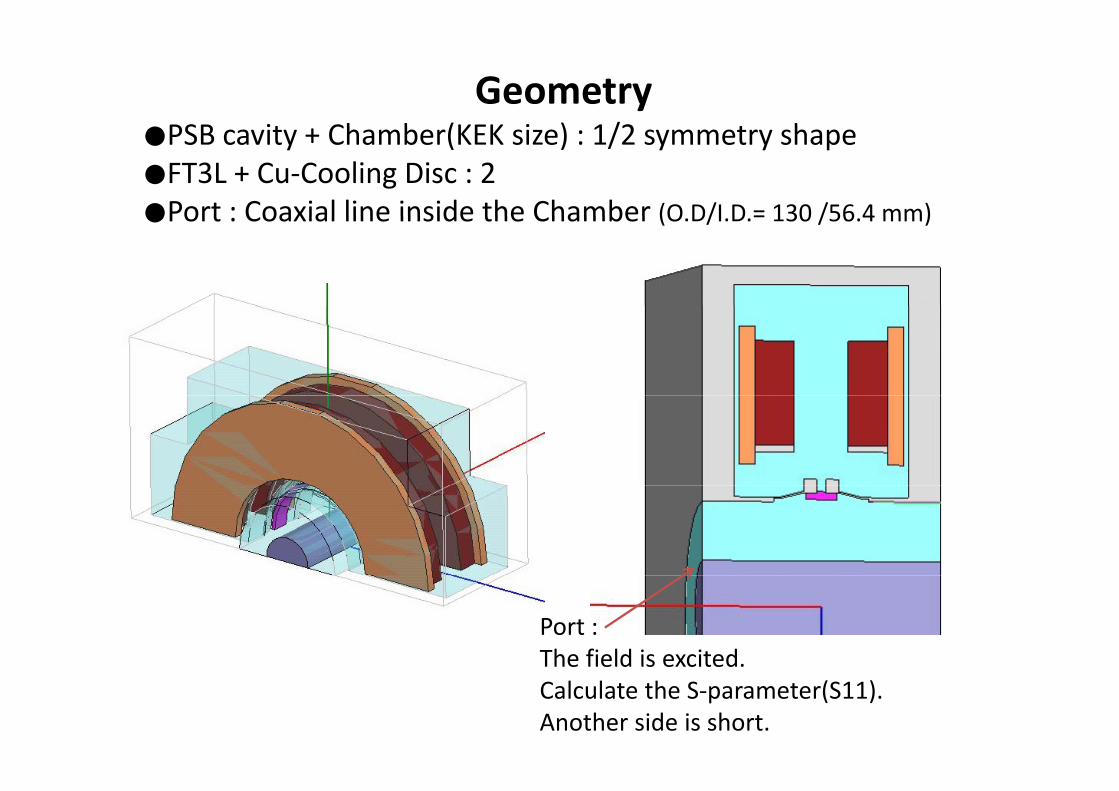
GeometryPSB it Ch b (KEK i ) 1/2 t h●PSB cavity + Chamber(KEK size) : 1/2 symmetry shape
●FT3L + Cu-Cooling Disc : 2●Port : Coaxial line inside the Chamber (O D/I D = 130 /56 4 mm)●Port : Coaxial line inside the Chamber (O.D/I.D.= 130 /56.4 mm)
Port : The field is excited.The field is excited.Calculate the S-parameter(S11).Another side is short.
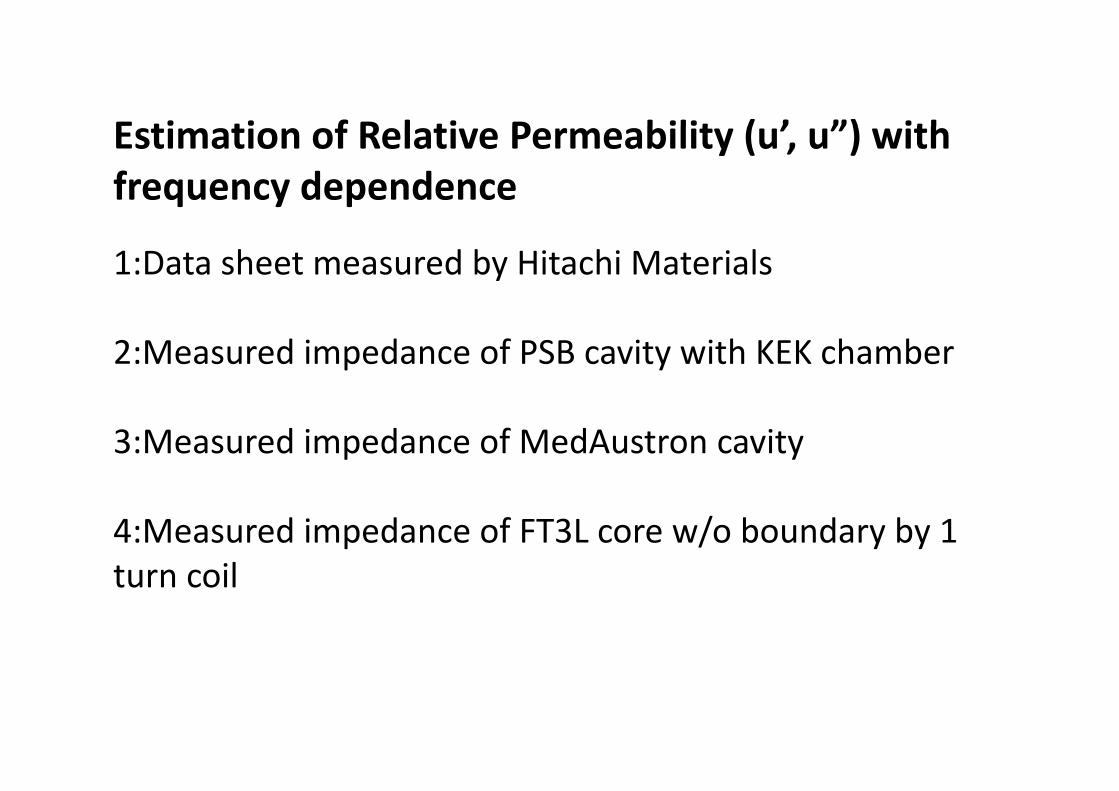
E ti ti f R l ti P bilit ( ’ ”) ithEstimation of Relative Permeability (u’, u”) with frequency dependence
1:Data sheet measured by Hitachi Materials
2:Measured impedance of PSB cavity with KEK chamber
3:Measured impedance of MedAustron cavity
4:Measured impedance of FT3L core w/o boundary by 1 turn coilturn coil
Relative Permeability 1e at e e eab ty
DATA :DATA :Hitachi Materials DATA Sheet
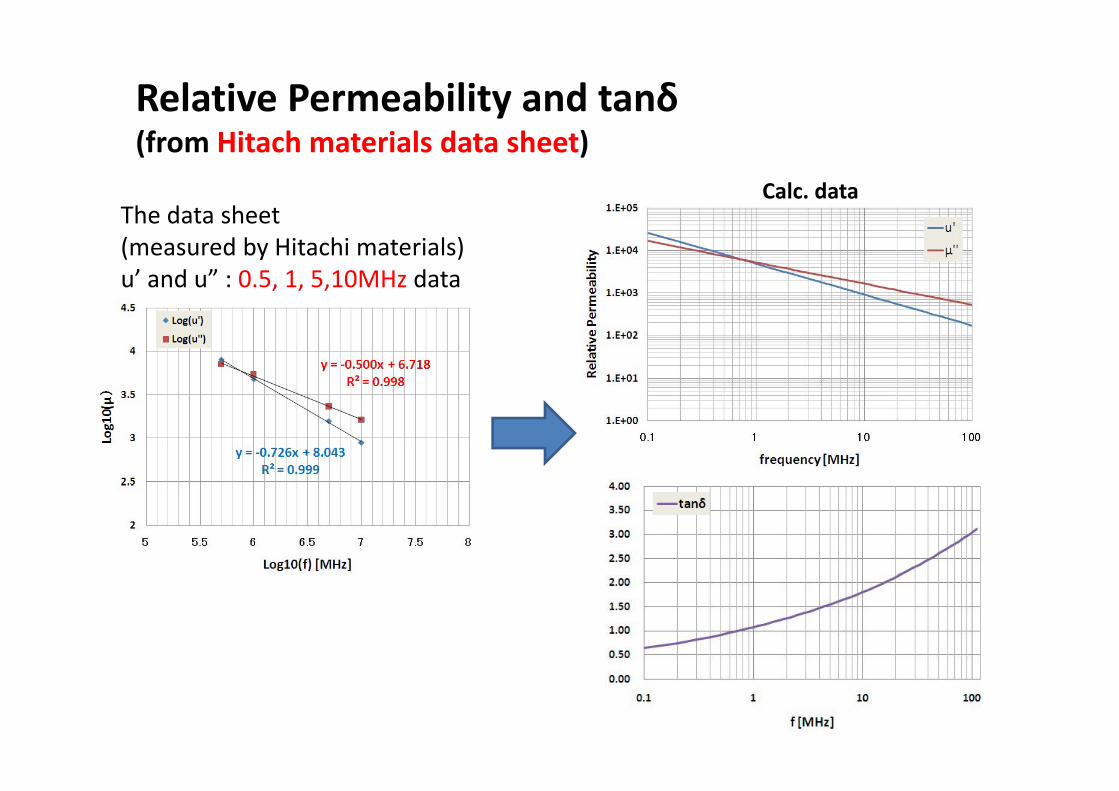
Relative Permeability and tanδ(from Hitach materials data sheet)
The data sheetCalc. data
The data sheet (measured by Hitachi materials) u’ and u” : 0.5, 1, 5,10MHz data
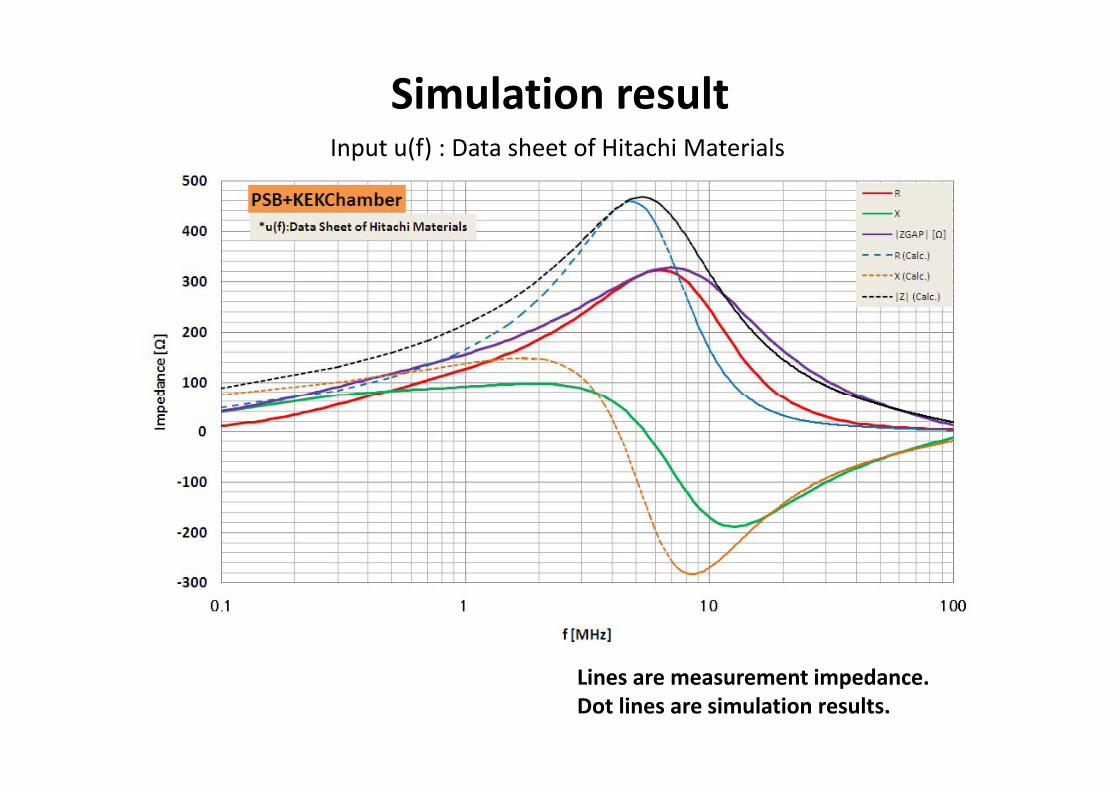
Simulation resultInput u(f) : Data sheet of Hitachi Materials
Lines are measurement impedance.Dot lines are simulation results.
Relative Permeability 2e at e e eab ty
DATA :DATA :Measured Impedance of PSB Cavity
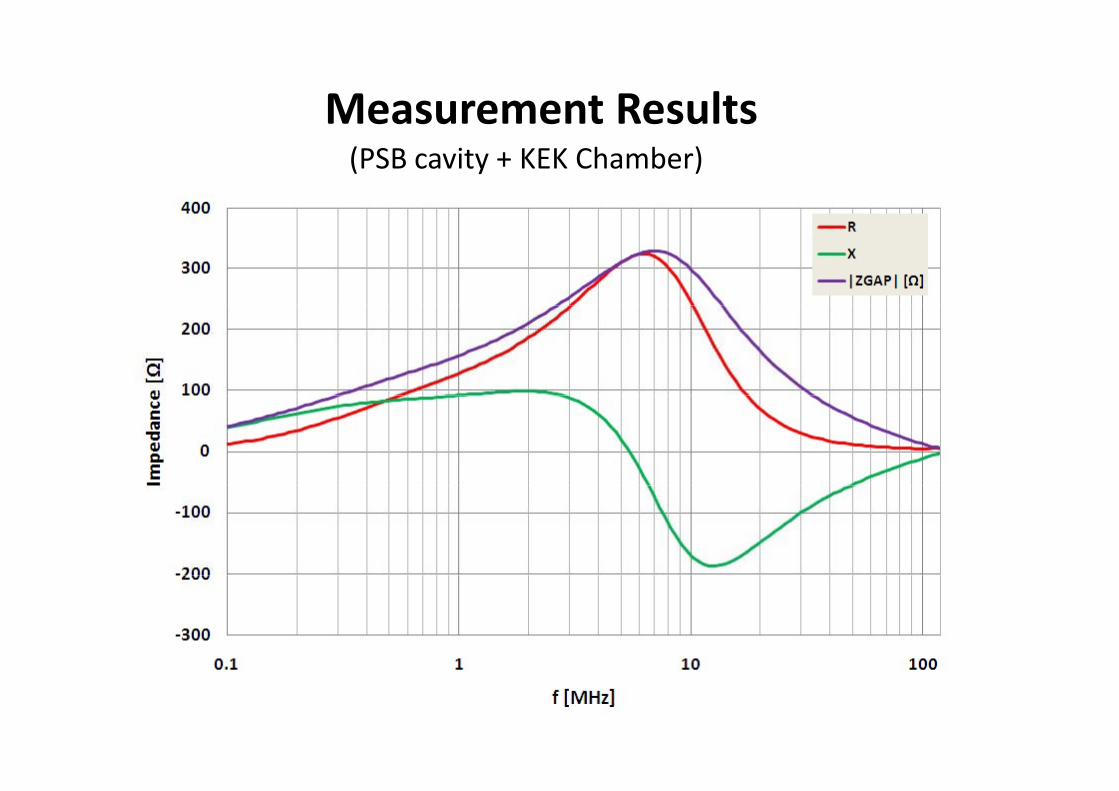
Measurement Results(PSB cavity + KEK Chamber)
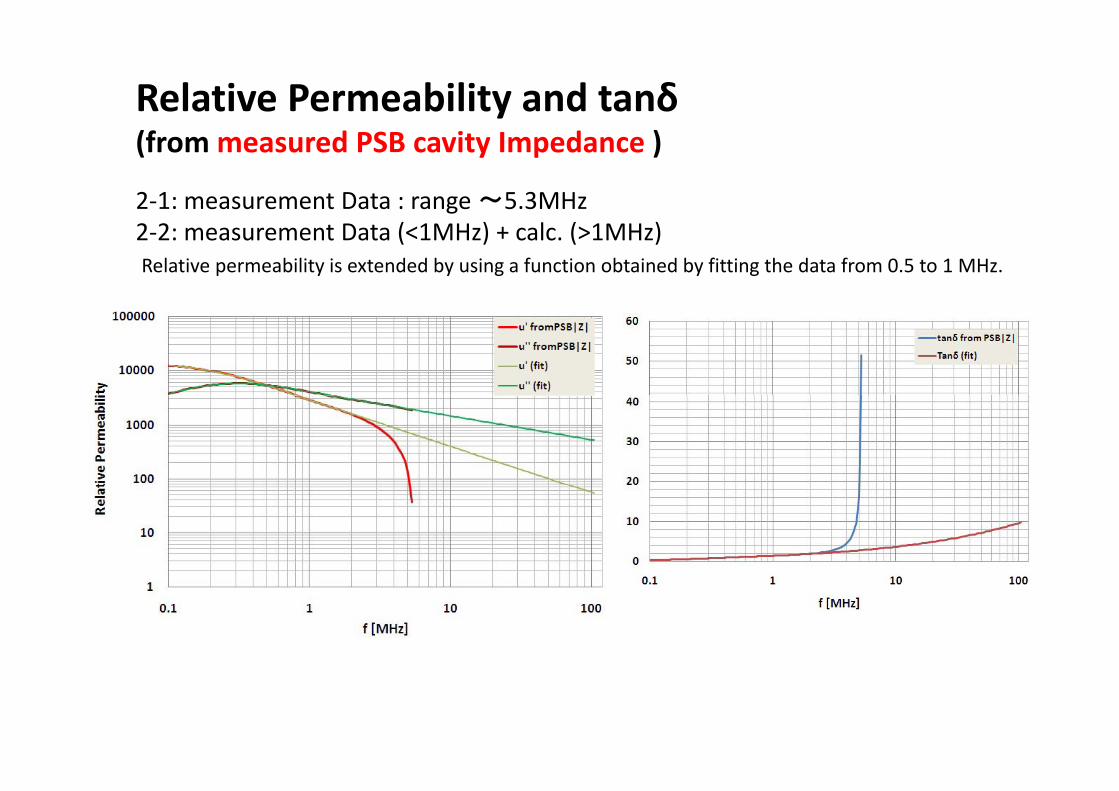
Relative Permeability and tanδ
2-1: measurement Data : range ~5.3MHz
(from measured PSB cavity Impedance )
2-2: measurement Data (<1MHz) + calc. (>1MHz)Relative permeability is extended by using a function obtained by fitting the data from 0.5 to 1 MHz.
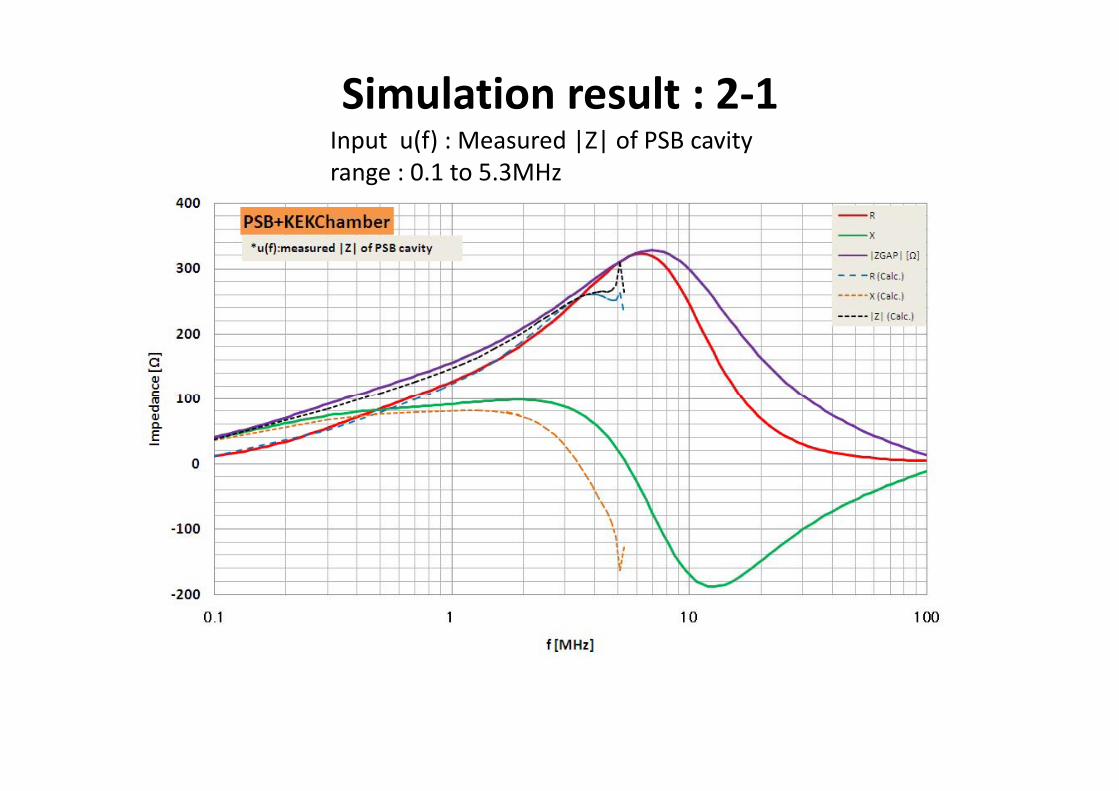
Simulation result : 2-1Input u(f) : Measured |Z| of PSB cavityrange : 0.1 to 5.3MHz
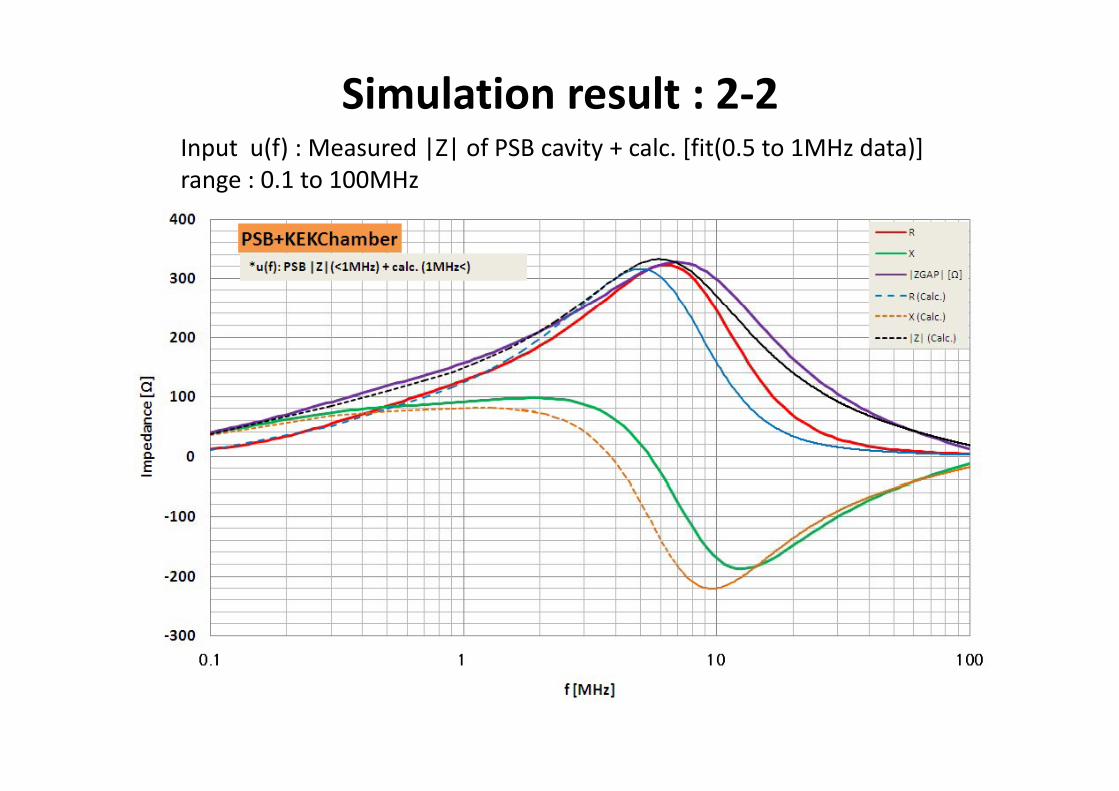
Simulation result : 2-2Input u(f) : Measured |Z| of PSB cavity + calc. [fit(0.5 to 1MHz data)]range : 0.1 to 100MHz
Relative Permeability 3
DATA : M d I d f M dA iMeasured Impedance of MedAustron cavity
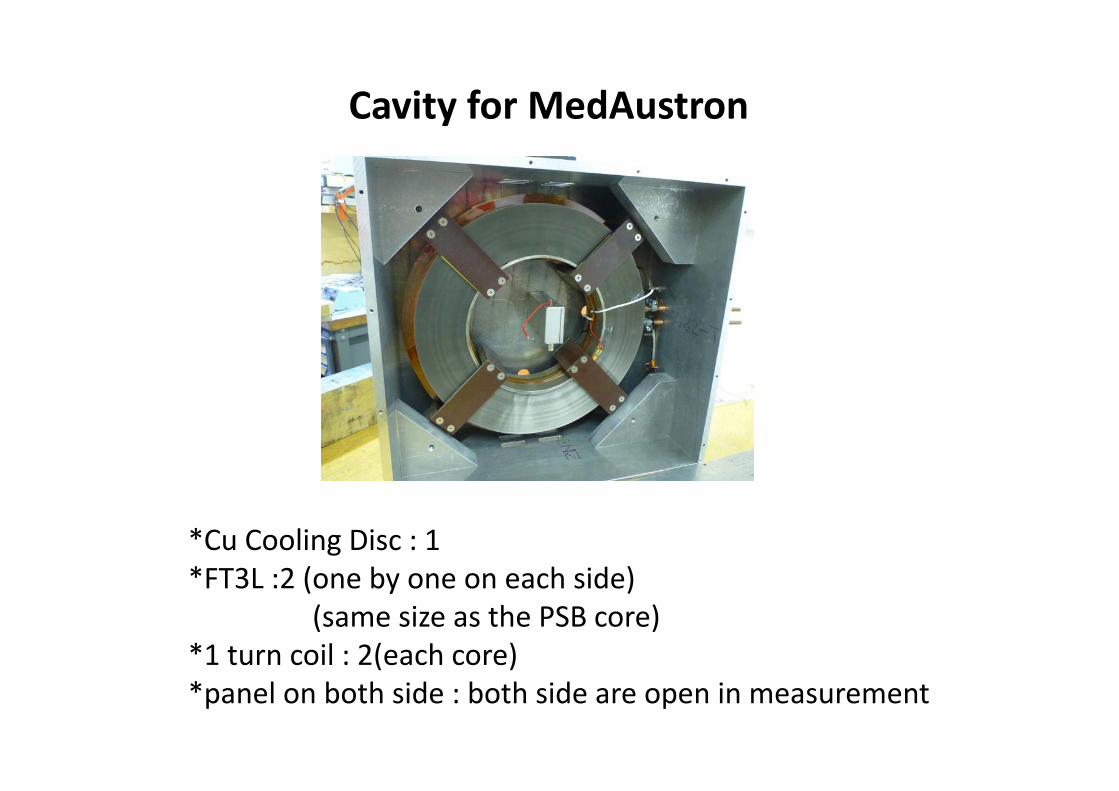
Cavity for MedAustron
*Cu Cooling Disc : 1*FT3L :2 (one by one on each side)*FT3L :2 (one by one on each side)
(same size as the PSB core)*1 turn coil : 2(each core)turn coil : (each core)*panel on both side : both side are open in measurement
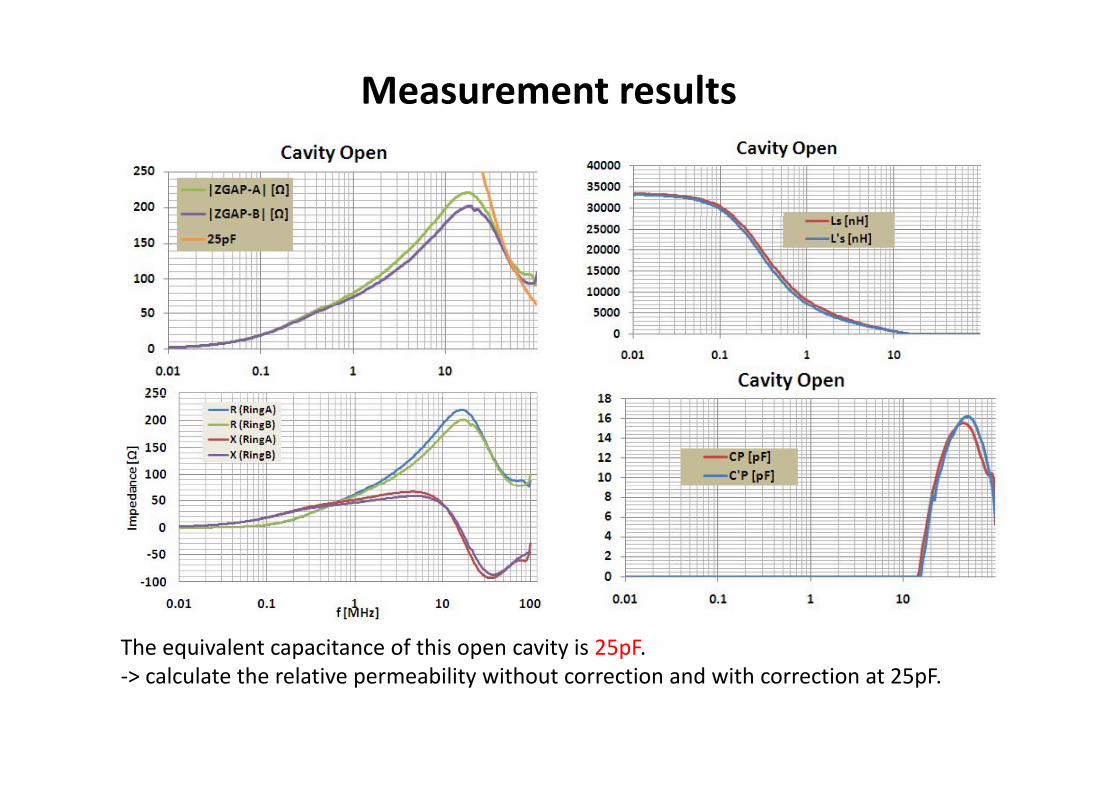
Measurement results
The equivalent capacitance of this open cavity is 25pF.-> calculate the relative permeability without correction and with correction at 25pF.
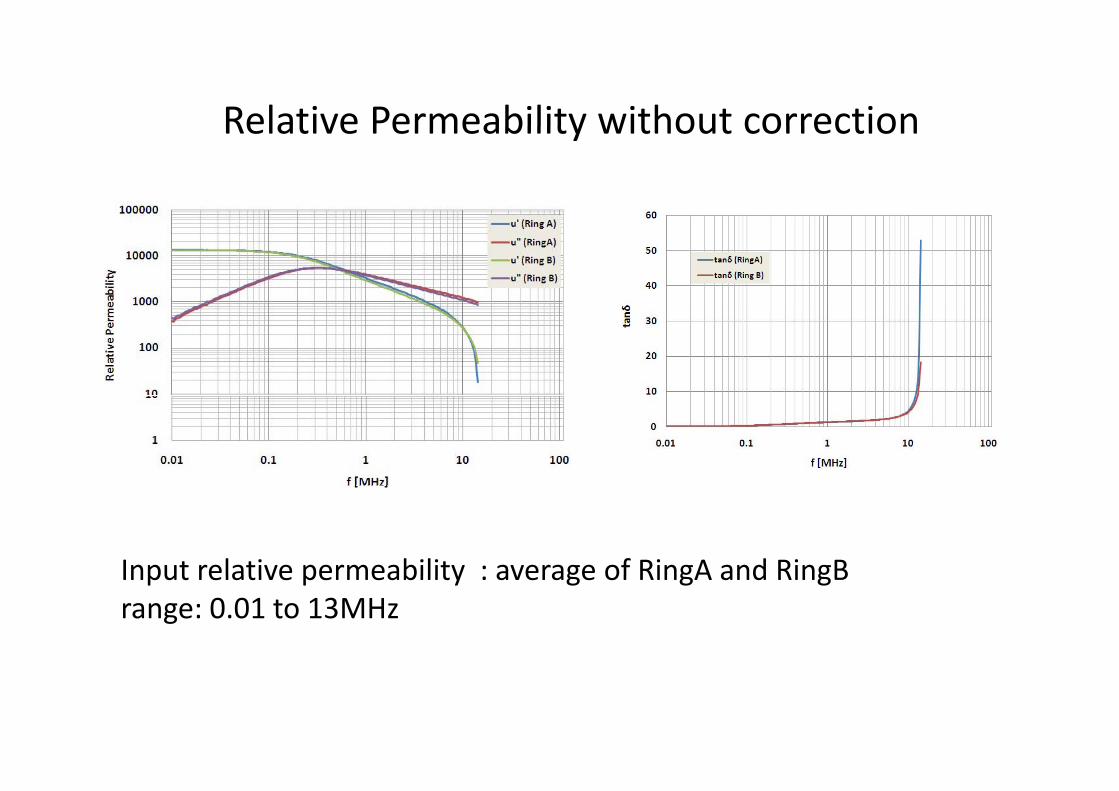
Relative Permeability without correctionRelative Permeability without correction
Input relative permeability : average of RingA and RingBInput relative permeability : average of RingA and RingBrange: 0.01 to 13MHz
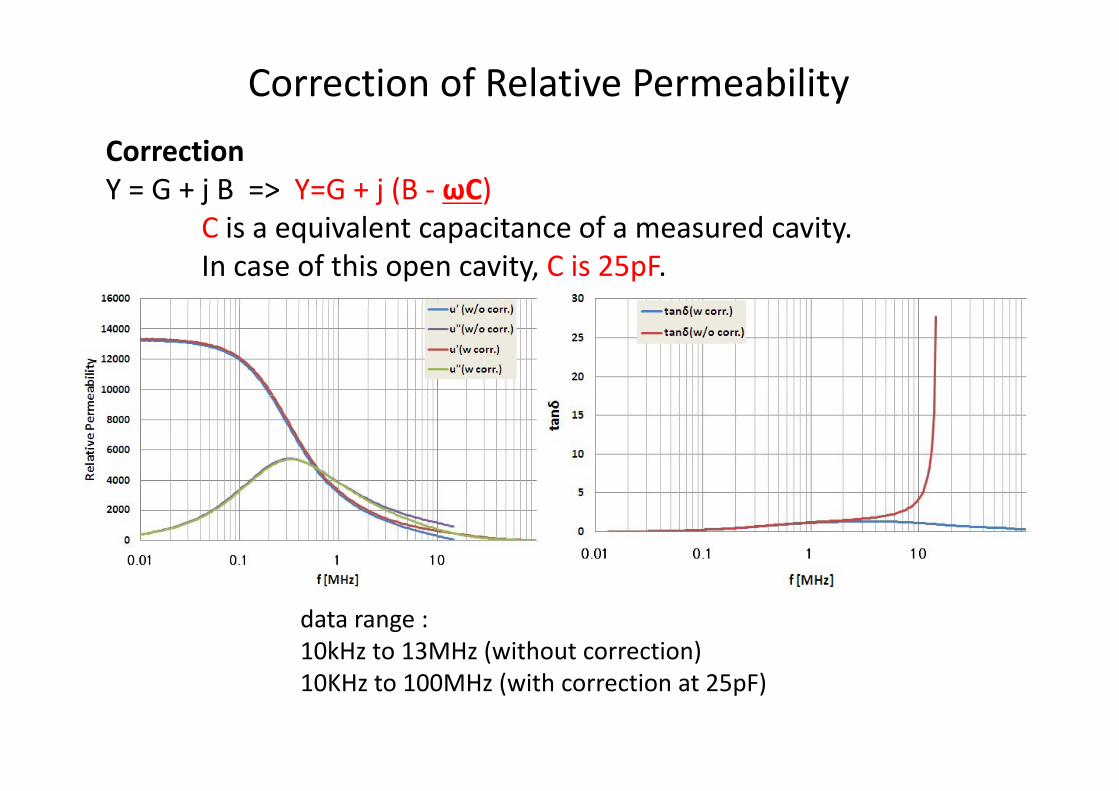
Correction of Relative Permeability
CorrectionY = G + j B => Y=G + j (B - ωC)
l f dC is a equivalent capacitance of a measured cavity.In case of this open cavity, C is 25pF.
data range : 10kHz to 13MHz (without correction)10KHz to 100MHz (with correction at 25pF)
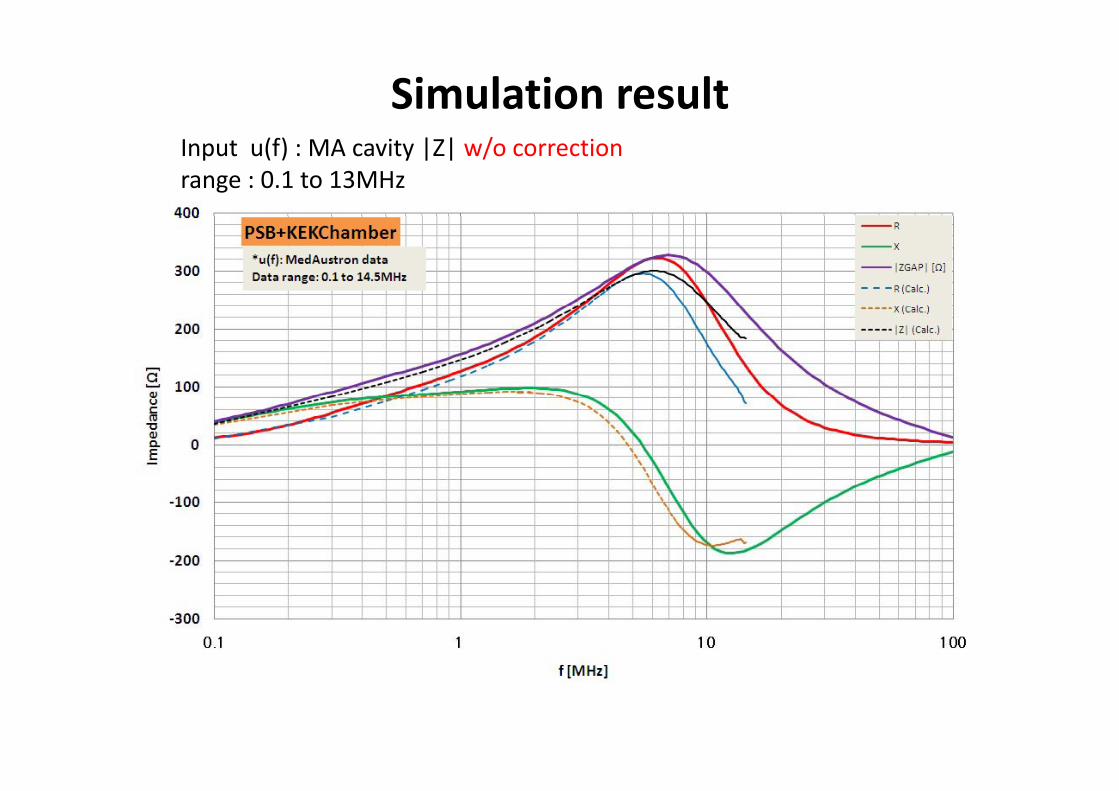
Simulation resultInput u(f) : MA cavity |Z| w/o correctionrange : 0.1 to 13MHz
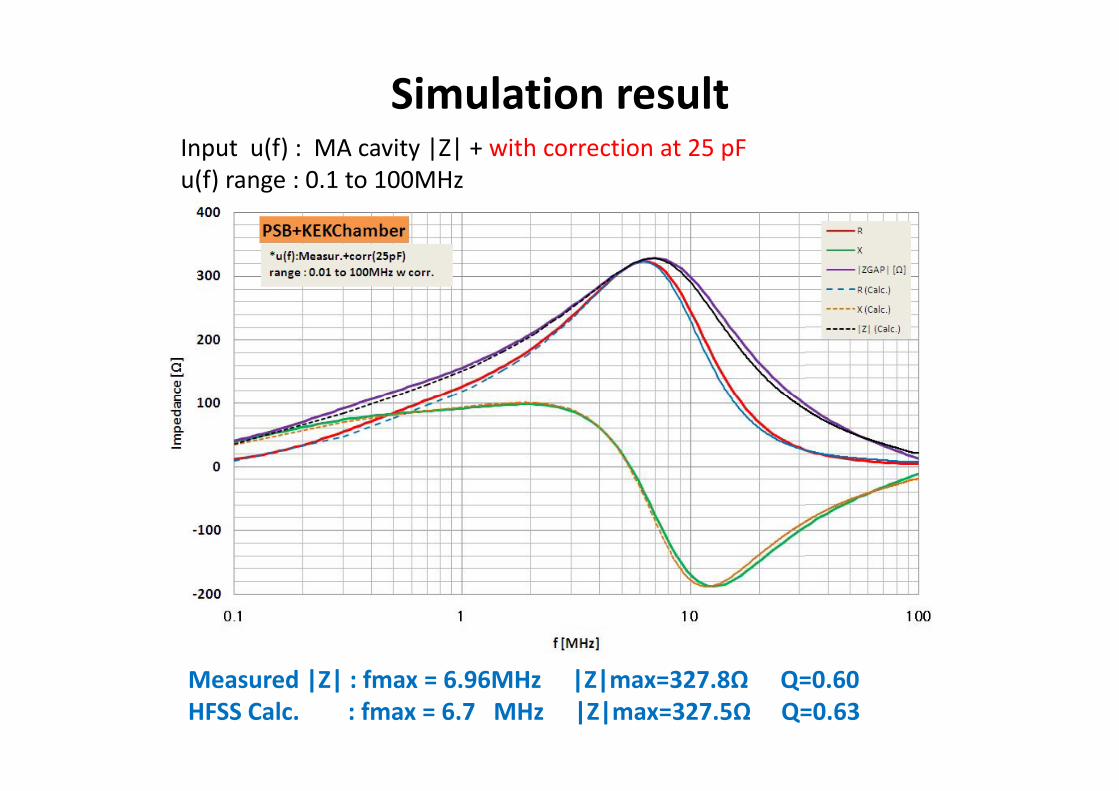
Simulation resultInput u(f) : MA cavity |Z| + with correction at 25 pFu(f) range : 0.1 to 100MHz
Measured |Z| : fmax = 6.96MHz |Z|max=327.8Ω Q=0.60HFSS Calc. : fmax = 6.7 MHz |Z|max=327.5Ω Q=0.63
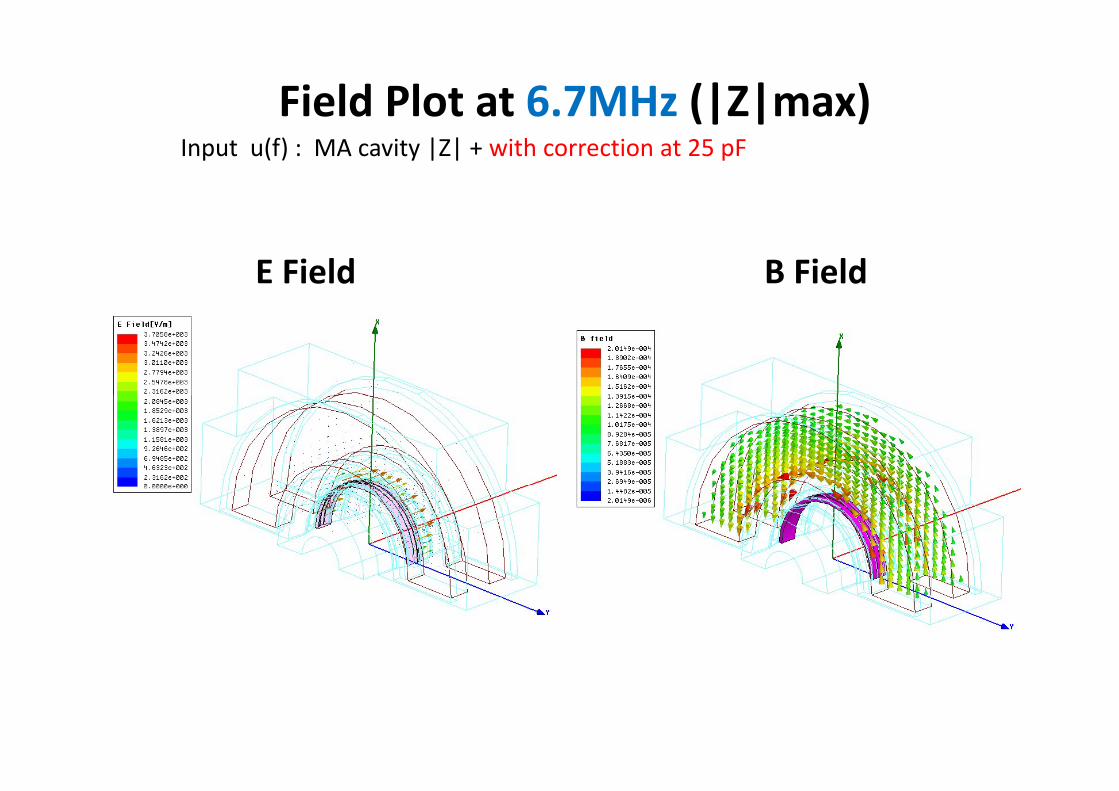
Field Plot at 6.7MHz (|Z|max)Input u(f) : MA cavity |Z| + with correction at 25 pF
E Field B Field
Relative Permeability 4e at e e eab ty
Data:Data:Measured Impedance of 1 FT3L core by 1 t il1-turn coil (w/o Boundary condition)
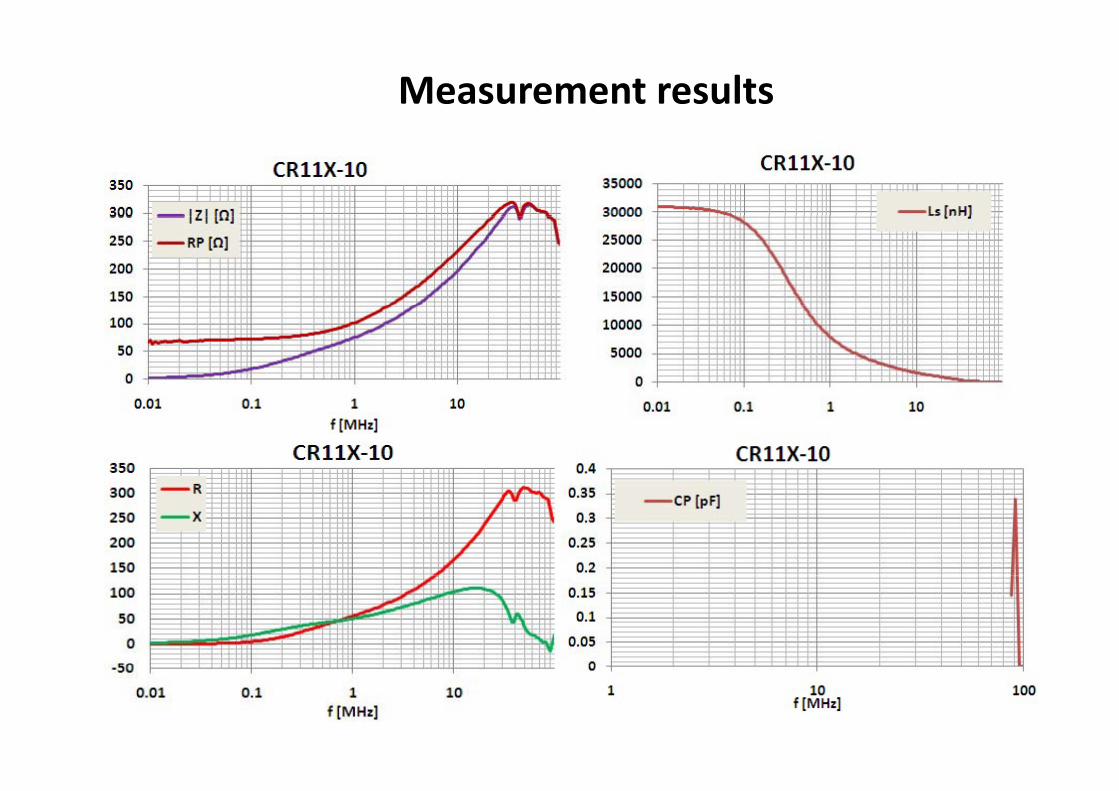
Measurement results
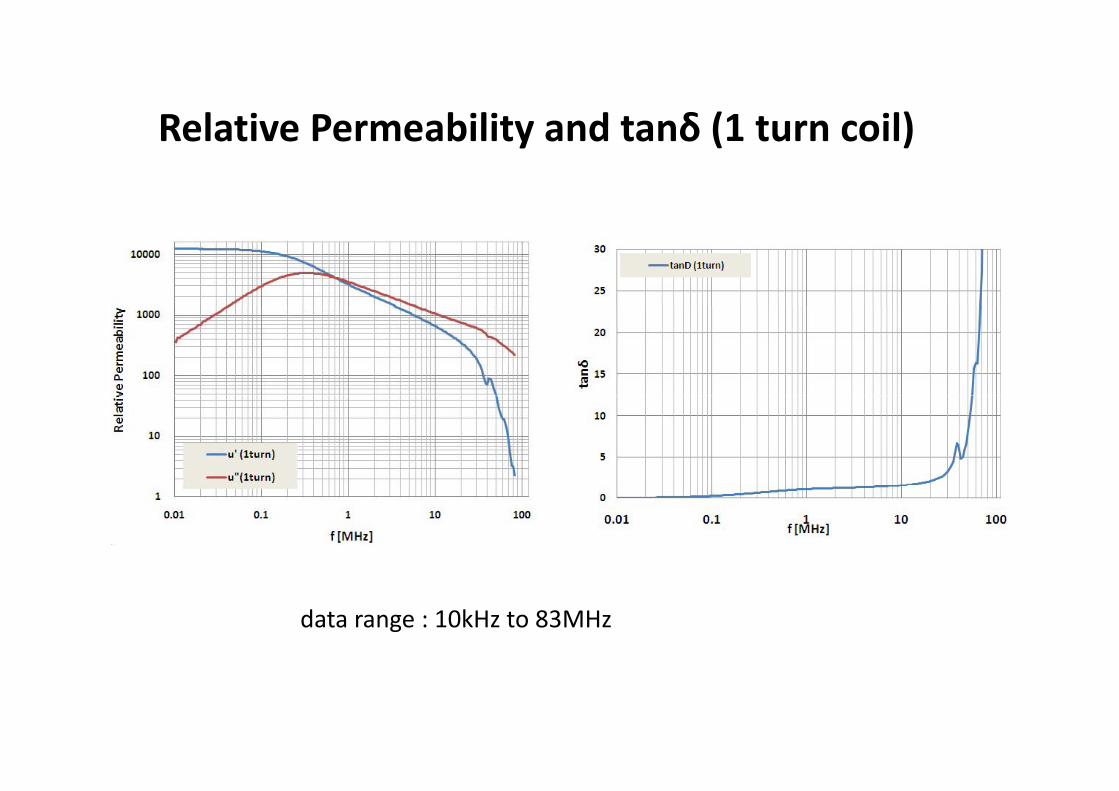
Relative Permeability and tanδ (1 turn coil)Relative Permeability and tanδ (1 turn coil)
data range : 10kHz to 83MHz
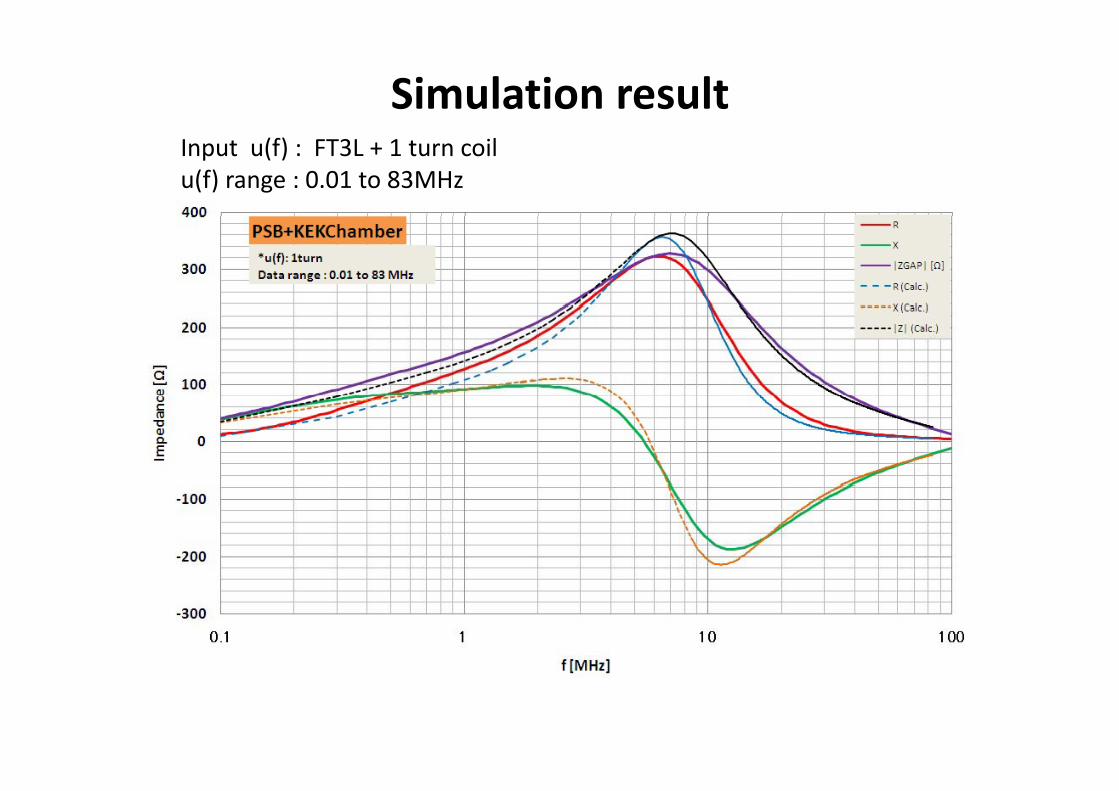
Simulation resultInput u(f) : FT3L + 1 turn coilu(f) range : 0.01 to 83MHz
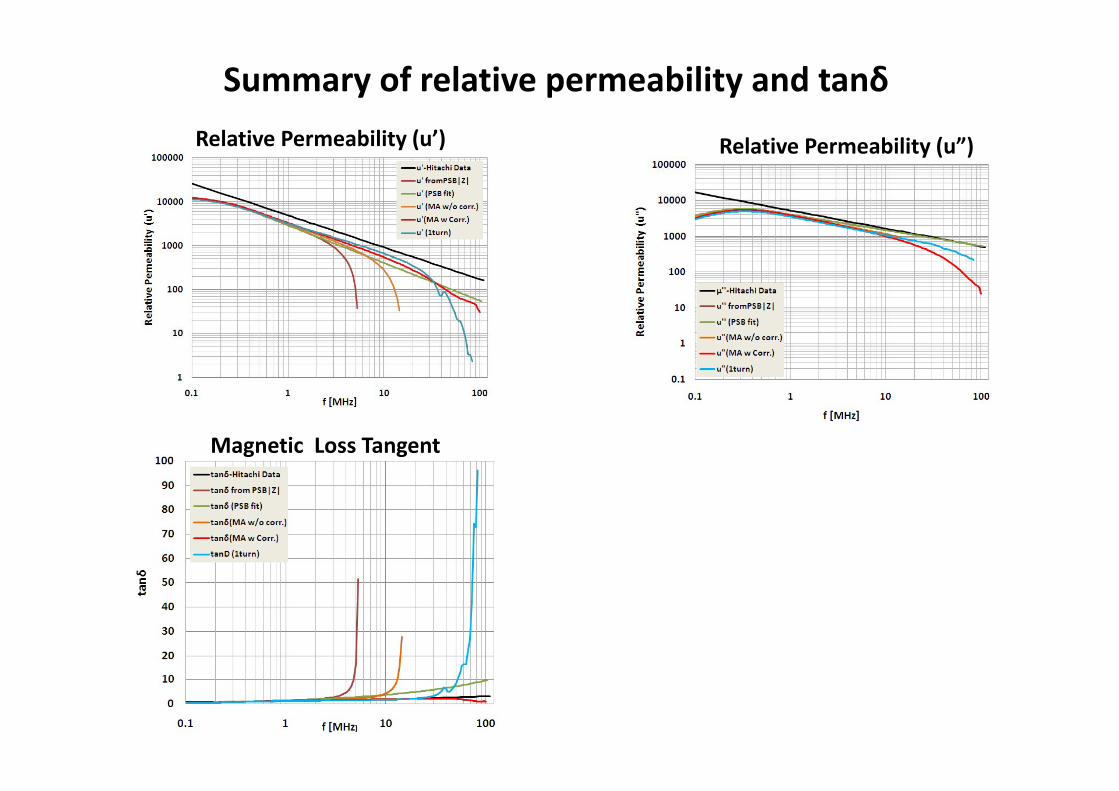
Summary of relative permeability and tanδ
Relative Permeability (u’) Relative Permeability (u”)
Magnetic Loss Tangent
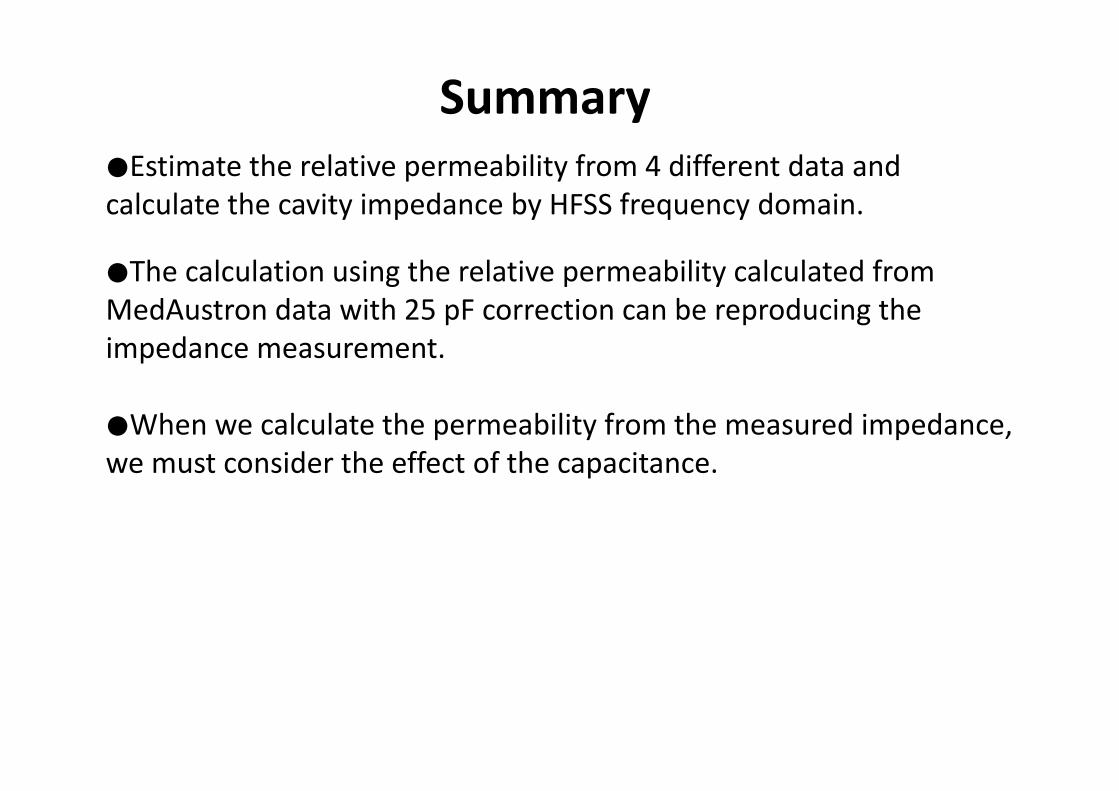
Summary●Estimate the relative permeability from 4 different data and calculate the cavity impedance by HFSS frequency domain.y p y q y
●The calculation using the relative permeability calculated from MedAustron data with 25 pF correction can be reproducing theMedAustron data with 25 pF correction can be reproducing the impedance measurement.
●When we calculate the permeability from the measured impedance, we must consider the effect of the capacitance.


![The New Approach of the Impedance Calculation … New Approach of the Impedance Calculation Method of Fault Current Analysis in the AT Feedi ng Method of the ... [Ω]/10[MVA] In the](https://img.pdfslide.net/doc/110x75/5ab5b2947f8b9a2f438ce151/the-new-approach-of-the-impedance-calculation-new-approach-of-the-impedance.jpg)


![Research on Calculation Method of Harmonic Impedance · [3] HUI J,YANG H,LIN S . Assessing utility harmonic impedance based on the covariance characteristic of random vectors[J].](https://img.pdfslide.net/doc/110x75/612eeed01ecc515869431fa3/research-on-calculation-method-of-harmonic-impedance-3-hui-jyang-hlin-s-i.jpg)