Embed Size (px)
Citation preview
LIMP - MANUAL
Impedance MeasurementThiele Small Parameters (TSP)RLC Meter
Based on the original LIMP ManualsOriginal tutorial in German by Dr Heinrich WeberOriginal manuals in English prepared by Dr Ivo Mateljan© Weber/Mateljan
Translation into English of Version 2.40D (ARTA 1.80)Christopher J. Dunn, Hamilton, New Zealand, September 2014
2
Contents
1. Introduction to LIMP ......................................................................................................................3
1.3. Pin assignment for cables and connectors...............................................................................4
2. Measurement principles and setup in LIMP ...................................................................................5
2.1. Setup .......................................................................................................................................5
2.1.1. Impedance measurement using the soundcard headphone jack ......................................5
2.1.2. Impedance measurement using a power amplifier..........................................................7
2.2. Working in LIMP....................................................................................................................8
2.2.1. Basic settings in LIMP....................................................................................................9
2.2.2. Compensating for the test leads ....................................................................................13
3. Determination of TS parameters ...................................................................................................14
3.1. Preparation for TS parameter measurement..........................................................................15
3.1.1. Excitation signal strength..............................................................................................15
3.1.2. Driver break-in..............................................................................................................16
3.1.3. Speaker mounting .........................................................................................................16
3.1.4. SD measurement ............................................................................................................17
3.1.5. RE measurement ............................................................................................................17
3.2. Speaker models for TS parameter determination..................................................................18
3.3. TS-parameter determination: volume method ......................................................................21
3.4. TS-parameter determination: added mass method....................................................................
4. Working with overlays and targets in LIMP.................................................................................26
5. Using LIMP as an RLC meter.......................................................................................................28
6. Accuracy of impedance measurements.........................................................................................31
7. References.....................................................................................................................................32
3
ForewordBecause of the increasing scope and complexity of the ARTA Handbook, the LIMP Manual is nowpresented separately to those for the other programs in the ARTA family.
LIMP is for impedance measurement and determination of Thiele-Small (TS) parameters. LIMP canalso be used as an LCR meter. Available excitation signals include pink noise (PN) and stepped sine.
This handbook has been written to help acquaint users with the LIMP part of the ARTA family ofprograms. Note however that it is not a substitute for the original user's manual that comes with thesoftware, and the two should be used in parallel with each other.
Further information can be found on the ARTA website, which contains the most up-to-date releasesand application notes. Although we aim to continue to supplement and update this handbook in linewith the continuing development of the software, we would ask for your patience with anydiscrepancies that may arise from time to time. Suggestions for improvements and corrections arealways welcome.
1. Introduction to LIMP
1.1. Installation requirements
To use the ARTA suite of programs you will need:
Operating system: Windows 98/ME/2000/XP/VISTA/Windows 7/ Windows 8; Processor: Pentium 400MHz or higher, memory 128k; Soundcard: full duplex.
Installation is very simple. Copy the files to a directory and unzip them. That's it! All registry entriesare automatically saved at first start-up.
1.2. Equipment
The following is a brief summary of the equipment required accompanied by some basic directionsand cross-referenced to more detailed information elsewhere.
Soundcards
There are three types of soundcard:
Standard onboard soundcard, found typically on a computer motherboard; Plug-in cards for PCI or ISA bus; Soundcards connected via USB or firewire.
Essentially, all three types are suitable for use with LIMP if they have an output channel (Line Out)and two input channels (Line In). Note however that onboard sound cards fitted to laptop computersoften have a single (mono) channel only, identified as the microphone input (Mic In).
Amplifier
A power amplifier with linear frequency response and power 5–10 watts is adequate. The outputimpedance should be <0.05 Ohms. An inexpensive solution that meets these requirements and is smalland easily portable is the Thomann t.amp PM40C (see also ARTA Handbook Section 5.4).
ARTA Measuring Box
The ARTA Measuring Box is not absolutely necessary, but it does make life a lot easier. Whenswitching between acoustic and electric measurements, the annoyance of having to swap multiplecables is replaced by the simple flick of a switch (see Application Note 1 (1)).
4
Multimeter
A multimeter for use with STEPS is not strictly necessary, but it is nevertheless indispensable for thecalibration of the measurement equipment to be used. Besides, a good meter is a useful tool for allmanner of other measurements. If you do not have a multimeter, you should ideally opt for a 'trueRMS' type. There are plenty of options on the market for well below €100.
Cables
Several cables are required, all of which should be of good quality. Poor connections, inadequateshielding, etc. can interfere with measurements (see also ARTA Handbook Section 6.1.1). Keep allcables as short as possible.
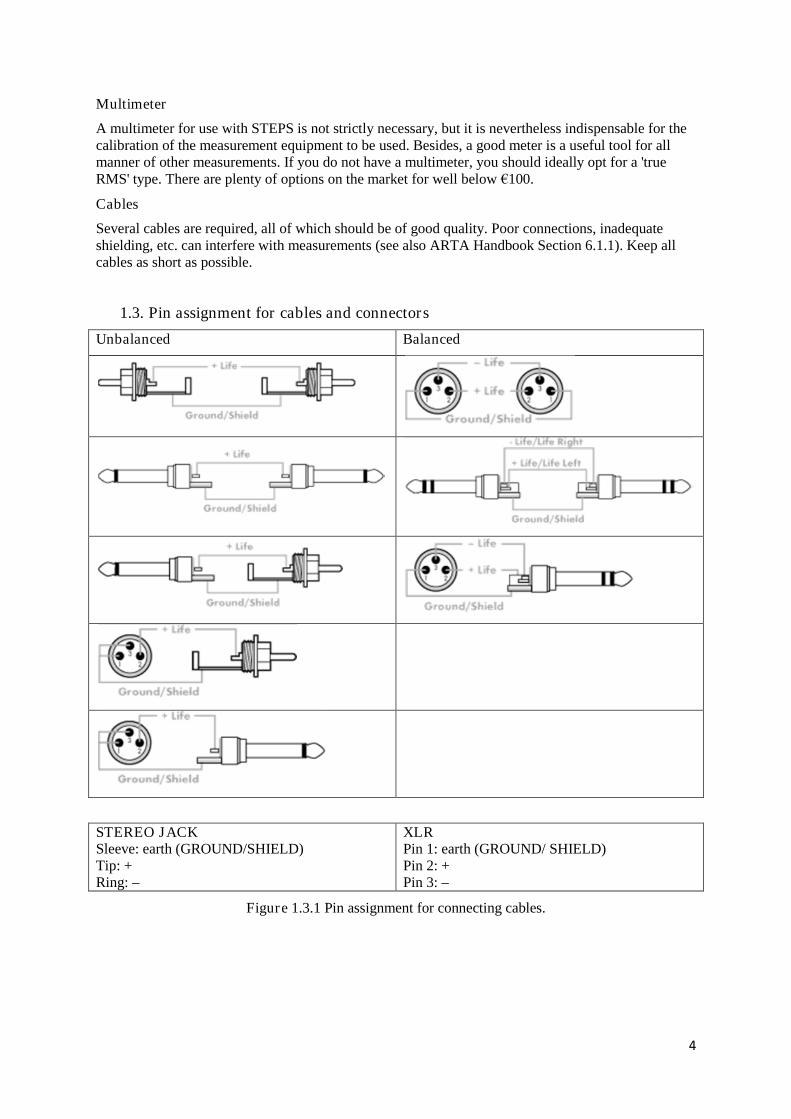
1.3. Pin assignment for cables and connectors
Unbalanced Balanced
STEREO JACKSleeve: earth (GROUND/SHIELD)Tip: +Ring: –
XLRPin 1: earth (GROUND/ SHIELD)Pin 2: +Pin 3: –
Figure 1.3.1 Pin assignment for connecting cables.
5
2. Measurement principles and setup in LIMP
2.1. Setup
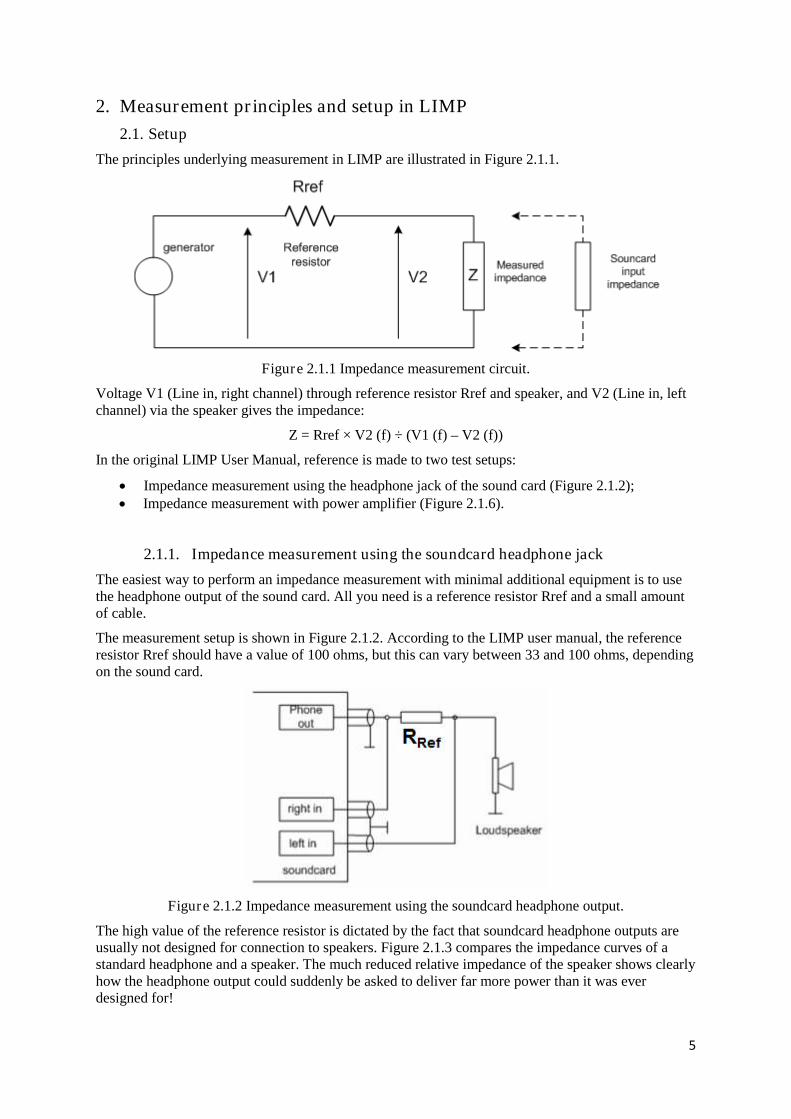
The principles underlying measurement in LIMP are illustrated in Figure 2.1.1.
Figure 2.1.1 Impedance measurement circuit.
Voltage V1 (Line in, right channel) through reference resistor Rref and speaker, and V2 (Line in, leftchannel) via the speaker gives the impedance:
Z = Rref × V2 (f) ÷ (V1 (f) – V2 (f))
In the original LIMP User Manual, reference is made to two test setups:
Impedance measurement using the headphone jack of the sound card (Figure 2.1.2); Impedance measurement with power amplifier (Figure 2.1.6).
2.1.1. Impedance measurement using the soundcard headphone jack
The easiest way to perform an impedance measurement with minimal additional equipment is to usethe headphone output of the sound card. All you need is a reference resistor Rref and a small amountof cable.
The measurement setup is shown in Figure 2.1.2. According to the LIMP user manual, the referenceresistor Rref should have a value of 100 ohms, but this can vary between 33 and 100 ohms, dependingon the sound card.
Figure 2.1.2 Impedance measurement using the soundcard headphone output.
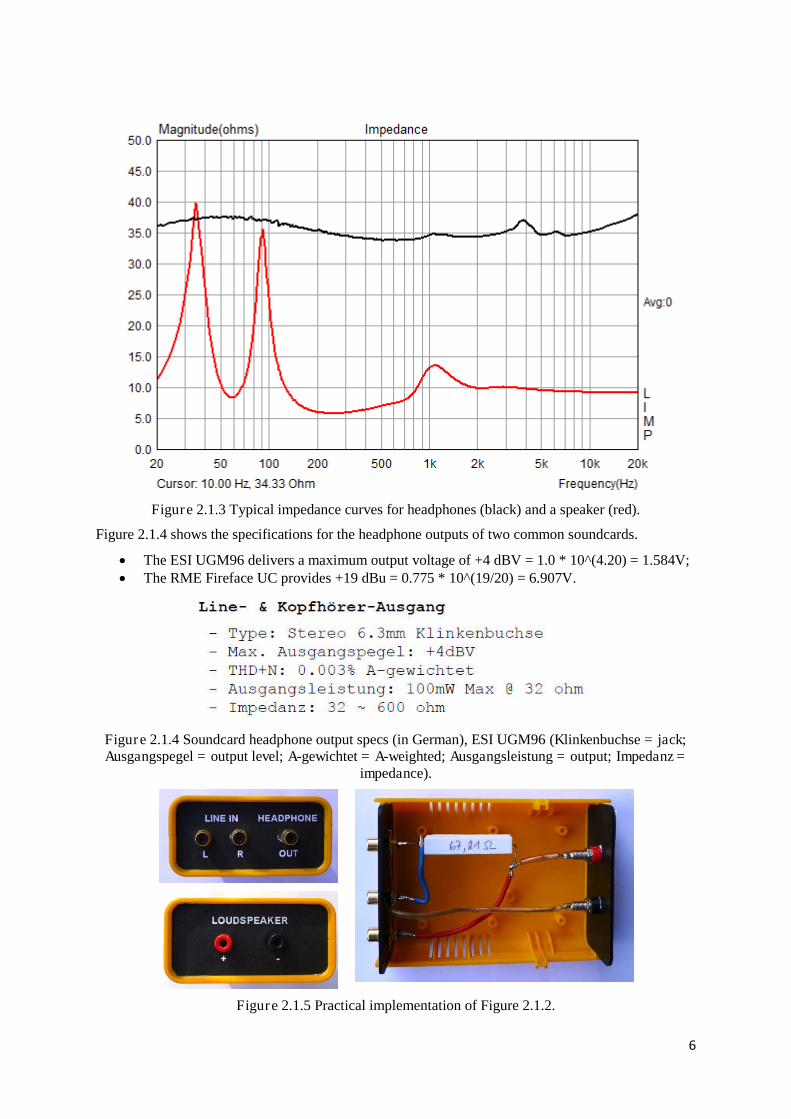
The high value of the reference resistor is dictated by the fact that soundcard headphone outputs areusually not designed for connection to speakers. Figure 2.1.3 compares the impedance curves of astandard headphone and a speaker. The much reduced relative impedance of the speaker shows clearlyhow the headphone output could suddenly be asked to deliver far more power than it was everdesigned for!
6
Figure 2.1.3 Typical impedance curves for headphones (black) and a speaker (red).
Figure 2.1.4 shows the specifications for the headphone outputs of two common soundcards.
The ESI UGM96 delivers a maximum output voltage of +4 dBV = 1.0 * 10^(4.20) = 1.584V; The RME Fireface UC provides +19 dBu = 0.775 * 10^(19/20) = 6.907V.
Figure 2.1.4 Soundcard headphone output specs (in German), ESI UGM96 (Klinkenbuchse = jack;Ausgangspegel = output level; A-gewichtet = A-weighted; Ausgangsleistung = output; Impedanz =
impedance).
Figure 2.1.5 Practical implementation of Figure 2.1.2.
7
Figure 2.1.5 shows a practical implementation of the circuit illustrated in Figure 2.1.2. Such a set up isnot necessarily essential, but it does help to prevent errors that might result in damage to thesoundcard.
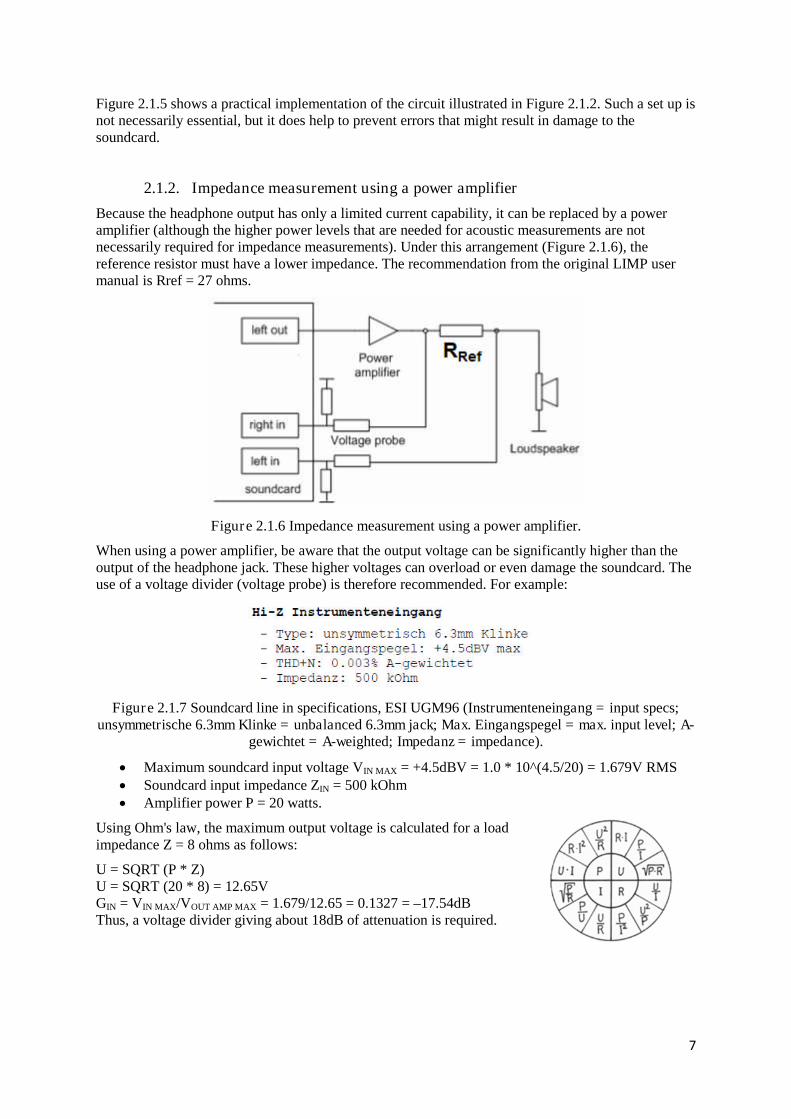
2.1.2. Impedance measurement using a power amplifier
Because the headphone output has only a limited current capability, it can be replaced by a poweramplifier (although the higher power levels that are needed for acoustic measurements are notnecessarily required for impedance measurements). Under this arrangement (Figure 2.1.6), thereference resistor must have a lower impedance. The recommendation from the original LIMP usermanual is Rref = 27 ohms.
Figure 2.1.6 Impedance measurement using a power amplifier.
When using a power amplifier, be aware that the output voltage can be significantly higher than theoutput of the headphone jack. These higher voltages can overload or even damage the soundcard. Theuse of a voltage divider (voltage probe) is therefore recommended. For example:
Figure 2.1.7 Soundcard line in specifications, ESI UGM96 (Instrumenteneingang = input specs;unsymmetrische 6.3mm Klinke = unbalanced 6.3mm jack; Max. Eingangspegel = max. input level; A-
gewichtet = A-weighted; Impedanz = impedance).
Maximum soundcard input voltage VIN MAX = +4.5dBV = 1.0 * 10^(4.5/20) = 1.679V RMS Soundcard input impedance ZIN = 500 kOhm Amplifier power P = 20 watts.
Using Ohm's law, the maximum output voltage is calculated for a loadimpedance Z = 8 ohms as follows:
U = SQRT (P * Z)U = SQRT (20 * 8) = 12.65VGIN = VIN MAX/VOUT AMP MAX = 1.679/12.65 = 0.1327 = –17.54dBThus, a voltage divider giving about 18dB of attenuation is required.
8
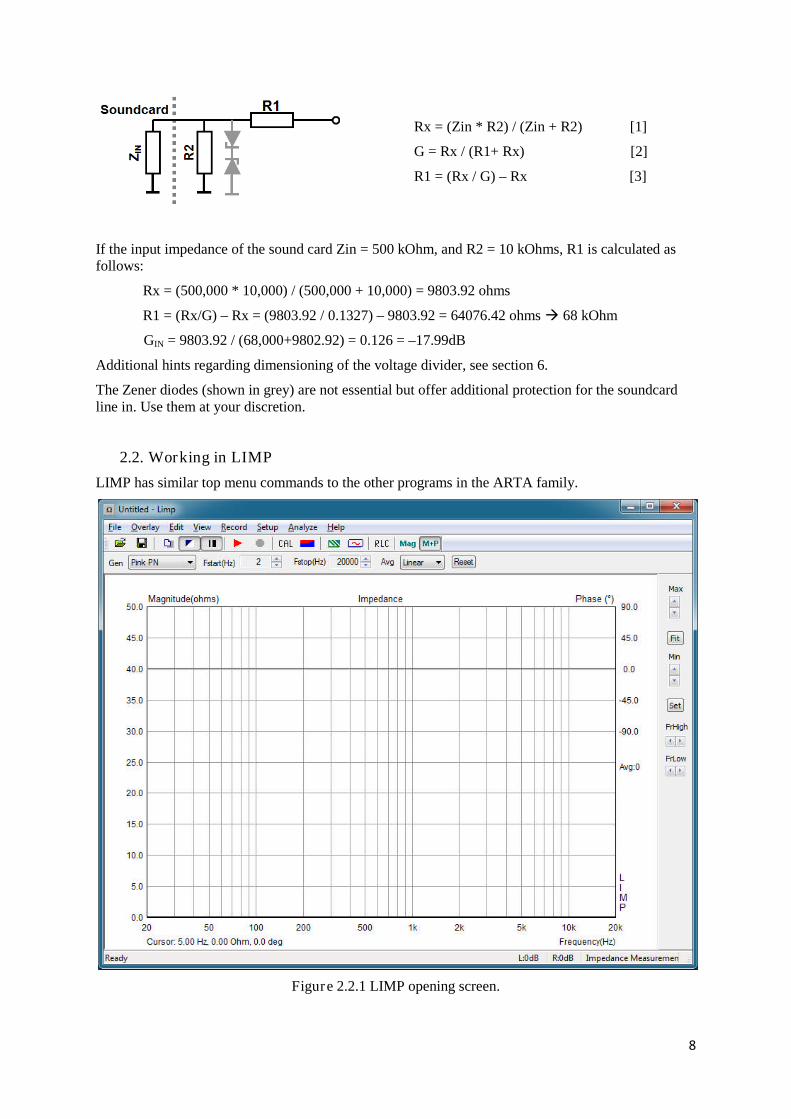
Rx = (Zin * R2) / (Zin + R2) [1]
G = Rx / (R1+ Rx) [2]
R1 = (Rx / G) – Rx [3]
If the input impedance of the sound card Zin = 500 kOhm, and R2 = 10 kOhms, R1 is calculated asfollows:
Rx = (500,000 * 10,000) / (500,000 + 10,000) = 9803.92 ohms
R1 = (Rx/G) – Rx = (9803.92 / 0.1327) – 9803.92 = 64076.42 ohms 68 kOhm
GIN = 9803.92 / (68,000+9802.92) = 0.126 = –17.99dB
Additional hints regarding dimensioning of the voltage divider, see section 6.
The Zener diodes (shown in grey) are not essential but offer additional protection for the soundcardline in. Use them at your discretion.
2.2. Working in LIMP
LIMP has similar top menu commands to the other programs in the ARTA family.
Figure 2.2.1 LIMP opening screen.
9
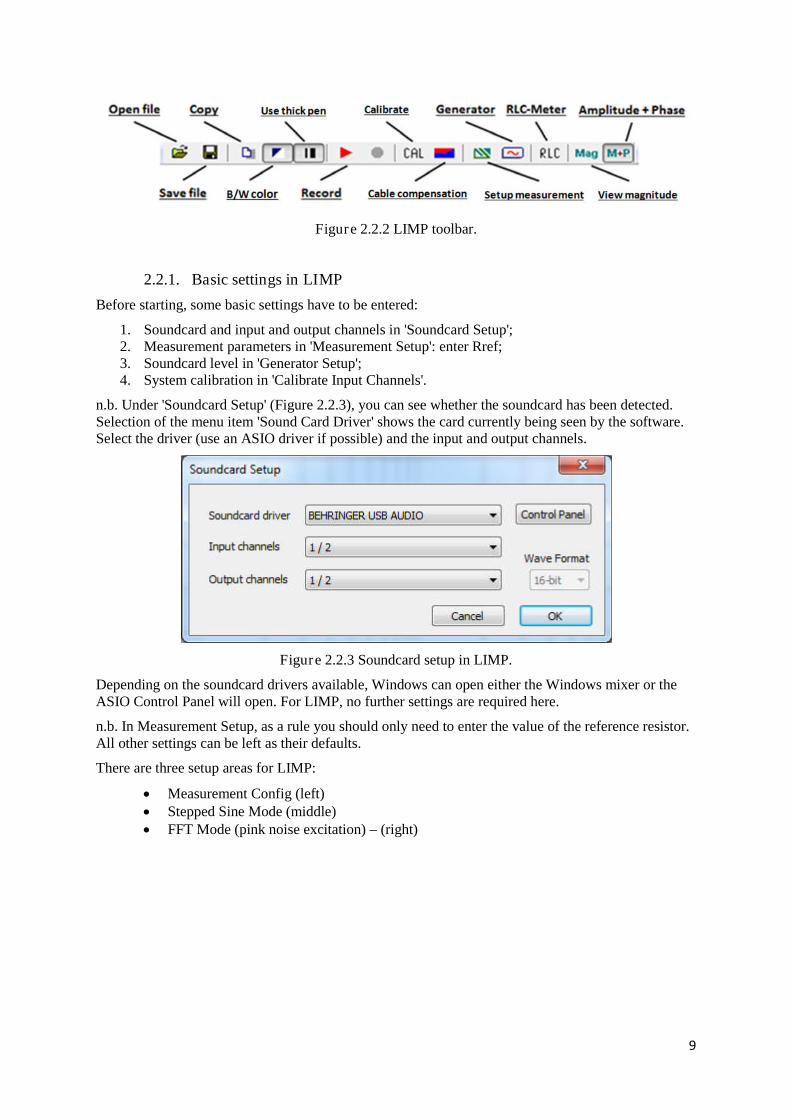
Figure 2.2.2 LIMP toolbar.
2.2.1. Basic settings in LIMP
Before starting, some basic settings have to be entered:
1. Soundcard and input and output channels in 'Soundcard Setup';2. Measurement parameters in 'Measurement Setup': enter Rref;3. Soundcard level in 'Generator Setup';4. System calibration in 'Calibrate Input Channels'.
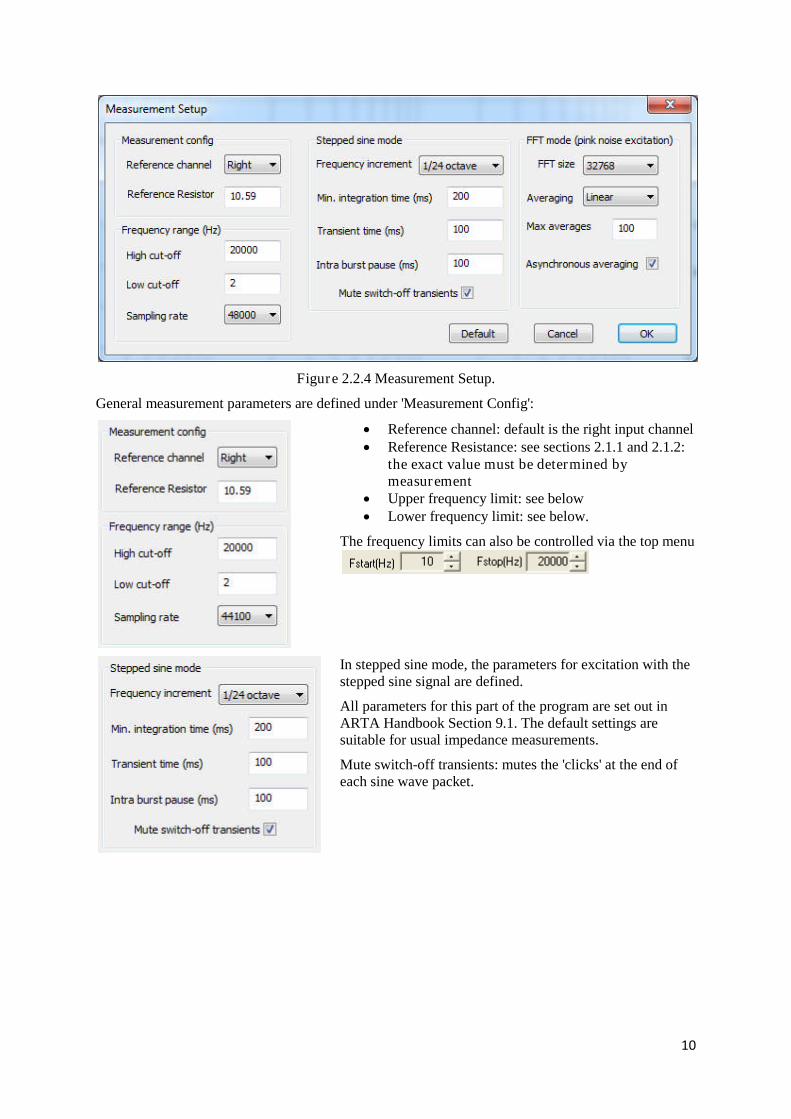
n.b. Under 'Soundcard Setup' (Figure 2.2.3), you can see whether the soundcard has been detected.Selection of the menu item 'Sound Card Driver' shows the card currently being seen by the software.Select the driver (use an ASIO driver if possible) and the input and output channels.
Figure 2.2.3 Soundcard setup in LIMP.
Depending on the soundcard drivers available, Windows can open either the Windows mixer or theASIO Control Panel will open. For LIMP, no further settings are required here.
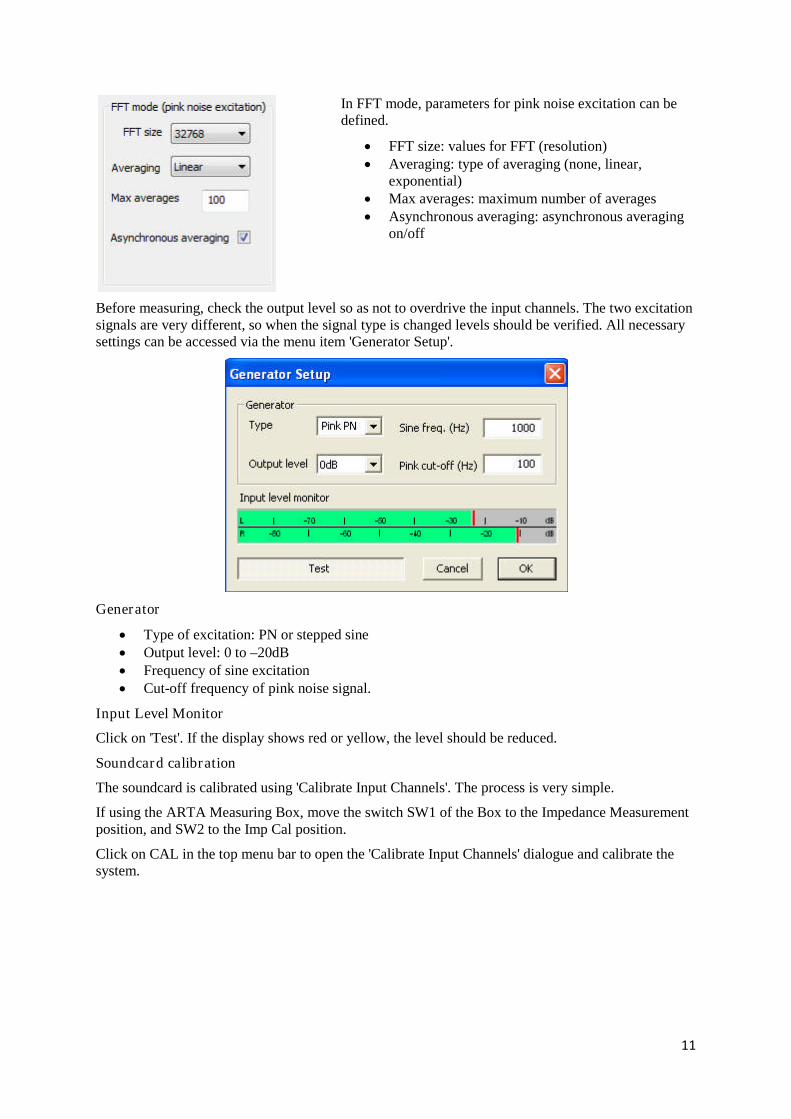
n.b. In Measurement Setup, as a rule you should only need to enter the value of the reference resistor.All other settings can be left as their defaults.
There are three setup areas for LIMP:
Measurement Config (left) Stepped Sine Mode (middle) FFT Mode (pink noise excitation) – (right)
10
Figure 2.2.4 Measurement Setup.
General measurement parameters are defined under 'Measurement Config':
Reference channel: default is the right input channel Reference Resistance: see sections 2.1.1 and 2.1.2:
the exact value must be determined bymeasurement
Upper frequency limit: see below Lower frequency limit: see below.
The frequency limits can also be controlled via the top menu
In stepped sine mode, the parameters for excitation with thestepped sine signal are defined.
All parameters for this part of the program are set out inARTA Handbook Section 9.1. The default settings aresuitable for usual impedance measurements.
Mute switch-off transients: mutes the 'clicks' at the end ofeach sine wave packet.
11
In FFT mode, parameters for pink noise excitation can bedefined.
FFT size: values for FFT (resolution) Averaging: type of averaging (none, linear,
exponential) Max averages: maximum number of averages Asynchronous averaging: asynchronous averaging
on/off
Before measuring, check the output level so as not to overdrive the input channels. The two excitationsignals are very different, so when the signal type is changed levels should be verified. All necessarysettings can be accessed via the menu item 'Generator Setup'.
Generator
Type of excitation: PN or stepped sine Output level: 0 to –20dB Frequency of sine excitation Cut-off frequency of pink noise signal.
Input Level Monitor
Click on 'Test'. If the display shows red or yellow, the level should be reduced.
Soundcard calibration
The soundcard is calibrated using 'Calibrate Input Channels'. The process is very simple.
If using the ARTA Measuring Box, move the switch SW1 of the Box to the Impedance Measurementposition, and SW2 to the Imp Cal position.
Click on CAL in the top menu bar to open the 'Calibrate Input Channels' dialogue and calibrate thesystem.
12
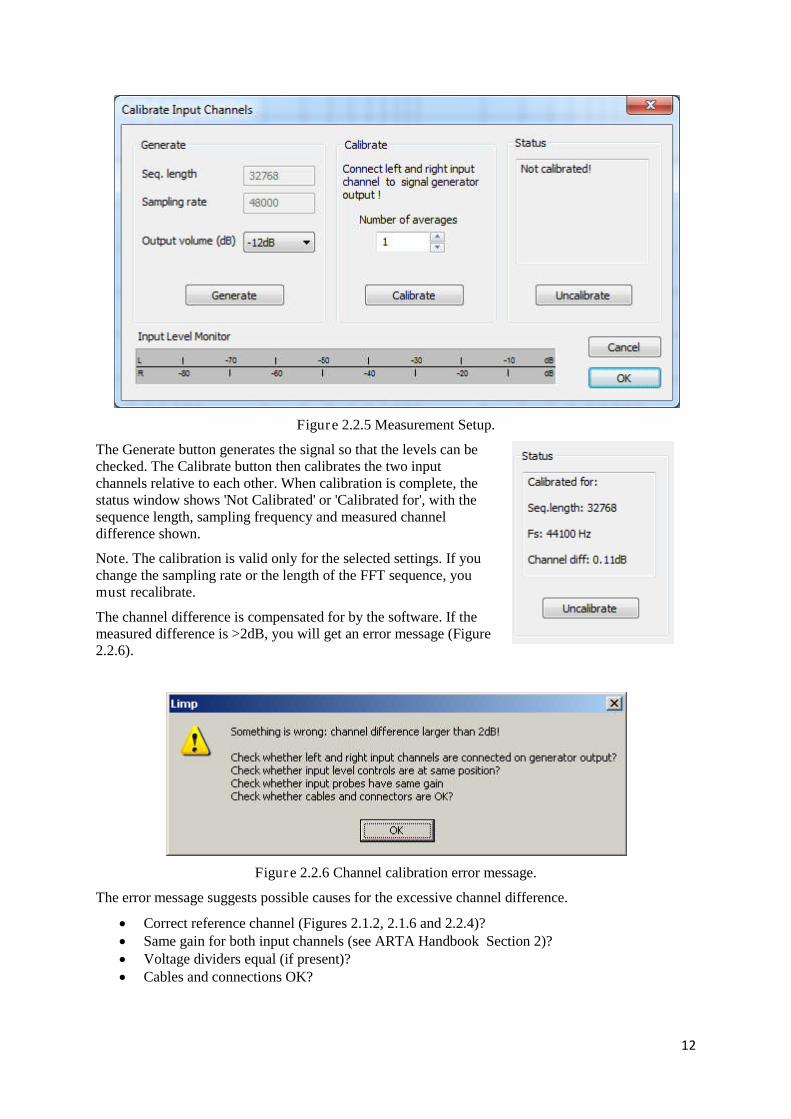
Figure 2.2.5 Measurement Setup.
The Generate button generates the signal so that the levels can bechecked. The Calibrate button then calibrates the two inputchannels relative to each other. When calibration is complete, thestatus window shows 'Not Calibrated' or 'Calibrated for', with thesequence length, sampling frequency and measured channeldifference shown.
Note. The calibration is valid only for the selected settings. If youchange the sampling rate or the length of the FFT sequence, youmust recalibrate.
The channel difference is compensated for by the software. If themeasured difference is >2dB, you will get an error message (Figure2.2.6).
Figure 2.2.6 Channel calibration error message.
The error message suggests possible causes for the excessive channel difference.
Correct reference channel (Figures 2.1.2, 2.1.6 and 2.2.4)? Same gain for both input channels (see ARTA Handbook Section 2)? Voltage dividers equal (if present)? Cables and connections OK?
13
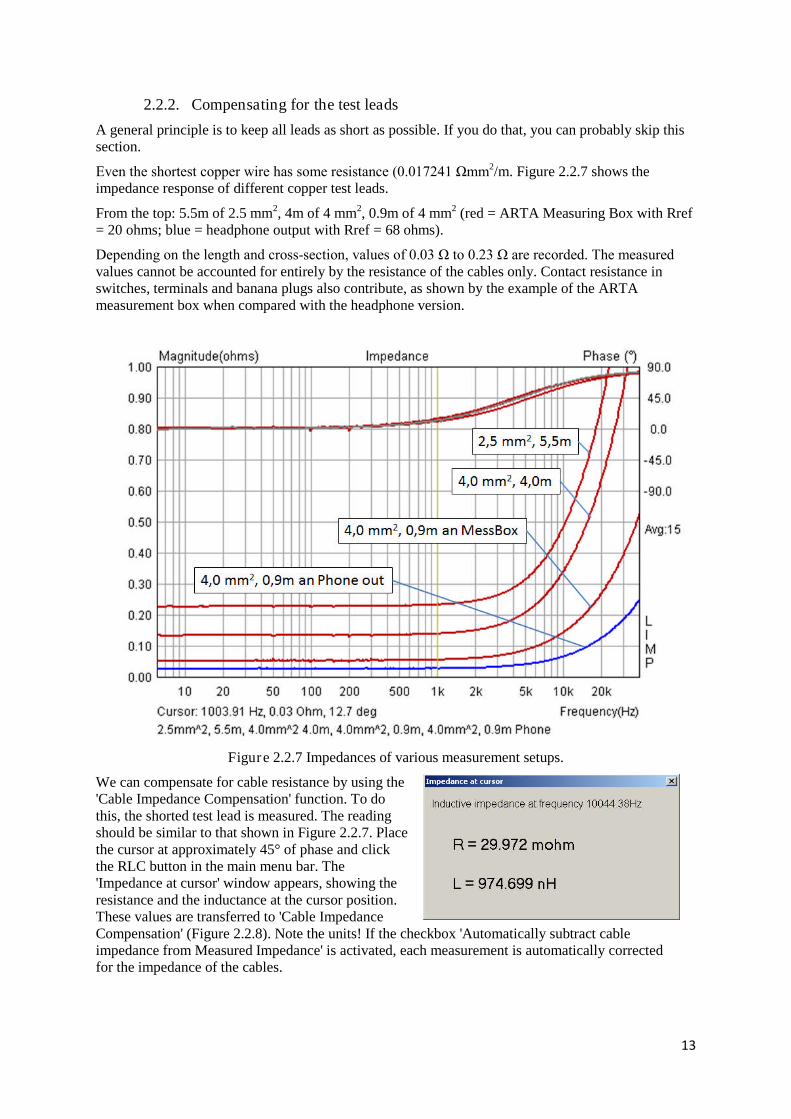
2.2.2. Compensating for the test leads
A general principle is to keep all leads as short as possible. If you do that, you can probably skip thissection.
Even the shortest copper wire has some resistance (0.017241 Ωmm2/m. Figure 2.2.7 shows theimpedance response of different copper test leads.
From the top: 5.5m of 2.5 mm2, 4m of 4 mm2, 0.9m of 4 mm2 (red = ARTA Measuring Box with Rref= 20 ohms; blue = headphone output with Rref = 68 ohms).
Depending on the length and cross-section, values of 0.03 Ω to 0.23 Ω are recorded. The measured values cannot be accounted for entirely by the resistance of the cables only. Contact resistance inswitches, terminals and banana plugs also contribute, as shown by the example of the ARTAmeasurement box when compared with the headphone version.
Figure 2.2.7 Impedances of various measurement setups.
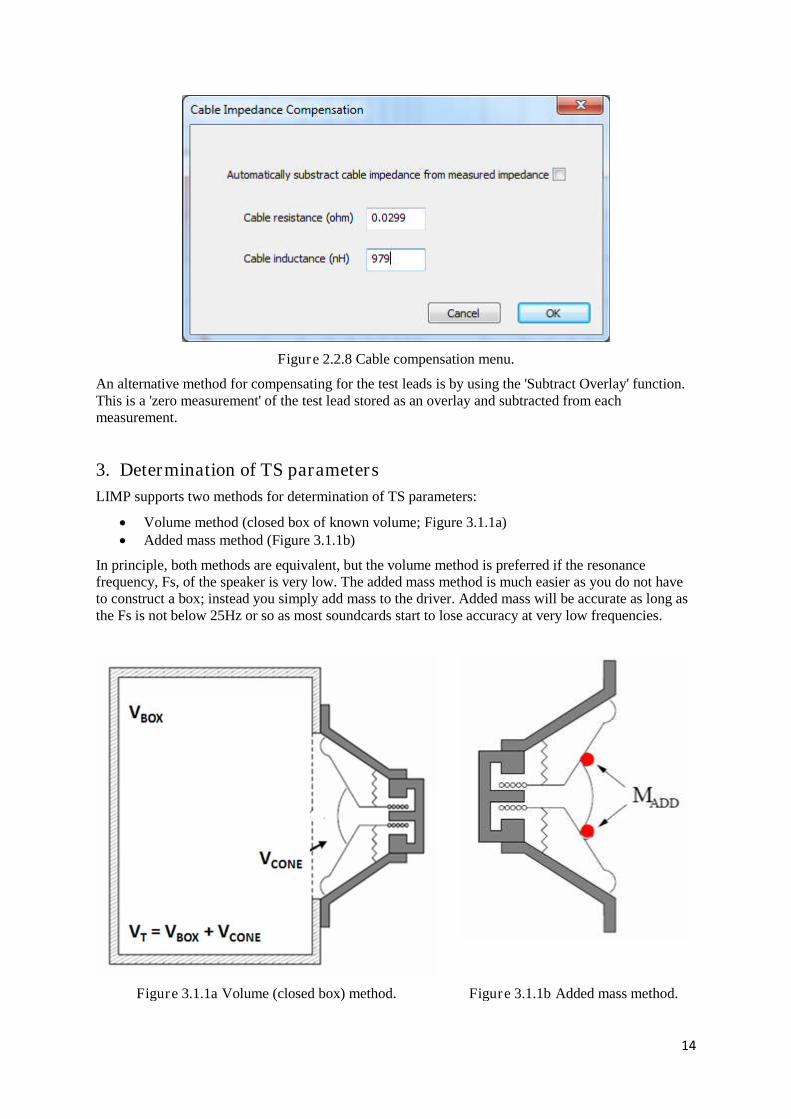
We can compensate for cable resistance by using the'Cable Impedance Compensation' function. To dothis, the shorted test lead is measured. The readingshould be similar to that shown in Figure 2.2.7. Placethe cursor at approximately 45° of phase and clickthe RLC button in the main menu bar. The'Impedance at cursor' window appears, showing theresistance and the inductance at the cursor position.These values are transferred to 'Cable ImpedanceCompensation' (Figure 2.2.8). Note the units! If the checkbox 'Automatically subtract cableimpedance from Measured Impedance' is activated, each measurement is automatically correctedfor the impedance of the cables.
14
Figure 2.2.8 Cable compensation menu.
An alternative method for compensating for the test leads is by using the 'Subtract Overlay' function.This is a 'zero measurement' of the test lead stored as an overlay and subtracted from eachmeasurement.
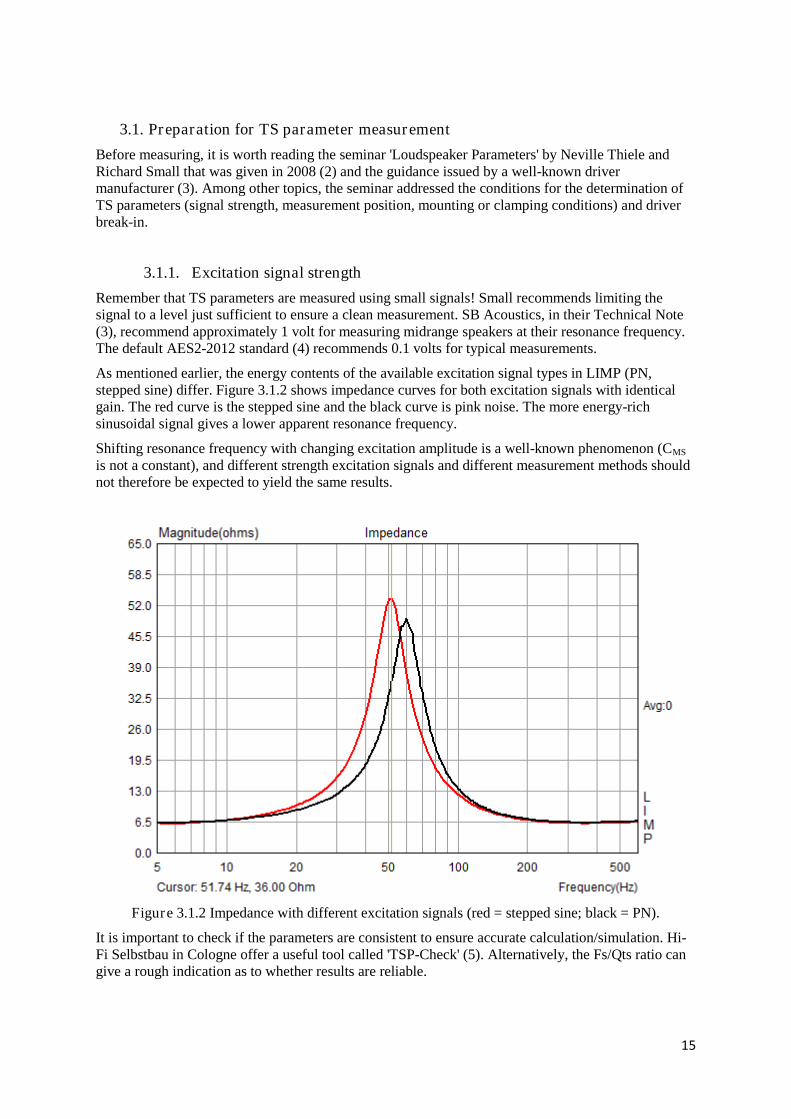
3. Determination of TS parameters
LIMP supports two methods for determination of TS parameters:
Volume method (closed box of known volume; Figure 3.1.1a) Added mass method (Figure 3.1.1b)
In principle, both methods are equivalent, but the volume method is preferred if the resonancefrequency, Fs, of the speaker is very low. The added mass method is much easier as you do not haveto construct a box; instead you simply add mass to the driver. Added mass will be accurate as long asthe Fs is not below 25Hz or so as most soundcards start to lose accuracy at very low frequencies.
Figure 3.1.1a Volume (closed box) method. Figure 3.1.1b Added mass method.
15
3.1. Preparation for TS parameter measurement
Before measuring, it is worth reading the seminar 'Loudspeaker Parameters' by Neville Thiele andRichard Small that was given in 2008 (2) and the guidance issued by a well-known drivermanufacturer (3). Among other topics, the seminar addressed the conditions for the determination ofTS parameters (signal strength, measurement position, mounting or clamping conditions) and driverbreak-in.
3.1.1. Excitation signal strength
Remember that TS parameters are measured using small signals! Small recommends limiting thesignal to a level just sufficient to ensure a clean measurement. SB Acoustics, in their Technical Note(3), recommend approximately 1 volt for measuring midrange speakers at their resonance frequency.The default AES2-2012 standard (4) recommends 0.1 volts for typical measurements.
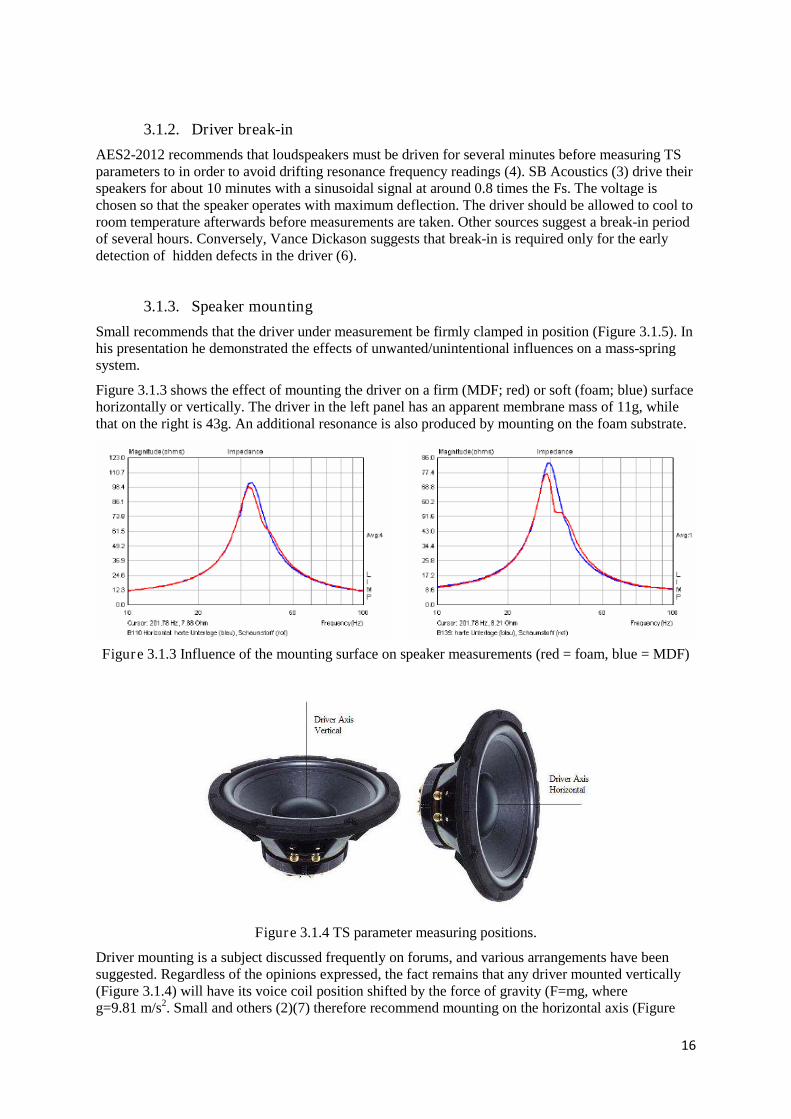
As mentioned earlier, the energy contents of the available excitation signal types in LIMP (PN,stepped sine) differ. Figure 3.1.2 shows impedance curves for both excitation signals with identicalgain. The red curve is the stepped sine and the black curve is pink noise. The more energy-richsinusoidal signal gives a lower apparent resonance frequency.
Shifting resonance frequency with changing excitation amplitude is a well-known phenomenon (CMS
is not a constant), and different strength excitation signals and different measurement methods shouldnot therefore be expected to yield the same results.
Figure 3.1.2 Impedance with different excitation signals (red = stepped sine; black = PN).
It is important to check if the parameters are consistent to ensure accurate calculation/simulation. Hi-Fi Selbstbau in Cologne offer a useful tool called 'TSP-Check' (5). Alternatively, the Fs/Qts ratio cangive a rough indication as to whether results are reliable.
16
3.1.2. Driver break-in
AES2-2012 recommends that loudspeakers must be driven for several minutes before measuring TSparameters to in order to avoid drifting resonance frequency readings (4). SB Acoustics (3) drive theirspeakers for about 10 minutes with a sinusoidal signal at around 0.8 times the Fs. The voltage ischosen so that the speaker operates with maximum deflection. The driver should be allowed to cool toroom temperature afterwards before measurements are taken. Other sources suggest a break-in periodof several hours. Conversely, Vance Dickason suggests that break-in is required only for the earlydetection of hidden defects in the driver (6).
3.1.3. Speaker mounting
Small recommends that the driver under measurement be firmly clamped in position (Figure 3.1.5). Inhis presentation he demonstrated the effects of unwanted/unintentional influences on a mass-springsystem.
Figure 3.1.3 shows the effect of mounting the driver on a firm (MDF; red) or soft (foam; blue) surfacehorizontally or vertically. The driver in the left panel has an apparent membrane mass of 11g, whilethat on the right is 43g. An additional resonance is also produced by mounting on the foam substrate.
Figure 3.1.3 Influence of the mounting surface on speaker measurements (red = foam, blue = MDF)
Figure 3.1.4 TS parameter measuring positions.
Driver mounting is a subject discussed frequently on forums, and various arrangements have beensuggested. Regardless of the opinions expressed, the fact remains that any driver mounted vertically(Figure 3.1.4) will have its voice coil position shifted by the force of gravity (F=mg, whereg=9.81 m/s2. Small and others (2)(7) therefore recommend mounting on the horizontal axis (Figure
17
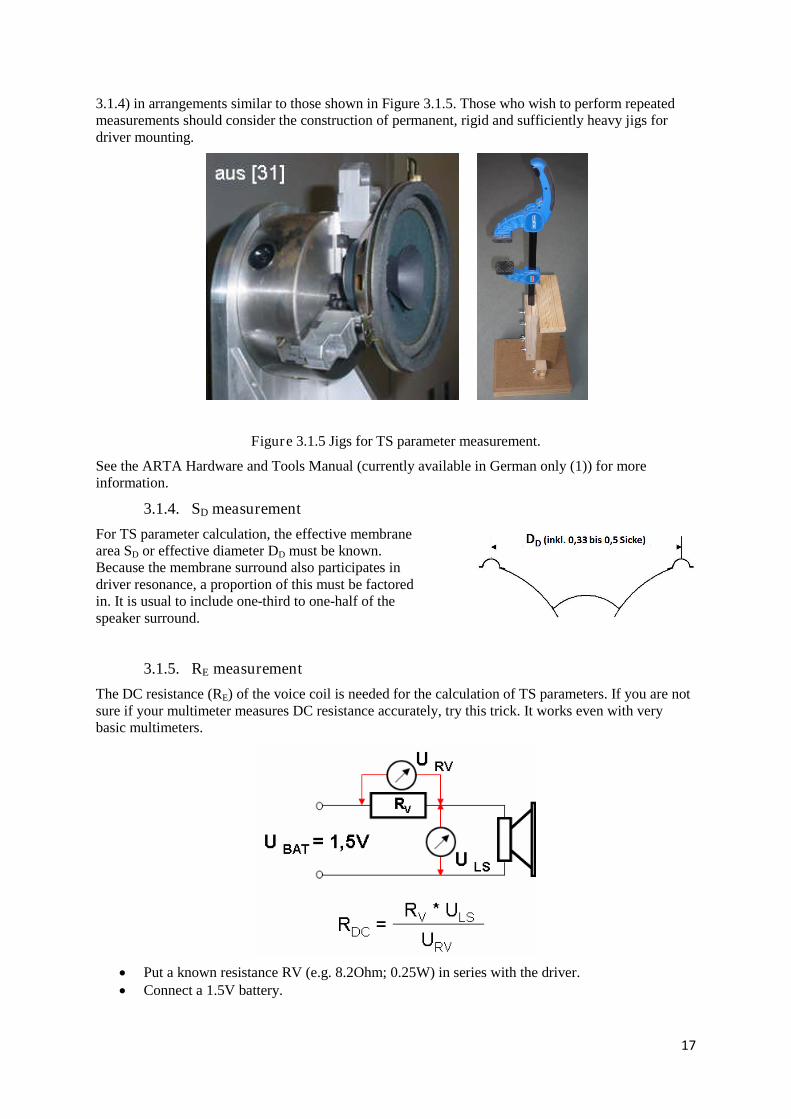
3.1.4) in arrangements similar to those shown in Figure 3.1.5. Those who wish to perform repeatedmeasurements should consider the construction of permanent, rigid and sufficiently heavy jigs fordriver mounting.
Figure 3.1.5 Jigs for TS parameter measurement.
See the ARTA Hardware and Tools Manual (currently available in German only (1)) for moreinformation.
3.1.4. SD measurement
For TS parameter calculation, the effective membranearea SD or effective diameter DD must be known.Because the membrane surround also participates indriver resonance, a proportion of this must be factoredin. It is usual to include one-third to one-half of thespeaker surround.
3.1.5. RE measurement
The DC resistance (RE) of the voice coil is needed for the calculation of TS parameters. If you are notsure if your multimeter measures DC resistance accurately, try this trick. It works even with verybasic multimeters.
Put a known resistance RV (e.g. 8.2Ohm; 0.25W) in series with the driver. Connect a 1.5V battery.
18
Use the multimeter to measure the voltage across the resistor RV (URV) and the voltage ULS
across the driver. Calculate the DC resistance of the voice coil RDC as shown in the formula above.
Example:
4 Ohm woofer.
Known: RV = 4.7 Ohm Measured: URV = 0.8368V, ULS = 0.5591V Calculated: RDC = 4.7 * 0,5591/0.8368 = 3.14 Ohm (manufacturer's specification = 3.10
Ohm).
n.b. As of version 1.8, LIMP provides an option for the determination of RE from the impedancecurve (see section 3.2).
3.2. Speaker models for TS parameter determination
As of version 1.8, LIMP provides in addition to the classicmethod depicted to the right (8)(9)(10) additionalfunctionality for the determination of TS parameters.Detailed information can be found in Mateljan & Sokora (9).The following is a brief summary.
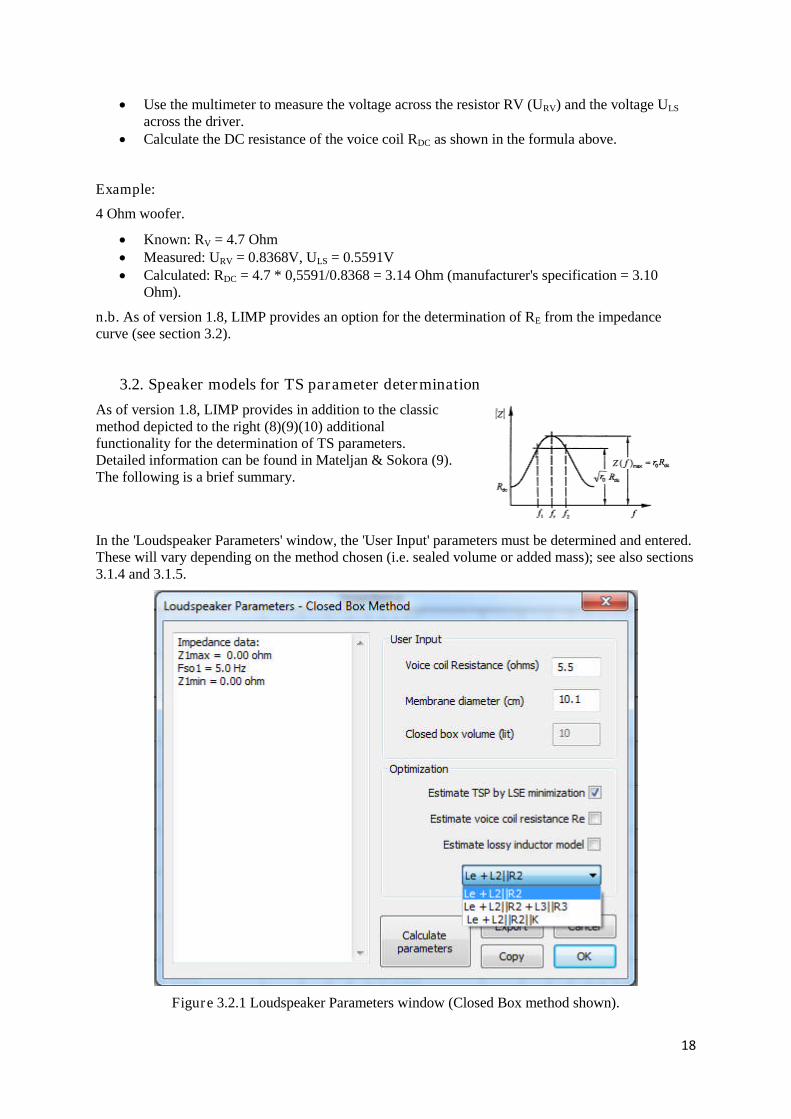
In the 'Loudspeaker Parameters' window, the 'User Input' parameters must be determined and entered.These will vary depending on the method chosen (i.e. sealed volume or added mass); see also sections3.1.4 and 3.1.5.
Figure 3.2.1 Loudspeaker Parameters window (Closed Box method shown).
19
The 'Optimization' area contains three check boxes and a drop-down menu. Use the check boxes toselect the type of optimization required:
Estimate TSP by LSE minimization Estimate Voice Coil Resistance Re Estimate lossy inductor model
If none of the boxes are checked, the classic method for determining TS parameters is applied (seeLIMP User Manual (1), section 5.2.2).
If 'TSP by LSE minimization' is checked, the nonlinear least square error minimization procedure isactivated, whereby we minimize the squared difference between the measured impedance ZM andmodelled impedance ZLF. The quality of the optimization can be graphically controlled by using theF3 function key (see Figures 3.2.3a and 3.2.3b).
If 'Voice Coil Resistance Re' is checked, LIMP determines the DC resistance of the voice coil fromthe measured impedance curve. This is especially useful if no ohmmeter / multimeter is available.Please note that if this box is checked any value entered for Re will be ignored by the software.
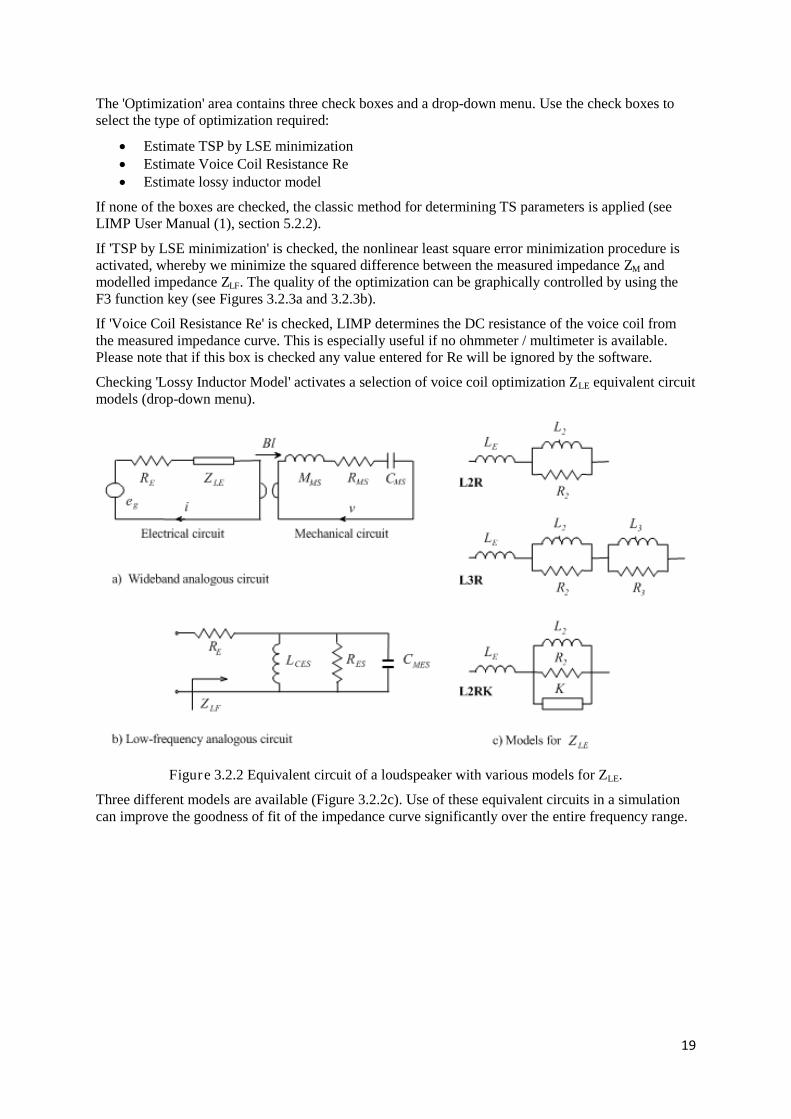
Checking 'Lossy Inductor Model' activates a selection of voice coil optimization ZLE equivalent circuitmodels (drop-down menu).
Figure 3.2.2 Equivalent circuit of a loudspeaker with various models for ZLE.
Three different models are available (Figure 3.2.2c). Use of these equivalent circuits in a simulationcan improve the goodness of fit of the impedance curve significantly over the entire frequency range.
20
Loudspeaker ParametersFs = 96.94 HzRe = 6.60 ohms[dc]Qt = 0.51Qes = 0.56Qms = 5.37Mms = 2.25 gramsRms = 0.255123 kg/sCms = 0.001197 m/NVas = 1.72 litersSd= 31.97 cm^2Bl = 4.011855 TmETA = 0.27 %Lp(2.83V/1m) = 87.22 dBfs/Qt = 190,08
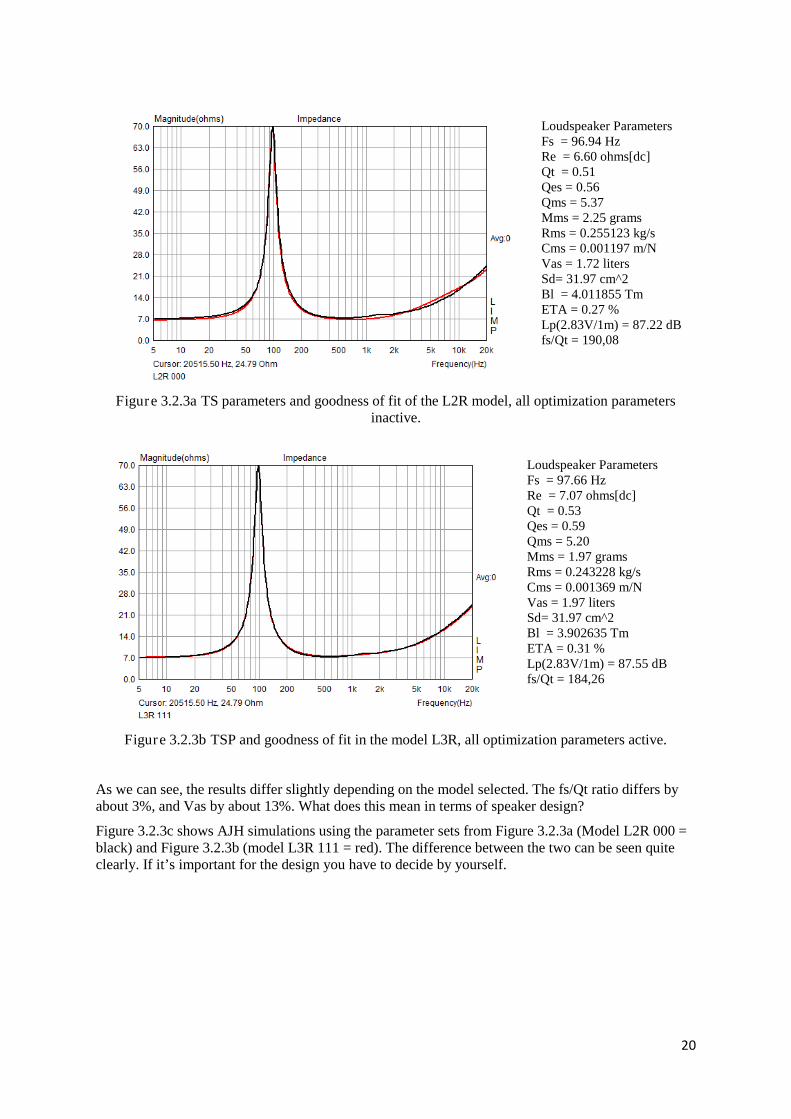
Figure 3.2.3a TS parameters and goodness of fit of the L2R model, all optimization parametersinactive.
Loudspeaker ParametersFs = 97.66 HzRe = 7.07 ohms[dc]Qt = 0.53Qes = 0.59Qms = 5.20Mms = 1.97 gramsRms = 0.243228 kg/sCms = 0.001369 m/NVas = 1.97 litersSd= 31.97 cm^2Bl = 3.902635 TmETA = 0.31 %Lp(2.83V/1m) = 87.55 dBfs/Qt = 184,26
Figure 3.2.3b TSP and goodness of fit in the model L3R, all optimization parameters active.
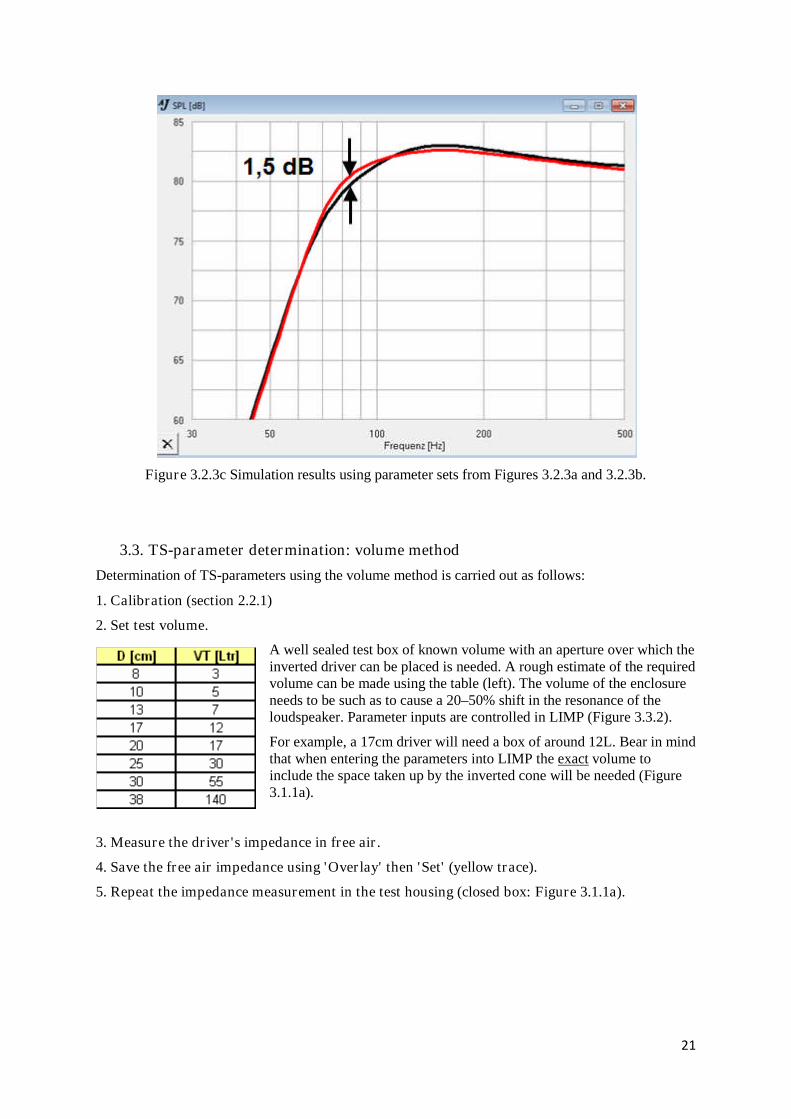
As we can see, the results differ slightly depending on the model selected. The fs/Qt ratio differs byabout 3%, and Vas by about 13%. What does this mean in terms of speaker design?
Figure 3.2.3c shows AJH simulations using the parameter sets from Figure 3.2.3a (Model L2R 000 =black) and Figure 3.2.3b (model L3R 111 = red). The difference between the two can be seen quiteclearly. If it’s important for the design you have to decide by yourself.
21
Figure 3.2.3c Simulation results using parameter sets from Figures 3.2.3a and 3.2.3b.
3.3. TS-parameter determination: volume method
Determination of TS-parameters using the volume method is carried out as follows:
1. Calibration (section 2.2.1)
2. Set test volume.
A well sealed test box of known volume with an aperture over which theinverted driver can be placed is needed. A rough estimate of the requiredvolume can be made using the table (left). The volume of the enclosureneeds to be such as to cause a 20–50% shift in the resonance of theloudspeaker. Parameter inputs are controlled in LIMP (Figure 3.3.2).
For example, a 17cm driver will need a box of around 12L. Bear in mindthat when entering the parameters into LIMP the exact volume toinclude the space taken up by the inverted cone will be needed (Figure3.1.1a).
3. Measure the driver's impedance in free air.
4. Save the free air impedance using 'Overlay' then 'Set' (yellow trace).
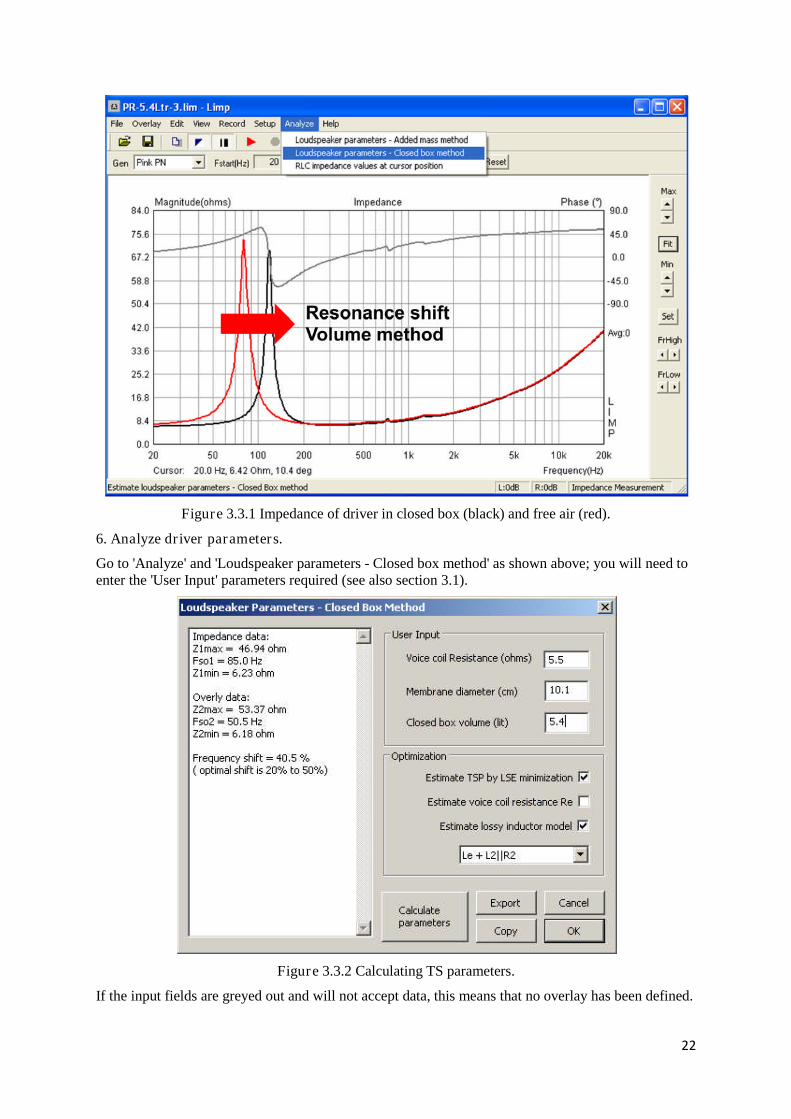
5. Repeat the impedance measurement in the test housing (closed box: Figure 3.1.1a).
22
Figure 3.3.1 Impedance of driver in closed box (black) and free air (red).
6. Analyze driver parameters.
Go to 'Analyze' and 'Loudspeaker parameters - Closed box method' as shown above; you will need toenter the 'User Input' parameters required (see also section 3.1).
Figure 3.3.2 Calculating TS parameters.
If the input fields are greyed out and will not accept data, this means that no overlay has been defined.
23
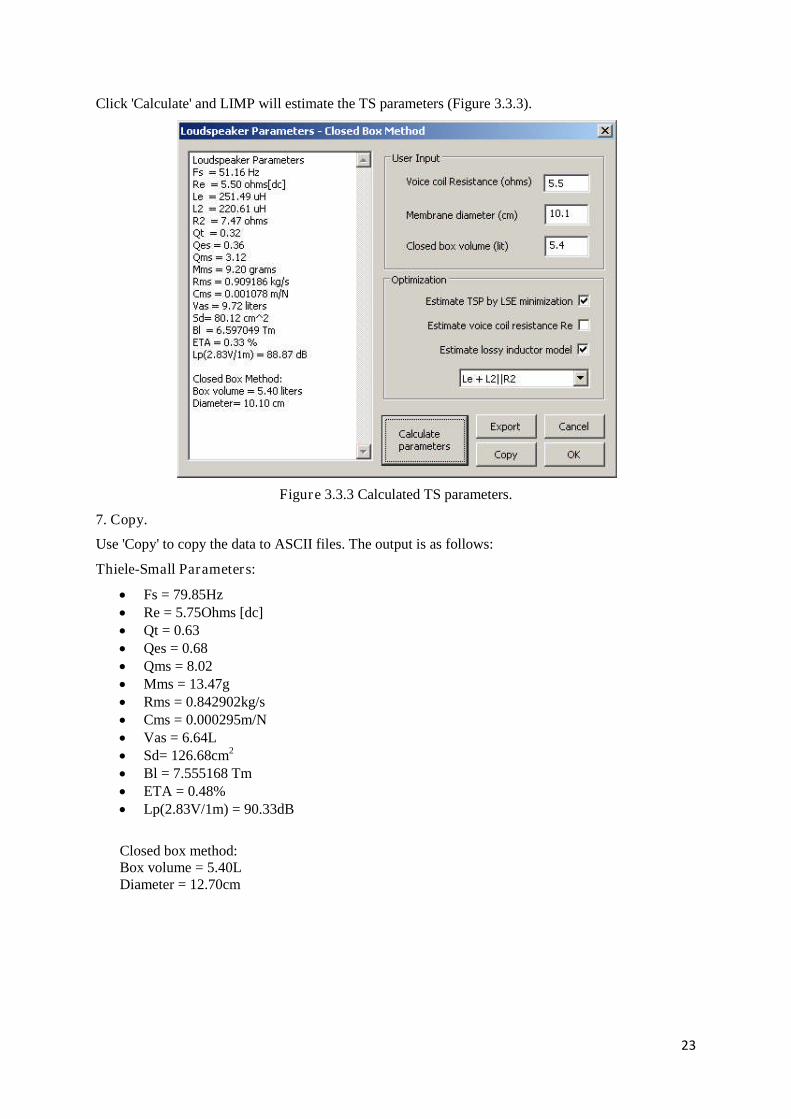
Click 'Calculate' and LIMP will estimate the TS parameters (Figure 3.3.3).
Figure 3.3.3 Calculated TS parameters.
7. Copy.
Use 'Copy' to copy the data to ASCII files. The output is as follows:
Thiele-Small Parameters:
Fs = 79.85Hz Re = 5.75Ohms [dc] Qt = 0.63 Qes = 0.68 Qms = 8.02 Mms = 13.47g Rms = 0.842902kg/s Cms = 0.000295m/N Vas = 6.64L Sd= 126.68cm2
Bl = 7.555168 Tm ETA = 0.48% Lp(2.83V/1m) = 90.33dB
Closed box method:Box volume = 5.40LDiameter = 12.70cm
24
3.4. TS-parameter determination: added mass method
1. Calibrate.
2. Specify test mass.
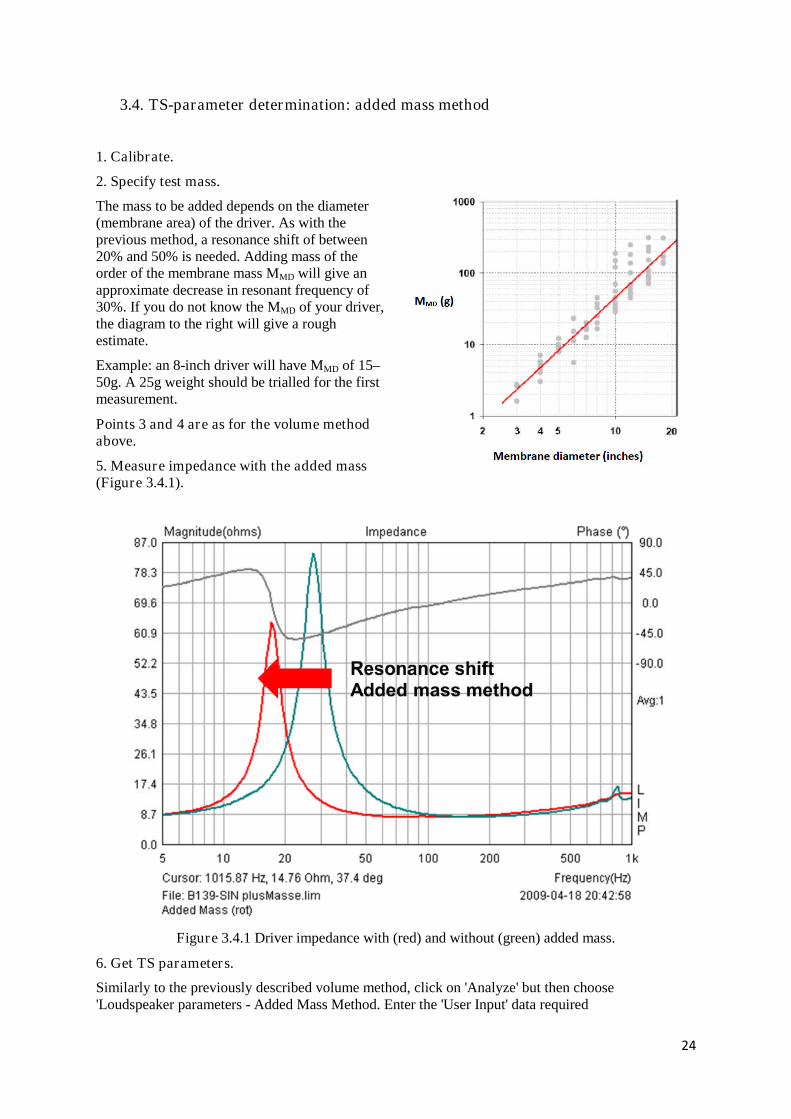
The mass to be added depends on the diameter(membrane area) of the driver. As with theprevious method, a resonance shift of between20% and 50% is needed. Adding mass of theorder of the membrane mass MMD will give anapproximate decrease in resonant frequency of30%. If you do not know the MMD of your driver,the diagram to the right will give a roughestimate.
Example: an 8-inch driver will have MMD of 15–50g. A 25g weight should be trialled for the firstmeasurement.
Points 3 and 4 are as for the volume methodabove.
5. Measure impedance with the added mass(Figure 3.4.1).
Figure 3.4.1 Driver impedance with (red) and without (green) added mass.
6. Get TS parameters.
Similarly to the previously described volume method, click on 'Analyze' but then choose'Loudspeaker parameters - Added Mass Method. Enter the 'User Input' data required
25
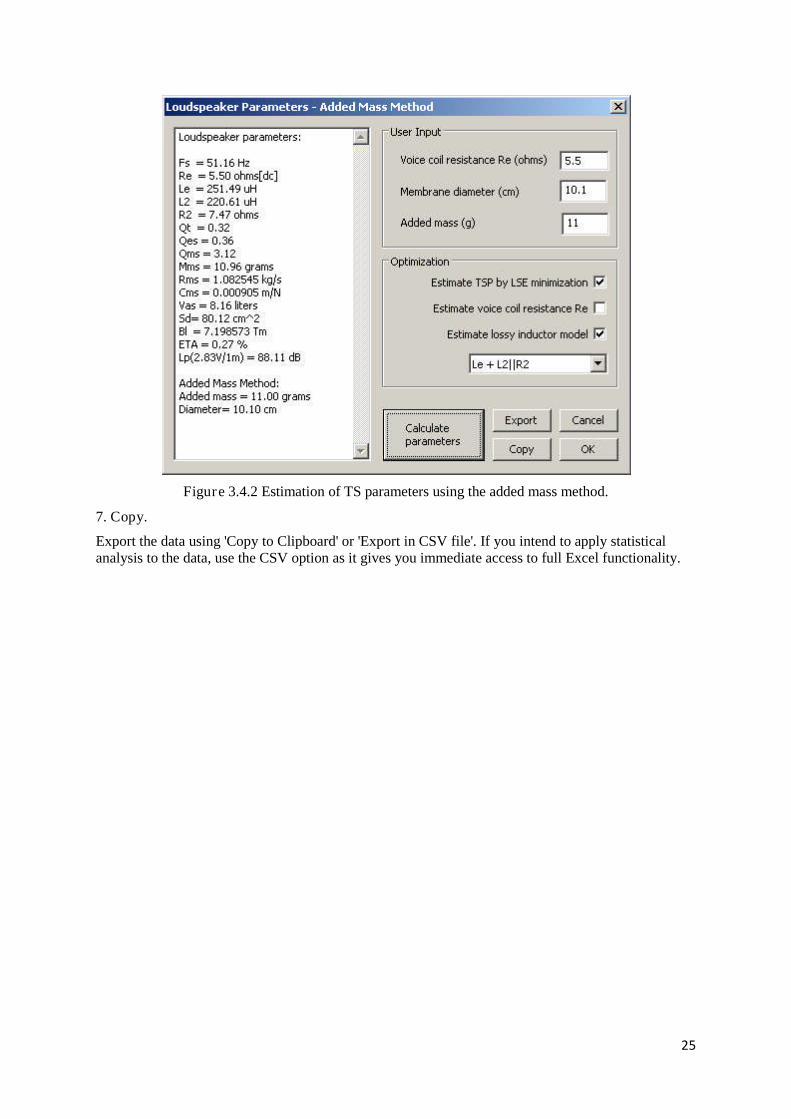
Figure 3.4.2 Estimation of TS parameters using the added mass method.
7. Copy.
Export the data using 'Copy to Clipboard' or 'Export in CSV file'. If you intend to apply statisticalanalysis to the data, use the CSV option as it gives you immediate access to full Excel functionality.
26
4. Working with overlays and targets in LIMP
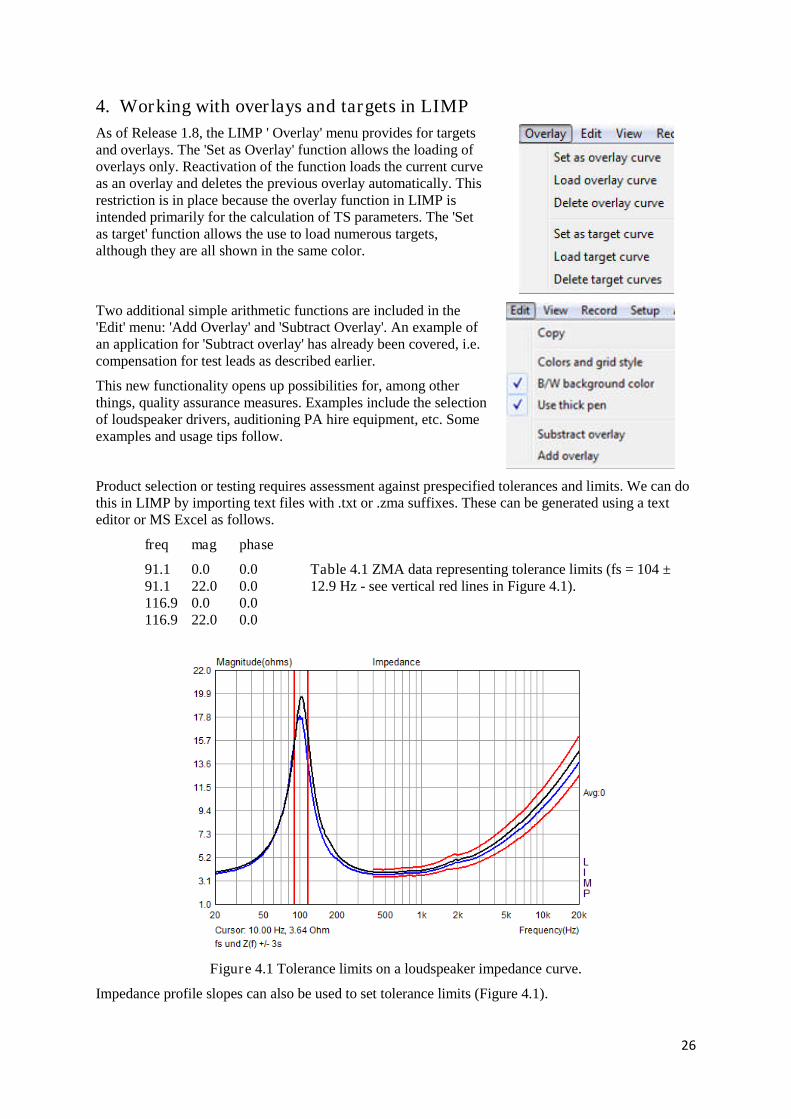
As of Release 1.8, the LIMP ' Overlay' menu provides for targetsand overlays. The 'Set as Overlay' function allows the loading ofoverlays only. Reactivation of the function loads the current curveas an overlay and deletes the previous overlay automatically. Thisrestriction is in place because the overlay function in LIMP isintended primarily for the calculation of TS parameters. The 'Setas target' function allows the use to load numerous targets,although they are all shown in the same color.
Two additional simple arithmetic functions are included in the'Edit' menu: 'Add Overlay' and 'Subtract Overlay'. An example ofan application for 'Subtract overlay' has already been covered, i.e.compensation for test leads as described earlier.
This new functionality opens up possibilities for, among otherthings, quality assurance measures. Examples include the selectionof loudspeaker drivers, auditioning PA hire equipment, etc. Someexamples and usage tips follow.
Product selection or testing requires assessment against prespecified tolerances and limits. We can dothis in LIMP by importing text files with .txt or .zma suffixes. These can be generated using a texteditor or MS Excel as follows.
freq mag phase
91.1 0.0 0.091.1 22.0 0.0116.9 0.0 0.0116.9 22.0 0.0
Table 4.1 ZMA data representing tolerance limits (fs = 104 ±12.9 Hz - see vertical red lines in Figure 4.1).
Figure 4.1 Tolerance limits on a loudspeaker impedance curve.
Impedance profile slopes can also be used to set tolerance limits (Figure 4.1).

27
Figure 4.2 shows the measurement of the resonance frequencies of 32 small woofers. From a previousbatch, the resonance frequency fs was believed to be 104 ± 12.9 Hz. Using 'Load target curve', thetolerance values from Table 4.1 were imported as a ZMA file.
Figure 4.2 Loudspeaker selection, tolerance limits Fs ± 3s.
28
5. Using LIMP as an RLC meter
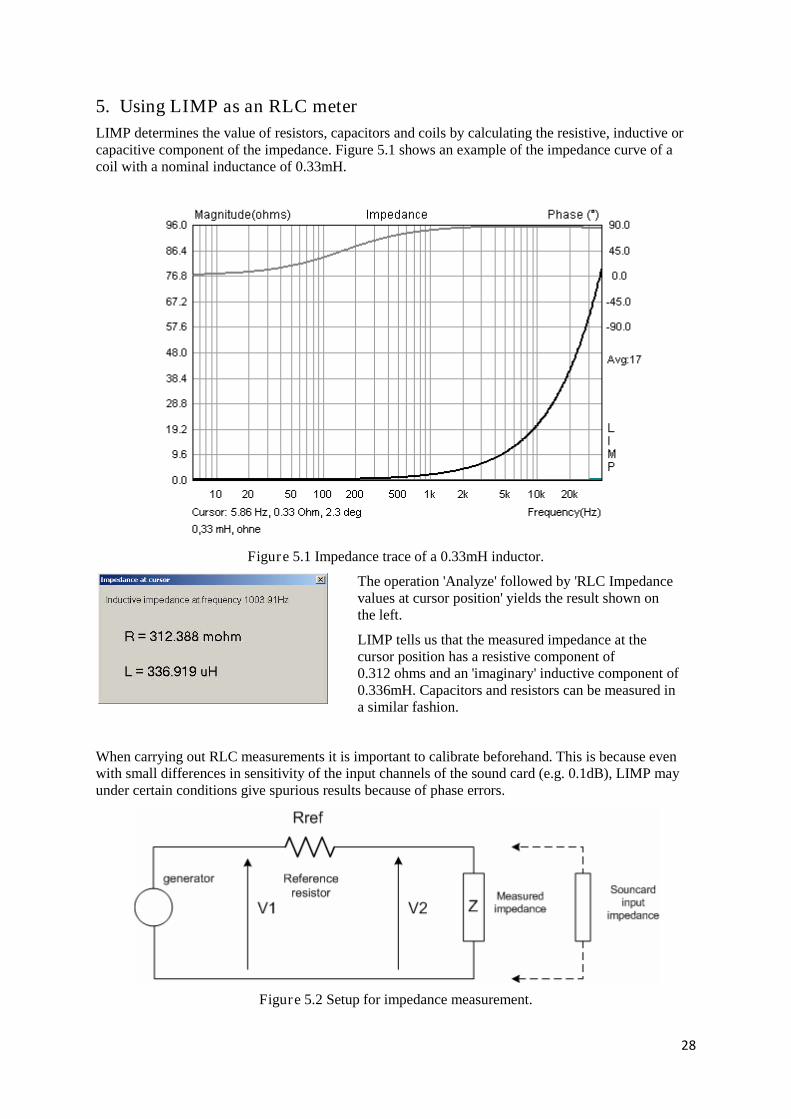
LIMP determines the value of resistors, capacitors and coils by calculating the resistive, inductive orcapacitive component of the impedance. Figure 5.1 shows an example of the impedance curve of acoil with a nominal inductance of 0.33mH.
Figure 5.1 Impedance trace of a 0.33mH inductor.
The operation 'Analyze' followed by 'RLC Impedancevalues at cursor position' yields the result shown onthe left.
LIMP tells us that the measured impedance at thecursor position has a resistive component of0.312 ohms and an 'imaginary' inductive component of0.336mH. Capacitors and resistors can be measured ina similar fashion.
When carrying out RLC measurements it is important to calibrate beforehand. This is because evenwith small differences in sensitivity of the input channels of the sound card (e.g. 0.1dB), LIMP mayunder certain conditions give spurious results because of phase errors.
Figure 5.2 Setup for impedance measurement.
29
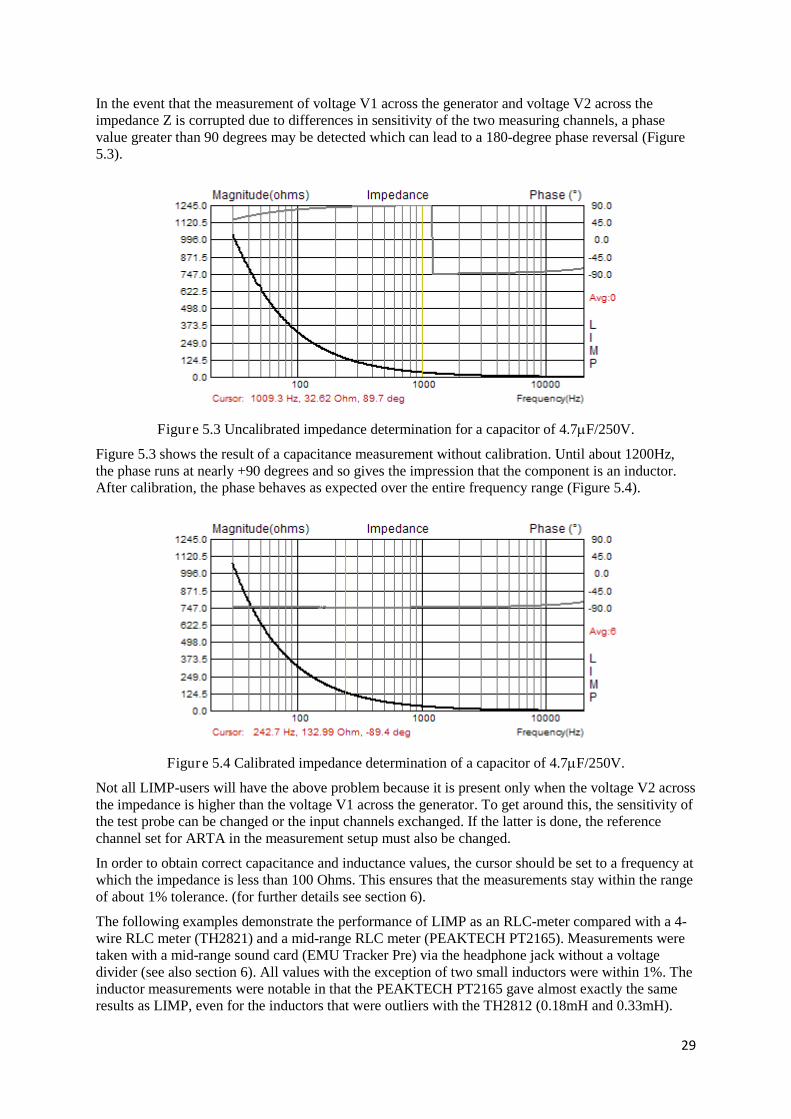
In the event that the measurement of voltage V1 across the generator and voltage V2 across theimpedance Z is corrupted due to differences in sensitivity of the two measuring channels, a phasevalue greater than 90 degrees may be detected which can lead to a 180-degree phase reversal (Figure5.3).
Figure 5.3 Uncalibrated impedance determination for a capacitor of 4.7F/250V.
Figure 5.3 shows the result of a capacitance measurement without calibration. Until about 1200Hz,the phase runs at nearly +90 degrees and so gives the impression that the component is an inductor.After calibration, the phase behaves as expected over the entire frequency range (Figure 5.4).
Figure 5.4 Calibrated impedance determination of a capacitor of 4.7F/250V.
Not all LIMP-users will have the above problem because it is present only when the voltage V2 acrossthe impedance is higher than the voltage V1 across the generator. To get around this, the sensitivity ofthe test probe can be changed or the input channels exchanged. If the latter is done, the referencechannel set for ARTA in the measurement setup must also be changed.
In order to obtain correct capacitance and inductance values, the cursor should be set to a frequency atwhich the impedance is less than 100 Ohms. This ensures that the measurements stay within the rangeof about 1% tolerance. (for further details see section 6).
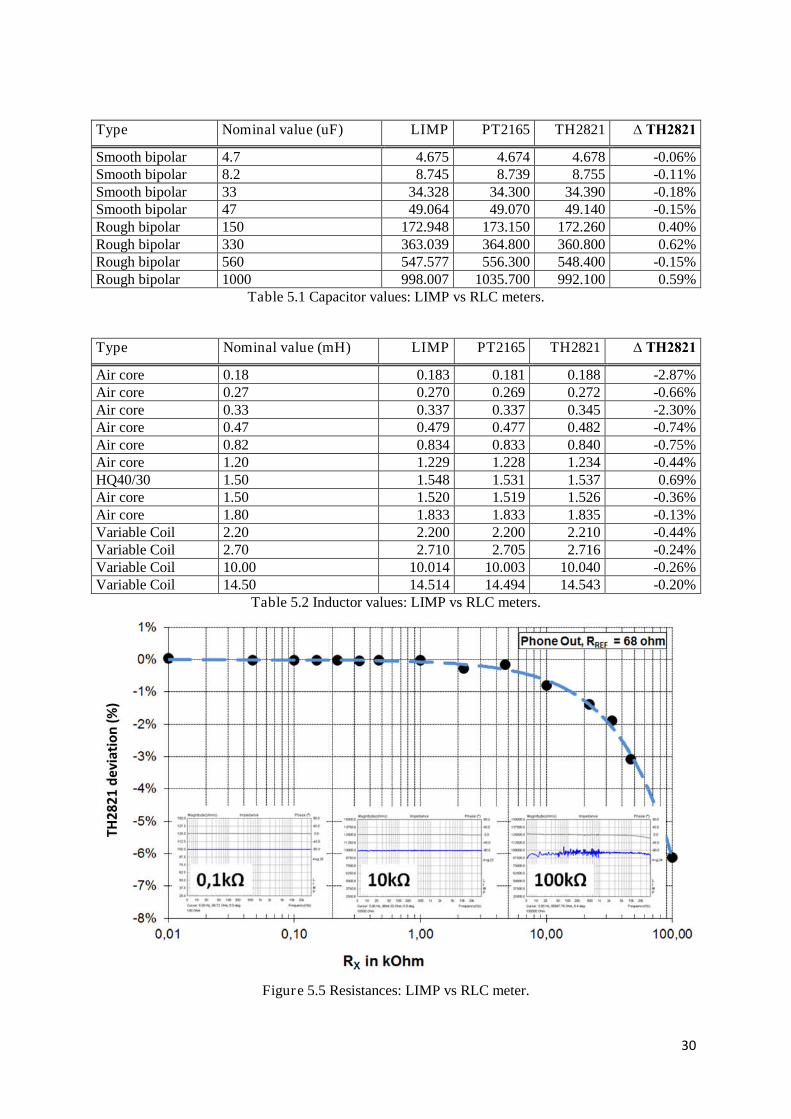
The following examples demonstrate the performance of LIMP as an RLC-meter compared with a 4-wire RLC meter (TH2821) and a mid-range RLC meter (PEAKTECH PT2165). Measurements weretaken with a mid-range sound card (EMU Tracker Pre) via the headphone jack without a voltagedivider (see also section 6). All values with the exception of two small inductors were within 1%. Theinductor measurements were notable in that the PEAKTECH PT2165 gave almost exactly the sameresults as LIMP, even for the inductors that were outliers with the TH2812 (0.18mH and 0.33mH).
30
Type Nominal value (uF) LIMP PT2165 TH2821 ∆ TH2821
Smooth bipolar 4.7 4.675 4.674 4.678 -0.06%Smooth bipolar 8.2 8.745 8.739 8.755 -0.11%Smooth bipolar 33 34.328 34.300 34.390 -0.18%Smooth bipolar 47 49.064 49.070 49.140 -0.15%Rough bipolar 150 172.948 173.150 172.260 0.40%Rough bipolar 330 363.039 364.800 360.800 0.62%Rough bipolar 560 547.577 556.300 548.400 -0.15%Rough bipolar 1000 998.007 1035.700 992.100 0.59%
Table 5.1 Capacitor values: LIMP vs RLC meters.
Type Nominal value (mH) LIMP PT2165 TH2821 ∆ TH2821
Air core 0.18 0.183 0.181 0.188 -2.87%Air core 0.27 0.270 0.269 0.272 -0.66%Air core 0.33 0.337 0.337 0.345 -2.30%Air core 0.47 0.479 0.477 0.482 -0.74%Air core 0.82 0.834 0.833 0.840 -0.75%Air core 1.20 1.229 1.228 1.234 -0.44%HQ40/30 1.50 1.548 1.531 1.537 0.69%Air core 1.50 1.520 1.519 1.526 -0.36%Air core 1.80 1.833 1.833 1.835 -0.13%Variable Coil 2.20 2.200 2.200 2.210 -0.44%Variable Coil 2.70 2.710 2.705 2.716 -0.24%Variable Coil 10.00 10.014 10.003 10.040 -0.26%Variable Coil 14.50 14.514 14.494 14.543 -0.20%
Table 5.2 Inductor values: LIMP vs RLC meters.
Figure 5.5 Resistances: LIMP vs RLC meter.

31
6. Accuracy of impedance measurements
The performance limits of LIMP as an RLC meter is determined by the input impedance of thesoundcard and the measurement setup. Measurements will be optimized if the soundcard has a highinput impedance and will work without an upstream voltage divider, because the parallel resistance ofthe voltage divider in this situation produces interference. The limits of the setup are shown by noisymeasurements (e.g. Figure 5.5, right panel, 100 kOhm).
For this reason the ARTA Measurement Box (see ARTA Application Note 1) represents acompromise between accuracy and ease of use. If the resistor values in the application note are used,errors of measurement up to about 100 ohms should be less than 1%.
Note: If the soundcard has an input impedance > 500 ohms, then the resistor values of the voltagedivider (R1 / R2 and R3 / R4) in the Measurement Box can be increased by a factor of 10.Measurement errors up to 1000 ohms should then be less than 1%.
If the test setup is correct, impedance measurements with LIMP should be subject to errors of lessthan 1%. If this is not so, one of the following is usually responsible:
1. The sensitivities of the soundcard input channels are different;2. The input impedance of the soundcard is too low (10–20 kOhm);3. The cables between the power amplifier and speaker are too long.
These problems can be addressed as follows:
1. Calibration of the sound card (see section 2.2.1).2. Use of a soundcard with high input impedance (check specification, professional soundcards
have input impedances of 1MOhm) or an upstream input buffer.3. Inductive or capacitive effects can be contributed by excessively long measurement cables.
This also applies to terminal or connector resistance.a. Use short measurement cables with sufficient cross-section (≥1.5mm2). b. If longer measurement cables must be used, place the reference resistor as close to the
speaker terminal as possible.c. Ensure secure connections. Use good quality connectors and terminals (see note).
Note: test leads as shown on the right are often a source of error inmeasurements on loudspeakers. Because the cables are often justclamped at the crocodile clips they introduce “variable contactresistance”. This does not help with reproducibility of measurements. Ifleads of this type are used, connections should be resoldered andchecked.

32
7. References
1. ARTA Support [Internet]. [cited 2014 Sep 21]. Available from:http://www.artalabs.hr/support.htm
2. Thiele N, Small R. Loudspeaker parameters [Internet]. AES 124th Convention. 2008 [cited 2014Sep 20]. Available from: http://www.aes.org/tutorials/
3. SB Acoustics: Technical Notes [Internet]. Measuring Thiele/Small Parameters. [cited 2014 Sep20]. Available from: http://www.sbacoustics.com/index.php/technical-notes/
4. AES2-2012 standard for acoustics – Methods of measuring and specifying the performance ofloudspeakers for professional applications – Drive units. AES; 2012.
5. TSP checken einfach gemacht [Internet]. Available from: https://hifi-selbstbau.de/grundlagen-mainmenu-35/verschiedenes-mainmenu-70/199-tsp-checken-einfach-gemacht
6. Vance Dickason. The Loudspeaker Design Cookbook. 7th ed. Peterborough, NH: Amateur AudioPress; 2006.
7. Anderson BE. Derivation of moving-coil loudspeaker parameters using plane wave tubetechniques [Master of Science]. Brigham Young University; 2003.
8. D’Appolito JA. Testing loudspeakers. Peterborough, N.H.: Audio Amateur Press : Distribution agents, Old Colony Sound Lab; 1998.
9. Mateljan I, Sikora M. Estimation of loudspeaker driver parameters. Croatia: Acoustical Society ofCroatia; 2012.
10. IEC 60268-5: Sound system equipment – Part 5: Loudspeakers. Geneva, Switzerland:International Electrotechnical Commission; 2003.


![Passive modelling of the electrodynamic …...electrodynamic loudspeaker is that of Thiele–Small [9–12]. In the sequel, we refer to this set of parameters as the Thiele–Small](https://img.pdfslide.net/doc/110x75/5ed94ef7f59b0f56f45f3f20/passive-modelling-of-the-electrodynamic-electrodynamic-loudspeaker-is-that-of.jpg)