Embed Size (px)
Citation preview
Abstract—On the track of achieving the best fuel cell
technology for the future, electrochemical impedance spectroscopy (EIS) is known to be the best tool so far in the field of diagnostic and understanding the behaviour of fuel cell. EIS is defined by the concept of measuring complex impedance and has a proper procedure to execute the diagnosis; it is a very strong tool to be carried out for PEM fuel cell because it give a lot of information about it. EIS measurement is developed and been carried out using a lot of software and programs. The modelling of EIS after having the complex measurement results from the diagnosis is a customary thing to do. This paper presents a novel method of EIS modelling using Matlab/Simulink. The concept of how EIS modelling works inside Matlab/Simulink and how the model is validated by experiments done before is explained inside the paper.
Index Terms—PEM fuel cell, complex impedance, electrochemical impedance spectroscopy, modelling.
I. INTRODUCTION The Electrochemical Impedance Spectroscopy (EIS)
Matlab model is a new way to draw the impedance spectrum of the single fuel cell (FC) or fuel cell stacks [1]. The aim of this EIS Matlab model is to perform the EIS method by modelling the equivalent electrical circuit corresponding to the particular fuel cell and get the impedance spectrum for further analysis of the systems [2].
Basic understanding of the EIS method is applied inside this work. It is where we measure the impedance of the fuel cell and plot the real part of the impedance against its imaginary part. Among other methods of analyzing fuel cells, EIS brings the most advantages. From the impedance spectrum plotted, we can analyze the charge transfer resistance, mass transfer resistance, gas diffusion, effect of operating conditions like humidity, temperature, air stochiometry and load changes for the fuel cell. The importance of these analyses is to develop the most efficient fuel cell for vehicles, industries or other related fields. Therefore, the new way to carry out the impedance ometry of fuel cell which is EIS Matlab model is considered one of the tools to contribute inside the fuel cell field.
The idea of applying this EIS Matlab model is to develop on-board diagnostics (OBD) systems [3], [4]. For example inside a vehicle, OBD monitors some of the vehicles major components by scanning it and provide the user early
Manuscript received September 15, 2012; revised November 12, 2012. This work is in collaboration with the UTP, Universiti Tecknologi
Petronas, in Malaisia (e-mail: el-hassane, [email protected])
warning of the defected components. The same concept applied to a fuel cell car where the model and its behaviour according to its impedance spectrum plotted is taken as a benchmark and being compared with the working fuel cell in order to detect the un-similarity between the 2 graphs of impedance spectrum.
If the difference exceeds a predefined value, the OBD will warn the user inside the vehicle. So, the finality of this model is to be embedded among other diagnostic tools inside the OBD system for fuel cell powered vehicles or other related applications. Tests are done on a 1.2kW PEM Fuel Cell from Ballard Company (Nexa Fuel Cell).
II. PRESENTATION OF THE EIS METHOD AN THE NEXA FUEL CELL
A. The EIS Method Following the fast phase of the development of the fuel
cell, scientists and engineers found many ways to analyze and study the behaviour of the fuel cell itself. The most famous method they have been using is Electrochemical Impedance Spectroscopy (EIS) [4]. There are also other methods which have their own advantages and disadvantages. The fuel cell technology cannot be separated from these tools of analyzing in order to develop the most optimum fuel cell for this world.
The next part briefly explains how EIS and other electrochemical methods used to analyze the fuel cell behaviours [5].
The EIS method is where a small AC signal is applied to the fuel cell and the constant direct current (DC) with a changing frequency. The complex impedance measured is changing along with the frequency. The frequency sweep is usually in a wide range of frequency band. For example the bandwidth is from 1 Hz to 10 kHz. To measure the impedance, a load bank and a frequency response analyzer (FRA) connected to each other with the fuel cell is needed [5]. The FRA generates the sinusoidal signal which then being superimposed on the DC signal generated by the load bank and fed back to the FRA to measure the impedance [6], [7]. There are two modes of measuring the impedance [4], either in a potentiostatic mode or galvanostatic mode. Potentiostatic mode is where the AC potential signal is applied to the fuel cell and the current response obtained is used to calculate the impedance.
In contrast to that, galvanostatic mode is where the AC current signal is applied to the fuel cell and the voltage response obtained is used to calculate the impedance. Our next focus on understanding EIS is the data plotted after the
Impedance Spectrometer Modelling in Matlab/Simulink for Measuring the Complex Impedance of a Fuel Cell –
EIS Method
El- H. Aglzim, M. Bin Jamaluddin, D. Chrenko, and A. Rouane
255DOI: 10.7763/JOCET.2013.V1.58
Journal of Clean Energy Technologies, Vol. 1, No. 4, October 2013
measurements.
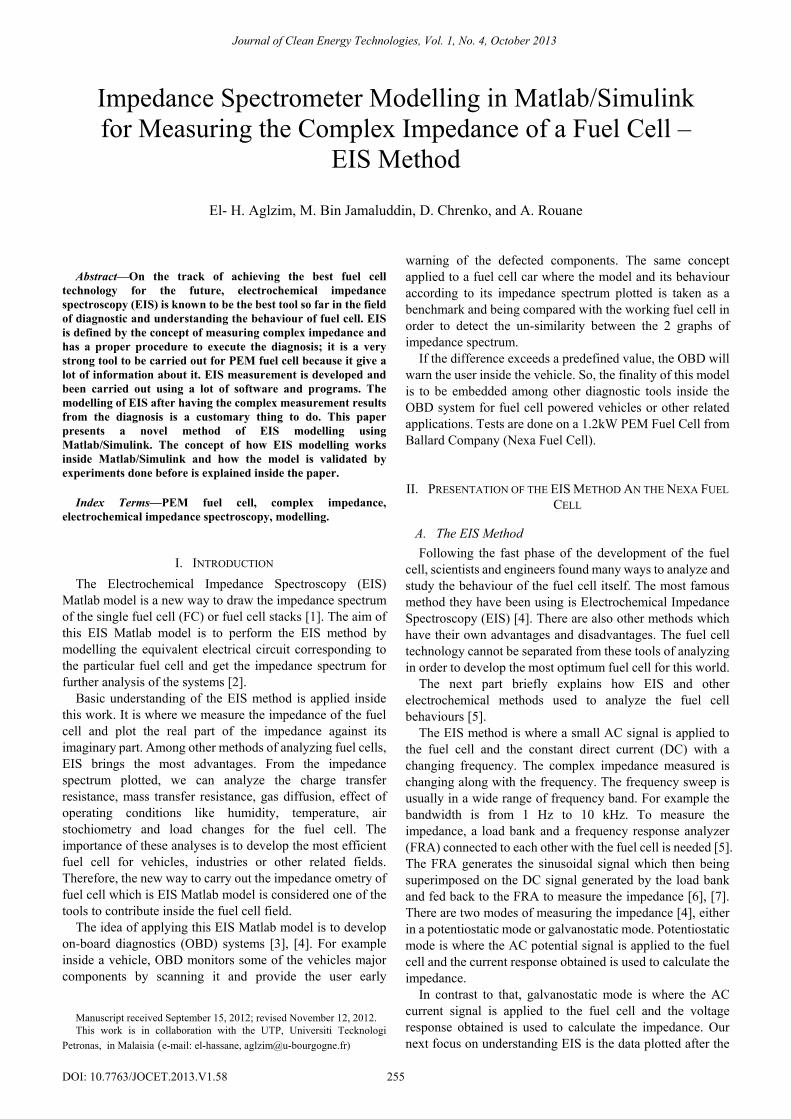
Fig. 1. Model with three RC in series with R1=150, R2=200, R3=100, C1=10µF, C2=1mF, C3=0.1F On the left side, the model with the results. On the right side, the electrical circuit from literature [8]
There are two common impedance spectra plot which are
Bode plot and Nyquist plot. Bode plot is where the amplitude and phase of the impedance obtained is plotted against frequency, while the Nyquist plot is where the imaginary part of the impedance is plotted against its real part for each frequency.
The most common plot is Nyquist because it gives a semicircle like shape which can be interpreted and modeled easily by most of the researchers nowadays. Conclusion on the fuel cell behavior can be drawn by analysis of the plotted data. Nyquist plot have its own parts where we could focus on to study the behavior of the fuel cell [8].
B. The 1.2kW Nexa Fuel Cell A Nexa PEM Fuel Cell stack (Nexa power module) from
Ballard Company, shown in figure 3, is used in this work, providing 1200 watts of unregulated DC power at a nominal output voltage of 26VDC. Its output current can reach 44A and voltage usually up to 42V. It’s composed of 47 individual cells and has a central controller, air compressor and other electrical devices which consume electric power from the fuel cell stack, making the accurate EIS measurement more difficult.
III. MODELISATION
A. Presentation of the EIS Model At the beginning of our works, we model a fuel cell
equivalent electrical circuit by referring to the particular literature about EIS topic using Matlab/Simulink (Fig. 1) [8]. It is to make sure that we will get the same impedance spectrum plotted as presented in the literature. The model consists of a combination of electrical components with the same parameters as inside the referred literature [8].
This model is built inside a Matlab/Simulink worksheet where the electrical components such as resistors, capacitors, impedance measurement block and powergui block is
obtained from the Simulink library. These components are parameterized and then connected together in parallel or in series according to the referred model inside the selected literature. As soon as the model is ready to run, the impedance value is measured by running a Powergui command block. The result is obtained in form of impedances versus frequency graph. From that graph, the complex value of the impedance is exported into the workspace and plotted to get the impedance spectrum plot or the Nyquist plot. Our first model is a model with three RC in series. Fig. 1 shows the comparison between the Model and the literature results.
B. Description of the Nexa Fuel Cell Modell In this paper, we are using a Nexa fuel cell by Ballard
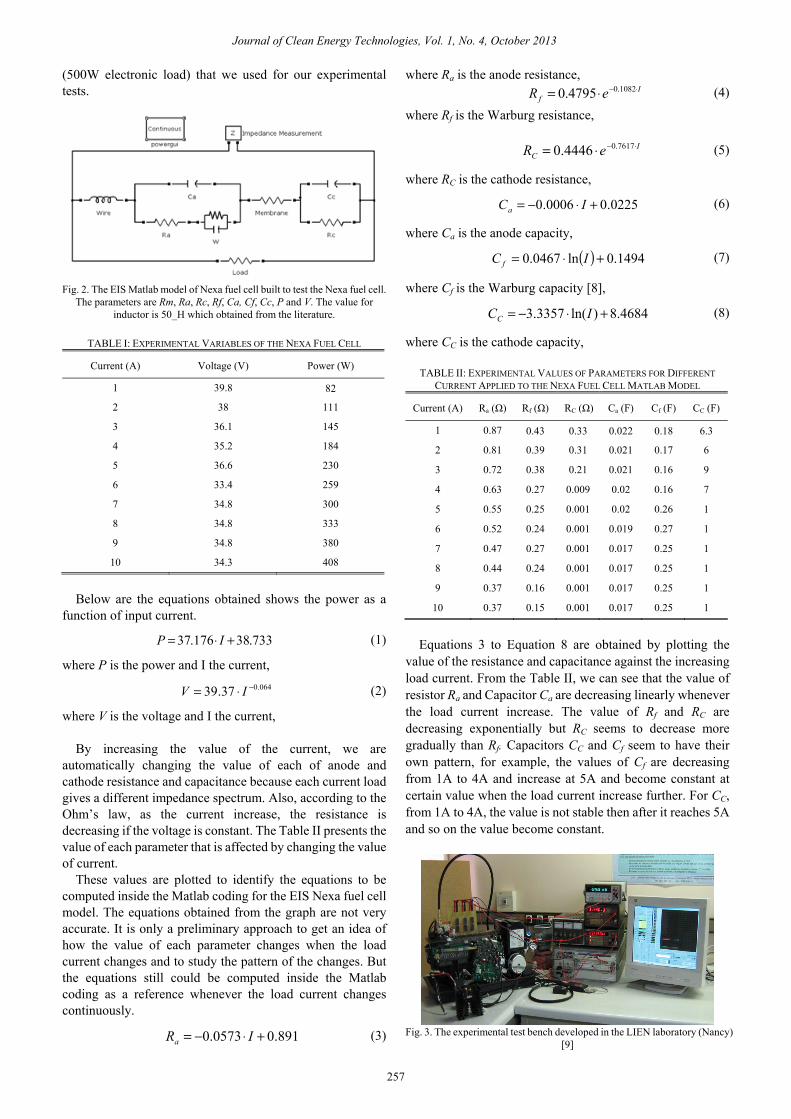
Company to test our model. The fuel cell generally consists of anode, membrane and cathode. The Nexa fuel cell is modelled using Matlab by the combination of series of parallel RC circuit as an anode side, a single resistance as a membrane and another parallel RC circuit as a cathode side. The parameters of this model depend of the applied load. The value of the resistance at anode, cathode and membrane is also affected if it is a single cell or a fuel cell stack. The resistance will be multiplied with the number of the fuel cells connected in series. Inside our Matlab model, we include the inductor which represents the connexion between the load and the fuel cell. Fig. 2 shows the EIS Matlab model used for the Nexa fuel cell.
Using this model, we get the Nyquist plot for every change of load current. The load current is changed by changing the value of power and voltage inside the ’Load’ resistor of the model. The value of voltage and power is obtained from a specific equation extracted from the Table I. These tables are obtained from the experiments that have been carried out using a certain procedures and apparatus which includes fuel cell stack, electronic load, frequency generator and galvanometer.
The limitation in the power is due to the electronic load
256
Journal of Clean Energy Technologies, Vol. 1, No. 4, October 2013
(500W electronic load) that we used for our experimental tests.
Fig. 2. The EIS Matlab model of Nexa fuel cell built to test the Nexa fuel cell.
The parameters are Rm, Ra, Rc, Rf, Ca, Cf, Cc, P and V. The value for inductor is 50_H which obtained from the literature.
TABLE I: EXPERIMENTAL VARIABLES OF THE NEXA FUEL CELL
Current (A) Voltage (V) Power (W)
1 39.8 82
2 38 111
3 36.1 145
4 35.2 184
5 36.6 230
6 33.4 259
7 34.8 300
8 34.8 333
9 34.8 380
10 34.3 408
Below are the equations obtained shows the power as a
function of input current.
733.38176.37 +⋅= IP (1)
where P is the power and I the current, 064.037.39 −⋅= IV (2)
where V is the voltage and I the current,
By increasing the value of the current, we are automatically changing the value of each of anode and cathode resistance and capacitance because each current load gives a different impedance spectrum. Also, according to the Ohm’s law, as the current increase, the resistance is decreasing if the voltage is constant. The Table II presents the value of each parameter that is affected by changing the value of current.
These values are plotted to identify the equations to be computed inside the Matlab coding for the EIS Nexa fuel cell model. The equations obtained from the graph are not very accurate. It is only a preliminary approach to get an idea of how the value of each parameter changes when the load current changes and to study the pattern of the changes. But the equations still could be computed inside the Matlab coding as a reference whenever the load current changes continuously.
891.00573.0 +⋅−= IRa (3)
where Ra is the anode resistance, I
f eR ⋅−⋅= 1082.04795.0 (4)
where Rf is the Warburg resistance,
IC eR ⋅−⋅= 7617.04446.0 (5)
where RC is the cathode resistance,
0225.00006.0 +⋅−= ICa (6)
where Ca is the anode capacity,
( ) 1494.0ln0467.0 +⋅= IC f (7)
where Cf is the Warburg capacity [8],
4684.8)ln(3357.3 +⋅−= ICC (8)
where CC is the cathode capacity, TABLE II: EXPERIMENTAL VALUES OF PARAMETERS FOR DIFFERENT
CURRENT APPLIED TO THE NEXA FUEL CELL MATLAB MODEL
Current (A) Ra (Ω) Rf (Ω) RC (Ω) Ca (F) Cf (F) CC (F)
1 0.87 0.43 0.33 0.022 0.18 6.3
2 0.81 0.39 0.31 0.021 0.17 6
3 0.72 0.38 0.21 0.021 0.16 9
4 0.63 0.27 0.009 0.02 0.16 7
5 0.55 0.25 0.001 0.02 0.26 1
6 0.52 0.24 0.001 0.019 0.27 1
7 0.47 0.27 0.001 0.017 0.25 1
8 0.44 0.24 0.001 0.017 0.25 1
9 0.37 0.16 0.001 0.017 0.25 1
10 0.37 0.15 0.001 0.017 0.25 1
Equations 3 to Equation 8 are obtained by plotting the
value of the resistance and capacitance against the increasing load current. From the Table II, we can see that the value of resistor Ra and Capacitor Ca are decreasing linearly whenever the load current increase. The value of Rf and RC are decreasing exponentially but RC seems to decrease more gradually than Rf. Capacitors CC and Cf seem to have their own pattern, for example, the values of Cf are decreasing from 1A to 4A and increase at 5A and become constant at certain value when the load current increase further. For CC, from 1A to 4A, the value is not stable then after it reaches 5A and so on the value become constant.
Fig. 3. The experimental test bench developed in the LIEN laboratory (Nancy)
[9]
257
Journal of Clean Energy Technologies, Vol. 1, No. 4, October 2013
IV. EXPERIMENTAL VALIDATION
A. Testbench In this section, the test bench used for the impedance
measurement is presented. Complex impedance measurement was carried out on a PEM fuel cell using the Electrochemical Impedance Spectroscopy (EIS) method. Experimental results are presented and discussed. The tests are performed on a 1.2kW Nexa fuel cell with its system controller and electronic devices at different current levels.
The experimental test bench used for the complex impedance measurement is shown in Fig. 3. It includes the fuel cell stack, the electronic load and the frequency generator working in galvanostatic impedance mode. The sinusoidal current signal applied to the fuel cell through the electronic load modulates the current from the fuel cell stack by using the Electrochemical Impedance Spectroscopy (EIS) method.
The measurement test bench is used to capture the voltage and current waveforms data in time domain. The current information at the electronic load is sent to the computer. The fuel cell voltage is measured by the electronic load directly on the fuel cell. The voltage and the current data are read back, via General Purpose Interface Bus (GPIB) to a computer and then stored and processed. In particular, a Fast Fourier Transformation (FFT) algorithm is applied in order to
represent voltage and current in frequency domain. Thus, simply dividing the transformed voltage by the transformed current, it is possible to obtain complex impedance (both magnitude and phase) at the desired frequency. This procedure can be repeated at any frequency within the capabilities of the adopted equipment, resulting in a full spectrum impedance measurement, useful in fuel cell EIS studies. This technique is powerful and can provide a lot of informa tion in a short period of time. It has been applied to proton exchange membrane fuel cell in a number of recent studies [7]. The small excitation waveform at this amplitude causes only very small perturbations on the fuel cell system and reduces errors due to measurement techniques. The level of noise in the impedance data depends on the size of current and voltage signals returned to the control and processing program. Due to the electronic load limit power which cannot exceed 600W, the impedance measurements were carried out for a current range from 1A to 10A, in steps of 1A.
B. Results and Discussion Impedance tests were performed on the fuel cell stack with
its system controller and electronic devices at different current levels. The frequency range of the spectrum goes from 8mHz to 12.4kHz, and there are 10 frequencies taken for each decade.
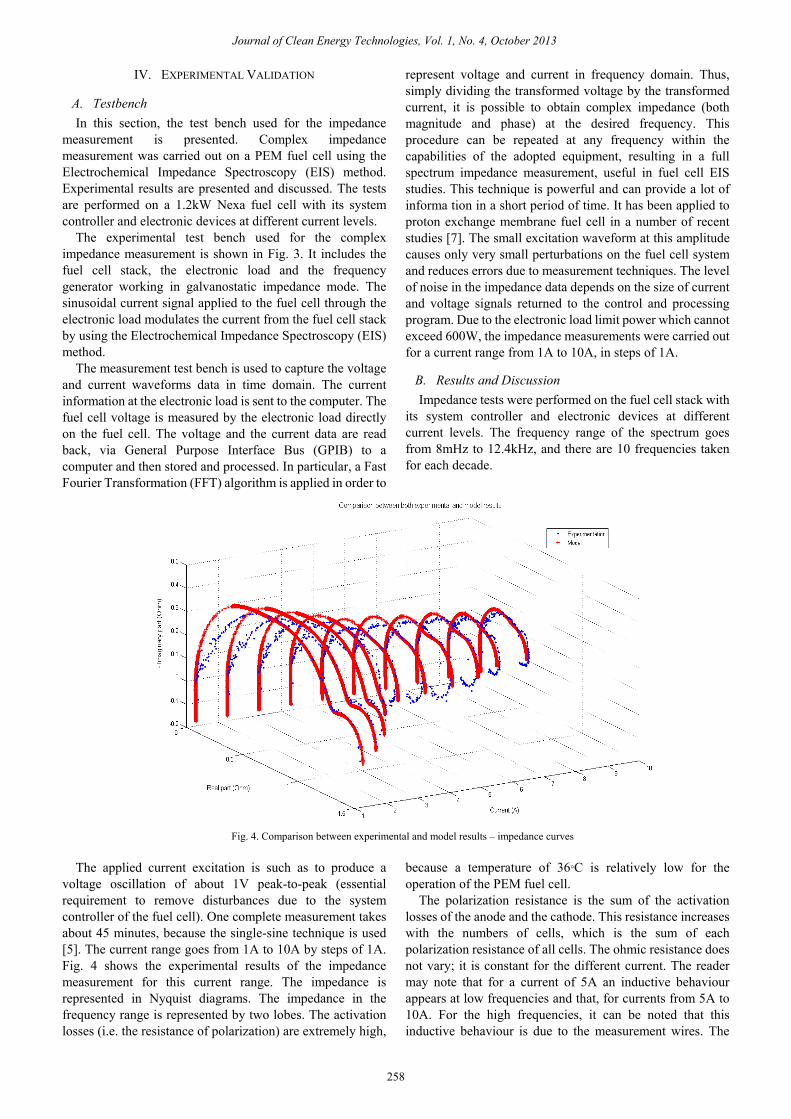
Fig. 4. Comparison between experimental and model results – impedance curves
The applied current excitation is such as to produce a
voltage oscillation of about 1V peak-to-peak (essential requirement to remove disturbances due to the system controller of the fuel cell). One complete measurement takes about 45 minutes, because the single-sine technique is used [5]. The current range goes from 1A to 10A by steps of 1A. Fig. 4 shows the experimental results of the impedance measurement for this current range. The impedance is represented in Nyquist diagrams. The impedance in the frequency range is represented by two lobes. The activation losses (i.e. the resistance of polarization) are extremely high,
because a temperature of 36°C is relatively low for the operation of the PEM fuel cell.
The polarization resistance is the sum of the activation losses of the anode and the cathode. This resistance increases with the numbers of cells, which is the sum of each polarization resistance of all cells. The ohmic resistance does not vary; it is constant for the different current. The reader may note that for a current of 5A an inductive behaviour appears at low frequencies and that, for currents from 5A to 10A. For the high frequencies, it can be noted that this inductive behaviour is due to the measurement wires. The
258
Journal of Clean Energy Technologies, Vol. 1, No. 4, October 2013

polarization resistance decreases when the current increasing. It is equal to 1.477 for 1A and 0.425 for 10A.
V. COMPARISON BETWEEN EXPERIMENTAL RESULTS AND MODEL
To validate the model of the fuel cell developed in Matlab/ Simulink, an impedance measurement was performed on the model by using the EIS method. The steps of measurements are the same than the one used for experimental tests. Model results were compared to the experimental impedance results. Generally the tests were performed for a frequency range starting from 1Hz to 10kHz. The frequency profile was generated by Matlab. Due to the simulation time, the frequency range has been limited from 0.1mHz to 5kHz. Fig. 4 shows the impedance results that have been obtained in simulation and the comparison with those obtained by experimentation on a Nexa fuel cell. A similitude between the two graphs (experimental and simulation) in high frequencies can be seen, at low frequencies, the two curves are not identical, probably due to the experimental conditions that are not the same as in the simulation. The model integrates the three elements of the fuel cell (anode, cathode and membrane). The experimental and simulated Nyquist plots show that the dynamic behaviour of the fuel cell stack can be well predicted by the proposed fuel cell stack model of the Nexa.
VI. CONCLUSION AND PERSPECTIVE A simple electrical model of a 1.2kW Nexa fuel cell has
been modelled and analyzed. The model is based on passive elements. The model has been validated by comparing the simulation and the experimental results obtained from a Nexa fuel cell by a test system facility using the EIS method. Complex impedances are carried out for different currents. It has been shown that the behaviour of the static model is quite accurate. We have a similitude between experimental and simulation results in high frequencies. In low frequencies, a disparity is shown due to the conditions of experimental tests that are not the same as modelisation. However, the model should be improved in order to have a good dynamic response.
REFERENCES [1] J. R. Macdonald, Impedance Spectroscopy, John Wiley & Sons, Inc.,
2007. [2] R. S. Rodgers, an Introduction to EIS lecture slide. [3] J. Wu, Diagnostic tools in PEM Fuel Cell research, Part 1
Electrochemical techniques. [4] X. Yuan and H. Wang, AC impedance technique in PEM fuel cell
diagnosis, A review. [5] Princeton Applied Research Application Note AC- 3, electrochemical
impedance measurements: instrumentation and techniques, electrochemical instrument group.
[6] X. Yan, M. Hou, L. Sun, and D. Liang, AC impedance characteristics of a 2kW PEM fuel cell stack under different operating conditions and load changes.
[7] N. Wagner, W. Schnurnberger, B. Muller, and M. Lang, “Electrochemical impedance spectra of solidoxide fuel cells and polymer membrane fuel cells,” Electrochemical Acta, vol. 43, no. 24, pp. 3785-3793, 1998.
[8] X. Z. Yuan, C. J. Song, H. J. Wan, and J. J. Zhang, Electrochemical Impedance Spectroscopy in PEM fuel cell.
[9] E. H. Aglzim, A. Rouane, and R. E. Moznine, “An Electronic Measurement Instrumentation of the Impedance of a Loaded Fuel Cell or Battery,” Sensors Journal, vol. 7, no. 10, pp. 2363-2377, 2007.
El-Hassane Aglzim was born in Morocco February 13, 1981. AGLZIM received in 2004 the “DESS” degree (specialized graduate degree) degree in embedded electronics systems from the University of Metz, France. In 2005, AGLZIM received the M.Sc. degree science engineering, from the University of Nancy, France. After that, he joined the Instrumentation and microelectronics Group of the LIEN Laboratory (LIEN), University of Nancy,
France, where he started his Ph.D. thesis under the supervision of Pr. Amar ROUANE. In October 2009 AGLZIM obtained the Ph.D. degree in the Instrumentation and Microelectronics (IM) Science at the University of Nancy. His Ph.D. thesis was entitled ‘Characterization by electrochemical impedance spectroscopy method of the complex impedance of a fuel cell - evaluation of the influence of humidity’. From 2009 to 2010, he completed a PostDoc in the System and Transportation Laboratory (SeT) in Belfort, France, under the supervision of Pr. Abdellatif MIRAOUI. He joined the Energetic team of the ISAT in September 2010 as an associate professor. He works in the field of fuel cells and has published several articles in the domain. His current research interests the diagnosis of fuel cells by using the Impedance Spectroscopy method. In parallel to his research works, he teaches electrical engineering, signal acquisition, electrical motors and hybrid vehicles.
Muhammad Aiman Bin Jamaluddin was born in 14th of July 1990 at Sungai Petani, Kedah, Malaysia. The author’s educations start at local primary school, SK Ara Rendang until grade 6. Then the author continues to a local middle and high science school, SMS Bukit Mertajam. After got an excellence results for Malaysian Certificate of Education, the author pursued to study for bachelor of engineering (Hons) electrical and electronic degree, major in power
engineering at University Technology of Petronas, Tronoh, Perak, Malaysia. He is currently at final year and final semester to finish the degree and expected to graduate at January 2013. He used to do an internship at Institut Supérieur de l'Automobile et des Transports (ISAT), France, under the Energy Management Department.
Daniela Chrenko received the Dipl-Ing. FH degree in applied physics of the university of applied sciences in Wedel, Germany in 2002, the MSc of process engineering at the university of applied sciences in Hamburg Germany in 2006 and the PhD for the study of onboard hydrogen production for low temperature fuel cell systems at the university of Franche Comté in Belfort, France in 2008. Her research is linked to technologies for automotive
applications, namely fuel cell systems, She worked on Stirling engines in combination with high temperature fuel cell systems an activities are carried out at the Universite of Franche Comté. The aim of her research is to increase energy efficiency in transportation applications. She is now working as assistant professor at the University of Burgundy.
Amar Rouane was born in Algiers in 1955. He obtained his B.S. and M.S. degrees at Ecole Polytechnique of Algiers, He obtained his PhD in Instrumentation and Microelectronics in 1993 at Laboratory of Electronic Instrumentation of Nancy, France. He was employed there as an instructor in 1992, as assistant professor in 1994 and professor in 2004. From 1988 till now he makes his research at the
Laboratory of Electronic Instrumentation of Nancy in the biomedical field. Pr. Amar Rouane has interest in the following research areas as sensing technology applied to the measurement of human, electromagnetics, instrumentation and measurement, electromagnetic modeling and fuel cells.
259
Journal of Clean Energy Technologies, Vol. 1, No. 4, October 2013