Embed Size (px)
Citation preview
IMPERIAL COLLEGE LONDON
Department of Earth Science and Engineering
Centre for Petroleum Studies
Dynamic Matrix-Fracture Transfer Behaviour in Dual-Porosity Models
By
Shi J. Su
A report submitted in partial fulfilment of the requirements for
the MSc and/or the DIC.
September 2012
ii Dynamic Matrix-Fracture Transfer Behaviour in Dual-Porosity Models
DECLARATION OF OWN WORK
I declare that this thesis
Dynamic Matrix-Fracture Transfer Behaviour in Dual-Porosity Models
is entirely my own work and that where any material could be construed as the work of others, it is fully
cited and referenced, and/or with appropriate acknowledgement given.
Signature:....................................................................................................
Name of student: Shi J. Su
Name of supervisor: Professor Olivier R. Gosselin
Name of the company supervisor: Marie-Ann Giddins, Hadi Parvizi
Dynamic Matrix-Fracture Transfer Behaviour in Dual-Porosity Models iii
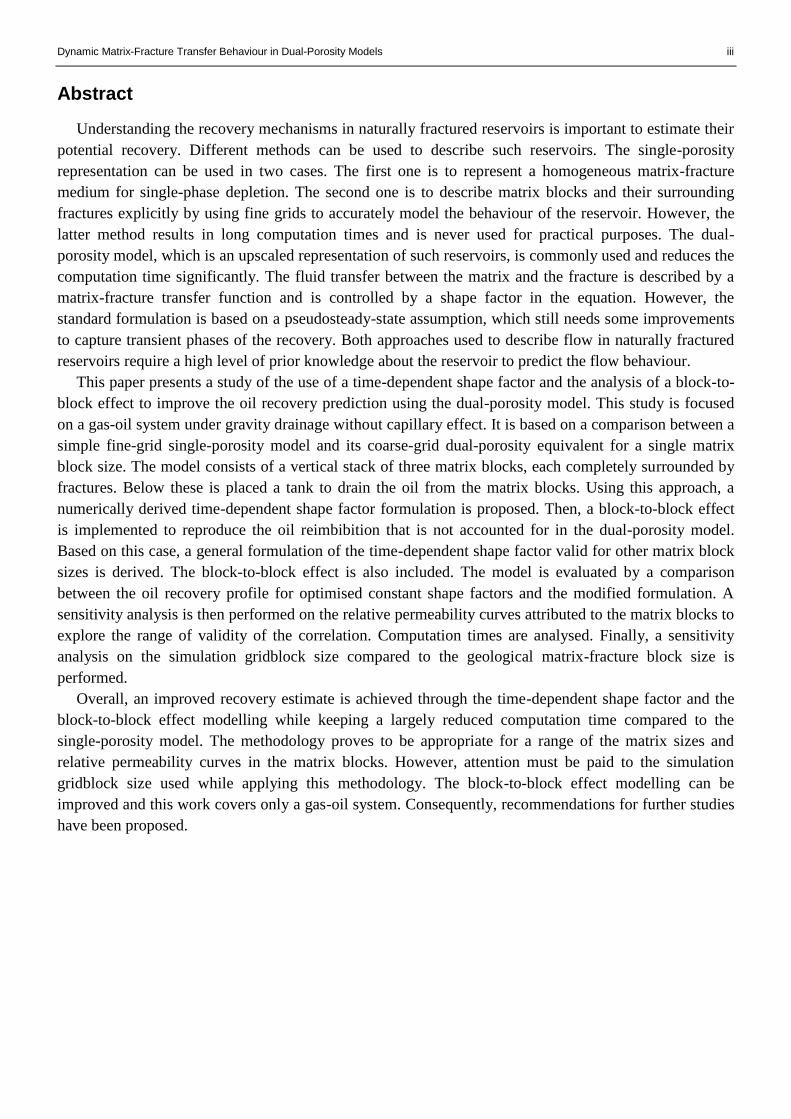
Abstract
Understanding the recovery mechanisms in naturally fractured reservoirs is important to estimate their
potential recovery. Different methods can be used to describe such reservoirs. The single-porosity
representation can be used in two cases. The first one is to represent a homogeneous matrix-fracture
medium for single-phase depletion. The second one is to describe matrix blocks and their surrounding
fractures explicitly by using fine grids to accurately model the behaviour of the reservoir. However, the
latter method results in long computation times and is never used for practical purposes. The dual-
porosity model, which is an upscaled representation of such reservoirs, is commonly used and reduces the
computation time significantly. The fluid transfer between the matrix and the fracture is described by a
matrix-fracture transfer function and is controlled by a shape factor in the equation. However, the
standard formulation is based on a pseudosteady-state assumption, which still needs some improvements
to capture transient phases of the recovery. Both approaches used to describe flow in naturally fractured
reservoirs require a high level of prior knowledge about the reservoir to predict the flow behaviour.
This paper presents a study of the use of a time-dependent shape factor and the analysis of a block-to-
block effect to improve the oil recovery prediction using the dual-porosity model. This study is focused
on a gas-oil system under gravity drainage without capillary effect. It is based on a comparison between a
simple fine-grid single-porosity model and its coarse-grid dual-porosity equivalent for a single matrix
block size. The model consists of a vertical stack of three matrix blocks, each completely surrounded by
fractures. Below these is placed a tank to drain the oil from the matrix blocks. Using this approach, a
numerically derived time-dependent shape factor formulation is proposed. Then, a block-to-block effect
is implemented to reproduce the oil reimbibition that is not accounted for in the dual-porosity model.
Based on this case, a general formulation of the time-dependent shape factor valid for other matrix block
sizes is derived. The block-to-block effect is also included. The model is evaluated by a comparison
between the oil recovery profile for optimised constant shape factors and the modified formulation. A
sensitivity analysis is then performed on the relative permeability curves attributed to the matrix blocks to
explore the range of validity of the correlation. Computation times are analysed. Finally, a sensitivity
analysis on the simulation gridblock size compared to the geological matrix-fracture block size is
performed.
Overall, an improved recovery estimate is achieved through the time-dependent shape factor and the
block-to-block effect modelling while keeping a largely reduced computation time compared to the
single-porosity model. The methodology proves to be appropriate for a range of the matrix sizes and
relative permeability curves in the matrix blocks. However, attention must be paid to the simulation
gridblock size used while applying this methodology. The block-to-block effect modelling can be
improved and this work covers only a gas-oil system. Consequently, recommendations for further studies
have been proposed.

iv Dynamic Matrix-Fracture Transfer Behaviour in Dual-Porosity Models
Acknowledgements
First of all, I would like to thank my project supervisors Marie Ann Giddins (Schlumberger), Hadi
Parvizi (Schlumberger) and Olivier Gosselin (Imperial College London) for their invaluable support,
guidance and excellent advices all along the course of this project.
I am also thankful to the Schlumberger Abingdon Technology Centre for providing a great working
environment and the resources necessary for this project to be fruitful and to all the interns for providing
such a cheerful environment to work in.
A special mention to my fellow classmates and friends of the Petroleum Engineering program for
having shared this not so peaceful year spent at Imperial College London, the SPE Chapter Committee
for organising the most memorable field trip in Brazil, special thanks to the French team for making this
year enjoyable and to Anastasia Alyapina for her friendly support throughout this year, especially during
the elaboration of this project.
And last but not least, I am very grateful to my family for their loving support and encouragement
since as far as I can remember, and for helping me achieving what I consider to be a successful education.
Dynamic Matrix-Fracture Transfer Behaviour in Dual-Porosity Models v
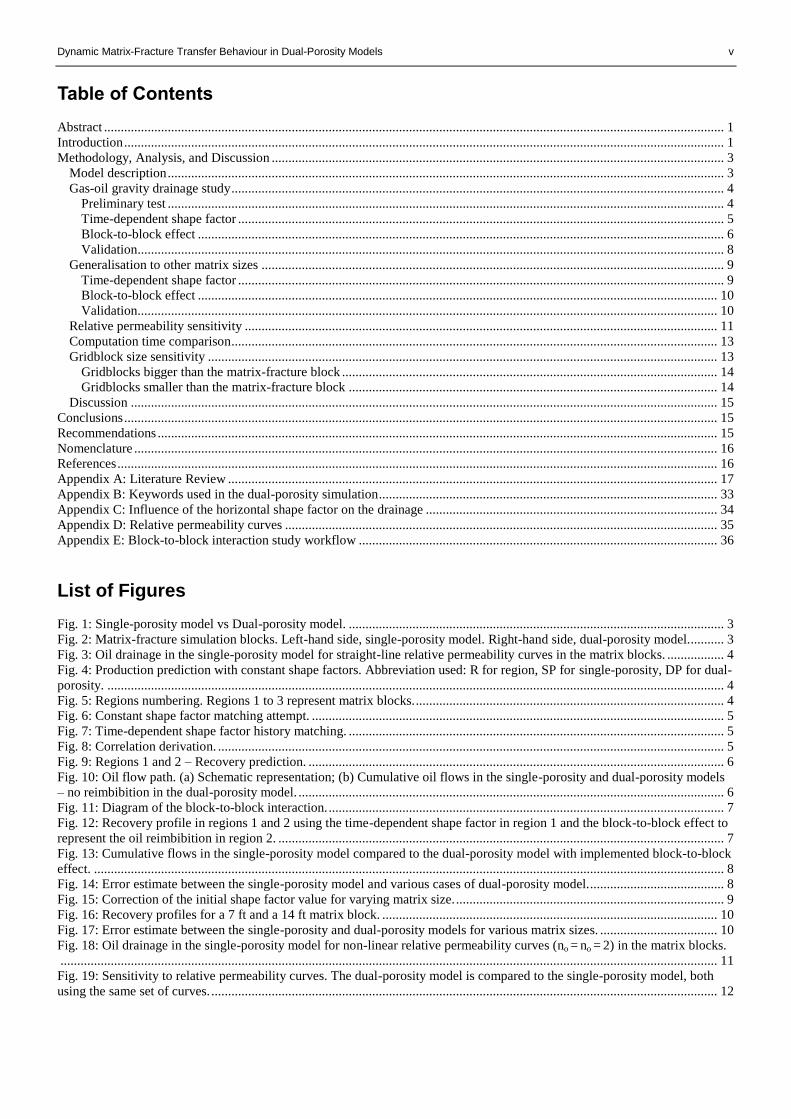
Table of Contents
Abstract ......................................................................................................................................................................................... 1 Introduction ................................................................................................................................................................................... 1 Methodology, Analysis, and Discussion ....................................................................................................................................... 3
Model description ...................................................................................................................................................................... 3 Gas-oil gravity drainage study ................................................................................................................................................... 4
Preliminary test ...................................................................................................................................................................... 4 Time-dependent shape factor ................................................................................................................................................. 5 Block-to-block effect ............................................................................................................................................................. 6 Validation............................................................................................................................................................................... 8
Generalisation to other matrix sizes .......................................................................................................................................... 9 Time-dependent shape factor ................................................................................................................................................. 9 Block-to-block effect ........................................................................................................................................................... 10 Validation............................................................................................................................................................................. 10
Relative permeability sensitivity ............................................................................................................................................. 11 Computation time comparison ................................................................................................................................................. 13 Gridblock size sensitivity ........................................................................................................................................................ 13
Gridblocks bigger than the matrix-fracture block ................................................................................................................ 14 Gridblocks smaller than the matrix-fracture block .............................................................................................................. 14
Discussion ............................................................................................................................................................................... 15 Conclusions ................................................................................................................................................................................. 15 Recommendations ....................................................................................................................................................................... 15 Nomenclature .............................................................................................................................................................................. 16 References ................................................................................................................................................................................... 16 Appendix A: Literature Review .................................................................................................................................................. 17 Appendix B: Keywords used in the dual-porosity simulation ..................................................................................................... 33 Appendix C: Influence of the horizontal shape factor on the drainage ....................................................................................... 34 Appendix D: Relative permeability curves ................................................................................................................................. 35 Appendix E: Block-to-block interaction study workflow ........................................................................................................... 36
List of Figures
Fig. 1: Single-porosity model vs Dual-porosity model. ................................................................................................................ 3 Fig. 2: Matrix-fracture simulation blocks. Left-hand side, single-porosity model. Right-hand side, dual-porosity model........... 3 Fig. 3: Oil drainage in the single-porosity model for straight-line relative permeability curves in the matrix blocks. ................. 4 Fig. 4: Production prediction with constant shape factors. Abbreviation used: R for region, SP for single-porosity, DP for dual-
porosity. ........................................................................................................................................................................................ 4 Fig. 5: Regions numbering. Regions 1 to 3 represent matrix blocks. ............................................................................................ 4 Fig. 6: Constant shape factor matching attempt. ........................................................................................................................... 5 Fig. 7: Time-dependent shape factor history matching. ................................................................................................................ 5 Fig. 8: Correlation derivation. ....................................................................................................................................................... 5 Fig. 9: Regions 1 and 2 – Recovery prediction. ............................................................................................................................ 6 Fig. 10: Oil flow path. (a) Schematic representation; (b) Cumulative oil flows in the single-porosity and dual-porosity models
– no reimbibition in the dual-porosity model. ............................................................................................................................... 6 Fig. 11: Diagram of the block-to-block interaction. ...................................................................................................................... 7 Fig. 12: Recovery profile in regions 1 and 2 using the time-dependent shape factor in region 1 and the block-to-block effect to
represent the oil reimbibition in region 2. ..................................................................................................................................... 7 Fig. 13: Cumulative flows in the single-porosity model compared to the dual-porosity model with implemented block-to-block
effect. ............................................................................................................................................................................................ 8 Fig. 14: Error estimate between the single-porosity model and various cases of dual-porosity model. ........................................ 8 Fig. 15: Correction of the initial shape factor value for varying matrix size. ................................................................................ 9 Fig. 16: Recovery profiles for a 7 ft and a 14 ft matrix block. .................................................................................................... 10 Fig. 17: Error estimate between the single-porosity and dual-porosity models for various matrix sizes. ................................... 10 Fig. 18: Oil drainage in the single-porosity model for non-linear relative permeability curves (no = no = 2) in the matrix blocks.
.................................................................................................................................................................................................... 11 Fig. 19: Sensitivity to relative permeability curves. The dual-porosity model is compared to the single-porosity model, both
using the same set of curves. ....................................................................................................................................................... 12
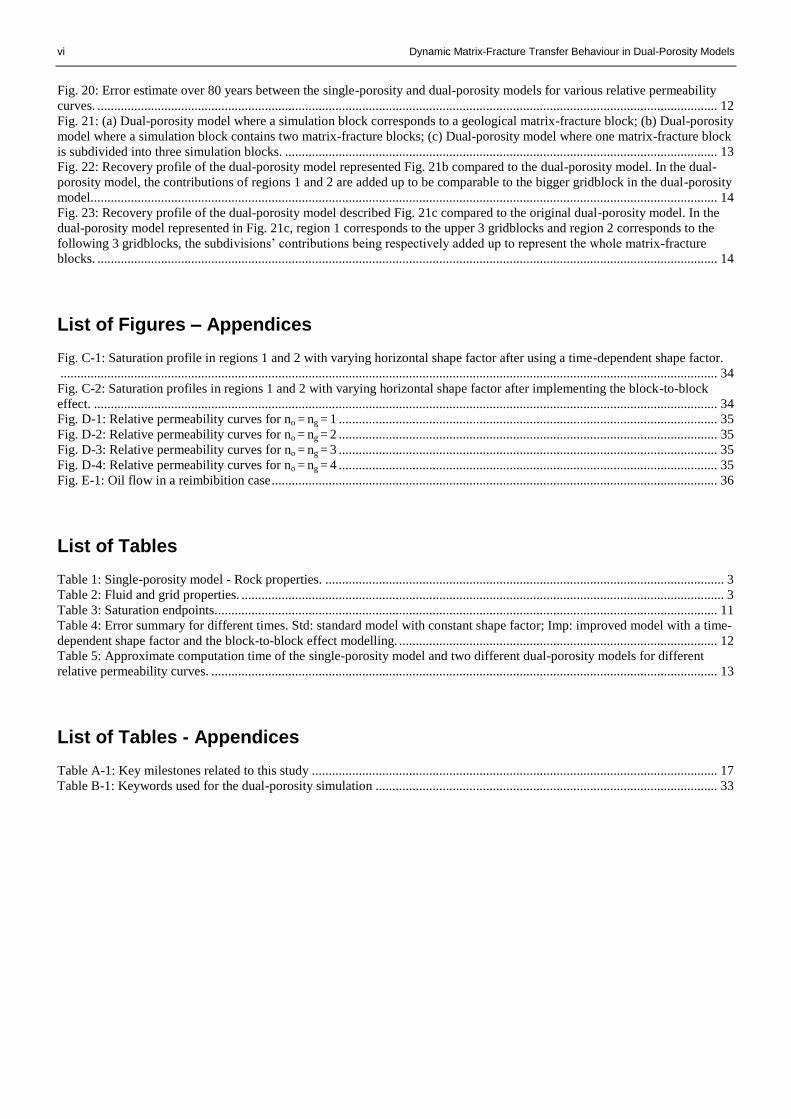
vi Dynamic Matrix-Fracture Transfer Behaviour in Dual-Porosity Models
Fig. 20: Error estimate over 80 years between the single-porosity and dual-porosity models for various relative permeability
curves. ......................................................................................................................................................................................... 12 Fig. 21: (a) Dual-porosity model where a simulation block corresponds to a geological matrix-fracture block; (b) Dual-porosity
model where a simulation block contains two matrix-fracture blocks; (c) Dual-porosity model where one matrix-fracture block
is subdivided into three simulation blocks. ................................................................................................................................. 13 Fig. 22: Recovery profile of the dual-porosity model represented Fig. 21b compared to the dual-porosity model. In the dual-
porosity model, the contributions of regions 1 and 2 are added up to be comparable to the bigger gridblock in the dual-porosity
model........................................................................................................................................................................................... 14 Fig. 23: Recovery profile of the dual-porosity model described Fig. 21c compared to the original dual-porosity model. In the
dual-porosity model represented in Fig. 21c, region 1 corresponds to the upper 3 gridblocks and region 2 corresponds to the
following 3 gridblocks, the subdivisions’ contributions being respectively added up to represent the whole matrix-fracture
blocks. ......................................................................................................................................................................................... 14
List of Figures – Appendices
Fig. C-1: Saturation profile in regions 1 and 2 with varying horizontal shape factor after using a time-dependent shape factor.
.................................................................................................................................................................................................... 34 Fig. C-2: Saturation profiles in regions 1 and 2 with varying horizontal shape factor after implementing the block-to-block
effect. .......................................................................................................................................................................................... 34 Fig. D-1: Relative permeability curves for no = ng = 1 ................................................................................................................. 35 Fig. D-2: Relative permeability curves for no = ng = 2 ................................................................................................................. 35 Fig. D-3: Relative permeability curves for no = ng = 3 ................................................................................................................. 35 Fig. D-4: Relative permeability curves for no = ng = 4 ................................................................................................................. 35 Fig. E-1: Oil flow in a reimbibition case ..................................................................................................................................... 36
List of Tables
Table 1: Single-porosity model - Rock properties. ....................................................................................................................... 3 Table 2: Fluid and grid properties. ................................................................................................................................................ 3 Table 3: Saturation endpoints. ..................................................................................................................................................... 11 Table 4: Error summary for different times. Std: standard model with constant shape factor; Imp: improved model with a time-
dependent shape factor and the block-to-block effect modelling. ............................................................................................... 12 Table 5: Approximate computation time of the single-porosity model and two different dual-porosity models for different
relative permeability curves. ....................................................................................................................................................... 13
List of Tables - Appendices
Table A-1: Key milestones related to this study ......................................................................................................................... 17 Table B-1: Keywords used for the dual-porosity simulation ...................................................................................................... 33
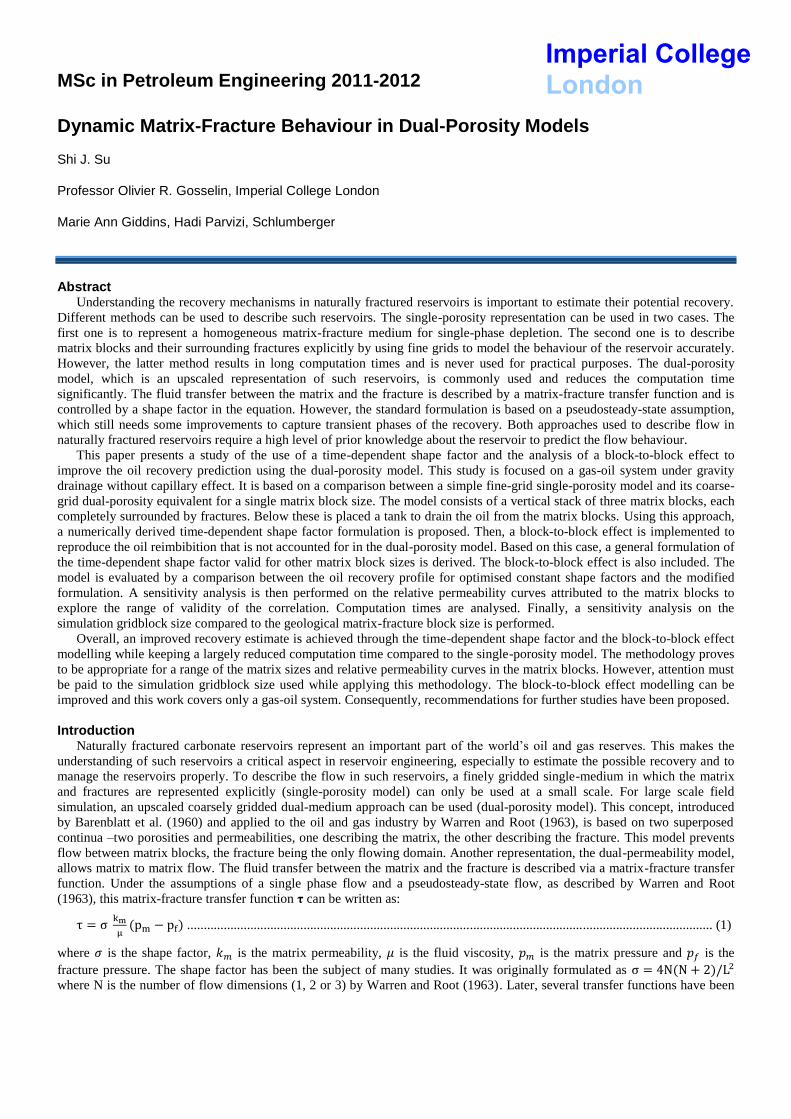
MSc in Petroleum Engineering 2011-2012
Dynamic Matrix-Fracture Behaviour in Dual-Porosity Models Shi J. Su
Professor Olivier R. Gosselin, Imperial College London
Marie Ann Giddins, Hadi Parvizi, Schlumberger
Abstract
Understanding the recovery mechanisms in naturally fractured reservoirs is important to estimate their potential recovery.
Different methods can be used to describe such reservoirs. The single-porosity representation can be used in two cases. The
first one is to represent a homogeneous matrix-fracture medium for single-phase depletion. The second one is to describe
matrix blocks and their surrounding fractures explicitly by using fine grids to model the behaviour of the reservoir accurately.
However, the latter method results in long computation times and is never used for practical purposes. The dual-porosity
model, which is an upscaled representation of such reservoirs, is commonly used and reduces the computation time
significantly. The fluid transfer between the matrix and the fracture is described by a matrix-fracture transfer function and is
controlled by a shape factor in the equation. However, the standard formulation is based on a pseudosteady-state assumption,
which still needs some improvements to capture transient phases of the recovery. Both approaches used to describe flow in
naturally fractured reservoirs require a high level of prior knowledge about the reservoir to predict the flow behaviour.
This paper presents a study of the use of a time-dependent shape factor and the analysis of a block-to-block effect to
improve the oil recovery prediction using the dual-porosity model. This study is focused on a gas-oil system under gravity
drainage without capillary effect. It is based on a comparison between a simple fine-grid single-porosity model and its coarse-
grid dual-porosity equivalent for a single matrix block size. The model consists of a vertical stack of three matrix blocks, each
completely surrounded by fractures. Below these is placed a tank to drain the oil from the matrix blocks. Using this approach,
a numerically derived time-dependent shape factor formulation is proposed. Then, a block-to-block effect is implemented to
reproduce the oil reimbibition that is not accounted for in the dual-porosity model. Based on this case, a general formulation of
the time-dependent shape factor valid for other matrix block sizes is derived. The block-to-block effect is also included. The
model is evaluated by a comparison between the oil recovery profile for optimised constant shape factors and the modified
formulation. A sensitivity analysis is then performed on the relative permeability curves attributed to the matrix blocks to
explore the range of validity of the correlation. Computation times are analysed. Finally, a sensitivity analysis on the
simulation gridblock size compared to the geological matrix-fracture block size is performed.
Overall, an improved recovery estimate is achieved through the time-dependent shape factor and the block-to-block effect
modelling while keeping a largely reduced computation time compared to the single-porosity model. The methodology proves
to be appropriate for a range of the matrix sizes and relative permeability curves in the matrix blocks. However, attention must
be paid to the simulation gridblock size used while applying this methodology. The block-to-block effect modelling can be
improved and this work covers only a gas-oil system. Consequently, recommendations for further studies have been proposed.
Introduction Naturally fractured carbonate reservoirs represent an important part of the world’s oil and gas reserves. This makes the
understanding of such reservoirs a critical aspect in reservoir engineering, especially to estimate the possible recovery and to
manage the reservoirs properly. To describe the flow in such reservoirs, a finely gridded single-medium in which the matrix
and fractures are represented explicitly (single-porosity model) can only be used at a small scale. For large scale field
simulation, an upscaled coarsely gridded dual-medium approach can be used (dual-porosity model). This concept, introduced
by Barenblatt et al. (1960) and applied to the oil and gas industry by Warren and Root (1963), is based on two superposed
continua –two porosities and permeabilities, one describing the matrix, the other describing the fracture. This model prevents
flow between matrix blocks, the fracture being the only flowing domain. Another representation, the dual-permeability model,
allows matrix to matrix flow. The fluid transfer between the matrix and the fracture is described via a matrix-fracture transfer
function. Under the assumptions of a single phase flow and a pseudosteady-state flow, as described by Warren and Root
(1963), this matrix-fracture transfer function τ can be written as:
τ = σ km
μ(pm − pf) .............................................................................................................................................................. (1)
where 𝜎 is the shape factor, 𝑘𝑚 is the matrix permeability, 𝜇 is the fluid viscosity, 𝑝𝑚 is the matrix pressure and 𝑝𝑓 is the
fracture pressure. The shape factor has been the subject of many studies. It was originally formulated as σ = 4N(N + 2)/L2
where N is the number of flow dimensions (1, 2 or 3) by Warren and Root (1963). Later, several transfer functions have been
Imperial College London
2 Dynamic Matrix-Fracture Transfer Behaviour in Dual-Porosity Models
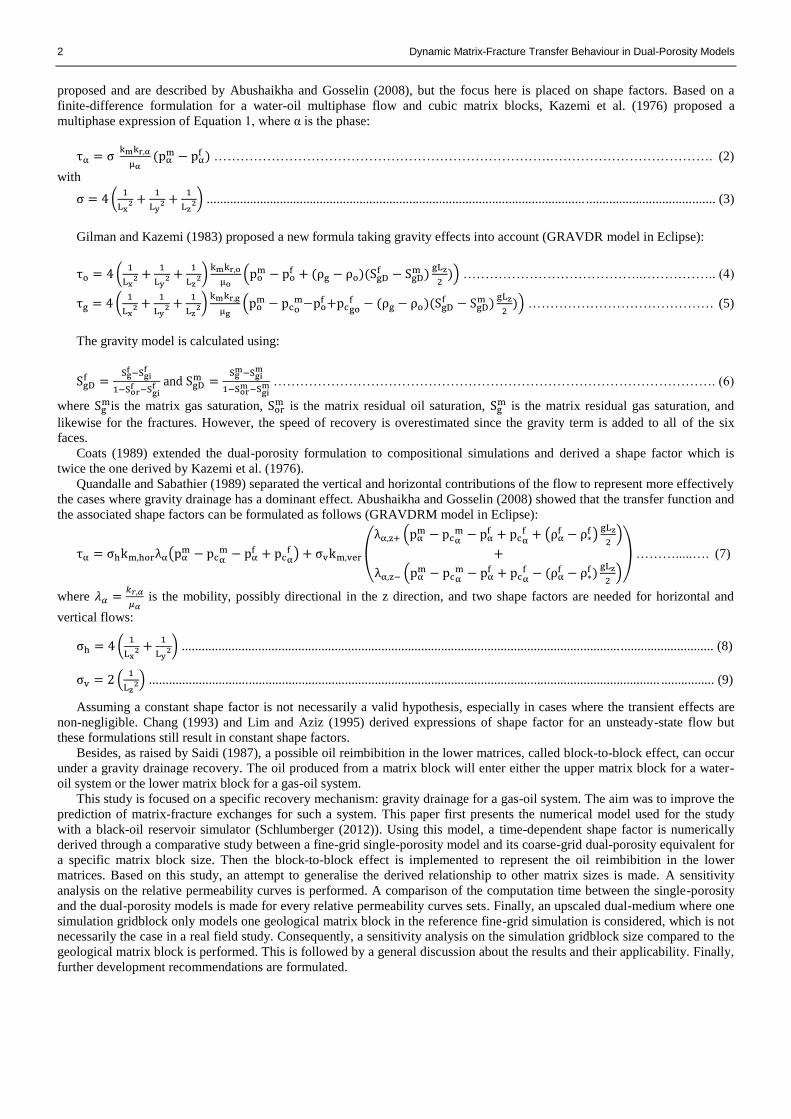
proposed and are described by Abushaikha and Gosselin (2008), but the focus here is placed on shape factors. Based on a
finite-difference formulation for a water-oil multiphase flow and cubic matrix blocks, Kazemi et al. (1976) proposed a
multiphase expression of Equation 1, where α is the phase:
τα = σ kmkr,α
μα(pα
m − pαf ) ………………………………………………………………….………………………………. (2)
with
σ = 4 (1
Lx2 +
1
Ly2 +
1
Lz2) .................................................................................................................. ....................................... (3)
Gilman and Kazemi (1983) proposed a new formula taking gravity effects into account (GRAVDR model in Eclipse):
τo = 4 (1
Lx2 +
1
Ly2 +
1
Lz2)
kmkr,o
μo(po
m − pof + (ρg − ρo)(SgD
f − SgDm )
gLz
2)) …………………………………..…………….. (4)
τg = 4 (1
Lx2 +
1
Ly2 +
1
Lz2)
kmkr,g
μg(po
m − pcom−po
f +pcgof − (ρg − ρo)(SgD
f − SgDm )
gLz
2)) …………………………………… (5)
The gravity model is calculated using:
SgDf =
Sgf −Sgi
f
1−Sorf −Sgi
f and SgDm =
Sgm−Sgi
m
1−Sorm −Sgi
m ………………………………………………………………………………………. (6)
where Sgmis the matrix gas saturation, Sor
m is the matrix residual oil saturation, Sgm is the matrix residual gas saturation, and
likewise for the fractures. However, the speed of recovery is overestimated since the gravity term is added to all of the six
faces.
Coats (1989) extended the dual-porosity formulation to compositional simulations and derived a shape factor which is
twice the one derived by Kazemi et al. (1976).
Quandalle and Sabathier (1989) separated the vertical and horizontal contributions of the flow to represent more effectively
the cases where gravity drainage has a dominant effect. Abushaikha and Gosselin (2008) showed that the transfer function and
the associated shape factors can be formulated as follows (GRAVDRM model in Eclipse):
τα = σhkm,horλα(pαm − pcα
m − pαf + pcα
f ) + σvkm,ver (
λα,z+ (pαm − pcα
m − pαf + pcα
f + (ραf − ρ∗
f )gLz
2)
+
λα,z− (pαm − pcα
m − pαf + pcα
f − (ραf − ρ∗
f )gLz
2)
) ……….....…. (7)
where 𝜆𝛼 =𝑘𝑟,𝛼
𝜇𝛼 is the mobility, possibly directional in the z direction, and two shape factors are needed for horizontal and
vertical flows:
σh = 4 (1
Lx2 +
1
Ly2) ................................................................................................................................................................ (8)
σv = 2 (1
Lz2) .......................................................................................................................................................... ................ (9)
Assuming a constant shape factor is not necessarily a valid hypothesis, especially in cases where the transient effects are
non-negligible. Chang (1993) and Lim and Aziz (1995) derived expressions of shape factor for an unsteady-state flow but
these formulations still result in constant shape factors.
Besides, as raised by Saidi (1987), a possible oil reimbibition in the lower matrices, called block-to-block effect, can occur
under a gravity drainage recovery. The oil produced from a matrix block will enter either the upper matrix block for a water-
oil system or the lower matrix block for a gas-oil system.
This study is focused on a specific recovery mechanism: gravity drainage for a gas-oil system. The aim was to improve the
prediction of matrix-fracture exchanges for such a system. This paper first presents the numerical model used for the study
with a black-oil reservoir simulator (Schlumberger (2012)). Using this model, a time-dependent shape factor is numerically
derived through a comparative study between a fine-grid single-porosity model and its coarse-grid dual-porosity equivalent for
a specific matrix block size. Then the block-to-block effect is implemented to represent the oil reimbibition in the lower
matrices. Based on this study, an attempt to generalise the derived relationship to other matrix sizes is made. A sensitivity
analysis on the relative permeability curves is performed. A comparison of the computation time between the single-porosity
and the dual-porosity models is made for every relative permeability curves sets. Finally, an upscaled dual-medium where one
simulation gridblock only models one geological matrix block in the reference fine-grid simulation is considered, which is not
necessarily the case in a real field study. Consequently, a sensitivity analysis on the simulation gridblock size compared to the
geological matrix block is performed. This is followed by a general discussion about the results and their applicability. Finally,
further development recommendations are formulated.
Dynamic Matrix-Fracture Transfer Behaviour in Dual-Porosity Models 3
Methodology, Analysis, and Discussion Model description
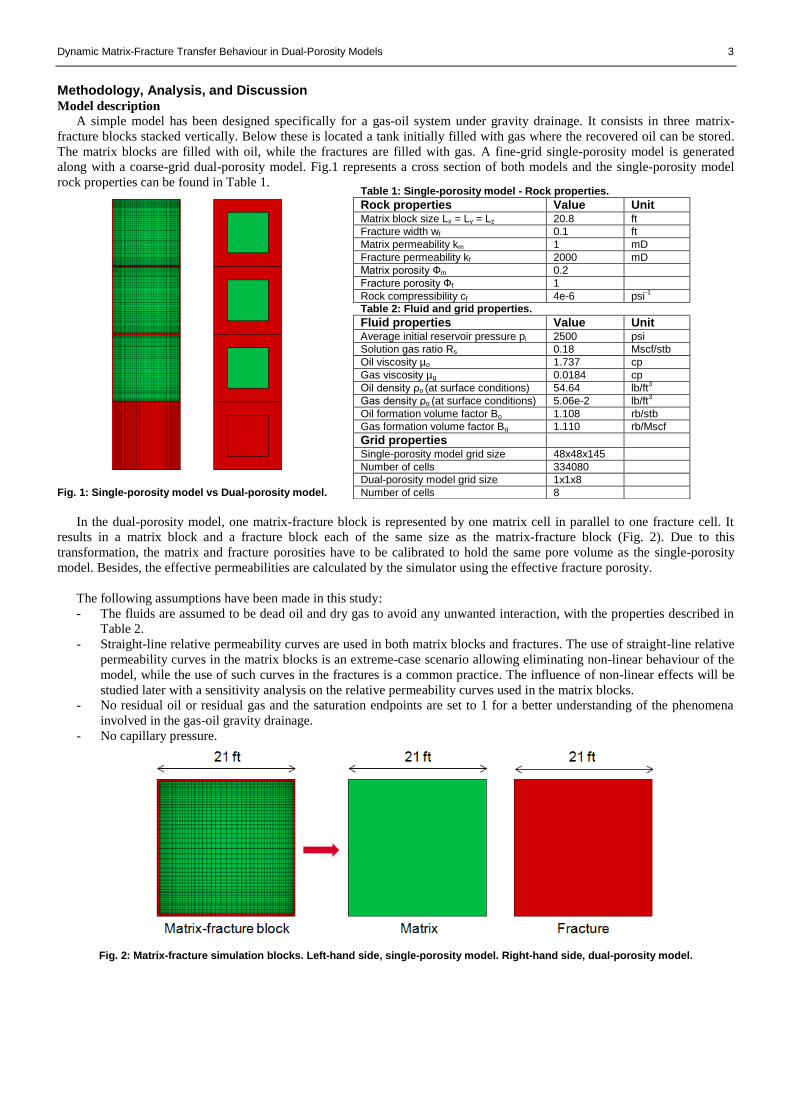
A simple model has been designed specifically for a gas-oil system under gravity drainage. It consists in three matrix-
fracture blocks stacked vertically. Below these is located a tank initially filled with gas where the recovered oil can be stored.
The matrix blocks are filled with oil, while the fractures are filled with gas. A fine-grid single-porosity model is generated
along with a coarse-grid dual-porosity model. Fig.1 represents a cross section of both models and the single-porosity model
rock properties can be found in Table 1.
Fig. 1: Single-porosity model vs Dual-porosity model.
In the dual-porosity model, one matrix-fracture block is represented by one matrix cell in parallel to one fracture cell. It
results in a matrix block and a fracture block each of the same size as the matrix-fracture block (Fig. 2). Due to this
transformation, the matrix and fracture porosities have to be calibrated to hold the same pore volume as the single-porosity
model. Besides, the effective permeabilities are calculated by the simulator using the effective fracture porosity.
The following assumptions have been made in this study:
- The fluids are assumed to be dead oil and dry gas to avoid any unwanted interaction, with the properties described in
Table 2.
- Straight-line relative permeability curves are used in both matrix blocks and fractures. The use of straight-line relative
permeability curves in the matrix blocks is an extreme-case scenario allowing eliminating non-linear behaviour of the
model, while the use of such curves in the fractures is a common practice. The influence of non-linear effects will be
studied later with a sensitivity analysis on the relative permeability curves used in the matrix blocks.
- No residual oil or residual gas and the saturation endpoints are set to 1 for a better understanding of the phenomena
involved in the gas-oil gravity drainage.
- No capillary pressure.
Fig. 2: Matrix-fracture simulation blocks. Left-hand side, single-porosity model. Right-hand side, dual-porosity model.
Table 1: Single-porosity model - Rock properties.
Rock properties Value Unit Matrix block size Lx = Ly = Lz 20.8 ft
Fracture width wf 0.1 ft
Matrix permeability km 1 mD
Fracture permeability kf 2000 mD
Matrix porosity Фm 0.2
Fracture porosity Фf 1
Rock compressibility cf 4e-6 psi-1
Table 2: Fluid and grid properties.
Fluid properties Value Unit Average initial reservoir pressure pi 2500 psi
Solution gas ratio Rs 0.18 Mscf/stb
Oil viscosity µo 1.737 cp
Gas viscosity µg 0.0184 cp
Oil density ρo (at surface conditions) 54.64 lb/ft3
Gas density ρg (at surface conditions) 5.06e-2 lb/ft3
Oil formation volume factor Bo 1.108 rb/stb
Gas formation volume factor Bg 1.110 rb/Mscf
Grid properties Single-porosity model grid size 48x48x145
Number of cells 334080
Dual-porosity model grid size 1x1x8
Number of cells 8
4 Dynamic Matrix-Fracture Transfer Behaviour in Dual-Porosity Models
Gas-oil gravity drainage study
Preliminary test
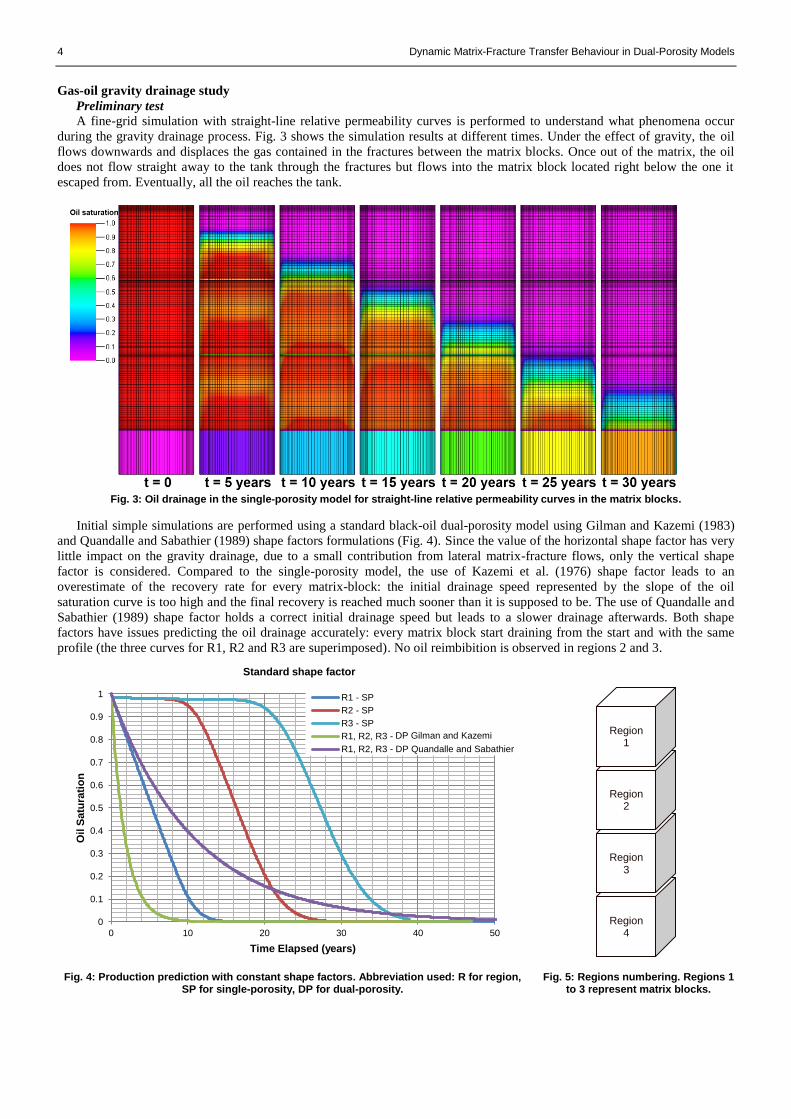
A fine-grid simulation with straight-line relative permeability curves is performed to understand what phenomena occur
during the gravity drainage process. Fig. 3 shows the simulation results at different times. Under the effect of gravity, the oil
flows downwards and displaces the gas contained in the fractures between the matrix blocks. Once out of the matrix, the oil
does not flow straight away to the tank through the fractures but flows into the matrix block located right below the one it
escaped from. Eventually, all the oil reaches the tank.
Fig. 3: Oil drainage in the single-porosity model for straight-line relative permeability curves in the matrix blocks.
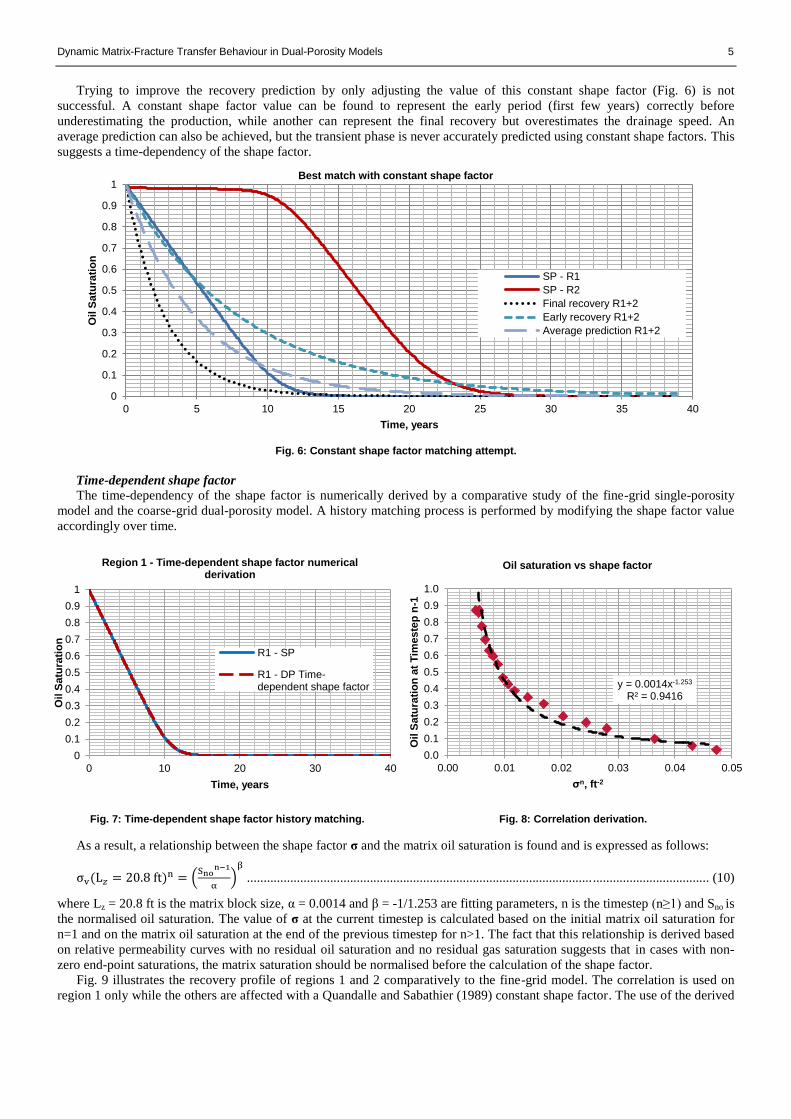
Initial simple simulations are performed using a standard black-oil dual-porosity model using Gilman and Kazemi (1983)
and Quandalle and Sabathier (1989) shape factors formulations (Fig. 4). Since the value of the horizontal shape factor has very
little impact on the gravity drainage, due to a small contribution from lateral matrix-fracture flows, only the vertical shape
factor is considered. Compared to the single-porosity model, the use of Kazemi et al. (1976) shape factor leads to an
overestimate of the recovery rate for every matrix-block: the initial drainage speed represented by the slope of the oil
saturation curve is too high and the final recovery is reached much sooner than it is supposed to be. The use of Quandalle and
Sabathier (1989) shape factor holds a correct initial drainage speed but leads to a slower drainage afterwards. Both shape
factors have issues predicting the oil drainage accurately: every matrix block start draining from the start and with the same
profile (the three curves for R1, R2 and R3 are superimposed). No oil reimbibition is observed in regions 2 and 3.
Fig. 4: Production prediction with constant shape factors. Abbreviation used: R for region, SP for single-porosity, DP for dual-porosity.
Fig. 5: Regions numbering. Regions 1 to 3 represent matrix blocks.
0
0.1
0.2
0.3
0.4
0.5
0.6
0.7
0.8
0.9
1
0 10 20 30 40 50
Oil
Satu
rati
on
Time Elapsed (years)
Standard shape factor
R1 - SP
R2 - SP
R3 - SP
R1, R2, R3 - DP Kazemi et al
R1, R2, R3 - DP Quandalle and Sabathier
DP Gilman and Kazemi
Region 4
Region 3
Region 2
Region 1
Dynamic Matrix-Fracture Transfer Behaviour in Dual-Porosity Models 5
Trying to improve the recovery prediction by only adjusting the value of this constant shape factor (Fig. 6) is not
successful. A constant shape factor value can be found to represent the early period (first few years) correctly before
underestimating the production, while another can represent the final recovery but overestimates the drainage speed. An
average prediction can also be achieved, but the transient phase is never accurately predicted using constant shape factors. This
suggests a time-dependency of the shape factor.
Fig. 6: Constant shape factor matching attempt.
Time-dependent shape factor
The time-dependency of the shape factor is numerically derived by a comparative study of the fine-grid single-porosity
model and the coarse-grid dual-porosity model. A history matching process is performed by modifying the shape factor value
accordingly over time.
Fig. 7: Time-dependent shape factor history matching.
Fig. 8: Correlation derivation.
As a result, a relationship between the shape factor σ and the matrix oil saturation is found and is expressed as follows:
σv(L𝑧 = 20.8 ft)n = (Sno
n−1
α)
β
........................................................................................................................................... (10)
where Lz = 20.8 ft is the matrix block size, α = 0.0014 and β = -1/1.253 are fitting parameters, n is the timestep (n≥1) and Sno is
the normalised oil saturation. The value of σ at the current timestep is calculated based on the initial matrix oil saturation for
n=1 and on the matrix oil saturation at the end of the previous timestep for n>1. The fact that this relationship is derived based
on relative permeability curves with no residual oil saturation and no residual gas saturation suggests that in cases with non-
zero end-point saturations, the matrix saturation should be normalised before the calculation of the shape factor.
Fig. 9 illustrates the recovery profile of regions 1 and 2 comparatively to the fine-grid model. The correlation is used on
region 1 only while the others are affected with a Quandalle and Sabathier (1989) constant shape factor. The use of the derived
0
0.1
0.2
0.3
0.4
0.5
0.6
0.7
0.8
0.9
1
0 5 10 15 20 25 30 35 40
Oil
Satu
rati
on
Time, years
Best match with constant shape factor
SP - R1
SP - R2
Final recovery R1+2
Early recovery R1+2
Average prediction R1+2
0
0.1
0.2
0.3
0.4
0.5
0.6
0.7
0.8
0.9
1
0 10 20 30 40
Oil
Satu
rati
on
Time, years
Region 1 - Time-dependent shape factor numerical derivation
R1 - SP
R1 - DP Time-dependent shape factor y = 0.0014x-1.253
R² = 0.9416
0.0
0.1
0.2
0.3
0.4
0.5
0.6
0.7
0.8
0.9
1.0
0.00 0.01 0.02 0.03 0.04 0.05
Oil
Satu
rati
on
at
Tim
este
p n
-1
σn, ft-2
Oil saturation vs shape factor
6 Dynamic Matrix-Fracture Transfer Behaviour in Dual-Porosity Models
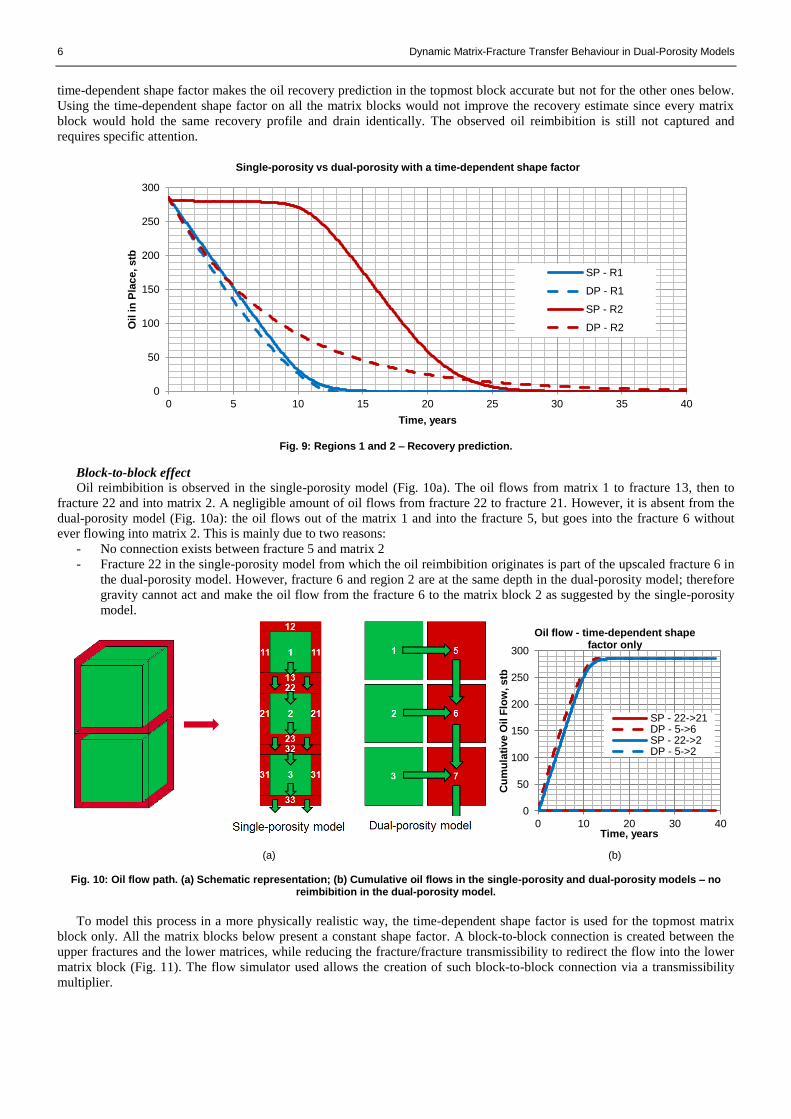
time-dependent shape factor makes the oil recovery prediction in the topmost block accurate but not for the other ones below.
Using the time-dependent shape factor on all the matrix blocks would not improve the recovery estimate since every matrix
block would hold the same recovery profile and drain identically. The observed oil reimbibition is still not captured and
requires specific attention.
Fig. 9: Regions 1 and 2 – Recovery prediction.
Block-to-block effect
Oil reimbibition is observed in the single-porosity model (Fig. 10a). The oil flows from matrix 1 to fracture 13, then to
fracture 22 and into matrix 2. A negligible amount of oil flows from fracture 22 to fracture 21. However, it is absent from the
dual-porosity model (Fig. 10a): the oil flows out of the matrix 1 and into the fracture 5, but goes into the fracture 6 without
ever flowing into matrix 2. This is mainly due to two reasons:
- No connection exists between fracture 5 and matrix 2
- Fracture 22 in the single-porosity model from which the oil reimbibition originates is part of the upscaled fracture 6 in
the dual-porosity model. However, fracture 6 and region 2 are at the same depth in the dual-porosity model; therefore
gravity cannot act and make the oil flow from the fracture 6 to the matrix block 2 as suggested by the single-porosity
model.
(a) (b)
Fig. 10: Oil flow path. (a) Schematic representation; (b) Cumulative oil flows in the single-porosity and dual-porosity models – no reimbibition in the dual-porosity model.
To model this process in a more physically realistic way, the time-dependent shape factor is used for the topmost matrix
block only. All the matrix blocks below present a constant shape factor. A block-to-block connection is created between the
upper fractures and the lower matrices, while reducing the fracture/fracture transmissibility to redirect the flow into the lower
matrix block (Fig. 11). The flow simulator used allows the creation of such block-to-block connection via a transmissibility
multiplier.
0
50
100
150
200
250
300
0 5 10 15 20 25 30 35 40
Oil
in
Pla
ce, stb
Time, years
Single-porosity vs dual-porosity with a time-dependent shape factor
SP - R1
DP - R1
SP - R2
DP - R2
0
50
100
150
200
250
300
0 10 20 30 40
Cu
mu
lati
ve O
il F
low
, stb
Time, years
Oil flow - time-dependent shape factor only
SP - 22->21DP - 5->6SP - 22->2DP - 5->2
Dynamic Matrix-Fracture Transfer Behaviour in Dual-Porosity Models 7
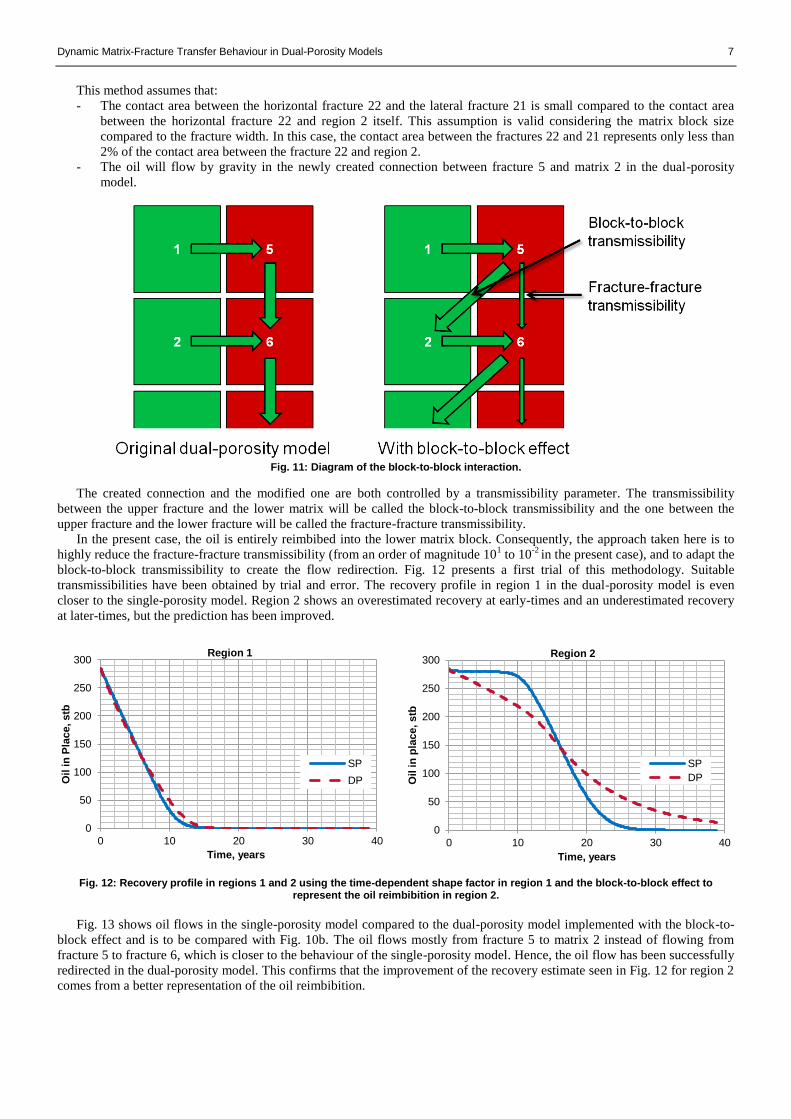
This method assumes that:
- The contact area between the horizontal fracture 22 and the lateral fracture 21 is small compared to the contact area
between the horizontal fracture 22 and region 2 itself. This assumption is valid considering the matrix block size
compared to the fracture width. In this case, the contact area between the fractures 22 and 21 represents only less than
2% of the contact area between the fracture 22 and region 2.
- The oil will flow by gravity in the newly created connection between fracture 5 and matrix 2 in the dual-porosity
model.
Fig. 11: Diagram of the block-to-block interaction.
The created connection and the modified one are both controlled by a transmissibility parameter. The transmissibility
between the upper fracture and the lower matrix will be called the block-to-block transmissibility and the one between the
upper fracture and the lower fracture will be called the fracture-fracture transmissibility.
In the present case, the oil is entirely reimbibed into the lower matrix block. Consequently, the approach taken here is to
highly reduce the fracture-fracture transmissibility (from an order of magnitude 101 to 10
-2 in the present case), and to adapt the
block-to-block transmissibility to create the flow redirection. Fig. 12 presents a first trial of this methodology. Suitable
transmissibilities have been obtained by trial and error. The recovery profile in region 1 in the dual-porosity model is even
closer to the single-porosity model. Region 2 shows an overestimated recovery at early-times and an underestimated recovery
at later-times, but the prediction has been improved.
Fig. 12: Recovery profile in regions 1 and 2 using the time-dependent shape factor in region 1 and the block-to-block effect to represent the oil reimbibition in region 2.
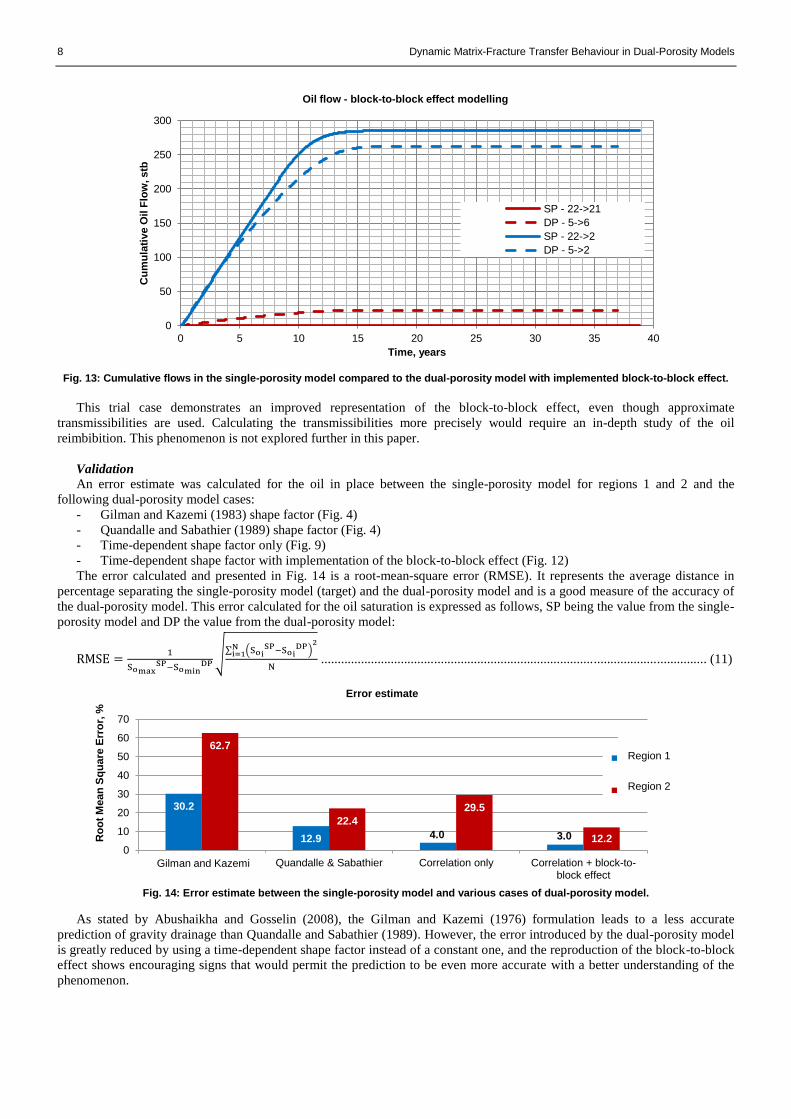
Fig. 13 shows oil flows in the single-porosity model compared to the dual-porosity model implemented with the block-to-
block effect and is to be compared with Fig. 10b. The oil flows mostly from fracture 5 to matrix 2 instead of flowing from
fracture 5 to fracture 6, which is closer to the behaviour of the single-porosity model. Hence, the oil flow has been successfully
redirected in the dual-porosity model. This confirms that the improvement of the recovery estimate seen in Fig. 12 for region 2
comes from a better representation of the oil reimbibition.
0
50
100
150
200
250
300
0 10 20 30 40
Oil
in
Pla
ce, stb
Time, years
Region 1
SP
DP
0
50
100
150
200
250
300
0 10 20 30 40
Oil
in
pla
ce, stb
Time, years
Region 2
SP
DP
8 Dynamic Matrix-Fracture Transfer Behaviour in Dual-Porosity Models
Fig. 13: Cumulative flows in the single-porosity model compared to the dual-porosity model with implemented block-to-block effect.
This trial case demonstrates an improved representation of the block-to-block effect, even though approximate
transmissibilities are used. Calculating the transmissibilities more precisely would require an in-depth study of the oil
reimbibition. This phenomenon is not explored further in this paper.
Validation
An error estimate was calculated for the oil in place between the single-porosity model for regions 1 and 2 and the
following dual-porosity model cases:
- Gilman and Kazemi (1983) shape factor (Fig. 4)
- Quandalle and Sabathier (1989) shape factor (Fig. 4)
- Time-dependent shape factor only (Fig. 9)
- Time-dependent shape factor with implementation of the block-to-block effect (Fig. 12)
The error calculated and presented in Fig. 14 is a root-mean-square error (RMSE). It represents the average distance in
percentage separating the single-porosity model (target) and the dual-porosity model and is a good measure of the accuracy of
the dual-porosity model. This error calculated for the oil saturation is expressed as follows, SP being the value from the single-
porosity model and DP the value from the dual-porosity model:
RMSE =1
SomaxSP−Somin
DP√∑ (Soi
SP−SoiDP)
2Ni=1
N .................................................................................................................... (11)
Fig. 14: Error estimate between the single-porosity model and various cases of dual-porosity model.
As stated by Abushaikha and Gosselin (2008), the Gilman and Kazemi (1976) formulation leads to a less accurate
prediction of gravity drainage than Quandalle and Sabathier (1989). However, the error introduced by the dual-porosity model
is greatly reduced by using a time-dependent shape factor instead of a constant one, and the reproduction of the block-to-block
effect shows encouraging signs that would permit the prediction to be even more accurate with a better understanding of the
phenomenon.
0
50
100
150
200
250
300
0 5 10 15 20 25 30 35 40
Cu
mu
lati
ve O
il F
low
, stb
Time, years
Oil flow - block-to-block effect modelling
SP - 22->21
DP - 5->6
SP - 22->2
DP - 5->2
30.2
12.9 4.0 3.0
62.7
22.4
29.5
12.2 0
10
20
30
40
50
60
70
Kazemi et al. Quandalle & Sabathier Correlation only Correlation + block-to-block effect
Ro
ot
Mean
Sq
ua
re E
rro
r, %
Error estimate
R1
R2
Region 1
Region 2
Gilman and Kazemi
Dynamic Matrix-Fracture Transfer Behaviour in Dual-Porosity Models 9
Generalisation to other matrix sizes
Time-dependent shape factor
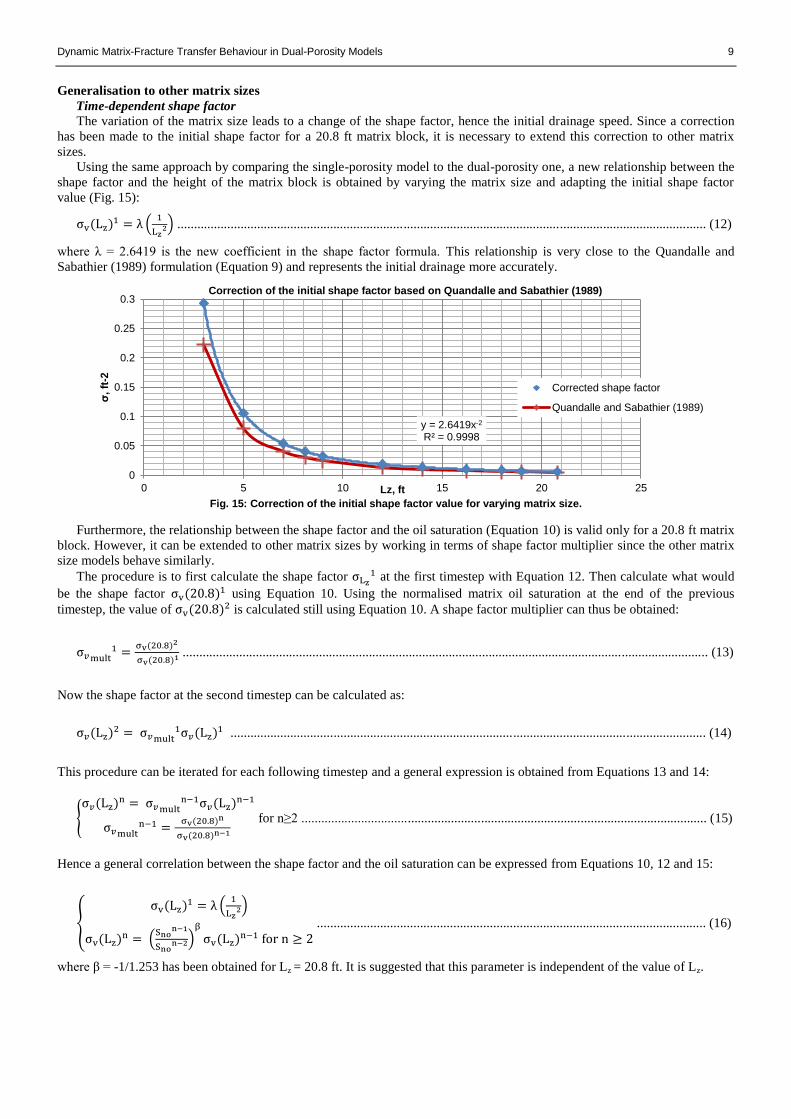
The variation of the matrix size leads to a change of the shape factor, hence the initial drainage speed. Since a correction
has been made to the initial shape factor for a 20.8 ft matrix block, it is necessary to extend this correction to other matrix
sizes.
Using the same approach by comparing the single-porosity model to the dual-porosity one, a new relationship between the
shape factor and the height of the matrix block is obtained by varying the matrix size and adapting the initial shape factor
value (Fig. 15):
σv(Lz)1 = λ (1
Lz2) ............................................................................................................................................................... (12)
where λ = 2.6419 is the new coefficient in the shape factor formula. This relationship is very close to the Quandalle and
Sabathier (1989) formulation (Equation 9) and represents the initial drainage more accurately.
Fig. 15: Correction of the initial shape factor value for varying matrix size.
Furthermore, the relationship between the shape factor and the oil saturation (Equation 10) is valid only for a 20.8 ft matrix
block. However, it can be extended to other matrix sizes by working in terms of shape factor multiplier since the other matrix
size models behave similarly.
The procedure is to first calculate the shape factor σLz1 at the first timestep with Equation 12. Then calculate what would
be the shape factor σv(20.8)1 using Equation 10. Using the normalised matrix oil saturation at the end of the previous
timestep, the value of σv(20.8)2 is calculated still using Equation 10. A shape factor multiplier can thus be obtained:
σ𝑣 mult1 =
σv(20.8)2
σv(20.8)1 .............................................................................................................................................................. (13)
Now the shape factor at the second timestep can be calculated as:
σ𝑣(Lz)2 = σ𝑣mult1σ𝑣(Lz)1 ............................................................................................................................................... (14)
This procedure can be iterated for each following timestep and a general expression is obtained from Equations 13 and 14:
{σ𝑣(Lz)n = σ𝑣mult
n−1σ𝑣(Lz)n−1
σ𝑣multn−1 =
σv(20.8)n
σv(20.8)n−1 for n≥2 .......................................................................................................................... (15)
Hence a general correlation between the shape factor and the oil saturation can be expressed from Equations 10, 12 and 15:
{
σv(Lz)1 = λ (1
Lz2)
σv(Lz)n = (Sno
n−1
Snon−2)
β
σv(Lz)n−1 for n ≥ 2 ..................................................................................................................... (16)
where β = -1/1.253 has been obtained for Lz = 20.8 ft. It is suggested that this parameter is independent of the value of Lz.
y = 2.6419x-2 R² = 0.9998
0
0.05
0.1
0.15
0.2
0.25
0.3
0 5 10 15 20 25
σ, ft
-2
Lz, ft
Correction of the initial shape factor based on Quandalle and Sabathier (1989)
Corrected shape factor
Quandalle and Sabathier (1989)
10 Dynamic Matrix-Fracture Transfer Behaviour in Dual-Porosity Models
Block-to-block effect
The variation in matrix size results in a change of the fluid initially in place. The drainage speed also changes. As a result,
the block-to-block transmissibility needs to be modified accordingly. A further study of the block-to-block effect is required to
account for the changes in matrix size.
Validation
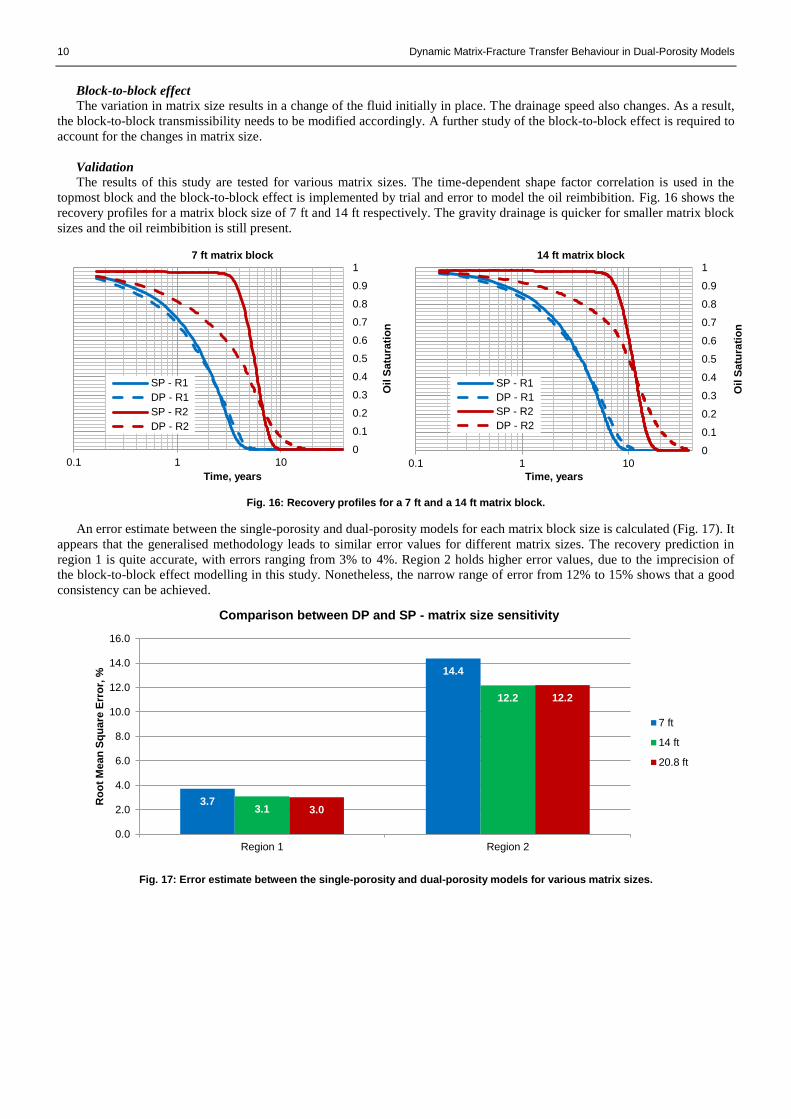
The results of this study are tested for various matrix sizes. The time-dependent shape factor correlation is used in the
topmost block and the block-to-block effect is implemented by trial and error to model the oil reimbibition. Fig. 16 shows the
recovery profiles for a matrix block size of 7 ft and 14 ft respectively. The gravity drainage is quicker for smaller matrix block
sizes and the oil reimbibition is still present.
Fig. 16: Recovery profiles for a 7 ft and a 14 ft matrix block.
An error estimate between the single-porosity and dual-porosity models for each matrix block size is calculated (Fig. 17). It
appears that the generalised methodology leads to similar error values for different matrix sizes. The recovery prediction in
region 1 is quite accurate, with errors ranging from 3% to 4%. Region 2 holds higher error values, due to the imprecision of
the block-to-block effect modelling in this study. Nonetheless, the narrow range of error from 12% to 15% shows that a good
consistency can be achieved.
Fig. 17: Error estimate between the single-porosity and dual-porosity models for various matrix sizes.
0
0.1
0.2
0.3
0.4
0.5
0.6
0.7
0.8
0.9
1
0.1 1 10
Oil
Satu
rati
on
Time, years
7 ft matrix block
SP - R1
DP - R1
SP - R2
DP - R2
0
0.1
0.2
0.3
0.4
0.5
0.6
0.7
0.8
0.9
1
0.1 1 10
Oil
Satu
rati
on
Time, years
14 ft matrix block
SP - R1
DP - R1
SP - R2
DP - R2
3.7
14.4
3.1
12.2
3.0
12.2
0.0
2.0
4.0
6.0
8.0
10.0
12.0
14.0
16.0
Region 1 Region 2
Ro
ot
Mean
Sq
ua
re E
rro
r, %
Comparison between DP and SP - matrix size sensitivity
7 ft
14 ft
20.8 ft
Dynamic Matrix-Fracture Transfer Behaviour in Dual-Porosity Models 11
Relative permeability sensitivity
Simple relative permeability curves have been generated by means of generalised Corey correlations for oil and gas (Corey
(1954)):
kro(Sg) = kro(Sgc) (1−Sg−Soc
1−Sgc−Soc)
no
...................................................................................................................................... (17)
krg(Sg) = krg(Swc) (Sg−Sgc
1−Sgc−Soc)
ng
...................................................................................................................................... (18)
where kro(Sgc) and krg(Swc) are the end-point relative permeability values, Sg is the gas saturation, Sgc, Soc and Swc are the end-
point saturations and no and ng are the Corey exponents for oil and gas respectively. The end-point relative permeability values
and the end-point saturations can be found in Table 3.
Table 3: Saturation endpoints.
Property Description Value Sgr Residual gas saturation 0
Sor Residual oil saturation 0
Sgc Critical gas saturation 0
Soc Critical oil saturation 0
Swc Connate water saturation 0
kro(Sgc) Oil relative permeability at residual gas saturation 1
krg(Swc) Gas relative permeability at connate water saturation 1
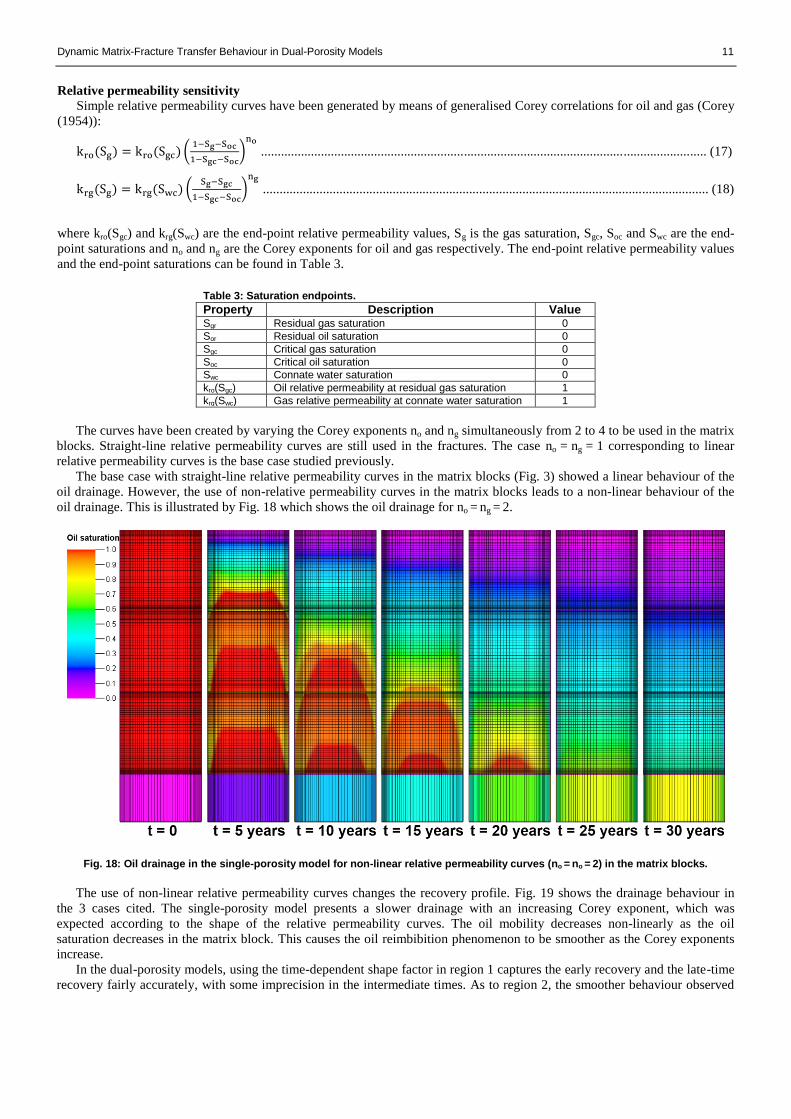
The curves have been created by varying the Corey exponents no and ng simultaneously from 2 to 4 to be used in the matrix
blocks. Straight-line relative permeability curves are still used in the fractures. The case no = ng = 1 corresponding to linear
relative permeability curves is the base case studied previously.
The base case with straight-line relative permeability curves in the matrix blocks (Fig. 3) showed a linear behaviour of the
oil drainage. However, the use of non-relative permeability curves in the matrix blocks leads to a non-linear behaviour of the
oil drainage. This is illustrated by Fig. 18 which shows the oil drainage for no = ng = 2.
Fig. 18: Oil drainage in the single-porosity model for non-linear relative permeability curves (no = no = 2) in the matrix blocks.
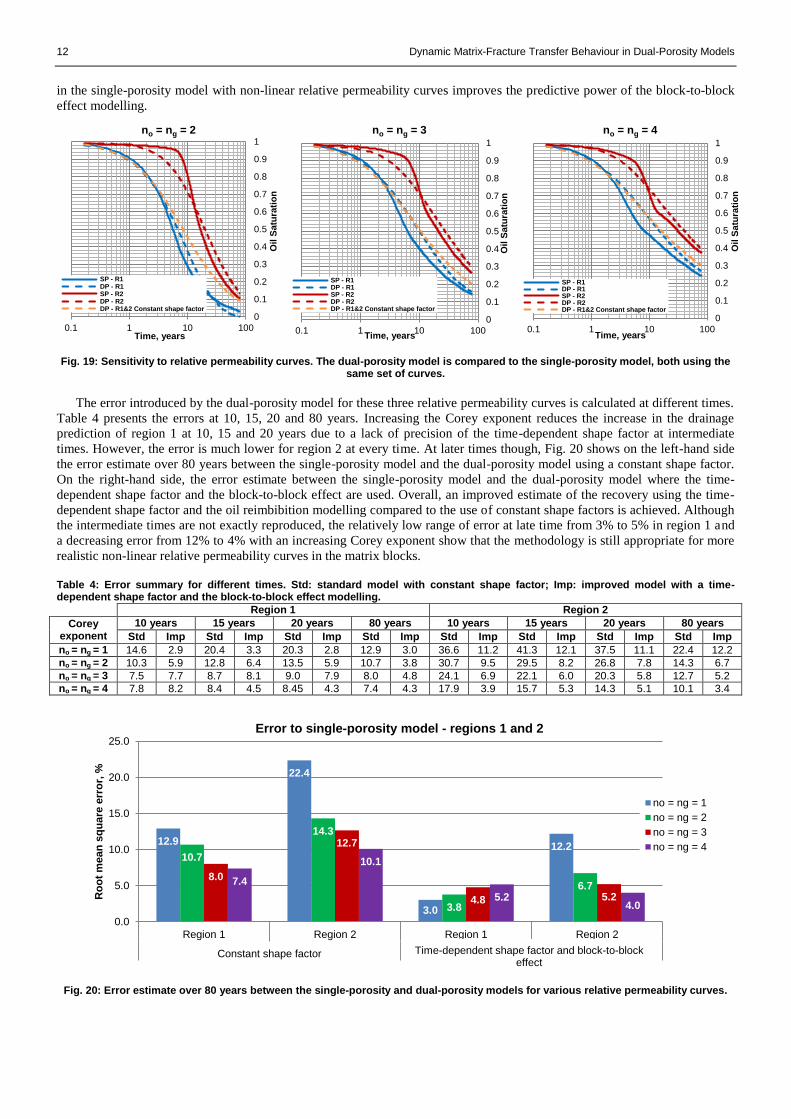
The use of non-linear relative permeability curves changes the recovery profile. Fig. 19 shows the drainage behaviour in
the 3 cases cited. The single-porosity model presents a slower drainage with an increasing Corey exponent, which was
expected according to the shape of the relative permeability curves. The oil mobility decreases non-linearly as the oil
saturation decreases in the matrix block. This causes the oil reimbibition phenomenon to be smoother as the Corey exponents
increase.
In the dual-porosity models, using the time-dependent shape factor in region 1 captures the early recovery and the late-time
recovery fairly accurately, with some imprecision in the intermediate times. As to region 2, the smoother behaviour observed
12 Dynamic Matrix-Fracture Transfer Behaviour in Dual-Porosity Models
in the single-porosity model with non-linear relative permeability curves improves the predictive power of the block-to-block
effect modelling.
Fig. 19: Sensitivity to relative permeability curves. The dual-porosity model is compared to the single-porosity model, both using the same set of curves.
The error introduced by the dual-porosity model for these three relative permeability curves is calculated at different times.
Table 4 presents the errors at 10, 15, 20 and 80 years. Increasing the Corey exponent reduces the increase in the drainage
prediction of region 1 at 10, 15 and 20 years due to a lack of precision of the time-dependent shape factor at intermediate
times. However, the error is much lower for region 2 at every time. At later times though, Fig. 20 shows on the left-hand side
the error estimate over 80 years between the single-porosity model and the dual-porosity model using a constant shape factor.
On the right-hand side, the error estimate between the single-porosity model and the dual-porosity model where the time-
dependent shape factor and the block-to-block effect are used. Overall, an improved estimate of the recovery using the time-
dependent shape factor and the oil reimbibition modelling compared to the use of constant shape factors is achieved. Although
the intermediate times are not exactly reproduced, the relatively low range of error at late time from 3% to 5% in region 1 and
a decreasing error from 12% to 4% with an increasing Corey exponent show that the methodology is still appropriate for more
realistic non-linear relative permeability curves in the matrix blocks.
Table 4: Error summary for different times. Std: standard model with constant shape factor; Imp: improved model with a time-dependent shape factor and the block-to-block effect modelling.
Region 1 Region 2
Corey exponent
10 years 15 years 20 years 80 years 10 years 15 years 20 years 80 years
Std Imp Std Imp Std Imp Std Imp Std Imp Std Imp Std Imp Std Imp
no = ng = 1 14.6 2.9 20.4 3.3 20.3 2.8 12.9 3.0 36.6 11.2 41.3 12.1 37.5 11.1 22.4 12.2
no = ng = 2 10.3 5.9 12.8 6.4 13.5 5.9 10.7 3.8 30.7 9.5 29.5 8.2 26.8 7.8 14.3 6.7
no = ng = 3 7.5 7.7 8.7 8.1 9.0 7.9 8.0 4.8 24.1 6.9 22.1 6.0 20.3 5.8 12.7 5.2
no = ng = 4 7.8 8.2 8.4 4.5 8.45 4.3 7.4 4.3 17.9 3.9 15.7 5.3 14.3 5.1 10.1 3.4
Fig. 20: Error estimate over 80 years between the single-porosity and dual-porosity models for various relative permeability curves.
0
0.1
0.2
0.3
0.4
0.5
0.6
0.7
0.8
0.9
1
0.1 1 10 100
Oil S
atu
rati
on
Time, years
no = ng = 2
SP - R1DP - R1SP - R2DP - R2DP - R1&2 Constant shape factor
0
0.1
0.2
0.3
0.4
0.5
0.6
0.7
0.8
0.9
1
0.1 1 10 100
Oil S
atu
rati
on
Time, years
no = ng = 3
SP - R1DP - R1SP - R2DP - R2DP - R1&2 Constant shape factor
0
0.1
0.2
0.3
0.4
0.5
0.6
0.7
0.8
0.9
1
0.1 1 10 100
Oil S
atu
rati
on
Time, years
no = ng = 4
SP - R1DP - R1SP - R2DP - R2DP - R1&2 Constant shape factor
12.9
22.4
3.0
12.2 10.7
14.3
3.8
6.7 8.0
12.7
4.8 5.2
7.4
10.1
5.2 4.0
0.0
5.0
10.0
15.0
20.0
25.0
Region 1 Region 2 Region 1 Region 2
Constant shape factor Improvement
Ro
ot
mean
sq
ua
re e
rro
r, %
Error to single-porosity model - regions 1 and 2
no = ng = 1
no = ng = 2
no = ng = 3
no = ng = 4
Time-dependent shape factor and block-to-block effect
Dynamic Matrix-Fracture Transfer Behaviour in Dual-Porosity Models 13
Computation time comparison
Table 5 presents a summary of the computation times of the single-porosity model and the dual-porosity model. On the one
hand, the single-porosity model requires very high computation times and is increasing with the Corey exponents used. The
simulations take days to be processed but results in a precise description of the physics involved. An anomaly is observed in
the case where the Corey exponents no = ng = 2, but it still shows a very high computation time. On the other hand, the dual-
porosity model with a constant shape factor requires only seconds to be processed. However, the drainage prediction is not
accurate and some physical phenomena such as the oil reimbibition are missed out.
The methodology developed in this paper improved the drainage prediction in the dual-porosity model. The combined
effects of the time-dependent shape factor and the block-to-block effect modelling increased the predictive power of the coarse
dual-porosity model. This improved accuracy leads to a cost in terms of computation time compared to the dual-porosity
model with a constant shape factor. Nevertheless, this cost is minimal compared to the amount of time needed to run the
single-porosity model. A trend is observed here. Increasing the Corey exponents reduced the computation time gradually while
the opposite occurs for the single-porosity model. This may be due to the smoother behaviour of the dual-porosity model for
relative permeability curves with higher Corey exponents.
Table 5: Approximate computation time of the single-porosity model and two different dual-porosity models for different relative permeability curves.
Corey exponent of the relative permeability
curves
Single-porosity model
Dual-porosity model
Constant shape factor
Time-dependent shape factor and block-to-block effect modelling
no = ng = 1 73082 s [20 h] 15 s 360 s
no = ng = 2 290708 s [81 h] 9 s 237 s
no = ng = 3 209467 s [58 h] 13 s 36 s
no = ng = 4 336971 s [94 h] 11 s 31 s
Gridblock size sensitivity
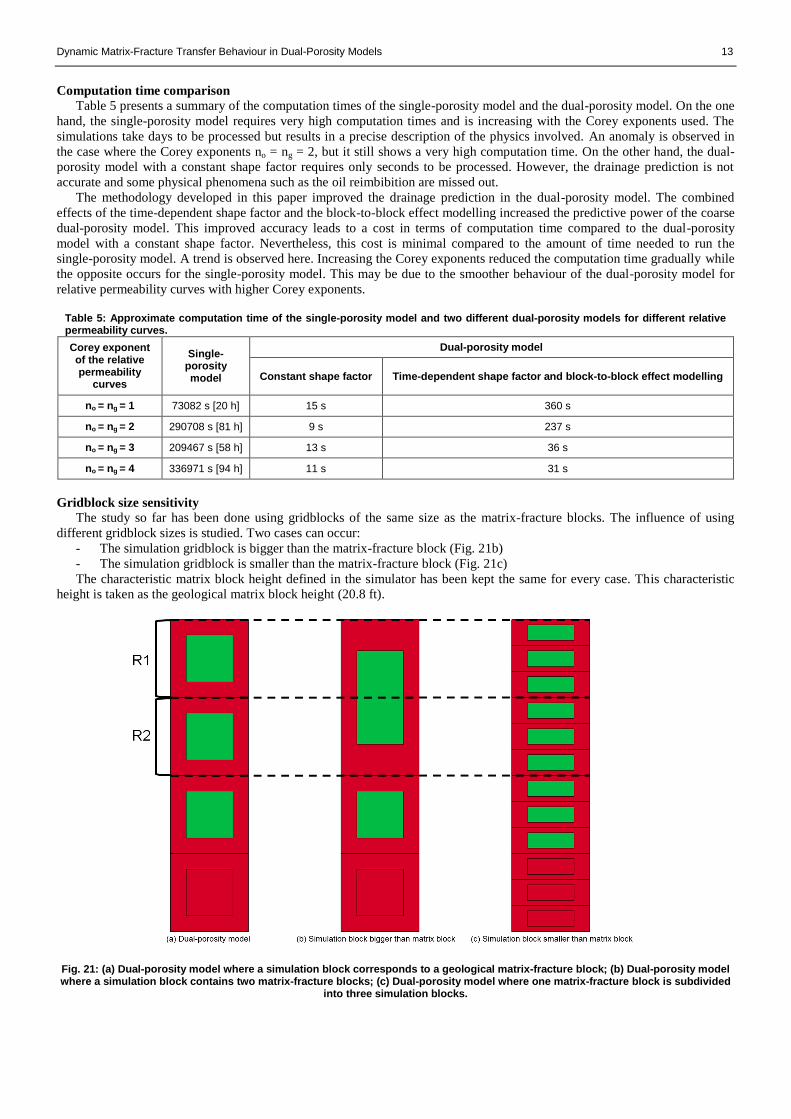
The study so far has been done using gridblocks of the same size as the matrix-fracture blocks. The influence of using
different gridblock sizes is studied. Two cases can occur:
- The simulation gridblock is bigger than the matrix-fracture block (Fig. 21b)
- The simulation gridblock is smaller than the matrix-fracture block (Fig. 21c)
The characteristic matrix block height defined in the simulator has been kept the same for every case. This characteristic
height is taken as the geological matrix block height (20.8 ft).
Fig. 21: (a) Dual-porosity model where a simulation block corresponds to a geological matrix-fracture block; (b) Dual-porosity model where a simulation block contains two matrix-fracture blocks; (c) Dual-porosity model where one matrix-fracture block is subdivided
into three simulation blocks.
14 Dynamic Matrix-Fracture Transfer Behaviour in Dual-Porosity Models
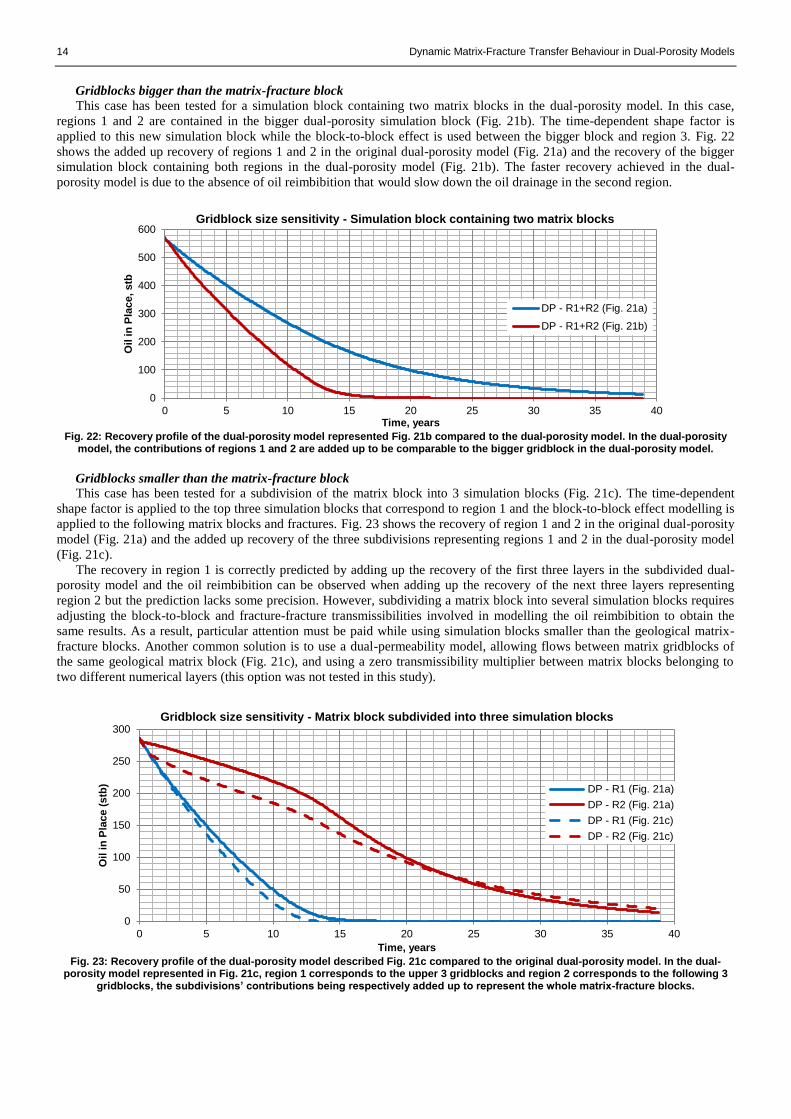
Gridblocks bigger than the matrix-fracture block
This case has been tested for a simulation block containing two matrix blocks in the dual-porosity model. In this case,
regions 1 and 2 are contained in the bigger dual-porosity simulation block (Fig. 21b). The time-dependent shape factor is
applied to this new simulation block while the block-to-block effect is used between the bigger block and region 3. Fig. 22
shows the added up recovery of regions 1 and 2 in the original dual-porosity model (Fig. 21a) and the recovery of the bigger
simulation block containing both regions in the dual-porosity model (Fig. 21b). The faster recovery achieved in the dual-
porosity model is due to the absence of oil reimbibition that would slow down the oil drainage in the second region.
Fig. 22: Recovery profile of the dual-porosity model represented Fig. 21b compared to the dual-porosity model. In the dual-porosity
model, the contributions of regions 1 and 2 are added up to be comparable to the bigger gridblock in the dual-porosity model.
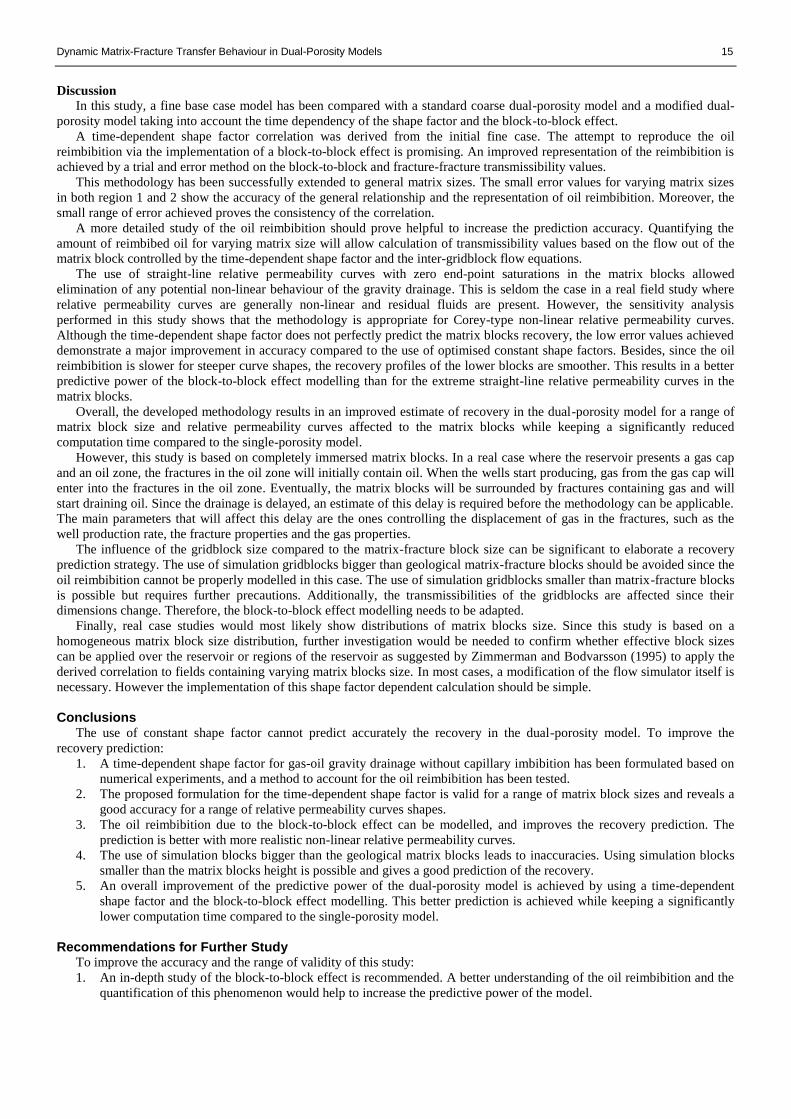
Gridblocks smaller than the matrix-fracture block
This case has been tested for a subdivision of the matrix block into 3 simulation blocks (Fig. 21c). The time-dependent
shape factor is applied to the top three simulation blocks that correspond to region 1 and the block-to-block effect modelling is
applied to the following matrix blocks and fractures. Fig. 23 shows the recovery of region 1 and 2 in the original dual-porosity
model (Fig. 21a) and the added up recovery of the three subdivisions representing regions 1 and 2 in the dual-porosity model
(Fig. 21c).
The recovery in region 1 is correctly predicted by adding up the recovery of the first three layers in the subdivided dual-
porosity model and the oil reimbibition can be observed when adding up the recovery of the next three layers representing
region 2 but the prediction lacks some precision. However, subdividing a matrix block into several simulation blocks requires
adjusting the block-to-block and fracture-fracture transmissibilities involved in modelling the oil reimbibition to obtain the
same results. As a result, particular attention must be paid while using simulation blocks smaller than the geological matrix-
fracture blocks. Another common solution is to use a dual-permeability model, allowing flows between matrix gridblocks of
the same geological matrix block (Fig. 21c), and using a zero transmissibility multiplier between matrix blocks belonging to
two different numerical layers (this option was not tested in this study).
Fig. 23: Recovery profile of the dual-porosity model described Fig. 21c compared to the original dual-porosity model. In the dual-
porosity model represented in Fig. 21c, region 1 corresponds to the upper 3 gridblocks and region 2 corresponds to the following 3 gridblocks, the subdivisions’ contributions being respectively added up to represent the whole matrix-fracture blocks.
0
100
200
300
400
500
600
0 5 10 15 20 25 30 35 40
Oil
in
Pla
ce, stb
Time, years
Gridblock size sensitivity - Simulation block containing two matrix blocks
DP - R1+R2 (Fig. 21a)
DP - R1+R2 (Fig. 21b)
0
50
100
150
200
250
300
0 5 10 15 20 25 30 35 40
Oil
in
Pla
ce (
stb
)
Time, years
Gridblock size sensitivity - Matrix block subdivided into three simulation blocks
DP - R1 (Fig. 21a)
DP - R2 (Fig. 21a)
DP - R1 (Fig. 21c)
DP - R2 (Fig. 21c)
Dynamic Matrix-Fracture Transfer Behaviour in Dual-Porosity Models 15
Discussion
In this study, a fine base case model has been compared with a standard coarse dual-porosity model and a modified dual-
porosity model taking into account the time dependency of the shape factor and the block-to-block effect.
A time-dependent shape factor correlation was derived from the initial fine case. The attempt to reproduce the oil
reimbibition via the implementation of a block-to-block effect is promising. An improved representation of the reimbibition is
achieved by a trial and error method on the block-to-block and fracture-fracture transmissibility values.
This methodology has been successfully extended to general matrix sizes. The small error values for varying matrix sizes
in both region 1 and 2 show the accuracy of the general relationship and the representation of oil reimbibition. Moreover, the
small range of error achieved proves the consistency of the correlation.
A more detailed study of the oil reimbibition should prove helpful to increase the prediction accuracy. Quantifying the
amount of reimbibed oil for varying matrix size will allow calculation of transmissibility values based on the flow out of the
matrix block controlled by the time-dependent shape factor and the inter-gridblock flow equations.
The use of straight-line relative permeability curves with zero end-point saturations in the matrix blocks allowed
elimination of any potential non-linear behaviour of the gravity drainage. This is seldom the case in a real field study where
relative permeability curves are generally non-linear and residual fluids are present. However, the sensitivity analysis
performed in this study shows that the methodology is appropriate for Corey-type non-linear relative permeability curves.
Although the time-dependent shape factor does not perfectly predict the matrix blocks recovery, the low error values achieved
demonstrate a major improvement in accuracy compared to the use of optimised constant shape factors. Besides, since the oil
reimbibition is slower for steeper curve shapes, the recovery profiles of the lower blocks are smoother. This results in a better
predictive power of the block-to-block effect modelling than for the extreme straight-line relative permeability curves in the
matrix blocks.
Overall, the developed methodology results in an improved estimate of recovery in the dual-porosity model for a range of
matrix block size and relative permeability curves affected to the matrix blocks while keeping a significantly reduced
computation time compared to the single-porosity model.
However, this study is based on completely immersed matrix blocks. In a real case where the reservoir presents a gas cap
and an oil zone, the fractures in the oil zone will initially contain oil. When the wells start producing, gas from the gas cap will
enter into the fractures in the oil zone. Eventually, the matrix blocks will be surrounded by fractures containing gas and will
start draining oil. Since the drainage is delayed, an estimate of this delay is required before the methodology can be applicable.
The main parameters that will affect this delay are the ones controlling the displacement of gas in the fractures, such as the
well production rate, the fracture properties and the gas properties.
The influence of the gridblock size compared to the matrix-fracture block size can be significant to elaborate a recovery
prediction strategy. The use of simulation gridblocks bigger than geological matrix-fracture blocks should be avoided since the
oil reimbibition cannot be properly modelled in this case. The use of simulation gridblocks smaller than matrix-fracture blocks
is possible but requires further precautions. Additionally, the transmissibilities of the gridblocks are affected since their
dimensions change. Therefore, the block-to-block effect modelling needs to be adapted.
Finally, real case studies would most likely show distributions of matrix blocks size. Since this study is based on a
homogeneous matrix block size distribution, further investigation would be needed to confirm whether effective block sizes
can be applied over the reservoir or regions of the reservoir as suggested by Zimmerman and Bodvarsson (1995) to apply the
derived correlation to fields containing varying matrix blocks size. In most cases, a modification of the flow simulator itself is
necessary. However the implementation of this shape factor dependent calculation should be simple.
Conclusions The use of constant shape factor cannot predict accurately the recovery in the dual-porosity model. To improve the
recovery prediction:
1. A time-dependent shape factor for gas-oil gravity drainage without capillary imbibition has been formulated based on
numerical experiments, and a method to account for the oil reimbibition has been tested.
2. The proposed formulation for the time-dependent shape factor is valid for a range of matrix block sizes and reveals a
good accuracy for a range of relative permeability curves shapes.
3. The oil reimbibition due to the block-to-block effect can be modelled, and improves the recovery prediction. The
prediction is better with more realistic non-linear relative permeability curves.
4. The use of simulation blocks bigger than the geological matrix blocks leads to inaccuracies. Using simulation blocks
smaller than the matrix blocks height is possible and gives a good prediction of the recovery.
5. An overall improvement of the predictive power of the dual-porosity model is achieved by using a time-dependent
shape factor and the block-to-block effect modelling. This better prediction is achieved while keeping a significantly
lower computation time compared to the single-porosity model.
Recommendations for Further Study To improve the accuracy and the range of validity of this study:
1. An in-depth study of the block-to-block effect is recommended. A better understanding of the oil reimbibition and the
quantification of this phenomenon would help to increase the predictive power of the model.
16 Dynamic Matrix-Fracture Transfer Behaviour in Dual-Porosity Models
2. The effect of capillary pressure needs to be thoroughly studied to elaborate an even more general model to describe the
gas-oil gravity drainage.
3. The water-oil gravity drainage study is also recommended in order to develop a general model for the gravity drainage
recovery mechanism.
4. Testing against fields with relevant production history is recommended.
5. This work focuses on the shape factor and is based on a transfer function formulation existing in reservoir simulators.
A change of focus to the improvement of the transfer function would be a path to explore.
Nomenclature α Fluid phase
Bg Gas formation volume factor
Bo Oil formation volume factor
cf Rock compressibility (psi-1
)
cp Centipoise
DP Dual-porosity
Fig. Figure
ft Foot
km Matrix permeability (mD)
kf Fracture permeability (mD)
𝑘𝑟𝑔(𝑆𝑔) Gas relative permeability at Sg
𝑘𝑟𝑜(𝑆𝑔) Oil relative permeability at Sg
λ Mobility
Lx Matrix dimension in the direction x
Ly Matrix dimension in the direction y
Lz Matrix dimension in the direction z
lb Pound (mass unit)
mD Milli-darcy
µo Viscosity of oil (cp)
µg Viscosity of gas (cp)
n Timestep
no Corey exponent for oil relative permeability
ng Corey exponent for gas relative permeability
p Pressure (psi)
Фf Fracture porosity
Фm Matrix porosity
𝑝𝑐𝑔𝑜 Gas-oil capillary pressure
𝑝𝑓 Fracture pressure (psi)
𝑝𝑖 Average initial reservoir pressure (psi)
𝑝𝑚 Matrix pressure (psi)
psi Pounds mass per square inch
𝑅𝑠 Solution gas ratio (Mscf/stb)
𝜎 Shape factor
𝜎ℎ Shape factor in the horizontal direction
𝜎𝑣 Shape factor in the vertical direction
scf Standard cubic foot
𝑆𝑔 Gas saturation
𝑆𝑔𝑐 Critical gas saturation
𝑆𝑔𝑟 Residual gas saturation
𝑆𝑛𝑜 Normalised oil saturation
𝑆𝑜 Oil saturation
𝑆𝑜𝑐 Critical oil saturation
𝑆𝑜𝑟 Residual oil saturation
SP Single-porosity
𝑆𝑤𝑐 Connate water saturation
stb Stock-tank barrel
τ Matrix-fracture transfer function
References Abushaikha, A.S.A. and Gosselin, O.R. 2008. Matrix-Fracture Transfer Function in Dual-Media Flow Simulation: Review, Comparison and
Validation. Paper SPE 113890 presented at the Europec/EAGE Conference and Exhibition, Rome, Italy, 9-12 June.
DOI:10.2118/113890-MS.
Barenblatt, G.I., Zheltov, Iu.P. and Kochina, I.N. 1960. Basic Concepts in the Theory of Seepage of Homogeneous Liquids in Fissured
Rocks (Strata). Journal of Applied Mathematics and Mechanics 24 (5): 852-864.
Chang, M. 1993. Deriving the Shape Factor of a Fractured Rock Matrix. Technical Report NIPER-696 (DE93000170), NIPER, Bartlesville,
Oklahoma.
Coats, K.H. 1989. Implicit Compositional Simulation of Single-Porosity and Dual-Porosity Reservoirs. Paper SPE 18427 presented at the
SPE Symposium on Reservoir Simulation, Houston, Texas, 6-8 February. DOI: 10.2118/18427-MS.
Corey, A.T. 1954. The Interrelation Between Gas and Oil Relative Permeabilities. Producers Monthly 19 (1): 38-41
Gilman, J.R. and Kazemi, H. 1983. Improvement in Simulation of Naturally Fractured Reservoirs. SPE J. 23 (4): 695-707. SPE-10511-PA.
DOI: 10.2118/10511-PA.
Kazemi, H., Merrill, L.S., Porterfield, K.L. and Zeman, P.R. 1976. Numerical Simulation of Water-Oil Flow in Naturally Fractured
Reservoirs. SPE J. 16 (6): 317-326. SPE-5719-PA. DOI: 10.2118/5719-PA.
Lim, K.T. and Aziz, K. 1995. Matrix-Fracture Transfer Shape Factors for Dual-Porosity Simulators. Journal of Petroleum Science and
Engineering 13: 169-178.
Quandalle, P. And Sabathier, J.C. 1989. Typical Features of a Multipurpose Reservoir Simulator. SPE Res Eng 4 (4): 475-480. SPE-16007-
PA. DOI: 10.2118/16007-PA.
Saidi, A.M. 1987. Reservoir Engineering of Fracture Reservoirs (Fundamental and Practical Aspects). Paris: Total Edition Presse.
Schlumberger 2012. Eclipse Reservoir Simulation Software Technical Description.
Warren, J.E. and Root, P.J. 1963. The Behavior of Naturally Fractured Reservoirs. SPE J. 3 (3): 245-255. SPE-426-PA. DOI: 10.2118/426-
PA.
Zimmerman, R.W. and Bodvarsson G.S. 1995. Effective Block Size for Imbibition or Absorption in Dual-Porosity Media. Geophysical
Research Letters 22 (11): 1461-1464.
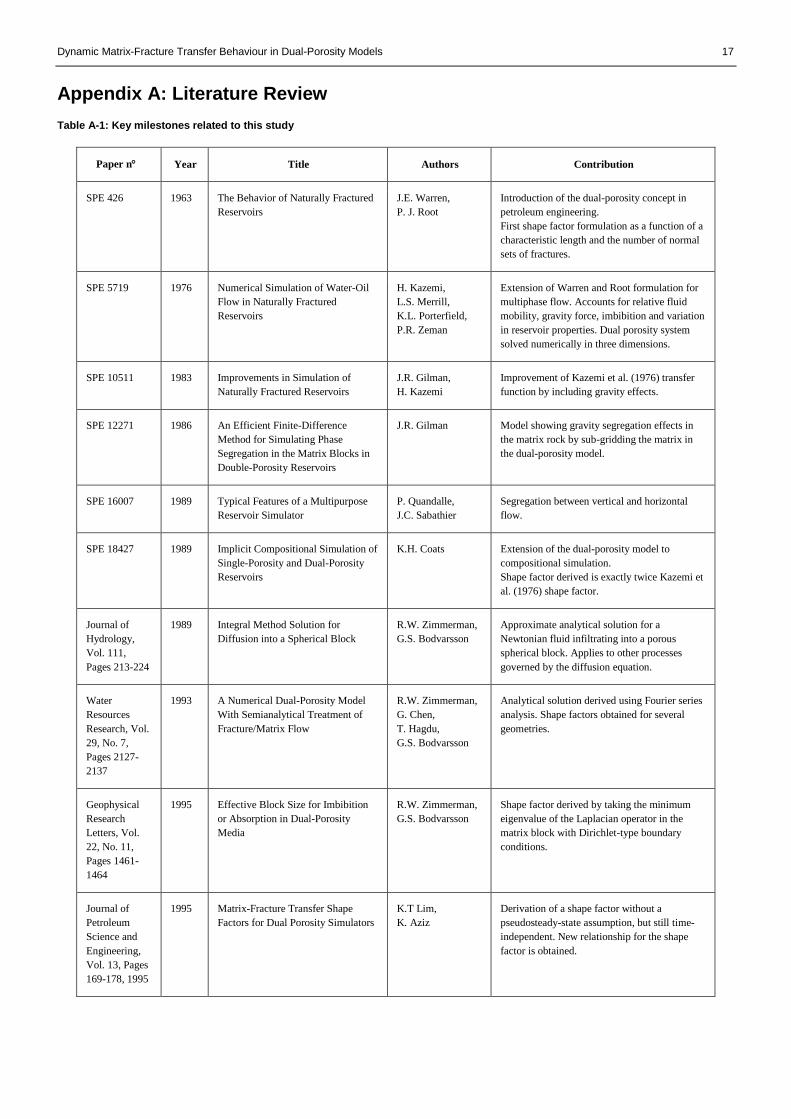
Dynamic Matrix-Fracture Transfer Behaviour in Dual-Porosity Models 17
Appendix A: Literature Review
Table A-1: Key milestones related to this study
Paper n Year Title Authors Contribution
SPE 426 1963 The Behavior of Naturally Fractured
Reservoirs
J.E. Warren,
P. J. Root
Introduction of the dual-porosity concept in
petroleum engineering.
First shape factor formulation as a function of a
characteristic length and the number of normal
sets of fractures.
SPE 5719 1976 Numerical Simulation of Water-Oil
Flow in Naturally Fractured
Reservoirs
H. Kazemi,
L.S. Merrill,
K.L. Porterfield,
P.R. Zeman
Extension of Warren and Root formulation for
multiphase flow. Accounts for relative fluid
mobility, gravity force, imbibition and variation
in reservoir properties. Dual porosity system
solved numerically in three dimensions.
SPE 10511 1983 Improvements in Simulation of
Naturally Fractured Reservoirs
J.R. Gilman,
H. Kazemi
Improvement of Kazemi et al. (1976) transfer
function by including gravity effects.
SPE 12271 1986 An Efficient Finite-Difference
Method for Simulating Phase
Segregation in the Matrix Blocks in
Double-Porosity Reservoirs
J.R. Gilman Model showing gravity segregation effects in
the matrix rock by sub-gridding the matrix in
the dual-porosity model.
SPE 16007 1989 Typical Features of a Multipurpose
Reservoir Simulator
P. Quandalle,
J.C. Sabathier
Segregation between vertical and horizontal
flow.
SPE 18427 1989 Implicit Compositional Simulation of
Single-Porosity and Dual-Porosity
Reservoirs
K.H. Coats Extension of the dual-porosity model to
compositional simulation.
Shape factor derived is exactly twice Kazemi et
al. (1976) shape factor.
Journal of
Hydrology,
Vol. 111,
Pages 213-224
1989 Integral Method Solution for
Diffusion into a Spherical Block
R.W. Zimmerman,
G.S. Bodvarsson
Approximate analytical solution for a
Newtonian fluid infiltrating into a porous
spherical block. Applies to other processes
governed by the diffusion equation.
Water
Resources
Research, Vol.
29, No. 7,
Pages 2127-
2137
1993 A Numerical Dual-Porosity Model
With Semianalytical Treatment of
Fracture/Matrix Flow
R.W. Zimmerman,
G. Chen,
T. Hagdu,
G.S. Bodvarsson
Analytical solution derived using Fourier series
analysis. Shape factors obtained for several
geometries.
Geophysical
Research
Letters, Vol.
22, No. 11,
Pages 1461-
1464
1995 Effective Block Size for Imbibition
or Absorption in Dual-Porosity
Media
R.W. Zimmerman,
G.S. Bodvarsson
Shape factor derived by taking the minimum
eigenvalue of the Laplacian operator in the
matrix block with Dirichlet-type boundary
conditions.
Journal of
Petroleum
Science and
Engineering,
Vol. 13, Pages
169-178, 1995
1995 Matrix-Fracture Transfer Shape
Factors for Dual Porosity Simulators
K.T Lim,
K. Aziz
Derivation of a shape factor without a
pseudosteady-state assumption, but still time-
independent. New relationship for the shape
factor is obtained.

18 Dynamic Matrix-Fracture Transfer Behaviour in Dual-Porosity Models
SPE 95241 2005 The Effect of Fracture Relative
Permeability and Capillary Pressures
on the Numerical Simulation of
Naturally Fractured Reservoirs
J.J. de la Porte,
C.A. Kossack,
R.W. Zimmerman
Guidelines for the proper use of relative
permeability curves in the fractures.
SPE 102542 2006 General Transfer Functions for
Multiphase Flow in Fractured
Reservoirs
H. Lu,
G. Di Donato,
M.J. Blunt
General Transfer Functions for fracture/matrix
flow that accounts for fluid expansion,
diffusion and displacement.
Separation of the contributions of each recovery
mechanism.
SPE 107007 2007 General Fracture/Matrix Transfer
Functions for Mixed-Wet Systems
H. Lu,
M.J. Blunt
Extension of the General Transfer Functions for
mixed-wet reservoirs.
SPE 113890 2008 Matrix-Fracture Transfer Function in
Dual-Medium Flow Simulation:
Review, Comparison, and Validation
A.S.A.
Abushaikha,
O.R. Gosselin
Review of many shape factors formulations.
Derivation of the Quandalle and Sabathier
(1989) shape factor.
Dynamic Matrix-Fracture Transfer Behaviour in Dual-Porosity Models 19
SPE 426 (1963)
The Behavior of Naturally Fractured Reservoirs
Authors: Warren, J.E. and Root, P.J.
Contribution to the understanding of matrix-fracture transfers:
Introduction of the dual porosity concept in petroleum engineering.
The matrix-fracture transfer function controlled by the shape factor is presented. A first formulation of the shape factor is
given as σ =4N(N+2)
L2 where N is the number of normal sets of fractures and L a characteristic length.
Objective of the paper:
Propose a model for a better understanding of the behaviour of naturally fractured reservoirs.
Methodology used:
Derivation and resolution of the diffusivity equation
Assumptions used:
a. The primary porosity is homogeneous and isotropic, and is constituted by a set of identical rectangular parallelepipeds.
b. The secondary porosity is constituted of a set of continuous and uniform orthogonal fractures.
c. The system primary-secondary porosities is homogeneous but anisotropic. Flow between the primary and the secondary
porosities is possible, while no flow can occur between two elements of the primary porosity.
Conclusion reached:
1. The primary porosity (matrix) contributes mainly to the pore volume but not to flow capacity while the major
contribution of the secondary porosity (fractures) is for flow capacity
2. Two parameters are enough to characterise the deviation between an homogeneous porous medium and a “double
porosity” medium’s behaviour.
3. These parameters can be evaluated by an analysis of pressure build-up data.
Comments:
This paper is the basis of most of the more recent studies and shape factor formulations.
20 Dynamic Matrix-Fracture Transfer Behaviour in Dual-Porosity Models
SPE 5719 (1976)
Numerical Simulation of Water-Oil Flow in Naturally Fractured Reservoirs
Authors: Kazemi, H., Merrill, L.S., Porterfield, K.L. and Zeman, P.R.
Contribution to the understanding of matrix-fracture transfers:
Extension of Warren and Root formulation for multiphase flow. Accounts for relative fluid mobility, gravity force, imbibition
and variation in reservoir properties. Dual porosity system solved numerically in three dimensions.
New shape factor derived from finite-difference formulation as σ = 4 (1
Lx2 +
1
Ly2 +
1
Lz2)
Objective of the paper:
Modelling of water-oil flow in naturally fractured reservoirs.
Methodology used:
Based on Darcy’s law and Warren and Root model, derivation of finite-difference equations using the following assumptions:
- the fractures form a continuum but the matrix blocks are non-continuous
- the fractures are the boundaries of the matrix blocks
Conclusion reached:
1. Numerical simulator can handle 3D, single phase and two-phase flow of water and oil in fractured reservoirs
2. Simulator accounts for relative fluid mobility, gravity force, imbibition and variation of reservoir properties
3. Handling of uniformly and non-uniformly distributed fractures, but also no fractures.
Comments:
One of the commonly used formula for the shape factor.
Dynamic Matrix-Fracture Transfer Behaviour in Dual-Porosity Models 21
SPE 10511 (1983)
Improvements in Simulation of Naturally Fractured Reservoirs
Authors: Gilman, J.R. and Kazemi, H.
Contribution to the understanding of matrix-fracture transfers:
Improvement of Kazemi et al. (1976) transfer function by including gravity effects.
Objective of the paper:
Improve the Kazemi et al. (1976) formulation
Methodology used:
Flow equations solved by the Netwon-Raphson method.
Chemical transport equations solved sequentially after all other unknowns are solved.
Partial eliminations of matrix before Gaussian elimination.
Implementation of gravity forces by introducing a difference in depth between collocated matrix and fracture.
Verifications by comparing single- and two-porosity systems, pressure transient testing and a nine-point connection with
tracer.
Conclusion reached:
1. Fully implicit formulation allows using large time steps without stability concerns.
2. Introduction of a potential difference to account for gravity forces.
Comments:
The transfer function has changed compared to Kazemi et al. (1976) but the shape factor is the same.
22 Dynamic Matrix-Fracture Transfer Behaviour in Dual-Porosity Models
SPE 12271 (1986)
An Efficient Finite-Difference Method for Simulating Phase Segregation in the Matrix Blocks in Double-Porosity Reservoirs
Authors: Gilman, J.R.
Contribution to the understanding of matrix-fracture transfers:
Model showing gravity segregation effects in the matrix rock. Sub-gridding of the matrix.
Objective of the paper:
Describe method for simulating unsteady-state multiphase flow in a reservoir with two porosities.
Methodology used:
Division of matrix into subdomains to obtain pressure and saturation distribution.
Linearization of the finite-difference equations.
Verification by comparing a single-phase, double-porosity radial system to the analytical solution for an infinite system.
Conclusion reached:
1. Subdomains increase the computation time
2. Finite-difference solution of multiple-matrix subdomains in single-phase transient flow agrees with analytical
solutions of transient matrix flow that show a greater semi log-pressure plot slope during the transition from early to
late time response compared with pseudosteady-state matrix-fracture flow.
3. Multiple-matrix subdomains can be used to simulate phase segregation in the matrix blocks of two-porosity systems
without increasing the number of gridblocks. Subdomains are important when phase segregation in the matrix blocks
affects the recovery mechanism.
Comments:
Nested blocks cannot be used in the ECLIPSE 100 reservoir simulator using the gravity drainage model for the dual-porosity
model, and stacking blocks result in adding fractures between each part of the matrix subdomains. Hence, this method has not
been used in the study.
Dynamic Matrix-Fracture Transfer Behaviour in Dual-Porosity Models 23
SPE 16007 (1989)
Typical Features of a Multipurpose Reservoir Simulator
Authors: Quandalle, P., Sabathier, J.C.
Contribution to the understanding of matrix-fracture transfers:
Segregation between vertical and horizontal flow. Provides a better modelling for gravity effects.
Objective of the paper:
Describe some aspects of new three-dimensional, three-phase, multipurpose reservoir simulator: dual-porosity/dual-
permeability and compositional aspect.
Methodology used:
Dual-porosity/dual permeability aspect:
1st option: potential values at the six faces of a matrix block are approximated by their values at the fracture node
2nd
option: potentials at the four faces in the horizontal direction are replaced by their value at the centre of the block,
but faces in the vertical direction are deduced from their values at the centre (separation between horizontal and
vertical flow)
3rd
option: linear interpolation to calculate the potential values in the fractures at the six block faces
Definition of 3 flow coefficients accounting for viscosity, gravity and capillarity
Validation by simulating a fractured column initially oil-saturated with a single-porosity model and dual-
porosity/single-permeability model, and by using a low permeability fracture and a high permeability fracture
Compositional aspect:
2nc+2 flow equations (nc is the number of hydrocarbon and associated components)
Equations describe multicomponent, 3D, three-phase flow (water, hydrocarbon liquid and hydrocarbon gas)
Conclusion reached:
1. New formulation for transfer terms between matrix and fractures in a dual-porosity system is more accurate.
2. Dual-permeability and compositional aspects are taken into account.
Comments:
The segregation between the horizontal and vertical flow is a key element for gravity drainage.
A shape factor has been derived from Quandalle and Sabathier (1989) by Abushaikha and Gosselin (2008)
24 Dynamic Matrix-Fracture Transfer Behaviour in Dual-Porosity Models
SPE 18427 (1989)
Implicit Compositional Simulation of Single-Porosity and Dual-Porosity Reservoirs
Authors: Coats, K.H.
Contribution to the understanding of matrix-fracture transfers:
Extension of the dual porosity model to compositional simulation. Proposition of a shape factor σ = 8 (1
Lx2 +
1
Ly2 +
1
Lz2)
which is twice the shape factor formulated by Kazemi et al. (1976)
Objective of the paper:
Describe an implicit numerical model for compositional simulation of single-porosity and dual-porosity oil or gas condensate
reservoirs.
Methodology used:
3 component equation of state compositional approach proposed as a desirable alternative to extended black oil modelling.
Description of compositional simulator: assumptions, shape factor, saturations, transfer functions.
Validation by comparison with experimental data. Tests on reinfiltration effect, single-block imbibition, three-dimensional
waterflood, five-spot waterflood, volatile oil reservoir.
Conclusion reached:
1. New matrix-fracture transfer function formulation, including a new shape factor
2. Implicit compositional model simulates unsteady-state, three-dimensional, three phase flow in heterogeneous
reservoirs ranging from black oil to near-critical oil or gas to lean gas condensate.
3. Valid in single or dual-porosity reservoirs.
4. Application possible to depletion and gas and/or water injection.
5. Formulation accounts for matrix-fracture diffusion and effects of changing gas-oil density difference and interfacial
tension on gravity drainage recovery.
Comments:
This paper is not relevant to the study since a black oil model has been used.
Dynamic Matrix-Fracture Transfer Behaviour in Dual-Porosity Models 25
Journal of Hydrology, Vol. 111, Pages 213-224 (1989)
Integral Method Solution for Diffusion into a Spherical Block
Authors: Zimmerman, R.W. and Bodvarsson, G.S.
Contribution to the understanding of matrix-fracture transfers:
Approximate analytical solution for a Newtonian fluid infiltrating into a porous spherical block. Applies to other processes
governed by the same equation.
Objective of the paper:
Derive an analytical solution for a Newtonian fluid infiltrating into a porous spherical block.
Methodology used:
Use of the integral method introduced by Pohlhausen in 1921.
Diffusion equation for spherically symmetric flow of a Newtonian fluid in an homogeneous porous medium, neglecting
gravity.
Numerical verification of the integral solution vs exact solution.
Conclusion reached:
1. Very accurate solution for the problem of flow into a porous sphere initially at a constant pressure with an outer
boundary at another fixed pressure.
2. Results can apply to other phenomena governed by the diffusion equation.
Comments:
Neglects gravity.
26 Dynamic Matrix-Fracture Transfer Behaviour in Dual-Porosity Models
Water Resources Research, Vol. 29, No. 7, Pages 2127-2137, July 1993.
A Numerical dual-porosity model with semianalytical treatment of fracture/matrix flow
Authors: Zimmerman, R.W., Chen, G., Hagdu, T. and Bodvarsson, G.S.
Contribution to the understanding of matrix-fracture transfers:
Analytical solution of the diffusion equation derived using Fourier series analysis. Shape factors obtained for several
geometries.
Objective of the paper:
Develop a new dual-porosity model for single-phase flow in fractured porous media by using a nonlinear equation.
Methodology used:
Use of Fourier series to solve the diffusion equation and obtain a nonlinear transfer function.
Conclusion reached:
1. Vermeulen (1953) equation is more accurate than the Warren and Root equation at early times.
2. More accurate simulations compared to Warren and Root (1963) model.
3. Shape factors obtained for various geometries including cubes σ = 3π2/L2, slabs of thickness L σ = π2/L2, cylinders
of radius a σ = 2.4052/a2.
Comments:
Single-phase flow only.
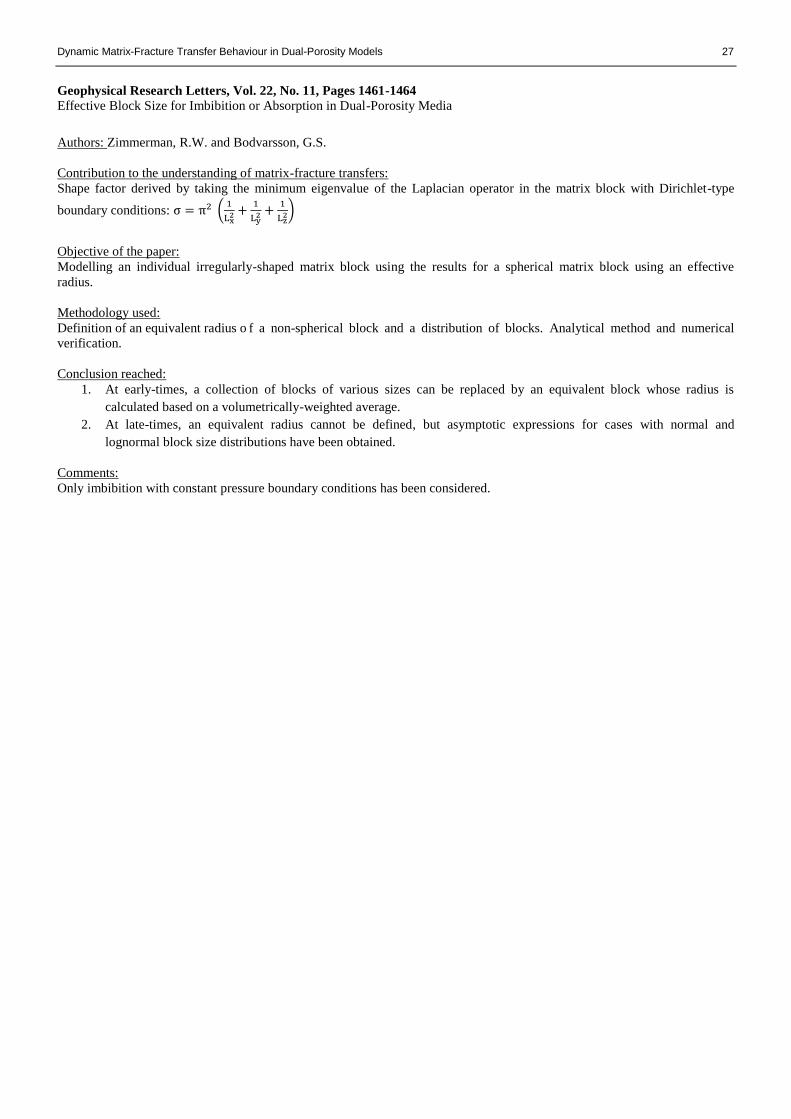
Dynamic Matrix-Fracture Transfer Behaviour in Dual-Porosity Models 27
Geophysical Research Letters, Vol. 22, No. 11, Pages 1461-1464 Effective Block Size for Imbibition or Absorption in Dual-Porosity Media
Authors: Zimmerman, R.W. and Bodvarsson, G.S.
Contribution to the understanding of matrix-fracture transfers:
Shape factor derived by taking the minimum eigenvalue of the Laplacian operator in the matrix block with Dirichlet-type
boundary conditions: σ = π2 (1
Lx2 +
1
Ly2 +
1
Lz2)
Objective of the paper:
Modelling an individual irregularly-shaped matrix block using the results for a spherical matrix block using an effective
radius.
Methodology used:
Definition of an equivalent radius o f a non-spherical block and a distribution of blocks. Analytical method and numerical
verification.
Conclusion reached:
1. At early-times, a collection of blocks of various sizes can be replaced by an equivalent block whose radius is
calculated based on a volumetrically-weighted average.
2. At late-times, an equivalent radius cannot be defined, but asymptotic expressions for cases with normal and
lognormal block size distributions have been obtained.
Comments:
Only imbibition with constant pressure boundary conditions has been considered.
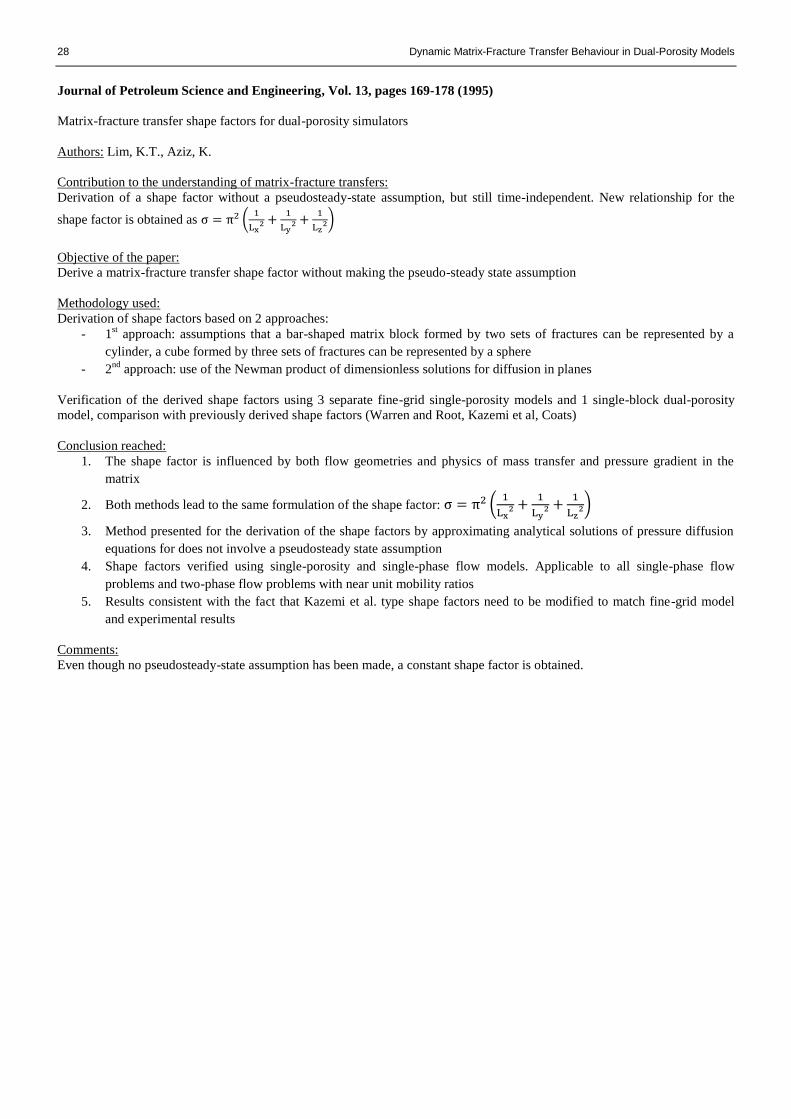
28 Dynamic Matrix-Fracture Transfer Behaviour in Dual-Porosity Models
Journal of Petroleum Science and Engineering, Vol. 13, pages 169-178 (1995)
Matrix-fracture transfer shape factors for dual-porosity simulators
Authors: Lim, K.T., Aziz, K.
Contribution to the understanding of matrix-fracture transfers:
Derivation of a shape factor without a pseudosteady-state assumption, but still time-independent. New relationship for the
shape factor is obtained as σ = π2 (1
Lx2 +
1
Ly2 +
1
Lz2)
Objective of the paper:
Derive a matrix-fracture transfer shape factor without making the pseudo-steady state assumption
Methodology used:
Derivation of shape factors based on 2 approaches:
- 1st approach: assumptions that a bar-shaped matrix block formed by two sets of fractures can be represented by a
cylinder, a cube formed by three sets of fractures can be represented by a sphere
- 2nd
approach: use of the Newman product of dimensionless solutions for diffusion in planes
Verification of the derived shape factors using 3 separate fine-grid single-porosity models and 1 single-block dual-porosity
model, comparison with previously derived shape factors (Warren and Root, Kazemi et al, Coats)
Conclusion reached:
1. The shape factor is influenced by both flow geometries and physics of mass transfer and pressure gradient in the
matrix
2. Both methods lead to the same formulation of the shape factor: σ = π2 (1
Lx2 +
1
Ly2 +
1
Lz2)
3. Method presented for the derivation of the shape factors by approximating analytical solutions of pressure diffusion
equations for does not involve a pseudosteady state assumption
4. Shape factors verified using single-porosity and single-phase flow models. Applicable to all single-phase flow
problems and two-phase flow problems with near unit mobility ratios
5. Results consistent with the fact that Kazemi et al. type shape factors need to be modified to match fine-grid model
and experimental results
Comments:
Even though no pseudosteady-state assumption has been made, a constant shape factor is obtained.
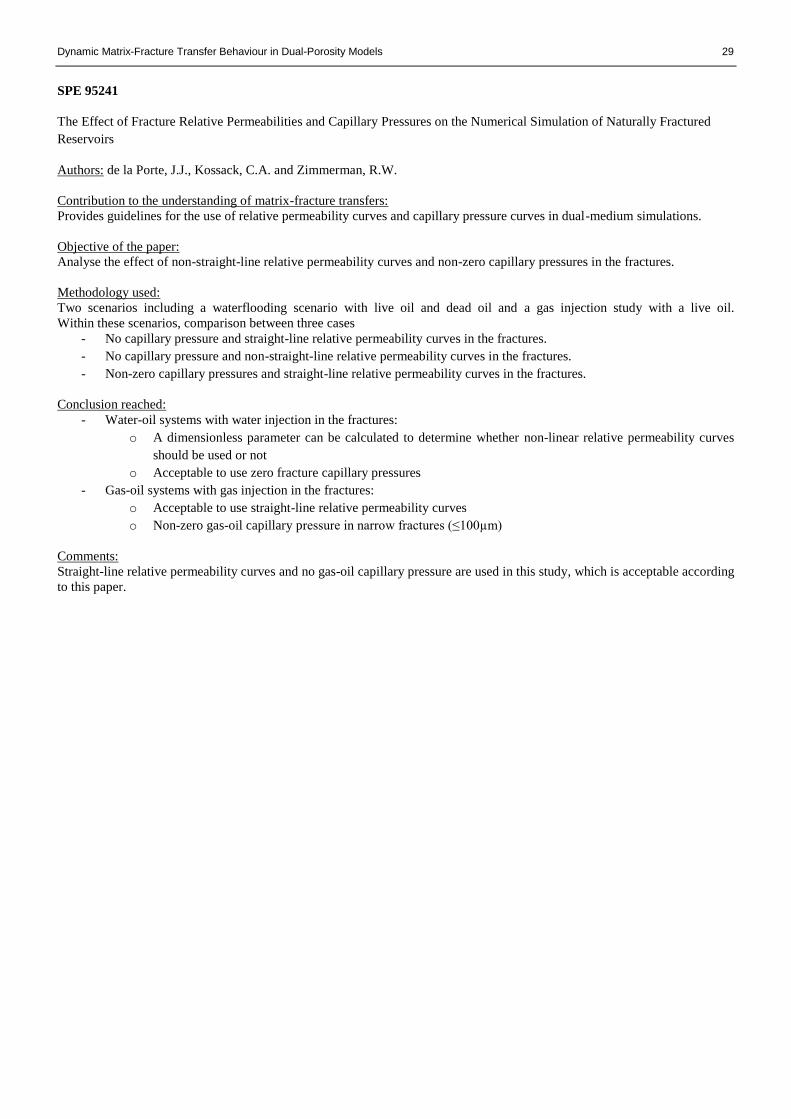
Dynamic Matrix-Fracture Transfer Behaviour in Dual-Porosity Models 29
SPE 95241
The Effect of Fracture Relative Permeabilities and Capillary Pressures on the Numerical Simulation of Naturally Fractured
Reservoirs
Authors: de la Porte, J.J., Kossack, C.A. and Zimmerman, R.W.
Contribution to the understanding of matrix-fracture transfers:
Provides guidelines for the use of relative permeability curves and capillary pressure curves in dual-medium simulations.
Objective of the paper:
Analyse the effect of non-straight-line relative permeability curves and non-zero capillary pressures in the fractures.
Methodology used:
Two scenarios including a waterflooding scenario with live oil and dead oil and a gas injection study with a live oil.
Within these scenarios, comparison between three cases
- No capillary pressure and straight-line relative permeability curves in the fractures.
- No capillary pressure and non-straight-line relative permeability curves in the fractures.
- Non-zero capillary pressures and straight-line relative permeability curves in the fractures.
Conclusion reached:
- Water-oil systems with water injection in the fractures:
o A dimensionless parameter can be calculated to determine whether non-linear relative permeability curves
should be used or not
o Acceptable to use zero fracture capillary pressures
- Gas-oil systems with gas injection in the fractures:
o Acceptable to use straight-line relative permeability curves
o Non-zero gas-oil capillary pressure in narrow fractures (≤100µm)
Comments:
Straight-line relative permeability curves and no gas-oil capillary pressure are used in this study, which is acceptable according
to this paper.
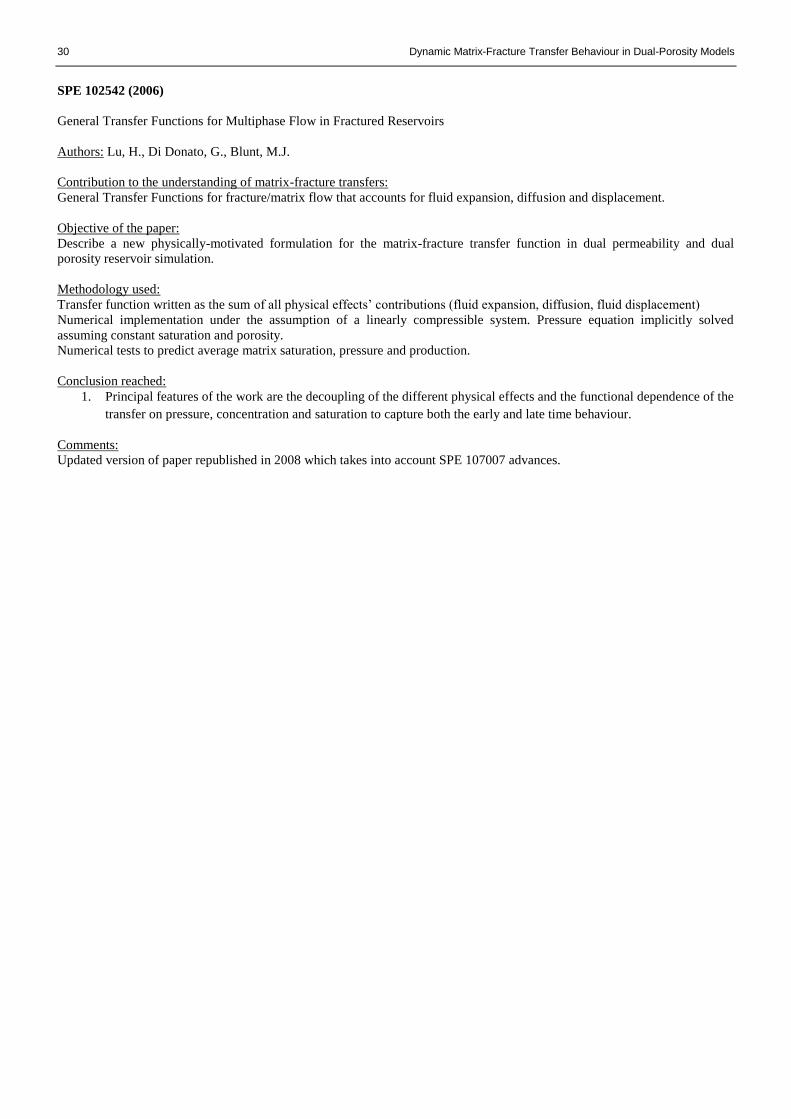
30 Dynamic Matrix-Fracture Transfer Behaviour in Dual-Porosity Models
SPE 102542 (2006)
General Transfer Functions for Multiphase Flow in Fractured Reservoirs
Authors: Lu, H., Di Donato, G., Blunt, M.J.
Contribution to the understanding of matrix-fracture transfers:
General Transfer Functions for fracture/matrix flow that accounts for fluid expansion, diffusion and displacement.
Objective of the paper:
Describe a new physically-motivated formulation for the matrix-fracture transfer function in dual permeability and dual
porosity reservoir simulation.
Methodology used:
Transfer function written as the sum of all physical effects’ contributions (fluid expansion, diffusion, fluid displacement)
Numerical implementation under the assumption of a linearly compressible system. Pressure equation implicitly solved
assuming constant saturation and porosity.
Numerical tests to predict average matrix saturation, pressure and production.
Conclusion reached:
1. Principal features of the work are the decoupling of the different physical effects and the functional dependence of the
transfer on pressure, concentration and saturation to capture both the early and late time behaviour.
Comments:
Updated version of paper republished in 2008 which takes into account SPE 107007 advances.
Dynamic Matrix-Fracture Transfer Behaviour in Dual-Porosity Models 31
SPE 107007 (2007)
General Fracture/Matrix Transfer Functions for Mixed-Wet Systems
Authors: Lu, H., Blunt, M.J.
Contribution to the understanding of matrix-fracture transfers:
Extension of the General Transfer Functions for mixed-wet reservoirs.
Objective of the paper:
Improve the Lu et al. (2006) General Transfer Functions model for mixed-wet media by including transfer due to horizontal
and vertical displacement separately
Methodology used:
Use of the General Transfer Functions defined by Lu et al. (2006).
Separation of horizontal and vertical contributions to account for capillary imbibition and gravity drainage directions in mixed-
wet systems.
Verifications for fluid expansion, capillary imbibition and gas/oil gravity drainage in one dimension.
Conclusion reached:
1. Model extended to separate contributions of horizontal and vertical displacement
2. Transfer function tested against one and two-dimensional simulations of water displacing oil in a mixed-wet medium
with excellent predictions, without adjustable parameters.
3. Recovery behaviour for a two-dimensional system with a tall matrix block reveals that there is a rapid initial recovery
driven by capillary forces across the large matrix-fracture surface area along the sides of the block followed by a
slower drainage recovery where buoyancy overcomes capillary forces to reach a final saturation in capillary-gravity
equilibrium.
Comments:
Studying every recovery mechanism separately and trying to add up their contributions seems to be a good way to improve the
dual-porosity model. In this study, the interest is focused on one recovery mechanism, the gas-oil gravity drainage.
32 Dynamic Matrix-Fracture Transfer Behaviour in Dual-Porosity Models
SPE 113890 (2008)
Matrix-Fracture Transfer Function in Dual-Medium Flow Simulation: Review, Comparison, and Validation
Authors: Abushaikha, A.S.A, Gosselin, O.R.
Contribution to the understanding of matrix-fracture transfers:
Review of many transfer functions formulations. Derivation of the Quandalle and Sabathier (1989) shape factor.
Objective of the paper:
Do a comparative review of existing transfer functions.
Methodology used:
Comparison of a fine-grid single porosity model with dual-porosity models using different transfer functions including Kazemi
et al. (1976), Gilman and Kazemi (1983, Quandalle and Sabathier (1989) and Lu et al. (2006, 2007)
Several cases studied: water-oil, gas-oil and gas-water systems, gravity effects, capillary effects, with a number of sensitivity
analysis.
Conclusion reached:
1. Kazemi et al. (1976) has a limited range of validity.
2. Gilman and Kazemi (1983) represents gravity drainage but is not predictive for mixed-wet systems with both
capillary and gravity forces.
3. Quandalle and Sabathier (1989) is more representative of the gravity forces by the segregation between the horizontal
and vertical flows.
4. All these formulations are not accurate with capillary imbibition.
5. Lu et al. (2006, 2007), a non-Warren and Root (1963) based formulation, is more accurate but does not always
correctly predict the late-time behaviour.
6. Among the formulations based on Warren and Root (1963), Quandalle and Sabathier (1989) should be preferably
used for its better performances.
Comments:
The shape factor derived from Quandalle and Sabathier (1989) is used to compare the time-dependent shape factor with a
constant one.

Dynamic Matrix-Fracture Transfer Behaviour in Dual-Porosity Models 33
Appendix B: Keywords used in the dual-porosity simulation
Table B-1: Keywords used for the dual-porosity simulation
Eclipse 100 simulator keyword
Description
DUALPORO Activates the dual-porosity model
GRAVDRM Gravity drainage model based on Quandalle and Sabathier (1989) horizontal and vertical flow segregation
DPGRID The grid entered for the matrix cells is reported to the corresponding fracture cells
DZMTRX Characteristic height of the matrix blocks
SIGMA Horizontal shape factor
SIGMAGD Vertical shape factor
MULTSIGV Shape factor multiplier where a value needs to be specified for every matrix block Used to obtain a correlation for the time-dependent shape factor
MULTZ Transmissibility multiplier – used to reduce the fracture-fracture transmissibility
BTOBALFV Block-to-block connection – creates a connection between the upper fracture and the lower matrix. Used to model the block-to-block effect
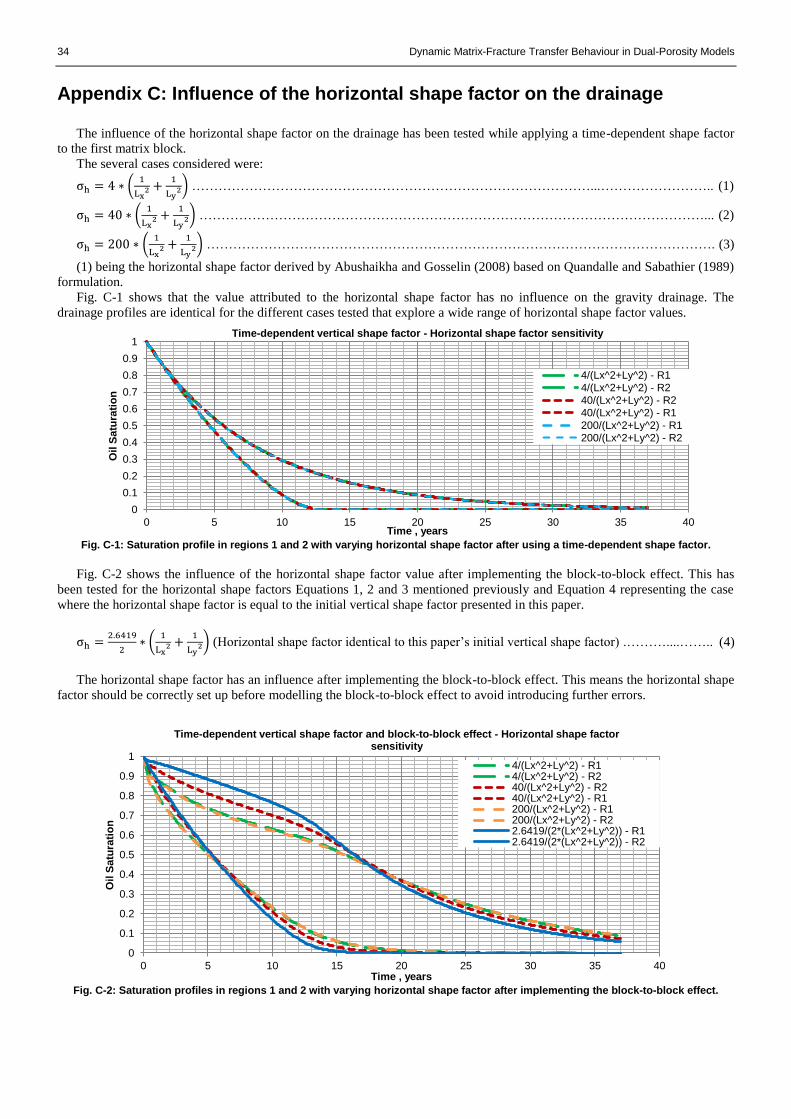
34 Dynamic Matrix-Fracture Transfer Behaviour in Dual-Porosity Models
Appendix C: Influence of the horizontal shape factor on the drainage
The influence of the horizontal shape factor on the drainage has been tested while applying a time-dependent shape factor
to the first matrix block.
The several cases considered were:
σh = 4 ∗ (1
Lx2 +
1
Ly2) ………………………………………………………………………………...…………………….. (1)
σh = 40 ∗ (1
Lx2 +
1
Ly2) ……………………………………………………………………………………………………... (2)
σh = 200 ∗ (1
Lx2 +
1
Ly2) ……………………………………………………………………………………………………. (3)
(1) being the horizontal shape factor derived by Abushaikha and Gosselin (2008) based on Quandalle and Sabathier (1989)
formulation.
Fig. C-1 shows that the value attributed to the horizontal shape factor has no influence on the gravity drainage. The
drainage profiles are identical for the different cases tested that explore a wide range of horizontal shape factor values.
Fig. C-1: Saturation profile in regions 1 and 2 with varying horizontal shape factor after using a time-dependent shape factor.
Fig. C-2 shows the influence of the horizontal shape factor value after implementing the block-to-block effect. This has
been tested for the horizontal shape factors Equations 1, 2 and 3 mentioned previously and Equation 4 representing the case
where the horizontal shape factor is equal to the initial vertical shape factor presented in this paper.
σh =2.6419
2∗ (
1
Lx2 +
1
Ly2) (Horizontal shape factor identical to this paper’s initial vertical shape factor) .………....…….. (4)
The horizontal shape factor has an influence after implementing the block-to-block effect. This means the horizontal shape
factor should be correctly set up before modelling the block-to-block effect to avoid introducing further errors.
Fig. C-2: Saturation profiles in regions 1 and 2 with varying horizontal shape factor after implementing the block-to-block effect.
0
0.1
0.2
0.3
0.4
0.5
0.6
0.7
0.8
0.9
1
0 5 10 15 20 25 30 35 40
Oil
Satu
rati
on
Time , years
Time-dependent vertical shape factor - Horizontal shape factor sensitivity
4/(Lx^2+Ly^2) - R14/(Lx^2+Ly^2) - R2
40/(Lx^2+Ly^2) - R2
40/(Lx^2+Ly^2) - R1
200/(Lx^2+Ly^2) - R1
200/(Lx^2+Ly^2) - R2
0
0.1
0.2
0.3
0.4
0.5
0.6
0.7
0.8
0.9
1
0 5 10 15 20 25 30 35 40
Oil
Satu
rati
on
Time , years
Time-dependent vertical shape factor and block-to-block effect - Horizontal shape factor sensitivity
4/(Lx^2+Ly^2) - R14/(Lx^2+Ly^2) - R240/(Lx^2+Ly^2) - R240/(Lx^2+Ly^2) - R1200/(Lx^2+Ly^2) - R1200/(Lx^2+Ly^2) - R22.6419/(2*(Lx^2+Ly^2)) - R12.6419/(2*(Lx^2+Ly^2)) - R2
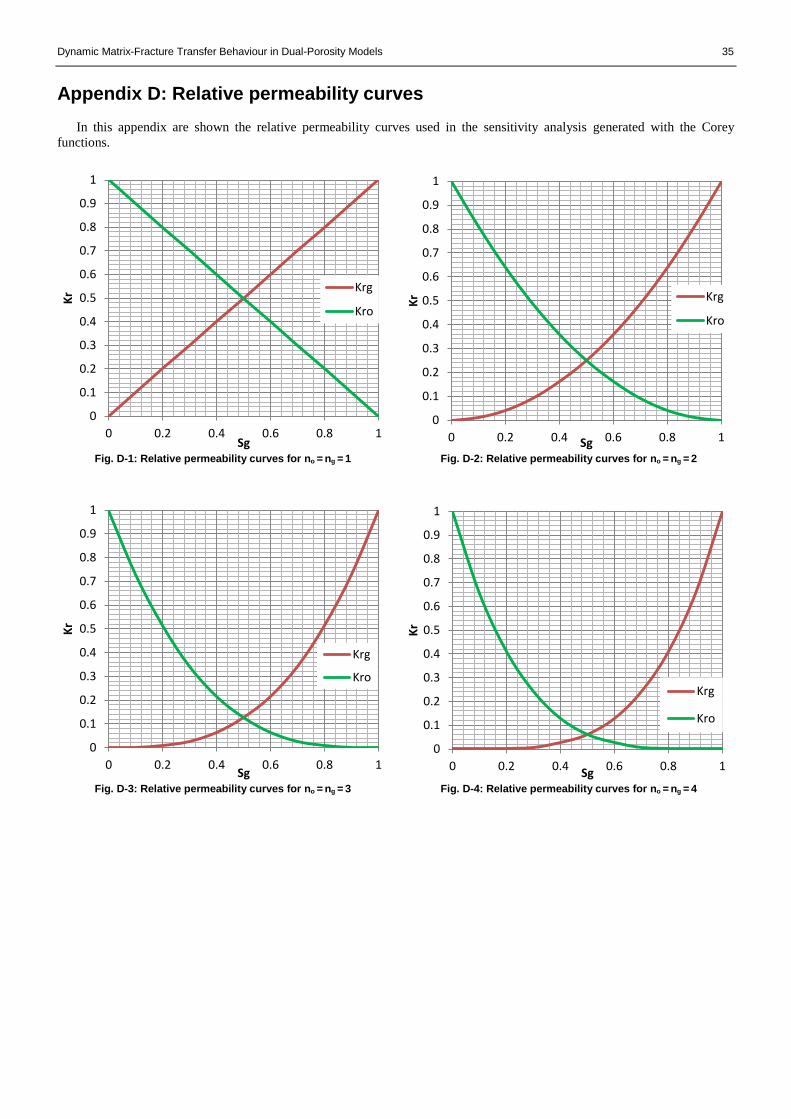
Dynamic Matrix-Fracture Transfer Behaviour in Dual-Porosity Models 35
Appendix D: Relative permeability curves
In this appendix are shown the relative permeability curves used in the sensitivity analysis generated with the Corey
functions.
Fig. D-1: Relative permeability curves for no = ng = 1
Fig. D-2: Relative permeability curves for no = ng = 2
Fig. D-3: Relative permeability curves for no = ng = 3 Fig. D-4: Relative permeability curves for no = ng = 4
0
0.1
0.2
0.3
0.4
0.5
0.6
0.7
0.8
0.9
1
0 0.2 0.4 0.6 0.8 1
Kr
Sg
Krg
Kro
0
0.1
0.2
0.3
0.4
0.5
0.6
0.7
0.8
0.9
1
0 0.2 0.4 0.6 0.8 1
Kr
Sg
Krg
Kro
0
0.1
0.2
0.3
0.4
0.5
0.6
0.7
0.8
0.9
1
0 0.2 0.4 0.6 0.8 1
Kr
Sg
Krg
Kro
0
0.1
0.2
0.3
0.4
0.5
0.6
0.7
0.8
0.9
1
0 0.2 0.4 0.6 0.8 1
Kr
Sg
Krg
Kro
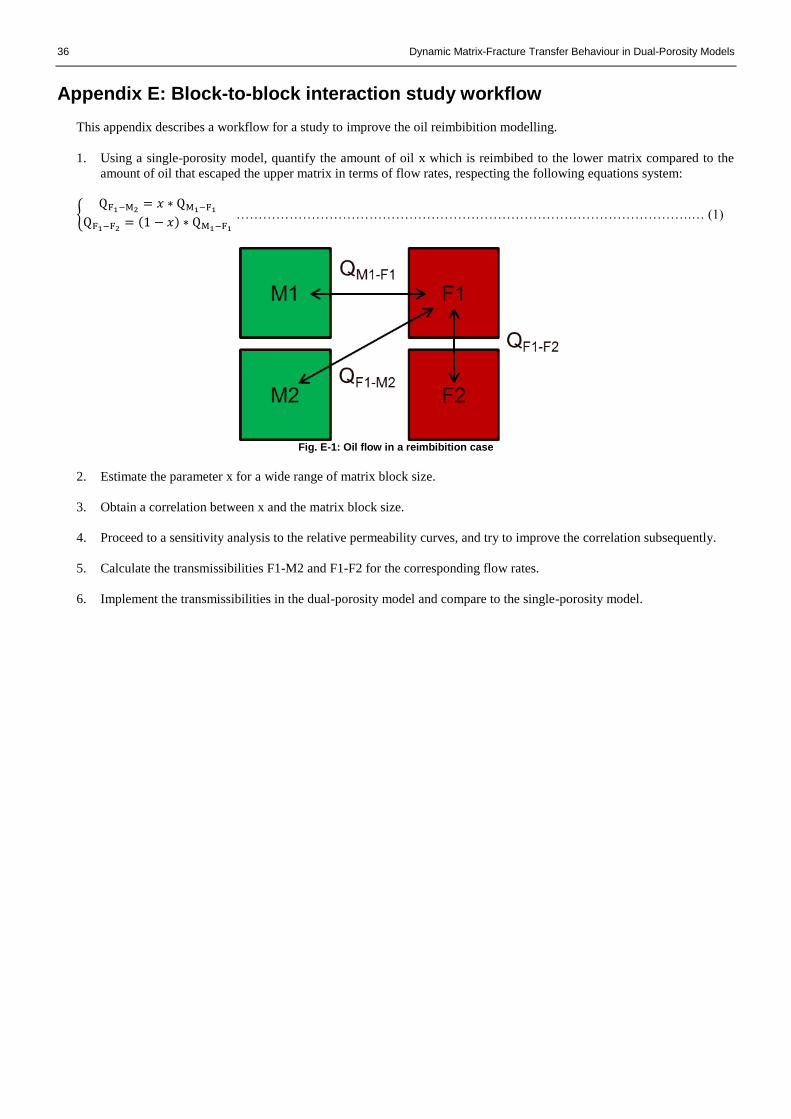
36 Dynamic Matrix-Fracture Transfer Behaviour in Dual-Porosity Models
Appendix E: Block-to-block interaction study workflow
This appendix describes a workflow for a study to improve the oil reimbibition modelling.
1. Using a single-porosity model, quantify the amount of oil x which is reimbibed to the lower matrix compared to the
amount of oil that escaped the upper matrix in terms of flow rates, respecting the following equations system:
{QF1−M2
= 𝑥 ∗ QM1−F1
QF1−F2= (1 − 𝑥) ∗ QM1−F1
………………………………………………………………………………………….… (1)
Fig. E-1: Oil flow in a reimbibition case
2. Estimate the parameter x for a wide range of matrix block size.
3. Obtain a correlation between x and the matrix block size.
4. Proceed to a sensitivity analysis to the relative permeability curves, and try to improve the correlation subsequently.
5. Calculate the transmissibilities F1-M2 and F1-F2 for the corresponding flow rates.
6. Implement the transmissibilities in the dual-porosity model and compare to the single-porosity model.