Embed Size (px)
Citation preview
Implementation and Effects of the G20 Financial Regulatory Reforms 3 July 2017 3rd Annual Report
The Financial Stability Board (FSB) is established to coordinate at the international level the work of national financial authorities and international standard-setting bodies in order to develop and promote the implementation of effective regulatory, supervisory and other financial sector policies. Its mandate is set out in the FSB Charter, which governs the policymaking and related activities of the FSB. These activities, including any decisions reached in their context, shall not be binding or give rise to any legal rights or obligations under the FSB’s Articles of Association.
Contacting the Financial Stability Board
Sign up for e-mail alerts: Follow the FSB on Twitter:
E-mail the FSB at:
www.fsb.org/emailalert @FinStbBoard [email protected]
Copyright © 2017 Financial Stability Board. Please refer to: http://www.fsb.org/terms_conditions/
TABLE OF CONTENTS Page
Executive Summary .................................................................................................................... 1
Table on implementation of reforms in priority areas by FSB jurisdictions (as of 30 June 2017) 3
1. Introduction ...................................................................................................................... 6
2. Implementation status ...................................................................................................... 7
2.1 Building resilient financial institutions ........................................................ 7
2.2 Ending too-big-to-fail ................................................................................. 10
2.3 Making derivatives markets safer .............................................................. 12
2.4 Transforming shadow banking into resilient market-based finance ......... 15
2.5 Progress in other reform areas .................................................................. 17
2.6 Strengthening adherence to international financial standards ................ 18
2.7 Key implementation challenge: global regulatory cooperation ................ 19
3. OTC derivatives market reforms ..................................................................................... 21
4. Shadow banking assessment .......................................................................................... 24
5. Overall effects of reforms ............................................................................................... 27
5.1 Building a more resilient financial system ................................................. 27
5.2 Supporting sound financial intermediation ............................................... 30
6. Areas for ongoing attention ............................................................................................ 34
6.1 Maintaining an open and integrated global financial system ................... 34
6.2 Market liquidity.......................................................................................... 38
6.3 Effects of reforms on Emerging Market and Developing Economies (EMDEs) ...................................................................................................... 43
7. FSB evaluation framework .............................................................................................. 46
Annex 1: Monitoring forward planner ..................................................................................... 48
Annex 2: Sources of information .............................................................................................. 49
Abbreviations ........................................................................................................................... 51

1
Executive Summary Ten years have passed since the onset of the worst financial crisis since the Great Depression. In 2009, the G20 launched a comprehensive programme of reforms, coordinated through the FSB, to increase the resilience of the global financial system while preserving its open and integrated structure. Implementation progress continues but is uneven across the four core areas: ■ Building resilient financial institutions – Implementation of Basel III capital
and liquidity standards has generally been timely, and banks continue to build higher and better quality capital and liquidity buffers. More work is needed to implement other Basel III standards, while some advanced economies’ rules are not fully consistent with the Basel framework.
■ Ending too-big-to-fail – Implementation of higher loss absorbency, Total Loss-Absorbing Capacity (TLAC) and more intensive supervision is advancing well for global systemically important banks (G-SIBs). But progress has been slower on other resolution reforms over the past year and substantial work remains to build effective resolution regimes and to operationalise resolution plans for cross-border firms.
■ Making derivatives markets safer – Implementation of these reforms is now well progressed, although this has taken longer than originally intended. Overall, implementation is most advanced for trade reporting, but significant challenges remain for its effective use. Central clearing frameworks as well as margin and interim capital requirements have been implemented in most FSB jurisdictions, while platform trading frameworks have been implemented in half of FSB jurisdictions.
■ Transforming shadow banking into resilient market-based finance – Implementation of reforms on oversight and regulation of shadow banking entities, including money market funds, securities financing transactions and securitisation, is progressing but remains at a relatively early stage.
The evidence on effects of reforms to date shows that higher resilience is being achieved without impeding the supply of credit to the real economy: ■ The core of the banking system is significantly more resilient, with large
internationally active banks continuing to build capital and liquidity buffers. ■ The financial system is more diversified, including through the growth in
market-based finance. ■ Growth in total credit and bank lending has resumed in all regions, albeit at
different paces, while the cost of financing has remained low. Exceptionally accommodative monetary policies have contributed to this outcome.
However, authorities need to remain vigilant in a number of areas:
■ Maintaining an open and integrated global financial system – International bank lending, particularly by European banks, has declined since the crisis and its structure has shifted towards more stable regionally funded lending. Financing through international debt markets has continued to grow, and there is greater use of global infrastructures for trading, clearing and settlement. Nonetheless, the risks of geographic market fragmentation remain and should be monitored.
■ Market liquidity – There continues to be limited evidence of a broad reduction in market liquidity in normal times and the reforms have lowered the likelihood that a reduction in market liquidity could result in wider financial stability problems. The FSB continues to monitor fixed income and
2
derivatives market liquidity (including banks’ role as market intermediaries) and will further analyse its resilience under stressed conditions.
■ Effects of reforms on emerging market and developing economies (EMDEs) – Some EMDEs continue to report implementation challenges and concerns from the reduction in global banks’ activity in their domestic markets. To date, however, these do not seem to have significantly impacted EMDEs’ overall credit growth.
Over the past year, the FSB completed assessments in two core reforms: ■ OTC derivatives – While the long-term economic effects of the reforms
remain difficult to assess, progress has been made toward meeting the G20 objectives. Meaningful progress has been made toward mitigating systemic risk. Central clearing is simplifying much of the previously complex and opaque web of derivatives exposures, and central counterparties (CCPs) are more resilient. In addition, more collateral is in place in the system. There is progress in improving transparency through use of trade repositories (TRs) and platform trading. International work is taking place to improve the resilience, recovery planning and resolvability of CCPs; improve data quality and remove legal barriers to reporting and accessing TR data; and evaluate the interaction of reforms on incentives to clear OTC derivatives centrally.
■ Shadow banking – The aspects of shadow banking that contributed to the financial crisis have declined significantly and generally no longer pose financial stability risks. Reforms have also contributed to a reduction in vulnerabilities in areas such as money market funds and repos. But investment funds have grown, underscoring the importance of effective operationalisation and implementation of policies agreed to address their structural vulnerabilities, and new forms of shadow banking may develop. While no new stability risks that would warrant additional regulatory action at the global level have been identified, work is needed by FSB jurisdictions to implement fully the agreed policy recommendations and enhance data collection and analysis to capture emerging risks in a timely manner.
With the main elements of the post-crisis reforms agreed and implementation of many core reforms underway, more detailed analysis of the effects of those reforms is becoming possible. The FSB, in collaboration with the SSBs, has developed a framework for the post-implementation evaluation of the effects of G20 reforms. The framework, which will be progressively applied in the coming years and enhanced as more experience is gained, will guide analyses of whether the reforms are achieving their intended outcomes, and help to identify material unintended consequences that should be addressed, without compromising on the objectives of the reforms. G20 Leaders’ continued support is needed to implement fully the agreed reforms, and to reinforce global regulatory cooperation by: ■ revising legal frameworks to facilitate cooperation (e.g. for sharing
information among authorities on resolution and for removing legal barriers to reporting OTC derivatives to TRs and authorities’ access to TR-held data);
■ encouraging full and consistent implementation of standards to support a level playing field and reduce regulatory arbitrage opportunities;
■ participating in post-implementation evaluations of the effects of the G20 financial regulatory reforms using the FSB’s evaluation framework; and
■ considering how the progress made in agreeing and implementing common standards and enhancing cooperation and coordination can best be leveraged to preserve an open and integrated system.
3
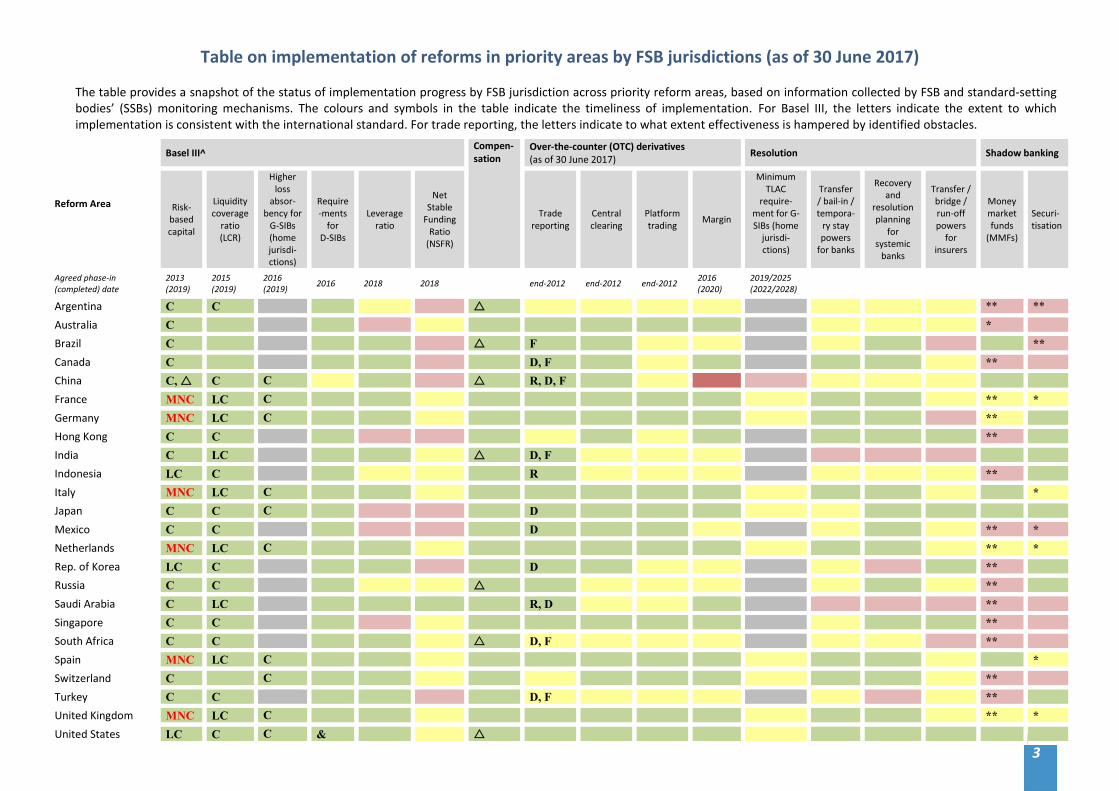
Table on implementation of reforms in priority areas by FSB jurisdictions (as of 30 June 2017)
The table provides a snapshot of the status of implementation progress by FSB jurisdiction across priority reform areas, based on information collected by FSB and standard-setting bodies’ (SSBs) monitoring mechanisms. The colours and symbols in the table indicate the timeliness of implementation. For Basel III, the letters indicate the extent to which implementation is consistent with the international standard. For trade reporting, the letters indicate to what extent effectiveness is hampered by identified obstacles.
Reform Area
Basel III^ Compen-sation
Over-the-counter (OTC) derivatives (as of 30 June 2017) Resolution Shadow banking
Risk-based capital
Liquidity coverage
ratio (LCR)
Higher loss
absor-bency for
G-SIBs (home jurisdi-ctions)
Require-ments
for D-SIBs
Leverage ratio
Net Stable
Funding Ratio
(NSFR)
Trade reporting
Central clearing
Platform trading Margin
Minimum TLAC
require-ment for G-SIBs (home
jurisdi-ctions)
Transfer / bail-in / tempora-
ry stay powers
for banks
Recovery and
resolution planning
for systemic
banks
Transfer / bridge / run-off powers
for insurers
Money market funds
(MMFs)
Securi-tisation
Agreed phase-in (completed) date
2013 (2019)
2015 (2019)
2016 (2019) 2016 2018 2018 end-2012 end-2012 end-2012 2016
(2020) 2019/2025 (2022/2028)
Argentina C C ** ** Australia C * Brazil C F ** Canada C D, F ** China C, C C R, D, F France MNC LC C ** * Germany MNC LC C ** Hong Kong C C ** India C LC D, F Indonesia LC C R ** Italy MNC LC C * Japan C C C D Mexico C C D ** * Netherlands MNC LC C ** * Rep. of Korea LC C D ** Russia C C ** Saudi Arabia C LC R, D ** Singapore C C ** South Africa C C D, F ** Spain MNC LC C * Switzerland C C ** Turkey C C D, F ** United Kingdom MNC LC C ** * United States LC C C &
4
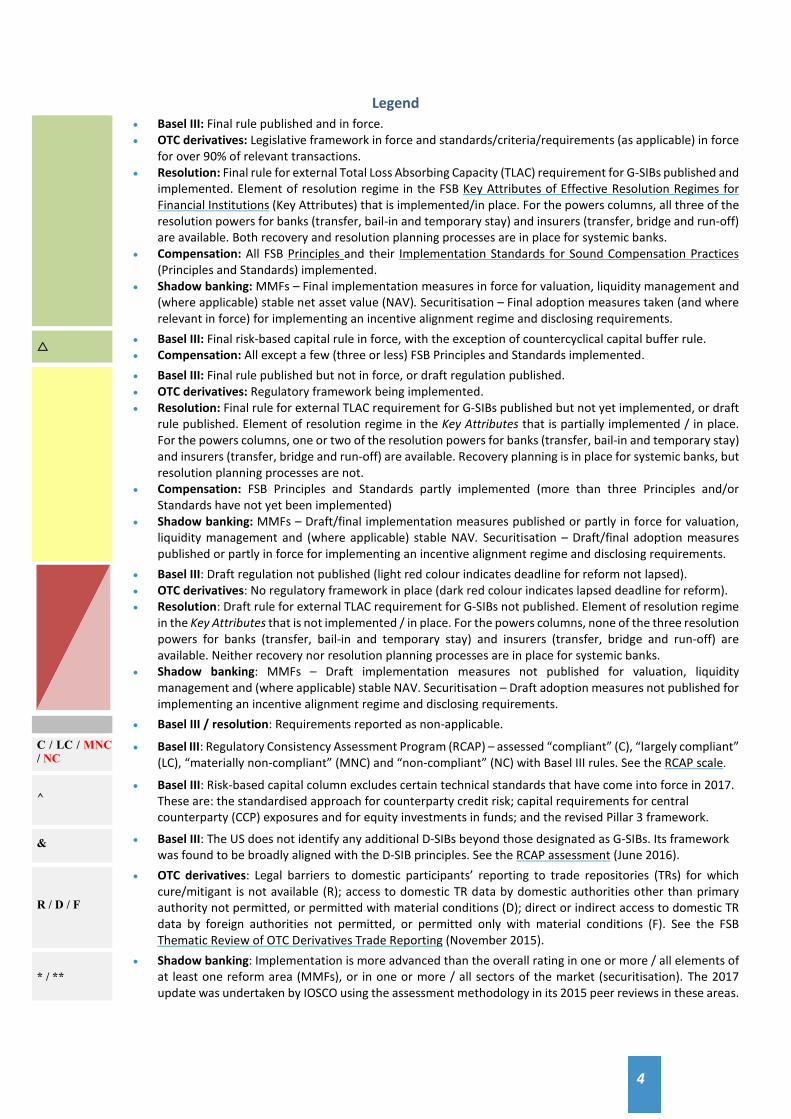
Legend • Basel III: Final rule published and in force.
• OTC derivatives: Legislative framework in force and standards/criteria/requirements (as applicable) in force for over 90% of relevant transactions.
• Resolution: Final rule for external Total Loss Absorbing Capacity (TLAC) requirement for G-SIBs published and implemented. Element of resolution regime in the FSB Key Attributes of Effective Resolution Regimes for Financial Institutions (Key Attributes) that is implemented/in place. For the powers columns, all three of the resolution powers for banks (transfer, bail-in and temporary stay) and insurers (transfer, bridge and run-off) are available. Both recovery and resolution planning processes are in place for systemic banks.
• Compensation: All FSB Principles and their Implementation Standards for Sound Compensation Practices (Principles and Standards) implemented.
• Shadow banking: MMFs – Final implementation measures in force for valuation, liquidity management and (where applicable) stable net asset value (NAV). Securitisation – Final adoption measures taken (and where relevant in force) for implementing an incentive alignment regime and disclosing requirements.
• Basel III: Final risk-based capital rule in force, with the exception of countercyclical capital buffer rule. • Compensation: All except a few (three or less) FSB Principles and Standards implemented.
• Basel III: Final rule published but not in force, or draft regulation published. • OTC derivatives: Regulatory framework being implemented. • Resolution: Final rule for external TLAC requirement for G-SIBs published but not yet implemented, or draft
rule published. Element of resolution regime in the Key Attributes that is partially implemented / in place. For the powers columns, one or two of the resolution powers for banks (transfer, bail-in and temporary stay) and insurers (transfer, bridge and run-off) are available. Recovery planning is in place for systemic banks, but resolution planning processes are not.
• Compensation: FSB Principles and Standards partly implemented (more than three Principles and/or Standards have not yet been implemented)
• Shadow banking: MMFs – Draft/final implementation measures published or partly in force for valuation, liquidity management and (where applicable) stable NAV. Securitisation – Draft/final adoption measures published or partly in force for implementing an incentive alignment regime and disclosing requirements.
• Basel III: Draft regulation not published (light red colour indicates deadline for reform not lapsed). • OTC derivatives: No regulatory framework in place (dark red colour indicates lapsed deadline for reform). • Resolution: Draft rule for external TLAC requirement for G-SIBs not published. Element of resolution regime
in the Key Attributes that is not implemented / in place. For the powers columns, none of the three resolution powers for banks (transfer, bail-in and temporary stay) and insurers (transfer, bridge and run-off) are available. Neither recovery nor resolution planning processes are in place for systemic banks.
• Shadow banking: MMFs – Draft implementation measures not published for valuation, liquidity management and (where applicable) stable NAV. Securitisation – Draft adoption measures not published for implementing an incentive alignment regime and disclosing requirements.
• Basel III / resolution: Requirements reported as non-applicable. C / LC / MNC / NC
• Basel III: Regulatory Consistency Assessment Program (RCAP) – assessed “compliant” (C), “largely compliant” (LC), “materially non-compliant” (MNC) and “non-compliant” (NC) with Basel III rules. See the RCAP scale.
^ • Basel III: Risk-based capital column excludes certain technical standards that have come into force in 2017.
These are: the standardised approach for counterparty credit risk; capital requirements for central counterparty (CCP) exposures and for equity investments in funds; and the revised Pillar 3 framework.
& • Basel III: The US does not identify any additional D-SIBs beyond those designated as G-SIBs. Its framework was found to be broadly aligned with the D-SIB principles. See the RCAP assessment (June 2016).
R / D / F
• OTC derivatives: Legal barriers to domestic participants’ reporting to trade repositories (TRs) for which cure/mitigant is not available (R); access to domestic TR data by domestic authorities other than primary authority not permitted, or permitted with material conditions (D); direct or indirect access to domestic TR data by foreign authorities not permitted, or permitted only with material conditions (F). See the FSB Thematic Review of OTC Derivatives Trade Reporting (November 2015).
* / ** • Shadow banking: Implementation is more advanced than the overall rating in one or more / all elements of
at least one reform area (MMFs), or in one or more / all sectors of the market (securitisation). The 2017 update was undertaken by IOSCO using the assessment methodology in its 2015 peer reviews in these areas.
5
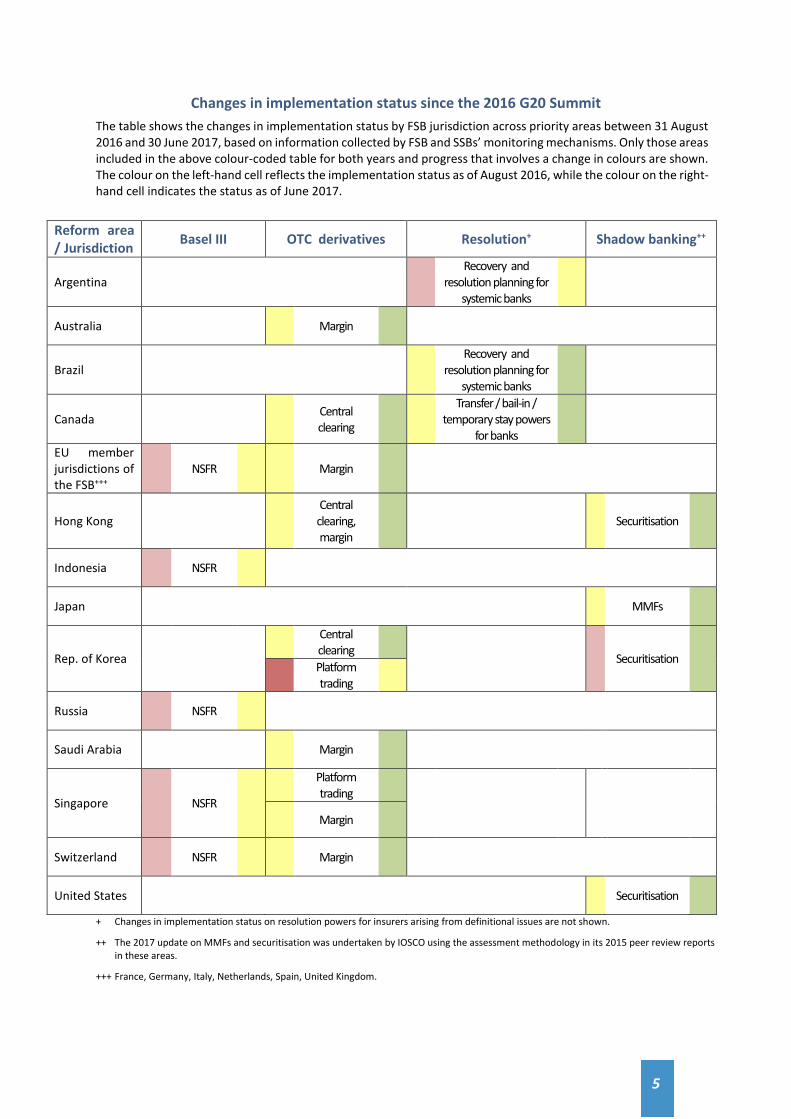
Changes in implementation status since the 2016 G20 Summit The table shows the changes in implementation status by FSB jurisdiction across priority areas between 31 August 2016 and 30 June 2017, based on information collected by FSB and SSBs’ monitoring mechanisms. Only those areas included in the above colour-coded table for both years and progress that involves a change in colours are shown. The colour on the left-hand cell reflects the implementation status as of August 2016, while the colour on the right-hand cell indicates the status as of June 2017.
Reform area / Jurisdiction Basel III OTC derivatives Resolution+ Shadow banking++
Argentina Recovery and
resolution planning for systemic banks
Australia Margin
Brazil Recovery and
resolution planning for systemic banks
Canada Central clearing
Transfer / bail-in / temporary stay powers
for banks
EU member jurisdictions of the FSB+++
NSFR Margin
Hong Kong Central clearing, margin
Securitisation
Indonesia NSFR
Japan MMFs
Rep. of Korea Central
clearing Securitisation
Platform trading
Russia NSFR
Saudi Arabia Margin
Singapore NSFR Platform
trading
Margin
Switzerland NSFR Margin
United States Securitisation
+ Changes in implementation status on resolution powers for insurers arising from definitional issues are not shown.
++ The 2017 update on MMFs and securitisation was undertaken by IOSCO using the assessment methodology in its 2015 peer review reports in these areas.
+++ France, Germany, Italy, Netherlands, Spain, United Kingdom.
6
1. Introduction This is the third annual report to the G20 on the implementation and effects of reforms. ■ The purpose of the report is to highlight the progress made by G20 and FSB members in
implementing regulatory reforms to fix the fault lines that led to the global financial crisis and build a safer, more resilient financial system.
■ Over time, these annual reports will enable the G20 to assess whether the financial reforms are achieving their intended results in an effective manner, consistent with its objectives for financial stability and growth.
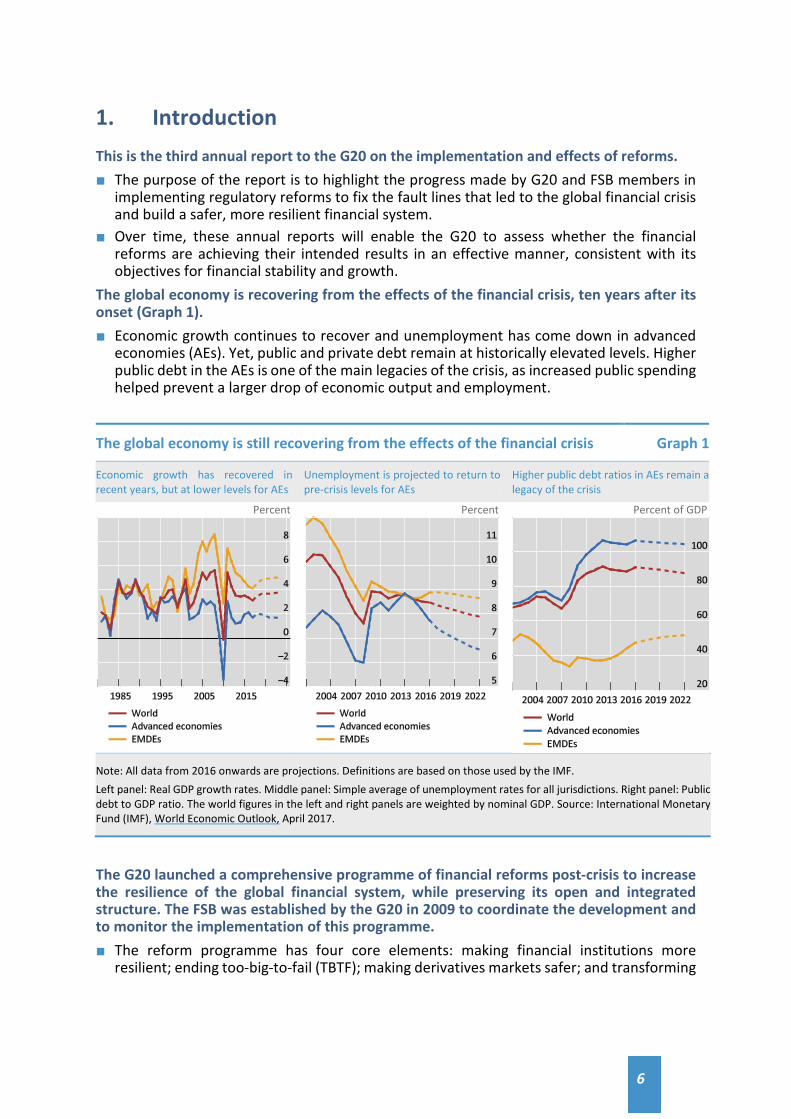
The global economy is recovering from the effects of the financial crisis, ten years after its onset (Graph 1). ■ Economic growth continues to recover and unemployment has come down in advanced
economies (AEs). Yet, public and private debt remain at historically elevated levels. Higher public debt in the AEs is one of the main legacies of the crisis, as increased public spending helped prevent a larger drop of economic output and employment.
The global economy is still recovering from the effects of the financial crisis Graph 1
Economic growth has recovered in recent years, but at lower levels for AEs
Unemployment is projected to return to pre-crisis levels for AEs
Higher public debt ratios in AEs remain a legacy of the crisis
Percent
Percent
Percent of GDP
Note: All data from 2016 onwards are projections. Definitions are based on those used by the IMF. Left panel: Real GDP growth rates. Middle panel: Simple average of unemployment rates for all jurisdictions. Right panel: Public debt to GDP ratio. The world figures in the left and right panels are weighted by nominal GDP. Source: International Monetary Fund (IMF), World Economic Outlook, April 2017.
The G20 launched a comprehensive programme of financial reforms post-crisis to increase the resilience of the global financial system, while preserving its open and integrated structure. The FSB was established by the G20 in 2009 to coordinate the development and to monitor the implementation of this programme. ■ The reform programme has four core elements: making financial institutions more
resilient; ending too-big-to-fail (TBTF); making derivatives markets safer; and transforming
7
shadow banking into resilient market-based finance.1 These reforms cover a broad range of issues involving banks and other types of financial institutions and financial markets.
■ By making the financial system more resilient and thereby reducing the likelihood and severity of future crises, the reforms aim to reduce the public costs and losses in output and employment associated with such crises.
■ The main elements of the reforms have been agreed and their implementation is underway. Some policy work is still ongoing, particularly the work of the Basel Committee on Banking Supervision (BCBS) to finalise certain elements of the Basel III framework.
■ The FSB is supporting the full, timely and consistent implementation of these reforms, and stands ready to address material unintended consequences, without compromising on the objectives of the reforms or undermining members’ commitment to implement them.
2. Implementation status
2.1 Building resilient financial institutions
Regulatory adoption of the core Basel III elements has generally been timely to date. ■ All 24 FSB jurisdictions have the core elements of the Basel III risk-based capital and
liquidity (Liquidity Coverage Ratio (LCR)) rules in force. ■ Final rules on higher loss absorbency requirements for global systemically important
banks (G-SIBs) are in force in all jurisdictions that have G-SIBs headquartered in them. ■ Final rules on the assessment methodology and higher loss absorbency requirements for
domestic systemically important banks (D-SIBs), which were due in 2016, are in force in 23 jurisdictions.
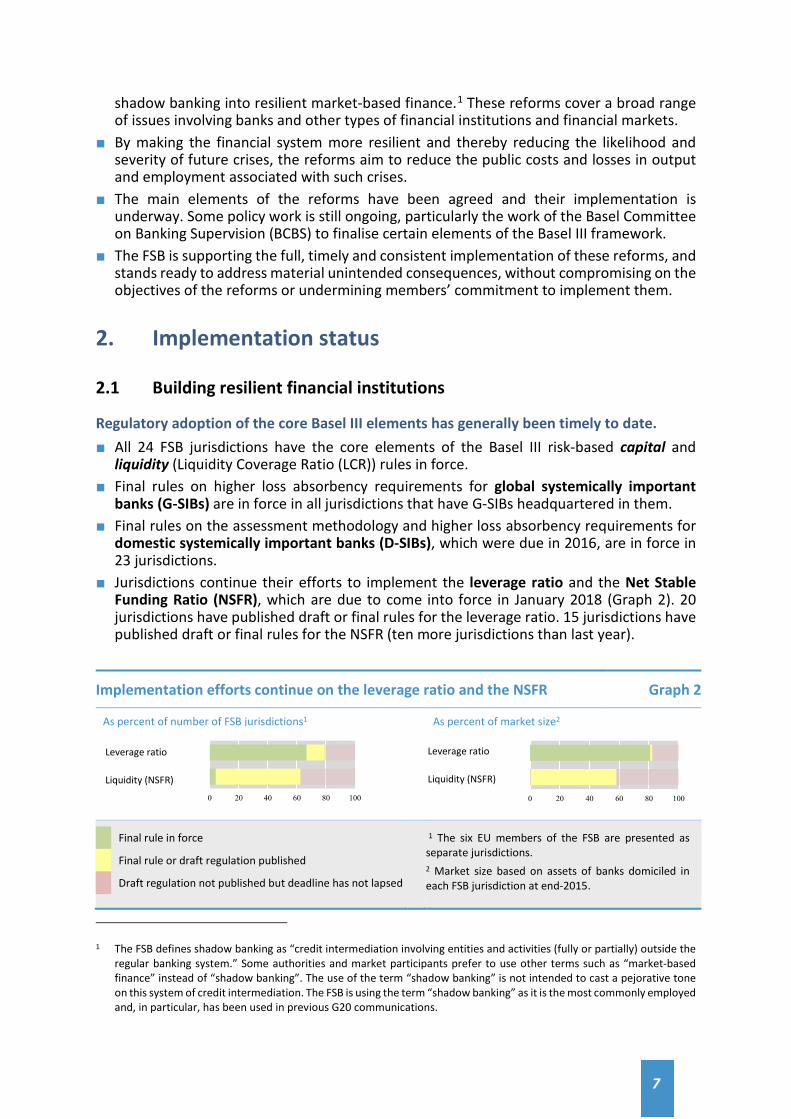
■ Jurisdictions continue their efforts to implement the leverage ratio and the Net Stable Funding Ratio (NSFR), which are due to come into force in January 2018 (Graph 2). 20 jurisdictions have published draft or final rules for the leverage ratio. 15 jurisdictions have published draft or final rules for the NSFR (ten more jurisdictions than last year).
Implementation efforts continue on the leverage ratio and the NSFR Graph 2
As percent of number of FSB jurisdictions1
As percent of market size2
Final rule in force
Final rule or draft regulation published
Draft regulation not published but deadline has not lapsed
1 The six EU members of the FSB are presented as separate jurisdictions. 2 Market size based on assets of banks domiciled in each FSB jurisdiction at end-2015.
1 The FSB defines shadow banking as “credit intermediation involving entities and activities (fully or partially) outside the
regular banking system.” Some authorities and market participants prefer to use other terms such as “market-based finance” instead of “shadow banking”. The use of the term “shadow banking” is not intended to cast a pejorative tone on this system of credit intermediation. The FSB is using the term “shadow banking” as it is the most commonly employed and, in particular, has been used in previous G20 communications.
Leverage ratio
Liquidity (NSFR)
Leverage ratio
Liquidity (NSFR)
0 20 40 60 80 1000 20 40 60 80 100
8
However, challenges remain on the timely adoption of some other Basel III standards. ■ Jurisdictions have not yet fully adopted revised standards whose implementation deadline
was in late 2016 or beginning of 2017. These are: capital requirements for equity investments in funds (eight FSB jurisdictions have final rules in place); standardised approach for counterparty credit risk (six jurisdictions); capital requirements for exposures to central counterparties (six jurisdictions); margin requirements for non-centrally cleared derivatives (fifteen jurisdictions); and the revised Pillar 3 framework (eight jurisdictions).
■ Jurisdictions are also working to implement standards that are due to come into effect in 2018 (such as the revised standards on the securitisation framework and interest rate risk in the banking book) and in 2019 (such as the revised market risk framework).
■ Delayed implementation may have implications for a level playing field, and puts unnecessary pressure on those jurisdictions that have implemented the standards based on the agreed timelines. The challenges in meeting the agreed dates relate mainly to domestic legislative or rule-making processes. Some jurisdictions also report that banks face difficulties in adjusting their information systems to meet the new requirements.
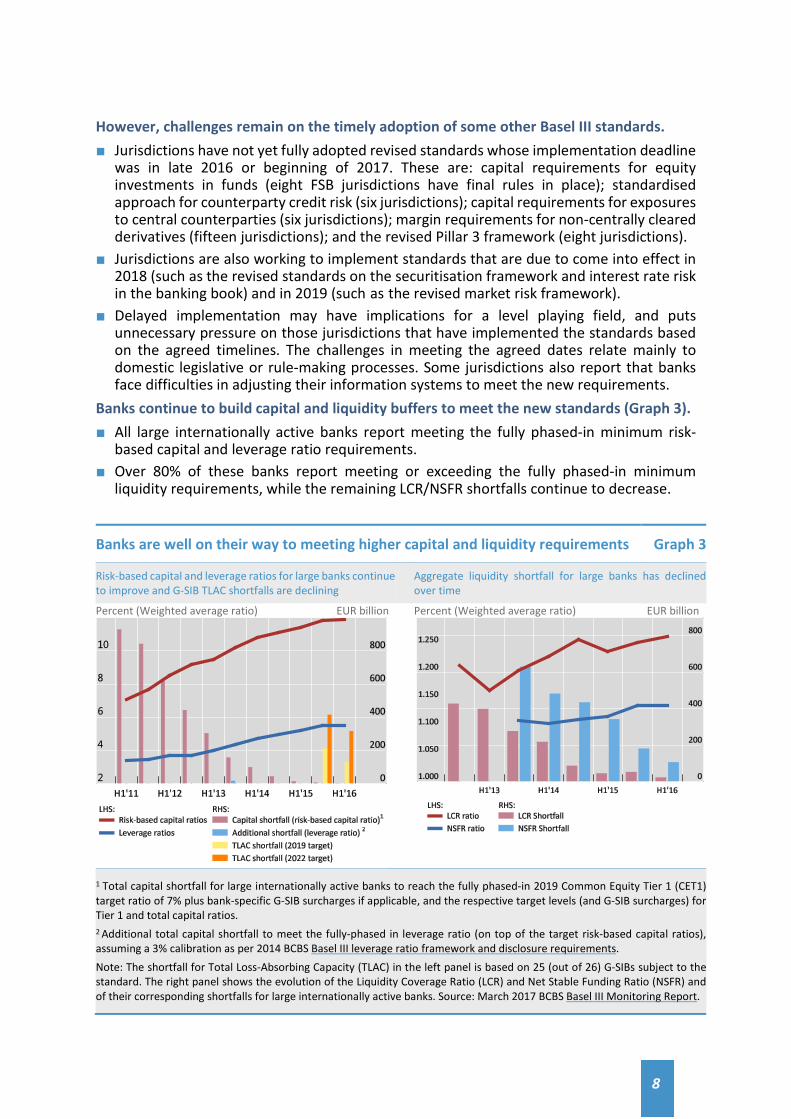
Banks continue to build capital and liquidity buffers to meet the new standards (Graph 3). ■ All large internationally active banks report meeting the fully phased-in minimum risk-
based capital and leverage ratio requirements. ■ Over 80% of these banks report meeting or exceeding the fully phased-in minimum
liquidity requirements, while the remaining LCR/NSFR shortfalls continue to decrease.
Banks are well on their way to meeting higher capital and liquidity requirements Graph 3
Risk-based capital and leverage ratios for large banks continue to improve and G-SIB TLAC shortfalls are declining
Aggregate liquidity shortfall for large banks has declined over time
Percent (Weighted average ratio) EUR billion Percent (Weighted average ratio) EUR billion
1 Total capital shortfall for large internationally active banks to reach the fully phased-in 2019 Common Equity Tier 1 (CET1) target ratio of 7% plus bank-specific G-SIB surcharges if applicable, and the respective target levels (and G-SIB surcharges) for Tier 1 and total capital ratios. 2 Additional total capital shortfall to meet the fully-phased in leverage ratio (on top of the target risk-based capital ratios), assuming a 3% calibration as per 2014 BCBS Basel III leverage ratio framework and disclosure requirements.
Note: The shortfall for Total Loss-Absorbing Capacity (TLAC) in the left panel is based on 25 (out of 26) G-SIBs subject to the standard. The right panel shows the evolution of the Liquidity Coverage Ratio (LCR) and Net Stable Funding Ratio (NSFR) and of their corresponding shortfalls for large internationally active banks. Source: March 2017 BCBS Basel III Monitoring Report.
9
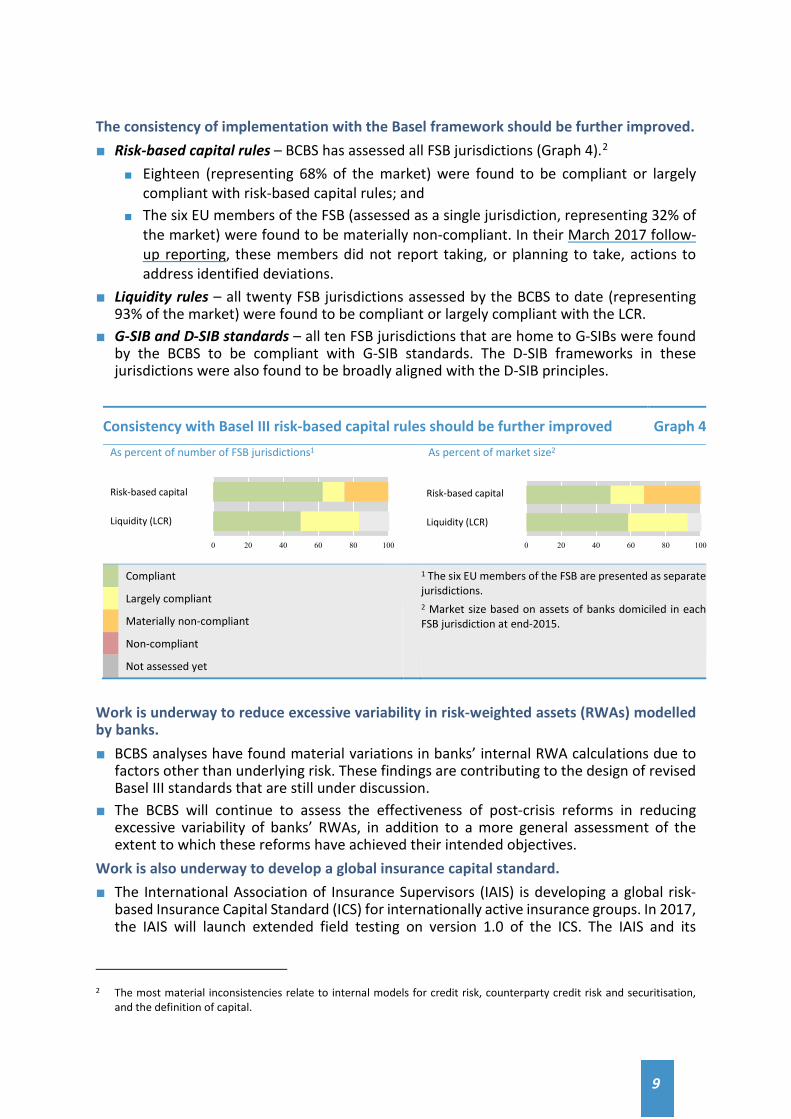
The consistency of implementation with the Basel framework should be further improved. ■ Risk-based capital rules – BCBS has assessed all FSB jurisdictions (Graph 4).2
■ Eighteen (representing 68% of the market) were found to be compliant or largely compliant with risk-based capital rules; and
■ The six EU members of the FSB (assessed as a single jurisdiction, representing 32% of the market) were found to be materially non-compliant. In their March 2017 follow-up reporting, these members did not report taking, or planning to take, actions to address identified deviations.
■ Liquidity rules – all twenty FSB jurisdictions assessed by the BCBS to date (representing 93% of the market) were found to be compliant or largely compliant with the LCR.
■ G-SIB and D-SIB standards – all ten FSB jurisdictions that are home to G-SIBs were found by the BCBS to be compliant with G-SIB standards. The D-SIB frameworks in these jurisdictions were also found to be broadly aligned with the D-SIB principles.
Consistency with Basel III risk-based capital rules should be further improved Graph 4 As percent of number of FSB jurisdictions1
As percent of market size2
Compliant
Largely compliant
Materially non-compliant
Non-compliant
Not assessed yet
1 The six EU members of the FSB are presented as separate jurisdictions. 2 Market size based on assets of banks domiciled in each FSB jurisdiction at end-2015.
Work is underway to reduce excessive variability in risk-weighted assets (RWAs) modelled by banks. ■ BCBS analyses have found material variations in banks’ internal RWA calculations due to
factors other than underlying risk. These findings are contributing to the design of revised Basel III standards that are still under discussion.
■ The BCBS will continue to assess the effectiveness of post-crisis reforms in reducing excessive variability of banks’ RWAs, in addition to a more general assessment of the extent to which these reforms have achieved their intended objectives.
Work is also underway to develop a global insurance capital standard. ■ The International Association of Insurance Supervisors (IAIS) is developing a global risk-
based Insurance Capital Standard (ICS) for internationally active insurance groups. In 2017, the IAIS will launch extended field testing on version 1.0 of the ICS. The IAIS and its
2 The most material inconsistencies relate to internal models for credit risk, counterparty credit risk and securitisation,
and the definition of capital.
Risk-based capital
Liquidity (LCR)
Risk-based capital
Liquidity (LCR)
0 20 40 60 80 100 0 20 40 60 80 100
10
members will continue to work on the key elements of the ICS, with implementation scheduled to start after adoption of a final version in 2019.
Adoption of regulatory and supervisory frameworks for compensation is almost completed. ■ All FSB jurisdictions have fully, or almost fully, implemented the FSB Principles and
Standards for Sound Compensation Practices, which aim to reduce incentives for excessive risk taking that may arise from the structure of firms’ compensation schemes.
■ Authorities remain focused on embedding oversight of compensation practices in bank supervision and further improving the governance and risk alignment of compensation. Supervisors and banks are working to evaluate effective implementation by back-testing or validating compensation systems.
■ The FSB has examined the role of compensation policy and tools in broader efforts to address misconduct risks, with a focus on banks. There is considerable variation across jurisdictions in the use of provisions for malus (to adjust the unvested portion of employees’ variable compensation on an ex post basis) and clawback (to recover the vested portion) in the event of misconduct. This may reflect, in part, uncertainties in the enforceability of these provisions. The FSB published a consultation with supplementary guidance to the Principles & Standards on the use of compensation tools to address misconduct risk.
2.2 Ending too-big-to-fail
Processes for identifying G-SIBs and G-SIIs are in place. ■ Lists of G-SIBs and global systemically important insurers (G-SIIs) are reviewed annually. In
March, the BCBS published a consultation document on its revised assessment framework for G-SIBs. The IAIS is developing an activities-based approach to systemic risk assessment in the insurance sector as part of the three-year review cycle of its systemic risk assessment methodology, scheduled to conclude in 2019.
■ The work on the assessment methodologies for identifying non-bank non-insurer global systemically important financial institutions (NBNI G-SIFIs) will be finalised after the work on addressing structural vulnerabilities from asset management activities is completed.
Implementation of the policy framework for G-SIFIs has advanced the most for G-SIBs. ■ Implementation of Higher Loss Absorbency as well as of reporting and disclosure
requirements for G-SIBs is proceeding on a timely basis (see section 2.1). ■ Supervisory frameworks have improved and supervisory colleges have been established
for almost all G-SIBs. Work is underway by the BCBS to address challenges relating to information sharing and coordinated risk assessments.
■ Most G-SIBs have not fully implemented the BCBS Principles on risk data aggregation and risk reporting. The level of compliance with the Principles is unsatisfactory and the overall implementation progress remains a source of concern to supervisors.3 The BCBS will continue to monitor progress in adopting the principles and has made additional recommendations to banks and supervisors to promote their adoption.
■ TLAC issuance strategies are now in place for almost all G-SIBs, and most of them are on course to meet the 2019 requirements.4 All G-SIB home authorities except one (China)4
3 See the BCBS report on Progress in adopting the Principles for effective risk data aggregation and risk reporting (March
2017). 4 Firms that are currently headquartered in an emerging market economy and designated as G-SIBs will comply with the
minimum TLAC requirements starting from 2025.
11
have issued proposals and four (Sweden, Switzerland, UK, US) have adopted final rules on external TLAC requirements. However, work remains to fully transpose TLAC into domestic regulations, including the BCBS standard on TLAC holdings and internal TLAC requirements for host authorities of material G-SIB subsidiaries.
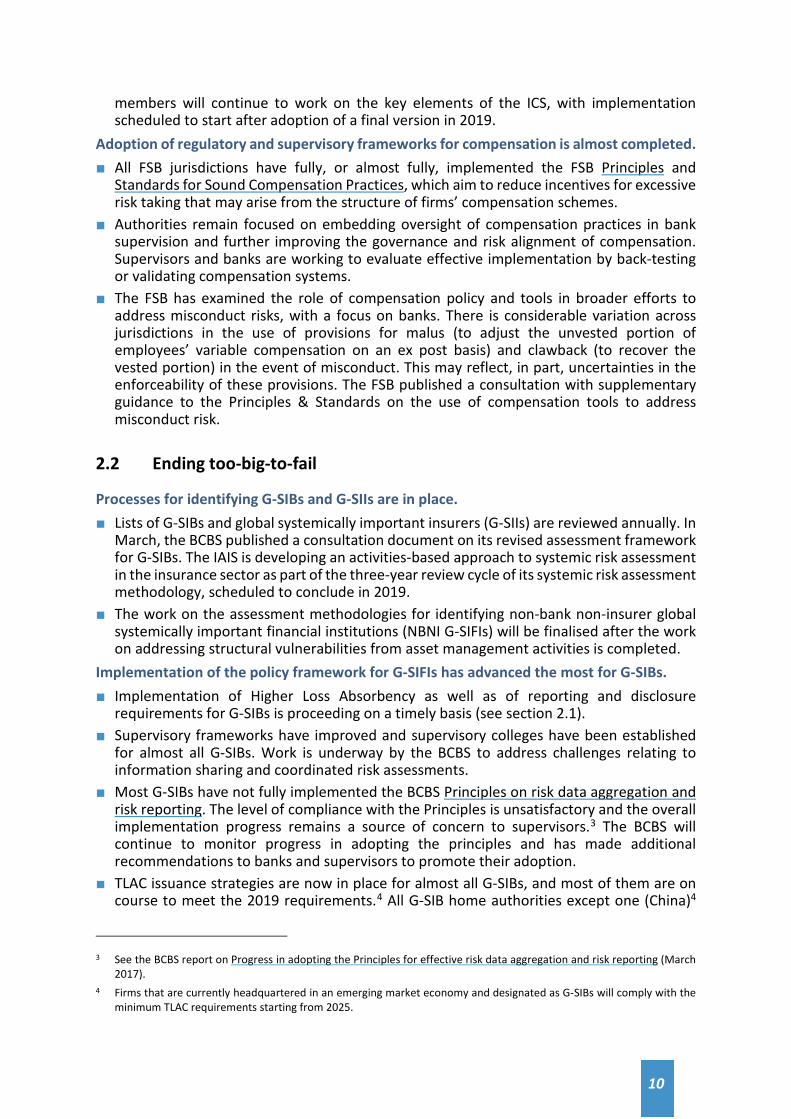
Substantial work remains in achieving effective resolution regimes and operationalising plans for systemically important banks and non-bank financial institutions (Graphs 5 and 6). ■ Only a subset of FSB jurisdictions, mostly G-SIB home jurisdictions, have implemented bank
resolution regimes with comprehensive powers broadly in line with the FSB Key Attributes of Effective Resolution Regimes for Financial Institutions. The powers most often lacking are bail-in and powers to impose a temporary stay on the exercise of early termination rights. There are reforms underway in several FSB jurisdictions to address some, but not all, of these gaps. Still, few of these reforms have been completed over the past year.
■ Crisis Management Groups (CMGs) have been established for all G-SIBs, and resolution planning is advancing. G-SIBs and authorities are taking actions to improve resolvability but significant work remains to address cross-border resolution issues (see section 2.7).
■ Impediments to resolvability identified through G-SIB resolvability assessments include arrangements to support operational continuity and continued access to financial market infrastructures by a firm in resolution, timely and accurate valuation capabilities, as well as the presence of financial and operational interdependencies. These issues are being addressed in international processes.5
■ Implementation of resolution reforms is less advanced in the insurance sector. While CMGs have been established and recovery plans adopted for most G-SIIs, the absence of insurance resolution regimes with a broad range of powers and tools in several G-SII home jurisdictions remains an important impediment to resolvability.
■ Systematic cross-border resolution planning processes are not yet in place for CCPs, but work is underway by the FSB to provide guidance on CCP resolution and resolution planning. For CCPs that are systemically important in more than one jurisdictions, home authorities have planned or started to establish CMGs and to develop institution-specific cooperation agreements (CoAgs).
More work is needed to implement comprehensive bank resolution regimes Graph 5 As percent of number of FSB jurisdictions1
As percent of market size2
Fully implemented/in place
Partially implemented/in place
Not implemented
1 The six EU members of the FSB are presented as separate jurisdictions. 2 Market size based on assets of banks domiciled in each FSB jurisdiction at end-2015. 3 Composite indicator on extent to which jurisdictions have transfer, bail-in and temporary stay powers in their regime.
5 See the FSB Sixth Report on the implementation of resolution reforms (July 2017).
Resolution powers3
Recovery planning
Resolution planning
Resolution powers3
Recovery planning
Resolution planning
0 20 40 60 80 100 0 20 40 60 80 100
12
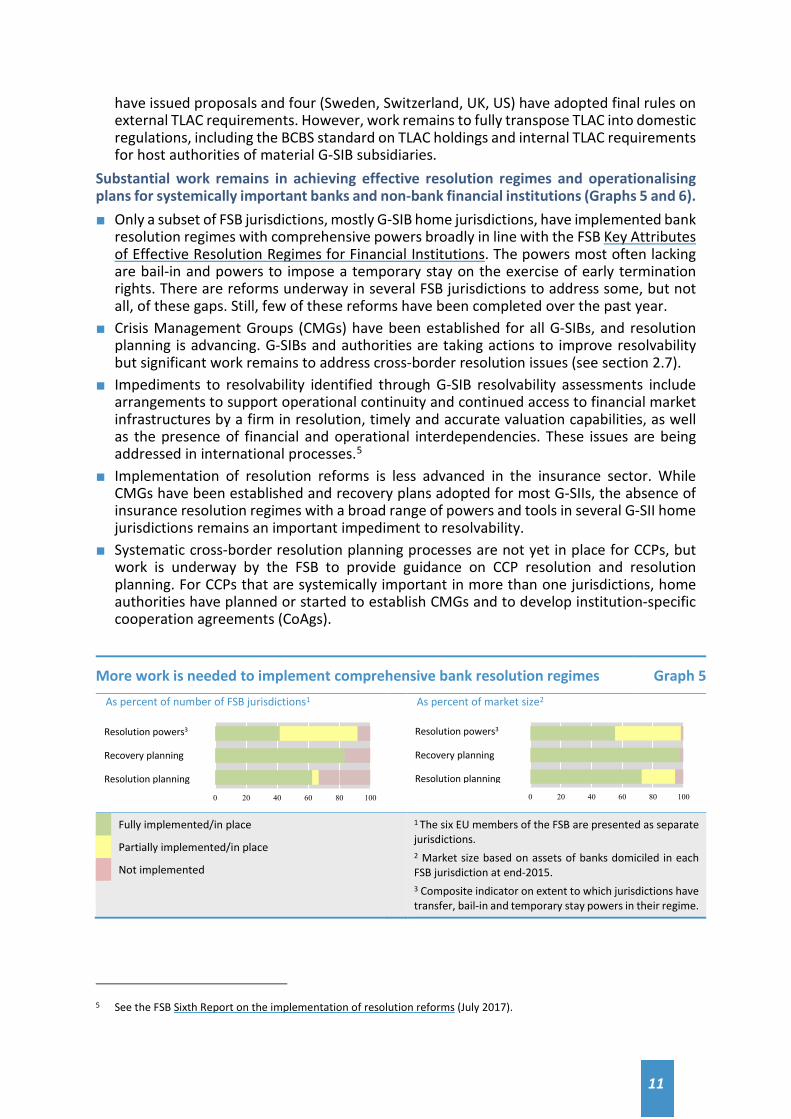
Progress in implementing resolution-related reforms has been uneven Graph 6
Progress has been more complete for G-SIB home jurisdictions
Progress in resolution planning is less advanced for G-SIIs
Number of FSB jurisdictions Percent of G-SIBs and G-SIIs in 2016/17
Note: The left panel shows the availability of bank resolution powers in FSB jurisdictions as of July 2016 and June 2017. The right panel shows the implementation status of G-SIB- and G-SII-specific resolution requirements as of August 2016 and June 2017. The G-SIBs and G-SIIs that were added/removed from the list in those years have been excluded to ensure a consistent sample. Source: FSB Sixth Report on the implementation of resolution reforms (July 2017).
2.3 Making derivatives markets safer
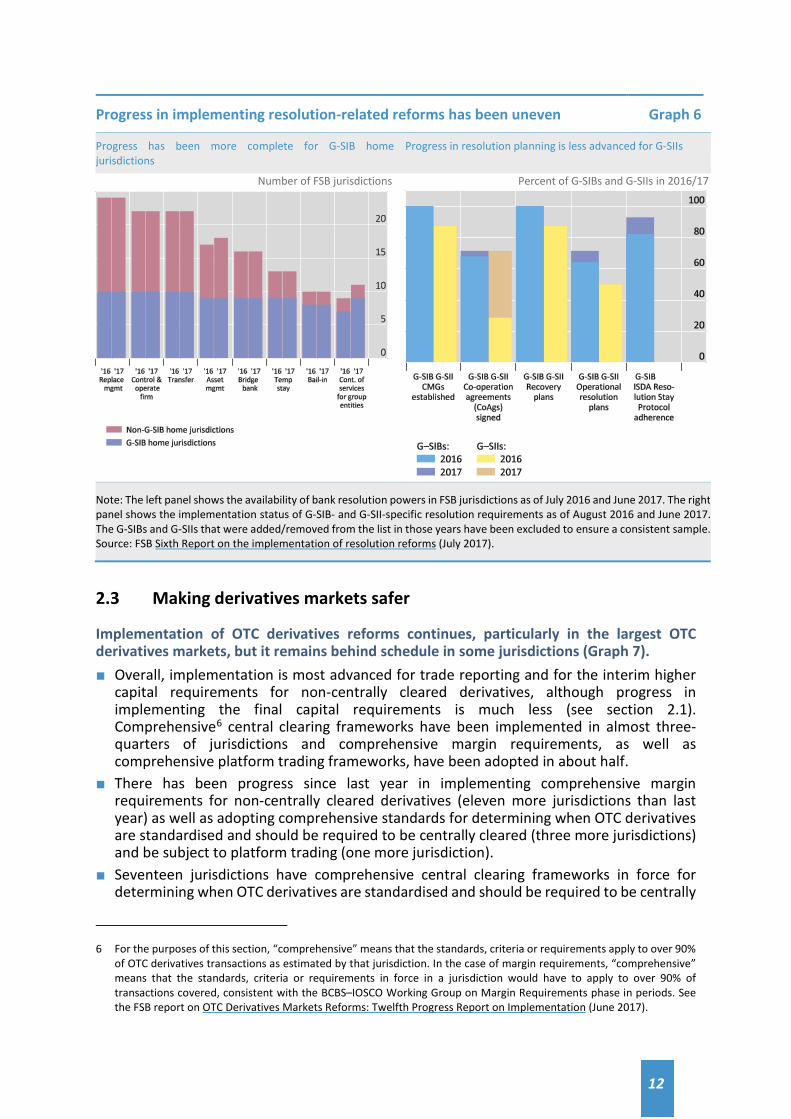
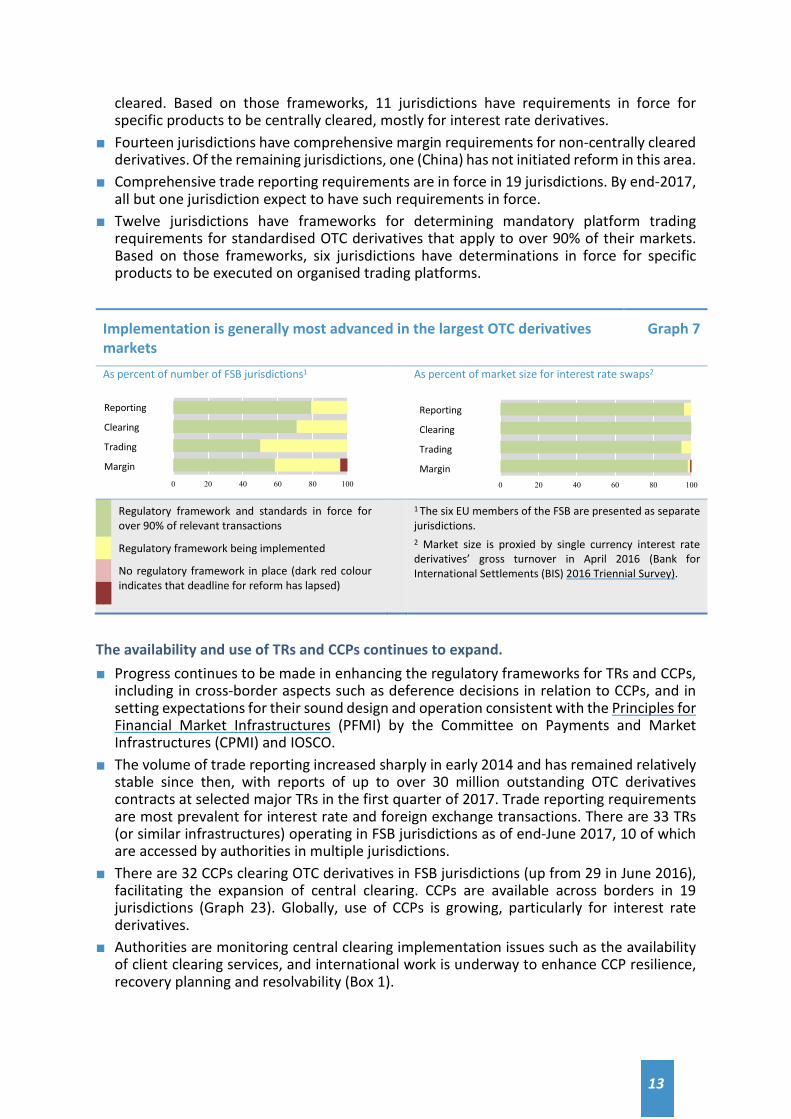
Implementation of OTC derivatives reforms continues, particularly in the largest OTC derivatives markets, but it remains behind schedule in some jurisdictions (Graph 7). ■ Overall, implementation is most advanced for trade reporting and for the interim higher
capital requirements for non-centrally cleared derivatives, although progress in implementing the final capital requirements is much less (see section 2.1). Comprehensive6 central clearing frameworks have been implemented in almost three-quarters of jurisdictions and comprehensive margin requirements, as well as comprehensive platform trading frameworks, have been adopted in about half.
■ There has been progress since last year in implementing comprehensive margin requirements for non-centrally cleared derivatives (eleven more jurisdictions than last year) as well as adopting comprehensive standards for determining when OTC derivatives are standardised and should be required to be centrally cleared (three more jurisdictions) and be subject to platform trading (one more jurisdiction).
■ Seventeen jurisdictions have comprehensive central clearing frameworks in force for determining when OTC derivatives are standardised and should be required to be centrally
6 For the purposes of this section, “comprehensive” means that the standards, criteria or requirements apply to over 90%
of OTC derivatives transactions as estimated by that jurisdiction. In the case of margin requirements, “comprehensive” means that the standards, criteria or requirements in force in a jurisdiction would have to apply to over 90% of transactions covered, consistent with the BCBS–IOSCO Working Group on Margin Requirements phase in periods. See the FSB report on OTC Derivatives Markets Reforms: Twelfth Progress Report on Implementation (June 2017).
13
cleared. Based on those frameworks, 11 jurisdictions have requirements in force for specific products to be centrally cleared, mostly for interest rate derivatives.
■ Fourteen jurisdictions have comprehensive margin requirements for non-centrally cleared derivatives. Of the remaining jurisdictions, one (China) has not initiated reform in this area.
■ Comprehensive trade reporting requirements are in force in 19 jurisdictions. By end-2017, all but one jurisdiction expect to have such requirements in force.
■ Twelve jurisdictions have frameworks for determining mandatory platform trading requirements for standardised OTC derivatives that apply to over 90% of their markets. Based on those frameworks, six jurisdictions have determinations in force for specific products to be executed on organised trading platforms.
Implementation is generally most advanced in the largest OTC derivatives markets
Graph 7
As percent of number of FSB jurisdictions1
As percent of market size for interest rate swaps2
Regulatory framework and standards in force for over 90% of relevant transactions
Regulatory framework being implemented
No regulatory framework in place (dark red colour indicates that deadline for reform has lapsed)
1 The six EU members of the FSB are presented as separate jurisdictions. 2 Market size is proxied by single currency interest rate derivatives’ gross turnover in April 2016 (Bank for International Settlements (BIS) 2016 Triennial Survey).
The availability and use of TRs and CCPs continues to expand. ■ Progress continues to be made in enhancing the regulatory frameworks for TRs and CCPs,
including in cross-border aspects such as deference decisions in relation to CCPs, and in setting expectations for their sound design and operation consistent with the Principles for Financial Market Infrastructures (PFMI) by the Committee on Payments and Market Infrastructures (CPMI) and IOSCO.
■ The volume of trade reporting increased sharply in early 2014 and has remained relatively stable since then, with reports of up to over 30 million outstanding OTC derivatives contracts at selected major TRs in the first quarter of 2017. Trade reporting requirements are most prevalent for interest rate and foreign exchange transactions. There are 33 TRs (or similar infrastructures) operating in FSB jurisdictions as of end-June 2017, 10 of which are accessed by authorities in multiple jurisdictions.
■ There are 32 CCPs clearing OTC derivatives in FSB jurisdictions (up from 29 in June 2016), facilitating the expansion of central clearing. CCPs are available across borders in 19 jurisdictions (Graph 23). Globally, use of CCPs is growing, particularly for interest rate derivatives.
■ Authorities are monitoring central clearing implementation issues such as the availability of client clearing services, and international work is underway to enhance CCP resilience, recovery planning and resolvability (Box 1).
Reporting
Clearing
Trading
Margin
Reporting
Clearing
Trading
Margin
0 20 40 60 80 100 0 20 40 60 80 100
14
Box 1: Update on the FSB and SSBs’ joint work programme to enhance CCP resilience, recovery and resolvability
The FSB, BCBS, CPMI and IOSCO agreed a joint workplan in 2015 to coordinate their respective international policy work aimed at enhancing the resilience, recovery planning, resolvability of CCPs, and to work in close collaboration. Complementing this work is a study of interdependencies in central clearing. Implementation of the workplan at the international level is now largely complete. Resilience: In July 2017, CPMI and IOSCO will publish further guidance on several Principles and Key Considerations of the PFMI with respect to financial risk management of CCPs, and in particular on governance, credit and liquidity stress testing, coverage of financial resources, margin, and a CCP’s contributions of its financial resources to losses. The CPMI and IOSCO published in June 2017 a consultative report on a framework for supervisory stress testing of CCPs, which is expected to be finalised in 2018. Recovery planning: To further improve the recovery planning for CCPs, the CPMI and IOSCO have reviewed the guidance provided in the 2014 Recovery Report taking into account the comments submitted to the report on resilience and recovery that was published in August 2016. The recovery guidance, published in July 2017, provides additional clarifications in four areas of recovery planning: (i) operationalisation of the recovery plan; (ii) replenishment; (iii) non-default related losses; and (iv) transparency with respect to recovery tools and how they work. Resolution: In July 2017, the FSB released Guidance on CCP Resolution and Resolution Planning, which is intended to assist authorities in resolution planning and promote international consistency. It complements the Key Attributes and FMI Annex by providing guidance on implementing resolution arrangements for CCPs. Analysis of interdependencies. Macroprudential considerations associated with the interconnectedness of CCPs and G-SIBs have come to the fore. A joint BCBS, CPMI, FSB and IOSCO study group was established to identify, quantify and analyse interdependencies between CCPs and major financial institutions and any resulting systemic implications. The key findings were published in July 2017. The focus of the next phase of the work is on:
- continued monitoring of implementation of the principles in the PFMI regarding resilience and recovery of CCPs, and the finalisation of the framework on supervisory stress testing for CCPs;
- implementation of the Key Attributes consistent with the expectations regarding CCP resolution and resolution planning expanded upon in the CCP resolution guidance, supported by establishment of CMGs for CCPs that are systemically important in more than one jurisdiction (including the home jurisdiction) and adoption of cooperation agreements, and further work on financial resources to support resolution;
- additional analysis of central clearing interdependencies to assess whether the key findings are stable over time; and
- further work to assess incentives to clear centrally arising from the interaction of post-crisis reforms.
15
Significant work is still needed to make trade reporting truly effective (see section 3). ■ Although implementation has progressed in recent years, challenges to effective trade
reporting remain, including a lack of harmonisation of data formats and data quality issues, and legal barriers to full reporting of and authorities’ access to TR data.
■ A number of jurisdictions have taken action, or action is underway, as reported in FSB members’ plans to address legal barriers to reporting and accessing OTC derivatives transaction data, in response to the FSB’s recommendations of the 2015 trade reporting peer review.7
■ The usefulness of TR data continues to be limited by data quality issues, including differences in the details of reporting requirements among TRs and jurisdictions that make it challenging to aggregate or compare data from different sources. SSBs are working to promote greater data harmonisation through guidance on unique product and transaction identifiers and other critical data elements, while the FSB is developing proposals for the governance of those identifiers.8
2.4 Transforming shadow banking into resilient market-based finance
■ The FSB has created a system-wide monitoring framework to assess global trends and risks in the shadow banking system and, in collaboration with SSBs, has been developing policy measures to strengthen oversight and regulation.9
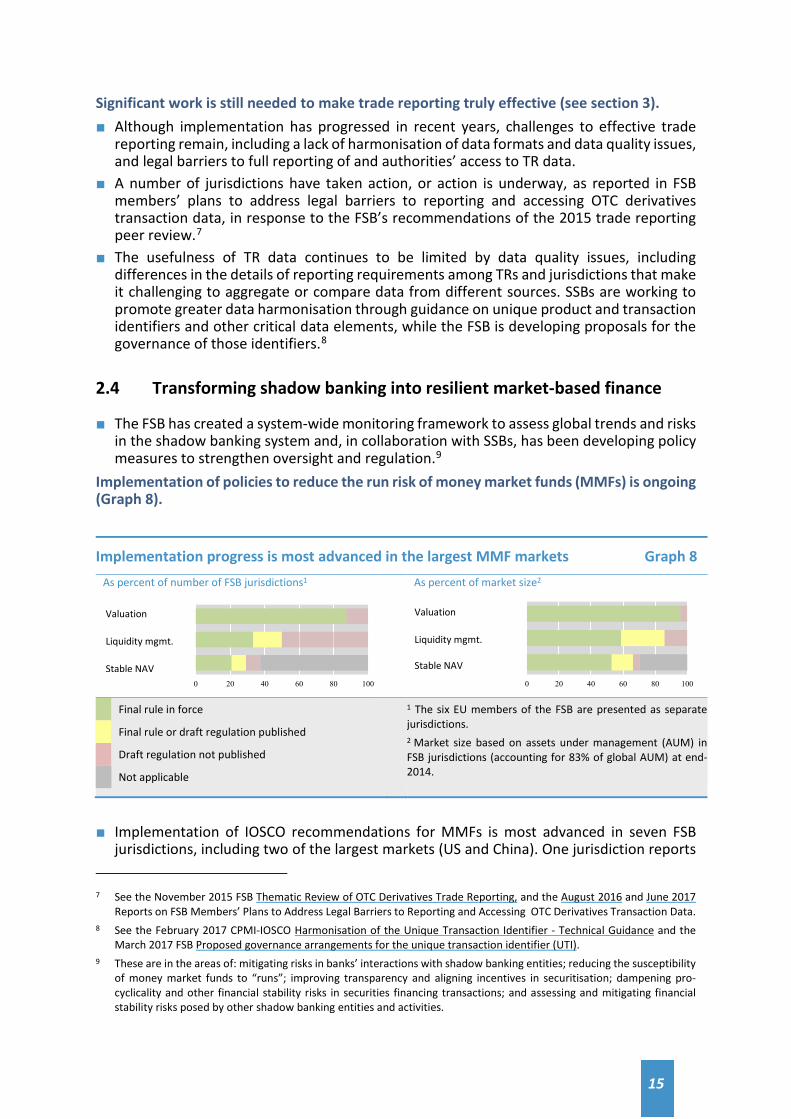
Implementation of policies to reduce the run risk of money market funds (MMFs) is ongoing (Graph 8).
Implementation progress is most advanced in the largest MMF markets Graph 8 As percent of number of FSB jurisdictions1
As percent of market size2
Final rule in force
Final rule or draft regulation published
Draft regulation not published
Not applicable
1 The six EU members of the FSB are presented as separate jurisdictions. 2 Market size based on assets under management (AUM) in FSB jurisdictions (accounting for 83% of global AUM) at end-2014.
■ Implementation of IOSCO recommendations for MMFs is most advanced in seven FSB
jurisdictions, including two of the largest markets (US and China). One jurisdiction reports 7 See the November 2015 FSB Thematic Review of OTC Derivatives Trade Reporting, and the August 2016 and June 2017
Reports on FSB Members’ Plans to Address Legal Barriers to Reporting and Accessing OTC Derivatives Transaction Data. 8 See the February 2017 CPMI-IOSCO Harmonisation of the Unique Transaction Identifier - Technical Guidance and the
March 2017 FSB Proposed governance arrangements for the unique transaction identifier (UTI). 9 These are in the areas of: mitigating risks in banks’ interactions with shadow banking entities; reducing the susceptibility
of money market funds to “runs”; improving transparency and aligning incentives in securitisation; dampening pro-cyclicality and other financial stability risks in securities financing transactions; and assessing and mitigating financial stability risks posed by other shadow banking entities and activities.
Valuation
Liquidity mgmt.
Stable NAV
Valuation
Liquidity mgmt. Stable NAV
0 20 40 60 80 100 0 20 40 60 80 100
16
progress in this area since last year. A new EU regulation on MMFs is expected to come into force in July 2017, with most provisions applying 12 months after entry into force.
■ Twenty-one FSB jurisdictions have implemented the fair value approach for the valuation of MMF portfolios, but progress in liquidity management is less advanced and less even.
■ Nine FSB jurisdictions continue to permit MMFs that offer a stable net asset value (NAV), and further work is needed in some of these jurisdictions to reinforce the resilience of those funds and their ability to meet redemptions.
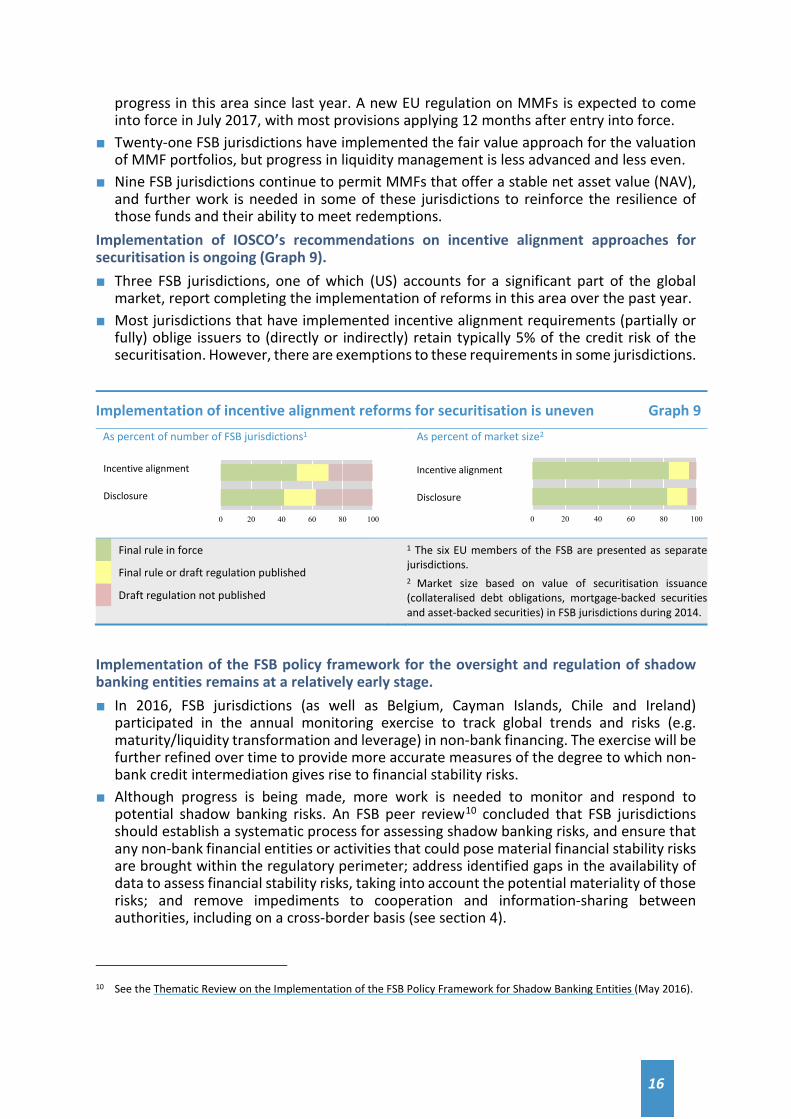
Implementation of IOSCO’s recommendations on incentive alignment approaches for securitisation is ongoing (Graph 9). ■ Three FSB jurisdictions, one of which (US) accounts for a significant part of the global
market, report completing the implementation of reforms in this area over the past year. ■ Most jurisdictions that have implemented incentive alignment requirements (partially or
fully) oblige issuers to (directly or indirectly) retain typically 5% of the credit risk of the securitisation. However, there are exemptions to these requirements in some jurisdictions.
Implementation of incentive alignment reforms for securitisation is uneven Graph 9 As percent of number of FSB jurisdictions1
As percent of market size2
Final rule in force
Final rule or draft regulation published
Draft regulation not published
1 The six EU members of the FSB are presented as separate jurisdictions. 2 Market size based on value of securitisation issuance (collateralised debt obligations, mortgage-backed securities and asset-backed securities) in FSB jurisdictions during 2014.
Implementation of the FSB policy framework for the oversight and regulation of shadow banking entities remains at a relatively early stage. ■ In 2016, FSB jurisdictions (as well as Belgium, Cayman Islands, Chile and Ireland)
participated in the annual monitoring exercise to track global trends and risks (e.g. maturity/liquidity transformation and leverage) in non-bank financing. The exercise will be further refined over time to provide more accurate measures of the degree to which non-bank credit intermediation gives rise to financial stability risks.
■ Although progress is being made, more work is needed to monitor and respond to potential shadow banking risks. An FSB peer review10 concluded that FSB jurisdictions should establish a systematic process for assessing shadow banking risks, and ensure that any non-bank financial entities or activities that could pose material financial stability risks are brought within the regulatory perimeter; address identified gaps in the availability of data to assess financial stability risks, taking into account the potential materiality of those risks; and remove impediments to cooperation and information-sharing between authorities, including on a cross-border basis (see section 4).
10 See the Thematic Review on the Implementation of the FSB Policy Framework for Shadow Banking Entities (May 2016).
Incentive alignment
Disclosure
Incentive alignment
Disclosure
0 20 40 60 80 100 0 20 40 60 80 100
17
Implementation of reforms in other shadow banking policy areas is also at an early stage. ■ In order to mitigate spillovers of risks to the banking system, the BCBS is developing a
framework for the identification and management of step-in risk.11 Eight jurisdictions have completed the adoption of risk-based capital requirements for banks’ investments in the equity of funds (which came into force in 2017). Two jurisdictions have adopted the supervisory framework for measuring and controlling banks’ large exposures (to come into force in 2019).
■ Jurisdictions are at an early stage of implementing the FSB policy recommendations on securities financing transactions, including minimum haircut floors, some of which are being phased-in by end-2018. Standards and processes for global securities financing data collection and aggregation that are relevant for financial stability monitoring and policy responses should be in place by end-2018.
2.5 Progress in other reform areas
■ Most jurisdictions have identified a macroprudential authority or established inter-agency bodies for macroprudential policies, strengthened system-wide monitoring, and are using tools to address financial stability risks. However, as indicated by IMF-World Bank Financial Sector Assessment Program (FSAP) assessments and FSB country reviews, additional work may be needed in some jurisdictions to ensure macroprudential frameworks are effective.
■ The implementation of the second phase of the G20 Data Gaps Initiative (DGI), which aims to address the gaps identified in the global financial crisis by enhancing the collection and dissemination of reliable and timely statistics for policy use, is underway. Within this Initiative, specific recommendations to G20 members and other participating economies to enhance sharing of granular data at national and international level (e.g. through common identifiers as well as by revisiting, as appropriate, confidentiality rules and legal frameworks) were agreed in a G20 DGI workshop and welcomed by the G20 in March 2017.
■ In the wake of misconduct concerns, the administrators of the most widely used interest rate benchmarks (EURIBOR, LIBOR and TIBOR) continue to take steps to improve the robustness of these benchmarks, although these have not yet been completed. Progress is also being made by market participants, working with authorities, to identify near-risk-free interest rate benchmarks and to increase their market use where appropriate, as well as to ensure contract robustness. In addition, a Global Code of Conduct, aiming to promote the integrity and effective functioning of the wholesale foreign exchange market, was issued in May 2017 by a working group under the auspices of the BIS Markets Committee.
■ An FSB peer review took stock of jurisdictions’ implementation of the G20/Organisation for Economic Co-operation and Development (OECD) Principles of Corporate Governance for publicly listed financial institutions, and made recommendations to improve them.12
■ Of the three FSB jurisdictions identified in a 2012 FSB peer review as not having an explicit deposit insurance system, only one (South Africa) has not yet introduced one.
■ All relevant jurisdictions report having an oversight framework with registration and ongoing requirements for hedge funds or their managers, and strengthening the regulatory/capital framework for monoline insurers in relation to structured credit.
■ Almost all jurisdictions report that they have put in place requirements for the registration and oversight of credit rating agencies (CRAs). However, more work remains to avoid mechanistic reliance on CRA ratings by reducing references to CRA ratings in national laws
11 Step-in risk refers to the risk that a bank will provide financial support to a non-bank financial entity beyond, or in the
absence of, its contractual obligations should the entity experience financial stress. 12 See the Thematic Review on Corporate Governance (April 2017).
18
and regulations, developing alternative standards of creditworthiness, and enhancing firms’ credit assessment capabilities.
■ The global Legal Entity Identifier (LEI) system has issued over 500,000 LEIs in 195 countries and started collecting information on parent entities in May 2017, which will assist in risk aggregation. This unique identifier is used in two-thirds of FSB jurisdictions to support regulatory activities, for instance in connection with financial transaction reporting. Additional uses are contemplated, such as in the area of correspondent banking. Further adoption of the LEI by legal entities worldwide and its use by authorities for regulatory purposes is essential to fully reap its collective benefits.
■ The international and US accounting standard setters have issued separate standards on expected loan loss provisioning (to come into force in 2018 and 2020 respectively), both of which are forward-looking and take account of the lessons of the crisis. The FSB has asked the standard-setters to monitor the consistent implementation of these standards and, more generally, to continue to seek opportunities for meeting the G20’s call for further accounting convergence. With regard to insurance contracts, the International Accounting Standards Board (IASB) published IFRS 17 in May 2017 (with entry into force in 2021), for the accounting on insurance contract liabilities that is expected to provide more relevant information and be beneficial for financial stability.
■ The FSB is engaging with the International Forum of Independent Audit Regulators (IFIAR) and global accounting firms to enhance the quality of audits of G-SIFIs. In March 2017, IFIAR published the latest annual survey of findings from its members’ inspections of audit firms. Despite showing a general decline in inspection finding rates, the continued high rates show a lack of consistency in the execution of high quality audits and may point to the need for firms to revise their systems of quality control.
■ Several jurisdictions report ongoing work to enhance the regulation and supervision of commodity markets; strengthen market integrity and efficiency by addressing the risks posed by high frequency trading and dark liquidity pools; and integrate financial consumer protection into institutional, regulatory and supervisory frameworks.
2.6 Strengthening adherence to international financial standards
FSB members are implementing their commitments to lead by example.13 ■ FSB jurisdictions that have not had an FSAP assessment in the last five years are undergoing
one in 2017-19 (Australia, Brazil, China, France, India, Japan, Saudi Arabia, Spain). The FSAPs for Indonesia, Mexico, Netherlands and Turkey were completed over the past year.
■ Almost all FSB jurisdictions have now published the results of their compliance assessments in Reports on Standards and Codes published by the IMF and World Bank.
■ Over the past year, the FSB completed the country peer reviews of Japan, Brazil and France, while reviews of Argentina, Korea, Singapore and Hong Kong are underway.
13 See the FSB webpages on FSAP participation and on FSB country peer reviews.
19
2.7 Key implementation challenge: global regulatory cooperation
Further global cooperation is necessary for effective implementation of G20 reforms and to avoid higher costs and reduced financing for the economy. ■ Much financial market activity takes place on a cross-border basis, necessitating
cooperation by national authorities. The potential for rapid transmission of shocks across the globe has been one of the most important lessons of the financial crisis.
■ International standards are voluntary in nature, but are a critical underpinning of a globally integrated financial system. They are developed by authorities working together in recognition of the benefits of consistent minimum standards in creating a resilient and open global financial system. Implementation of the standards and policies agreed internationally within the FSB and SSBs is ultimately a matter for individual authorities. Transparent reporting on implementation progress helps authorities to implement G20 reforms on a consistent basis, including by identifying and resolving cross-border issues.
■ Cooperation among financial authorities promotes a level playing field and reduces opportunities for regulatory arbitrage. It also helps avoid fragmentation of pools of funding and liquidity, as well as reducing inefficiencies and frictions that constrain the risk-sharing capacity of the global market and increase the costs of doing business.
■ The ability of national authorities to share information through effective legal arrangements and memoranda of understanding is foundational to global cooperation. Data privacy and bank secrecy laws can sometimes make information-sharing difficult, and thereby impede the effectiveness and enforceability of financial regulatory reforms.
■ Areas where cooperation among authorities might be enhanced should continue to be identified and addressed. The merits of further work should be evaluated. This would help promote an open and integrated system (see section 6.1) by leveraging cooperation to address areas of inconsistency or duplication in the application of jurisdictional requirements in cross-border contexts.
There are a number of examples where further global cooperation and information sharing, including via the removal of legal barriers that impede such cooperation, is needed. Resolution regimes ■ Effective resolution planning and the orderly resolution of a cross-border bank require
national authorities to have legal powers and efficient processes for sharing information, to have developed firm-specific CoAgs with host authorities on CMGs for G-SIFIs, and to be able to give prompt effect to foreign resolution actions.
■ Significant work remains to put these arrangements in place and to remove impediments to cooperation and the sharing of resolution-related information with all relevant authorities. CoAgs are still not in place for nine G-SIBs and three G-SIIs (Graph 6).
■ More progress is also needed to put in place mechanisms for giving cross-border effect to resolution actions. G-SIB home jurisdictions have fallen behind in implementing their commitment to adopt regulations that promote the cross-border effectiveness of temporary stays through adherence to the International Swaps and Derivatives Association (ISDA) resolution stay protocol by the broader market, particularly significant G-SIB counterparties. Only some FSB jurisdictions have such mechanisms in place, though reforms are underway in a number of other jurisdictions.
OTC derivatives ■ Some authorities note that unevenness in the pace of implementation as well as
inconsistencies or gaps in applying requirements to cross-border transactions (e.g. with respect to trade reporting and central clearing) can result in conflicting or duplicative requirements, or lead to opportunities for regulatory arbitrage; and that differences in
20
recognition/equivalence requirements can lead to complex and time-consuming bilateral recognition processes of derivatives regulatory frameworks.
■ Authorities continue to engage bilaterally and in multilateral fora, with some positive developments taking place on identified cross-border issues. For example, advances have been made in cross-border recognition of CCPs clearing OTC derivatives, with many CCPs newly authorised in FSB jurisdictions over the past year, as well as through deference decisions and in formalising legal powers to exercise deference to other regimes when they achieve similar outcomes.14
The FSB and SSBs, by leveraging their members’ expertise and shared objectives, are promoting approaches to deepen cross-border cooperation and helping to build trust. Developing standards for cooperation ■ On resolution, the FSB issued Principles for Cross-border Effectiveness of Resolution
Actions and Guidance on Cooperation and Information Sharing with Host Authorities of Jurisdictions where a G-SIFI has a Systemic Presence that are Not Represented on its CMG in 2015. It will also issue final guidance on internal TLAC mechanisms in July 2017, whose implementation is essential to ensure the cross-border resolvability of G-SIBs and to provide host authorities with comfort that there is sufficient loss-absorbing and recapitalisation capacity available to material subsidiaries in their jurisdictions.
■ On OTC derivatives reforms, the FSB and SSBs are working together to improve cross-border consistency and cooperation with respect to harmonisation of trade reporting data elements and the removal of barriers to full reporting and sharing of TR-held data (see section 2.3).
■ IOSCO and IAIS have developed Multilateral Memoranda of Understanding (MMoUs) to cooperate and exchange information for regulatory enforcement in the securities sector and supervision in the insurance sector.15 All securities regulators and most insurance supervisors in FSB jurisdictions have now become full signatories of those MMoUs.
Monitoring implementation and evaluating effects ■ A robust and transparent approach to monitoring and reporting on implementation and to
evaluating effects underpins the international reform process. ■ Over the past few years, the FSB and SSBs have established implementation monitoring
and reporting mechanisms to examine the timeliness of implementation of G20 reforms by national/regional authorities (via laws, regulations and supervisory guidance); the completeness and consistency of domestic rules with international standards; and the adoption of rules by market participants, including the consistency of outcomes to ensure a level playing field.
■ The FSB, in close collaboration with the SSBs, has developed a framework for post-implementation evaluation of the effects of the G20 financial regulatory reforms (see section 7 on the main elements of the evaluation framework).
14 The G20 Leaders at the 2013 St Petersburg Summit agreed that “jurisdictions and regulators should be able to defer to
each other when it is justified by the quality of their respective regulatory and enforcement regimes, based on similar outcomes, in a non-discriminatory way, paying due respect to home country regulatory regimes.”
15 See the respective IOSCO and IAIS webpages.
21
3. OTC derivatives market reforms ■ Implementation of these reforms is now well progressed, although this has taken longer
than originally intended due to the scale and complexity of reforms and other challenges (see section 2.3). Implementation is still ongoing and is generally most advanced in the largest OTC derivatives markets. Further effort will be required to finish the job.
Mitigating systemic risk, improving transparency, protecting against market abuse ■ Overall, although reforms are still being implemented, authorities are increasingly able to
observe the effects of the reforms and ongoing progress toward meeting the G20 Leaders’ objectives.
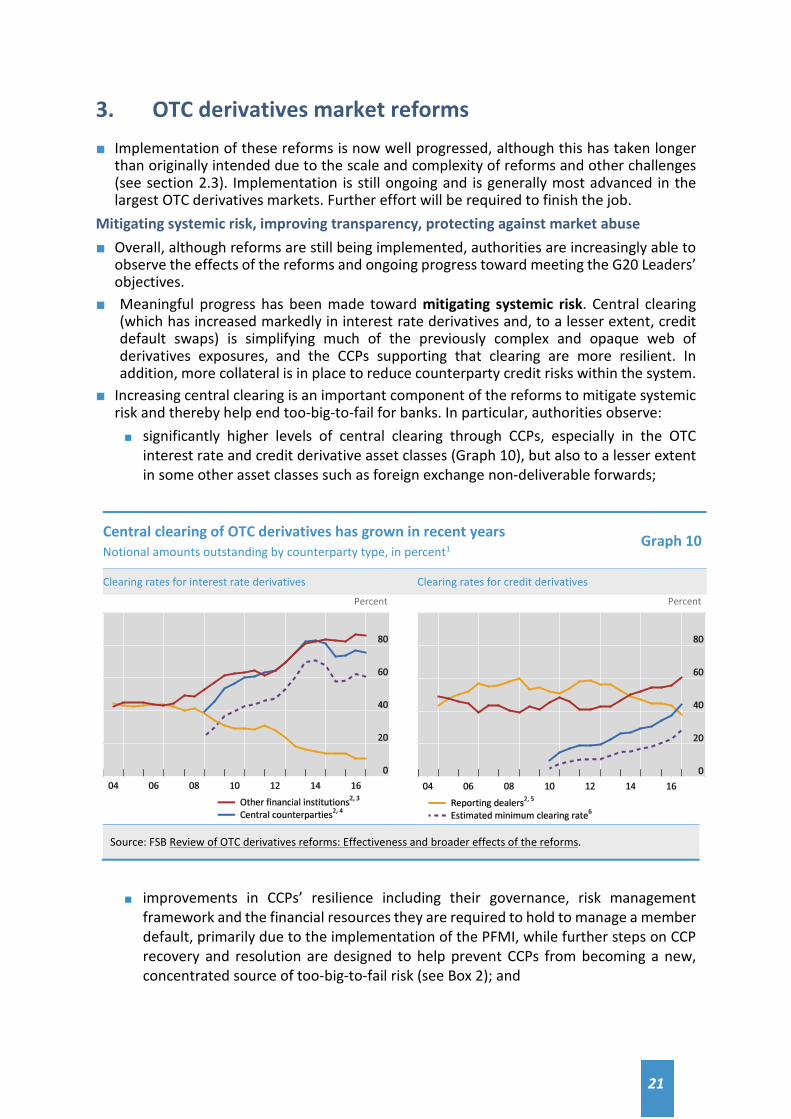
■ Meaningful progress has been made toward mitigating systemic risk. Central clearing (which has increased markedly in interest rate derivatives and, to a lesser extent, credit default swaps) is simplifying much of the previously complex and opaque web of derivatives exposures, and the CCPs supporting that clearing are more resilient. In addition, more collateral is in place to reduce counterparty credit risks within the system.
■ Increasing central clearing is an important component of the reforms to mitigate systemic risk and thereby help end too-big-to-fail for banks. In particular, authorities observe: ■ significantly higher levels of central clearing through CCPs, especially in the OTC
interest rate and credit derivative asset classes (Graph 10), but also to a lesser extent in some other asset classes such as foreign exchange non-deliverable forwards;
Central clearing of OTC derivatives has grown in recent years Notional amounts outstanding by counterparty type, in percent1
Graph 10
Clearing rates for interest rate derivatives Clearing rates for credit derivatives
Percent Percent
Source: FSB Review of OTC derivatives reforms: Effectiveness and broader effects of the reforms.
■ improvements in CCPs’ resilience including their governance, risk management
framework and the financial resources they are required to hold to manage a member default, primarily due to the implementation of the PFMI, while further steps on CCP recovery and resolution are designed to help prevent CCPs from becoming a new, concentrated source of too-big-to-fail risk (see Box 2); and
22
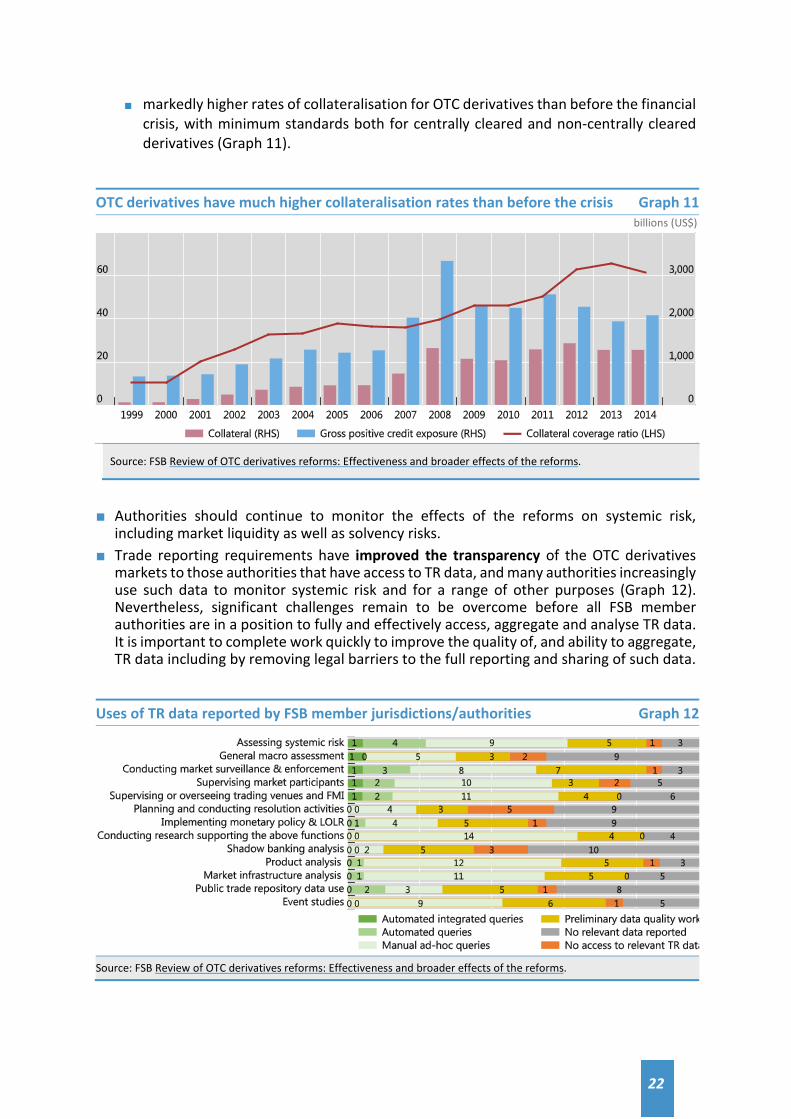
■ markedly higher rates of collateralisation for OTC derivatives than before the financial crisis, with minimum standards both for centrally cleared and non-centrally cleared derivatives (Graph 11).
Source: FSB Review of OTC derivatives reforms: Effectiveness and broader effects of the reforms.
■ Authorities should continue to monitor the effects of the reforms on systemic risk,
including market liquidity as well as solvency risks. ■ Trade reporting requirements have improved the transparency of the OTC derivatives
markets to those authorities that have access to TR data, and many authorities increasingly use such data to monitor systemic risk and for a range of other purposes (Graph 12). Nevertheless, significant challenges remain to be overcome before all FSB member authorities are in a position to fully and effectively access, aggregate and analyse TR data. It is important to complete work quickly to improve the quality of, and ability to aggregate, TR data including by removing legal barriers to the full reporting and sharing of such data.
OTC derivatives have much higher collateralisation rates than before the crisis Graph 11 billions (US$)
Uses of TR data reported by FSB member jurisdictions/authorities Graph 12
Source: FSB Review of OTC derivatives reforms: Effectiveness and broader effects of the reforms.
23
■ In addition, market transparency has increased in those jurisdictions where TRs, trading platforms, CCPs or authorities make information about OTC derivative transactions or markets available to the public.
■ Further study should be made of the effects of the reforms in protecting against market abuse. There is little evidence on this at present, although some authorities report using TR data for market surveillance purposes.
Broader effects of reforms ■ Regarding financial market infrastructures, the reforms have resulted in an increase in
the number of authorised TRs, and in the number of CCPs offering clearing of OTC derivatives, including those that operate on a cross-border basis. These reforms have also been accompanied by enhancements in post-trade services that support risk mitigation, including expanded portfolio reconciliation, compression and valuation services, and improved documentation practices.
■ The main market structure changes relate to increased rates of and participation in central clearing, and also early evidence of increased liquidity and reduced spreads in some product markets. However, there are concerns about possible reductions in liquidity in some other markets. Also, market intelligence suggests that some, particularly smaller, firms are facing challenges in accessing clearing arrangements, and that some CCP clearing members are withdrawing services to some clients or are not offering services to new clients. This is an issue that authorities are watching closely.
■ A range of views have been expressed on the impact of market reforms on spreads and liquidity in OTC derivatives markets. There is some evidence that the reforms have improved liquidity in some OTC derivatives markets, although some authorities have concerns that the interaction of the broader set of post-crisis reforms may have contributed to a reduction in the depth of liquidity.
■ Authorities also recognise that compliance costs have increased as a result of the reforms, including one-time as well as ongoing costs to implement the necessary changes. Some increase in compliance and other regulatory costs is not unexpected as OTC derivatives markets were largely unregulated before the crisis and negative externalities, such as those arising from poor risk management practices, were not fully reflected in compliance costs or priced into OTC derivatives. Overall costs need to be weighed against the short- and long-term benefits that these reforms will provide by enhancing financial stability and contributing to other G20 Leaders’ objectives.
■ Given that policies are still being implemented, it is not possible to fully judge the ultimate costs and benefits of these reforms in this report. A 2013 official sector study estimated the expected overall balance to be positive.16 That said, even after full implementation of the reforms, the task of measuring the benefits of lower systemic risk, improved transparency, and less market abuse and the observable costs will remain challenging.
■ Concerns have been raised relating to increased geographic market fragmentation in certain markets, e.g. due to differences in implementation timetables. Authorities are sensitive to possible impacts of any fragmentation (e.g. on liquidity or trading costs for market participants) and remain committed to identifying and addressing cross-border challenges in implementing the reforms, and to continuing to take forward international regulatory and supervisory cooperation.
16 Macroeconomic Assessment Group on Derivatives (2013), Macroeconomic impact of OTC derivatives reforms.
24
4. Shadow banking assessment The FSB has assessed the evolution of shadow banking activities and related financial stability risks since the global financial crisis, including whether the policies and monitoring put in place since then are adequate to identify and contain these risks. ■ In the wake of the crisis, authorities introduced regulatory reforms to address financial
stability risks from shadow banking. These included: addressing banks’ involvement in shadow banking; reducing liquidity/maturity mismatches and leverage in shadow banking; and addressing incentive problems and opaqueness associated with securitisation.
■ Implementation of reforms in this area is progressing but remains at a relatively early stage (see section 2.4).
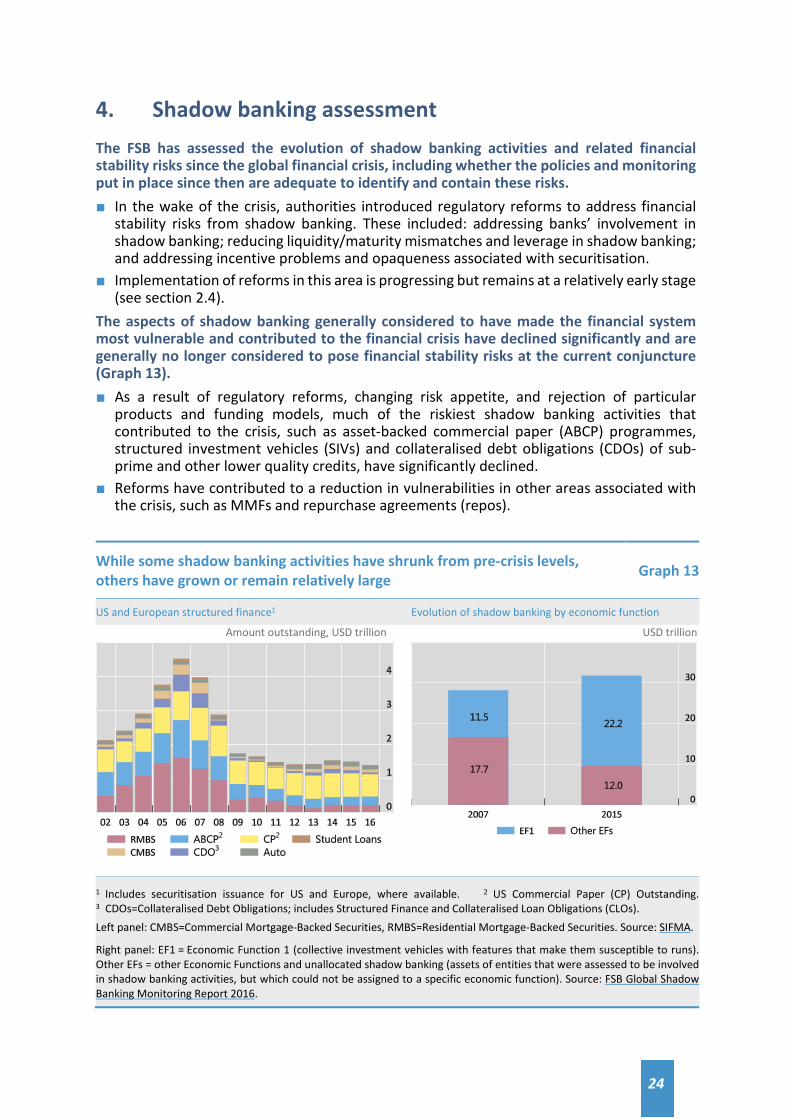
The aspects of shadow banking generally considered to have made the financial system most vulnerable and contributed to the financial crisis have declined significantly and are generally no longer considered to pose financial stability risks at the current conjuncture (Graph 13). ■ As a result of regulatory reforms, changing risk appetite, and rejection of particular
products and funding models, much of the riskiest shadow banking activities that contributed to the crisis, such as asset-backed commercial paper (ABCP) programmes, structured investment vehicles (SIVs) and collateralised debt obligations (CDOs) of sub-prime and other lower quality credits, have significantly declined.
■ Reforms have contributed to a reduction in vulnerabilities in other areas associated with the crisis, such as MMFs and repurchase agreements (repos).
While some shadow banking activities have shrunk from pre-crisis levels, others have grown or remain relatively large Graph 13
US and European structured finance1 Evolution of shadow banking by economic function
Amount outstanding, USD trillion USD trillion
1 Includes securitisation issuance for US and Europe, where available. 2 US Commercial Paper (CP) Outstanding. 3 CDOs=Collateralised Debt Obligations; includes Structured Finance and Collateralised Loan Obligations (CLOs). Left panel: CMBS=Commercial Mortgage-Backed Securities, RMBS=Residential Mortgage-Backed Securities. Source: SIFMA.
Right panel: EF1 = Economic Function 1 (collective investment vehicles with features that make them susceptible to runs). Other EFs = other Economic Functions and unallocated shadow banking (assets of entities that were assessed to be involved in shadow banking activities, but which could not be assigned to a specific economic function). Source: FSB Global Shadow Banking Monitoring Report 2016.
25
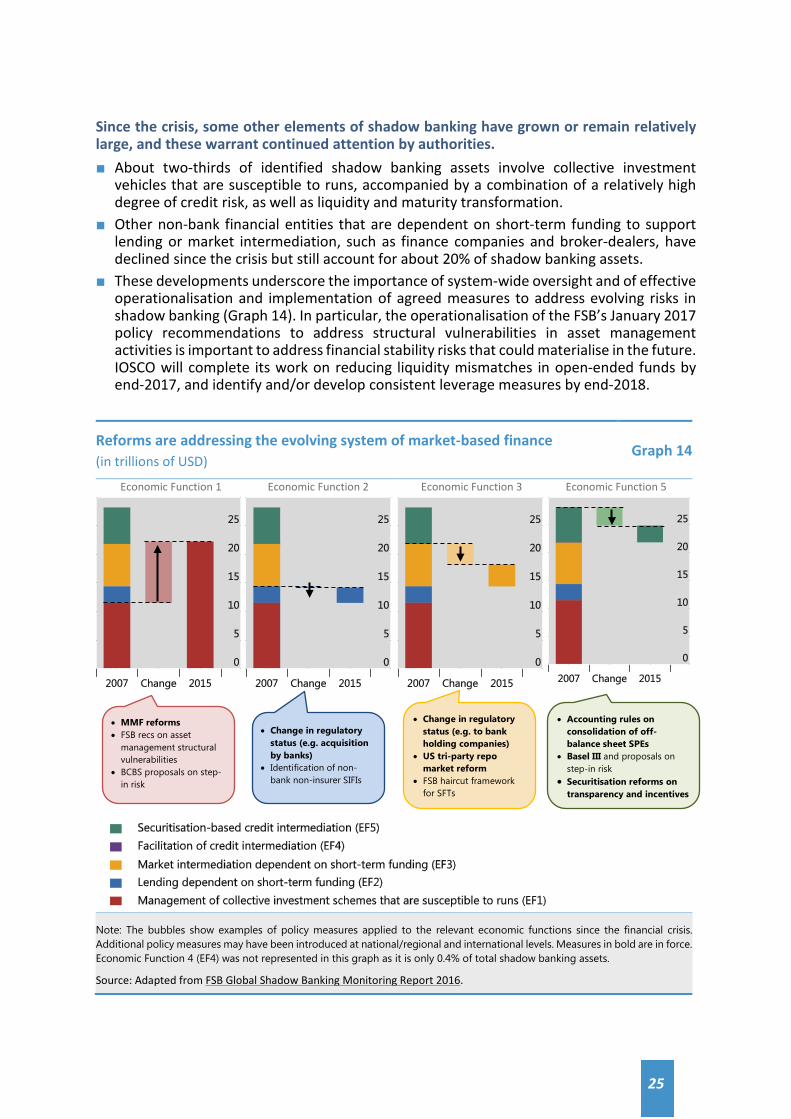
Since the crisis, some other elements of shadow banking have grown or remain relatively large, and these warrant continued attention by authorities. ■ About two-thirds of identified shadow banking assets involve collective investment
vehicles that are susceptible to runs, accompanied by a combination of a relatively high degree of credit risk, as well as liquidity and maturity transformation.
■ Other non-bank financial entities that are dependent on short-term funding to support lending or market intermediation, such as finance companies and broker-dealers, have declined since the crisis but still account for about 20% of shadow banking assets.
■ These developments underscore the importance of system-wide oversight and of effective operationalisation and implementation of agreed measures to address evolving risks in shadow banking (Graph 14). In particular, the operationalisation of the FSB’s January 2017 policy recommendations to address structural vulnerabilities in asset management activities is important to address financial stability risks that could materialise in the future. IOSCO will complete its work on reducing liquidity mismatches in open-ended funds by end-2017, and identify and/or develop consistent leverage measures by end-2018.
Reforms are addressing the evolving system of market-based finance (in trillions of USD)
Graph 14
Economic Function 1 Economic Function 2 Economic Function 3 Economic Function 5
Note: The bubbles show examples of policy measures applied to the relevant economic functions since the financial crisis. Additional policy measures may have been introduced at national/regional and international levels. Measures in bold are in force. Economic Function 4 (EF4) was not represented in this graph as it is only 0.4% of total shadow banking assets.
Source: Adapted from FSB Global Shadow Banking Monitoring Report 2016.
• MMF reforms • FSB recs on asset
management structural vulnerabilities
• BCBS proposals on step-in risk
• Change in regulatory status (e.g. acquisition by banks)
• Identification of non-bank non-insurer SIFIs
• Change in regulatory status (e.g. to bank holding companies)
• US tri-party repo market reform
• FSB haircut framework for SFTs
• Accounting rules on consolidation of off-balance sheet SPEs
• Basel III and proposals on step-in risk
• Securitisation reforms on transparency and incentives
26
At present, the FSB has not identified other new shadow banking risks that require additional regulatory action at the global level. However, new variations of shadow banking activities are likely to develop in the future. ■ To systematically monitor and address associated risks, FSB member authorities are
implementing the forward-looking high-level Shadow Banking Policy Framework, endorsed by the G20 in 2013, to detect and address the sources of financial stability risks from shadow banking.
To further enhance their system-wide oversight of shadow banking and be able to adopt appropriate policy measures to address the identified risks, FSB member authorities have agreed on the following recommendations going forward: ■ Enhance system-wide oversight of shadow banking and policy responses to address the
identified risks through implementing the recommendations of the 2016 peer review (see section 2.4), including: (i) establishing a systematic process for assessing financial stability risks from shadow banking, and ensuring that any entities or activities that could pose material financial stability risks are brought within the regulatory perimeter; (ii) addressing identified gaps in risk-related data; and (iii) removing impediments to cooperation and information-sharing between authorities. A follow-up peer review on implementation of the FSB Policy Framework will be conducted in 2020.
■ Strengthen the monitoring of shadow banking activity and the data collection framework through: improving data granularity on assets and liabilities as well as on cross-border interconnectedness; supplementing flow of funds data with supervisory and/or commercially-available data to assess risks; and improving information-sharing on emerging risks. The FSB will assess the data availability and make improvements to its annual monitoring exercise as appropriate in 2018.
■ Complete the remaining policy development at the international level and implement the agreed policy recommendations to reduce risks and arbitrage opportunities across jurisdictions and sectors. In this regard, it is important that: (i) the BCBS complete its guidelines on step-in risk; (ii) IOSCO operationalise the FSB recommendations to address structural vulnerabilities from asset management activities in line with the agreed timeline; and (iii) national/regional authorities implement agreed policy recommendations in a timely and consistent manner.
27
5. Overall effects of reforms The FSB, in collaboration with SSBs, is analysing whether the reforms are working together as intended. ■ With the main elements of reforms now agreed, the FSB and the SSBs are increasingly
focused on monitoring implementation and evaluating their effects. This is good regulatory practice, forms part of those bodies’ accountability to the G20 and the public, and provides a basis for making informed decisions relating to financial reforms. These evaluations help determine whether the reforms are achieving their intended outcomes, as well as identify regulatory gaps, remaining or emerging risks, or material unintended consequences that should be addressed, without compromising on the objectives of the reforms.
■ The challenges of evaluating whether the reforms are having their intended long-run effects that were highlighted in previous reports remain relevant.17 To this end, the FSB has developed a framework to guide post-implementation evaluation work (see section 7).
5.1 Building a more resilient financial system
Large internationally active banks continue to build capital and liquidity buffers and reduce leverage (Graph 15). ■ Internationally active banks have more than doubled risk-based capital ratios compared to
the pre-crisis period, while their leverage has dropped by half. All of these banks fully meet the Basel III risk-based capital and leverage requirements, ahead of the agreed 2019 deadline. Banks have continued to build capital buffers largely via retained earnings, rather than by raising equity or deleveraging. Two-thirds of all G-SIBs already meet the 2019 minimum external TLAC requirements, compared to 28% for the 2022 requirements.
■ Funding profiles have also improved – especially for those banks that were most affected by the crisis – due, in part, to less reliance on short-term wholesale funding (replaced by more stable sources, such as deposits) and larger holdings of more liquid assets (particularly government bonds and, in some cases, deposits at central banks associated with unconventional monetary policies).
■ The strengthened capital buffers and liquidity profiles of internationally active banks mean that the core of global banking system is now more resilient to economic or financial shocks than before the crisis. Empirical studies that examine the likelihood of banking crisis and creditor losses for different levels of capitalisation support this finding.
■ Evidence on the global financial crisis suggests that the net social benefits of reforms in reducing the frequency and severity of future crises could be higher than estimated when the reforms were established.18 However, more work is needed to examine other relevant dimensions of adjustment, such as offsetting effects of higher capital and liquidity ratios on increases in funding costs, and revisions to profit expectations by shareholders.
17 They include: separating the effects of reforms from other factors, such as unconventional monetary policies;
distinguishing temporary from permanent effects; linking micro/sectoral indicators of progress with macro-level objectives; comparing short-term costs (which are easier to measure) to the accreting social benefits in terms of financial crises avoided or tempered; and selecting appropriate reference points and counterfactuals for assessing outcomes.
18 See Adding it all up: the macroeconomic impact of Basel III and outstanding reform issues by Fender and Lewrick (November 2016, BIS Working Papers No 591).
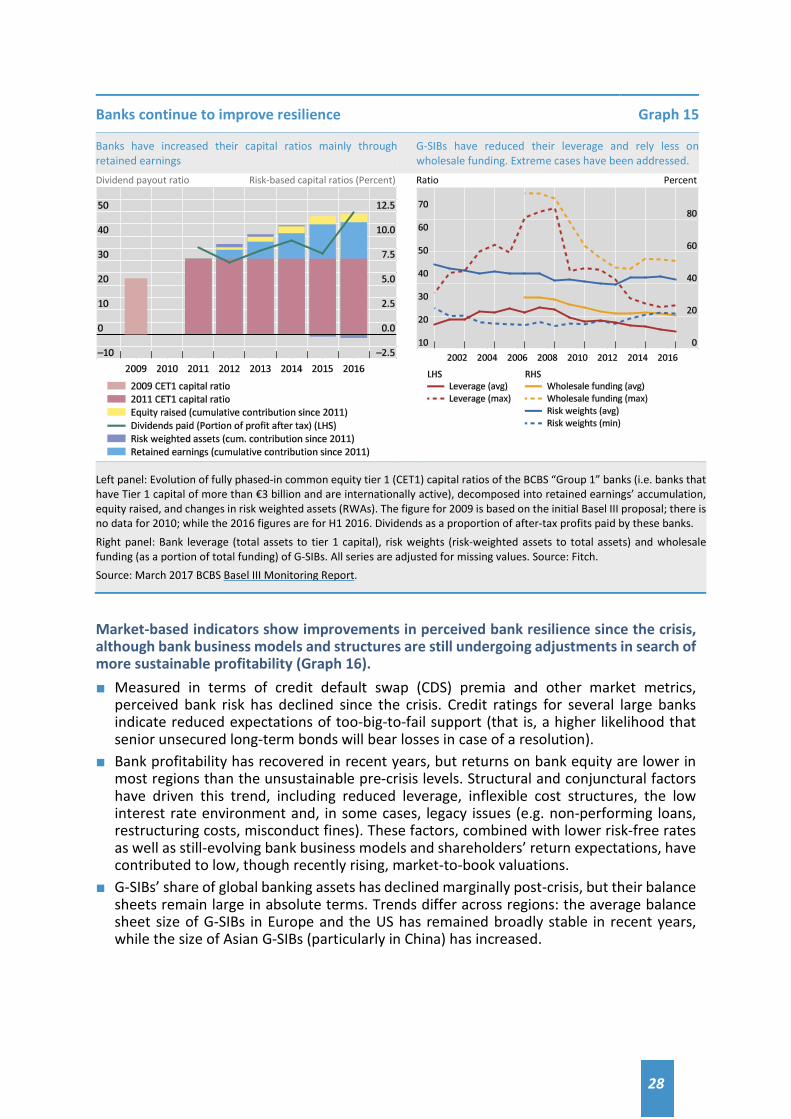
28
Banks continue to improve resilience Graph 15
Banks have increased their capital ratios mainly through retained earnings
G-SIBs have reduced their leverage and rely less on wholesale funding. Extreme cases have been addressed.
Dividend payout ratio Risk-based capital ratios (Percent)
Ratio Percent
Left panel: Evolution of fully phased-in common equity tier 1 (CET1) capital ratios of the BCBS “Group 1” banks (i.e. banks that have Tier 1 capital of more than €3 billion and are internationally active), decomposed into retained earnings’ accumulation, equity raised, and changes in risk weighted assets (RWAs). The figure for 2009 is based on the initial Basel III proposal; there is no data for 2010; while the 2016 figures are for H1 2016. Dividends as a proportion of after-tax profits paid by these banks. Right panel: Bank leverage (total assets to tier 1 capital), risk weights (risk-weighted assets to total assets) and wholesale funding (as a portion of total funding) of G-SIBs. All series are adjusted for missing values. Source: Fitch. Source: March 2017 BCBS Basel III Monitoring Report.
Market-based indicators show improvements in perceived bank resilience since the crisis, although bank business models and structures are still undergoing adjustments in search of more sustainable profitability (Graph 16). ■ Measured in terms of credit default swap (CDS) premia and other market metrics,
perceived bank risk has declined since the crisis. Credit ratings for several large banks indicate reduced expectations of too-big-to-fail support (that is, a higher likelihood that senior unsecured long-term bonds will bear losses in case of a resolution).
■ Bank profitability has recovered in recent years, but returns on bank equity are lower in most regions than the unsustainable pre-crisis levels. Structural and conjunctural factors have driven this trend, including reduced leverage, inflexible cost structures, the low interest rate environment and, in some cases, legacy issues (e.g. non-performing loans, restructuring costs, misconduct fines). These factors, combined with lower risk-free rates as well as still-evolving bank business models and shareholders’ return expectations, have contributed to low, though recently rising, market-to-book valuations.
■ G-SIBs’ share of global banking assets has declined marginally post-crisis, but their balance sheets remain large in absolute terms. Trends differ across regions: the average balance sheet size of G-SIBs in Europe and the US has remained broadly stable in recent years, while the size of Asian G-SIBs (particularly in China) has increased.
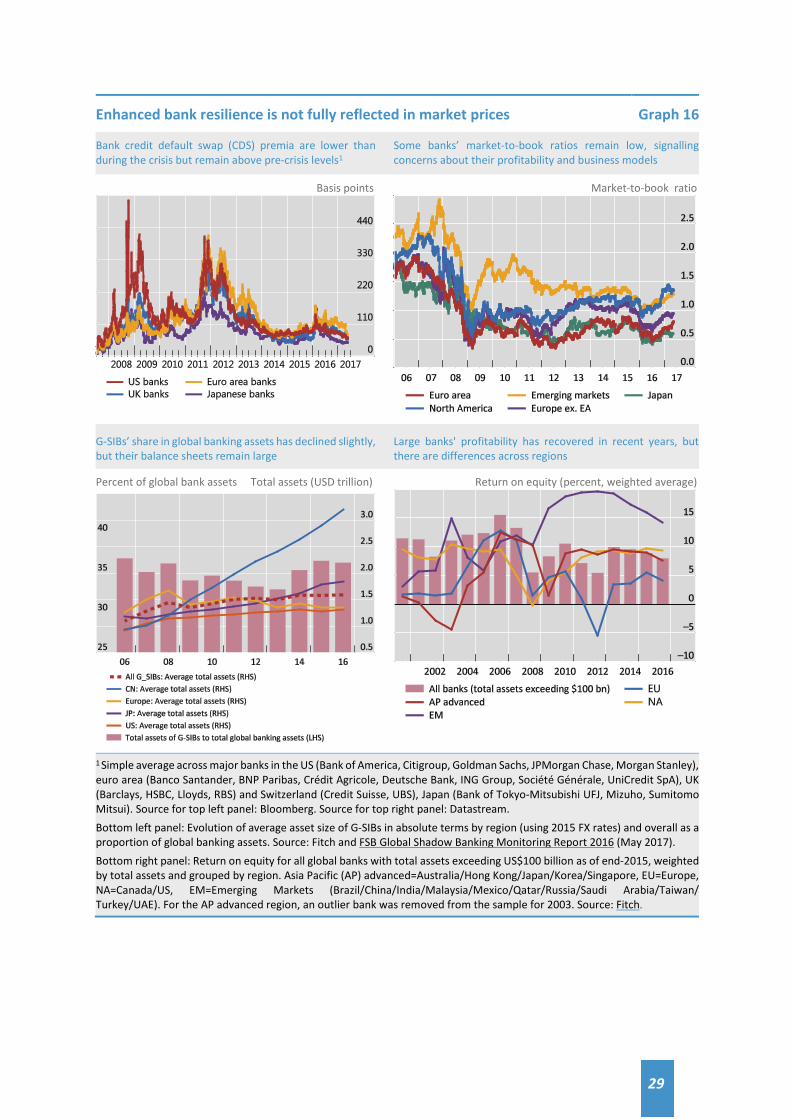
29
Enhanced bank resilience is not fully reflected in market prices Graph 16
Bank credit default swap (CDS) premia are lower than during the crisis but remain above pre-crisis levels1
Some banks’ market-to-book ratios remain low, signalling concerns about their profitability and business models
Basis points
Market-to-book ratio
G-SIBs’ share in global banking assets has declined slightly, but their balance sheets remain large
Large banks' profitability has recovered in recent years, but there are differences across regions
Percent of global bank assets Total assets (USD trillion)
Return on equity (percent, weighted average)
1 Simple average across major banks in the US (Bank of America, Citigroup, Goldman Sachs, JPMorgan Chase, Morgan Stanley), euro area (Banco Santander, BNP Paribas, Crédit Agricole, Deutsche Bank, ING Group, Société Générale, UniCredit SpA), UK (Barclays, HSBC, Lloyds, RBS) and Switzerland (Credit Suisse, UBS), Japan (Bank of Tokyo-Mitsubishi UFJ, Mizuho, Sumitomo Mitsui). Source for top left panel: Bloomberg. Source for top right panel: Datastream. Bottom left panel: Evolution of average asset size of G-SIBs in absolute terms by region (using 2015 FX rates) and overall as a proportion of global banking assets. Source: Fitch and FSB Global Shadow Banking Monitoring Report 2016 (May 2017). Bottom right panel: Return on equity for all global banks with total assets exceeding US$100 billion as of end-2015, weighted by total assets and grouped by region. Asia Pacific (AP) advanced=Australia/Hong Kong/Japan/Korea/Singapore, EU=Europe, NA=Canada/US, EM=Emerging Markets (Brazil/China/India/Malaysia/Mexico/Qatar/Russia/Saudi Arabia/Taiwan/ Turkey/UAE). For the AP advanced region, an outlier bank was removed from the sample for 2003. Source: Fitch.
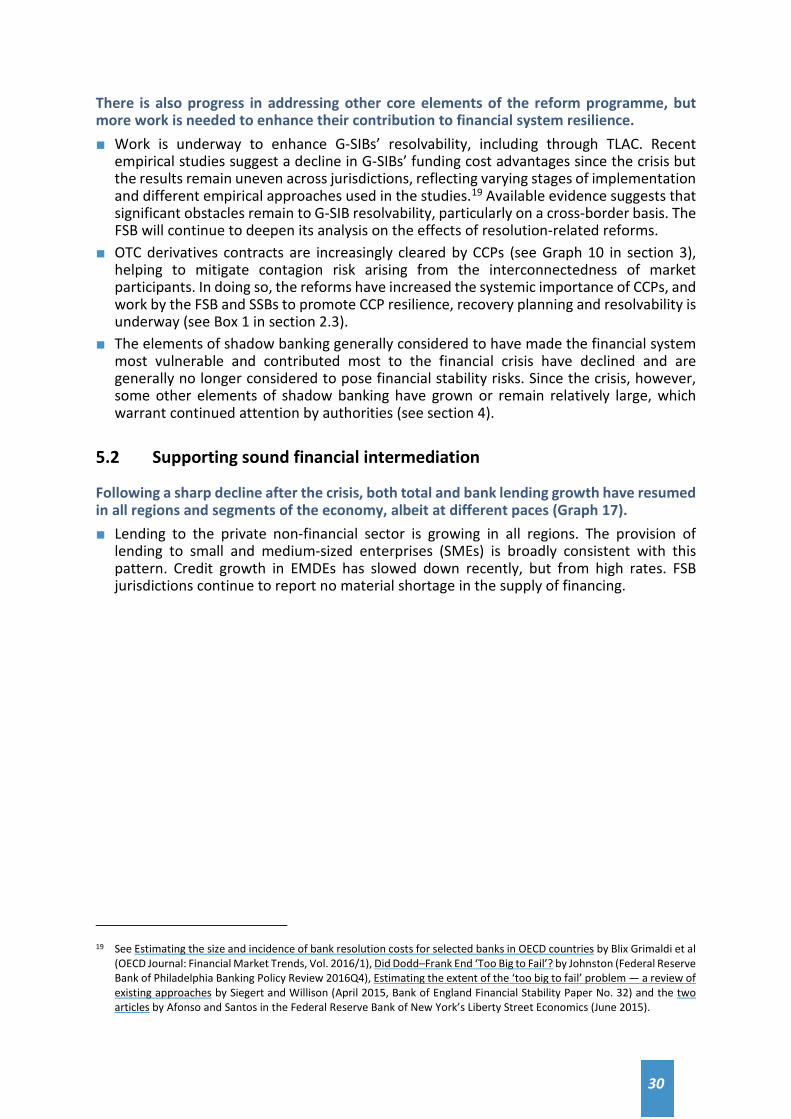
30
There is also progress in addressing other core elements of the reform programme, but more work is needed to enhance their contribution to financial system resilience. ■ Work is underway to enhance G-SIBs’ resolvability, including through TLAC. Recent
empirical studies suggest a decline in G-SIBs’ funding cost advantages since the crisis but the results remain uneven across jurisdictions, reflecting varying stages of implementation and different empirical approaches used in the studies.19 Available evidence suggests that significant obstacles remain to G-SIB resolvability, particularly on a cross-border basis. The FSB will continue to deepen its analysis on the effects of resolution-related reforms.
■ OTC derivatives contracts are increasingly cleared by CCPs (see Graph 10 in section 3), helping to mitigate contagion risk arising from the interconnectedness of market participants. In doing so, the reforms have increased the systemic importance of CCPs, and work by the FSB and SSBs to promote CCP resilience, recovery planning and resolvability is underway (see Box 1 in section 2.3).
■ The elements of shadow banking generally considered to have made the financial system most vulnerable and contributed most to the financial crisis have declined and are generally no longer considered to pose financial stability risks. Since the crisis, however, some other elements of shadow banking have grown or remain relatively large, which warrant continued attention by authorities (see section 4).
5.2 Supporting sound financial intermediation
Following a sharp decline after the crisis, both total and bank lending growth have resumed in all regions and segments of the economy, albeit at different paces (Graph 17). ■ Lending to the private non-financial sector is growing in all regions. The provision of
lending to small and medium-sized enterprises (SMEs) is broadly consistent with this pattern. Credit growth in EMDEs has slowed down recently, but from high rates. FSB jurisdictions continue to report no material shortage in the supply of financing.
19 See Estimating the size and incidence of bank resolution costs for selected banks in OECD countries by Blix Grimaldi et al
(OECD Journal: Financial Market Trends, Vol. 2016/1), Did Dodd–Frank End ‘Too Big to Fail’? by Johnston (Federal Reserve Bank of Philadelphia Banking Policy Review 2016Q4), Estimating the extent of the ‘too big to fail’ problem — a review of existing approaches by Siegert and Willison (April 2015, Bank of England Financial Stability Paper No. 32) and the two articles by Afonso and Santos in the Federal Reserve Bank of New York’s Liberty Street Economics (June 2015).
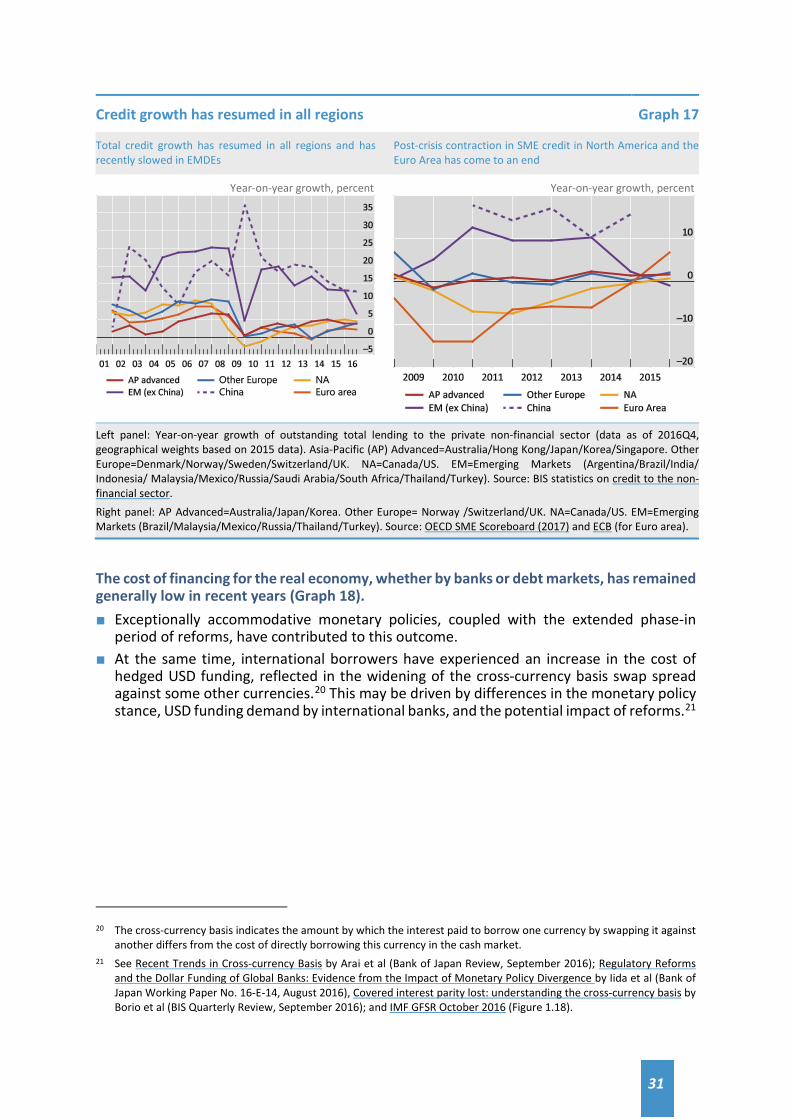
31
Credit growth has resumed in all regions Graph 17
Total credit growth has resumed in all regions and has recently slowed in EMDEs
Post-crisis contraction in SME credit in North America and the Euro Area has come to an end
Year-on-year growth, percent
Year-on-year growth, percent
Left panel: Year-on-year growth of outstanding total lending to the private non-financial sector (data as of 2016Q4, geographical weights based on 2015 data). Asia-Pacific (AP) Advanced=Australia/Hong Kong/Japan/Korea/Singapore. Other Europe=Denmark/Norway/Sweden/Switzerland/UK. NA=Canada/US. EM=Emerging Markets (Argentina/Brazil/India/ Indonesia/ Malaysia/Mexico/Russia/Saudi Arabia/South Africa/Thailand/Turkey). Source: BIS statistics on credit to the non-financial sector. Right panel: AP Advanced=Australia/Japan/Korea. Other Europe= Norway /Switzerland/UK. NA=Canada/US. EM=Emerging Markets (Brazil/Malaysia/Mexico/Russia/Thailand/Turkey). Source: OECD SME Scoreboard (2017) and ECB (for Euro area).
The cost of financing for the real economy, whether by banks or debt markets, has remained generally low in recent years (Graph 18). ■ Exceptionally accommodative monetary policies, coupled with the extended phase-in
period of reforms, have contributed to this outcome. ■ At the same time, international borrowers have experienced an increase in the cost of
hedged USD funding, reflected in the widening of the cross-currency basis swap spread against some other currencies.20 This may be driven by differences in the monetary policy stance, USD funding demand by international banks, and the potential impact of reforms.21
20 The cross-currency basis indicates the amount by which the interest paid to borrow one currency by swapping it against
another differs from the cost of directly borrowing this currency in the cash market. 21 See Recent Trends in Cross-currency Basis by Arai et al (Bank of Japan Review, September 2016); Regulatory Reforms
and the Dollar Funding of Global Banks: Evidence from the Impact of Monetary Policy Divergence by Iida et al (Bank of Japan Working Paper No. 16-E-14, August 2016), Covered interest parity lost: understanding the cross-currency basis by Borio et al (BIS Quarterly Review, September 2016); and IMF GFSR October 2016 (Figure 1.18).
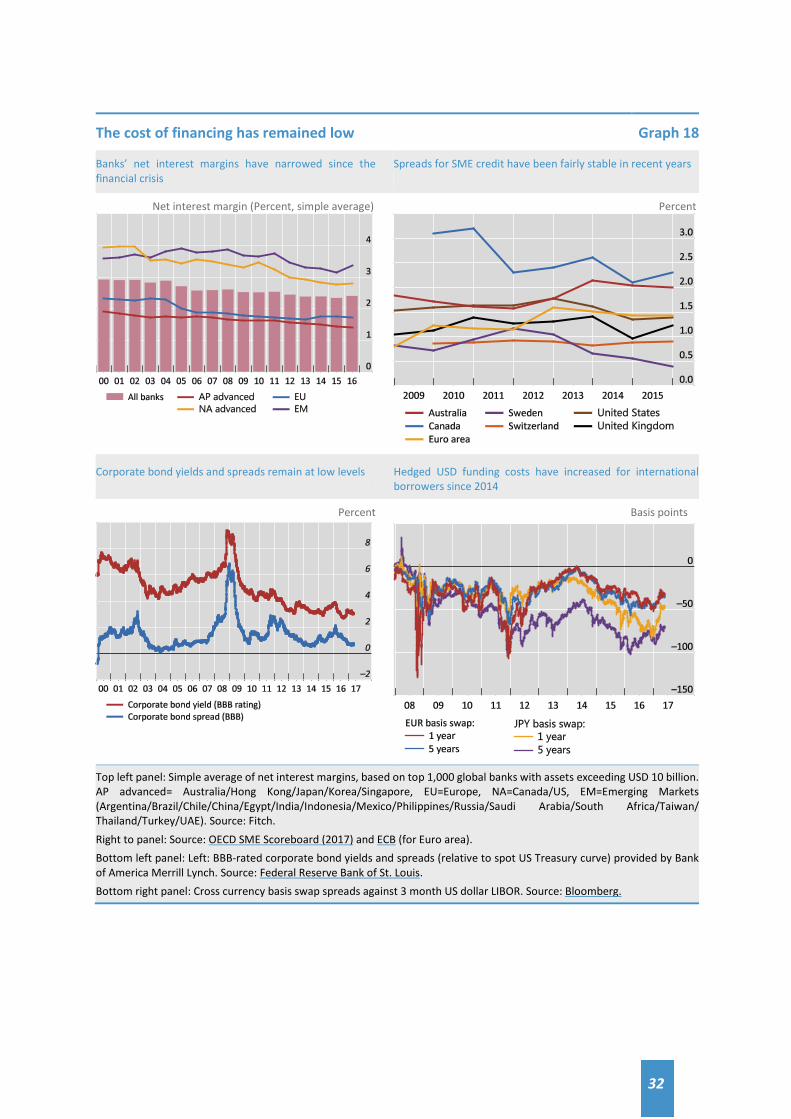
32
The cost of financing has remained low Graph 18
Banks’ net interest margins have narrowed since the financial crisis
Spreads for SME credit have been fairly stable in recent years
Net interest margin (Percent, simple average)
Percent
Corporate bond yields and spreads remain at low levels Hedged USD funding costs have increased for international borrowers since 2014
Percent
Basis points
Top left panel: Simple average of net interest margins, based on top 1,000 global banks with assets exceeding USD 10 billion. AP advanced= Australia/Hong Kong/Japan/Korea/Singapore, EU=Europe, NA=Canada/US, EM=Emerging Markets (Argentina/Brazil/Chile/China/Egypt/India/Indonesia/Mexico/Philippines/Russia/Saudi Arabia/South Africa/Taiwan/ Thailand/Turkey/UAE). Source: Fitch. Right to panel: Source: OECD SME Scoreboard (2017) and ECB (for Euro area). Bottom left panel: Left: BBB-rated corporate bond yields and spreads (relative to spot US Treasury curve) provided by Bank of America Merrill Lynch. Source: Federal Reserve Bank of St. Louis. Bottom right panel: Cross currency basis swap spreads against 3 month US dollar LIBOR. Source: Bloomberg.
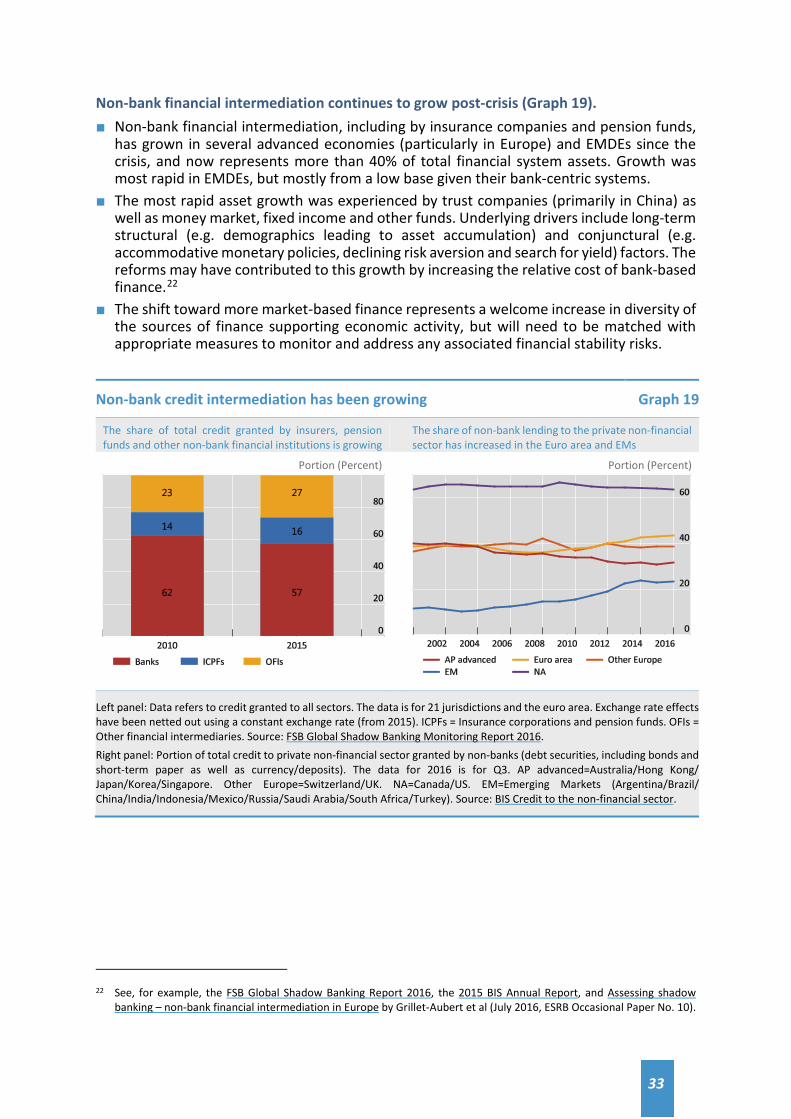
33
Non-bank financial intermediation continues to grow post-crisis (Graph 19). ■ Non-bank financial intermediation, including by insurance companies and pension funds,
has grown in several advanced economies (particularly in Europe) and EMDEs since the crisis, and now represents more than 40% of total financial system assets. Growth was most rapid in EMDEs, but mostly from a low base given their bank-centric systems.
■ The most rapid asset growth was experienced by trust companies (primarily in China) as well as money market, fixed income and other funds. Underlying drivers include long-term structural (e.g. demographics leading to asset accumulation) and conjunctural (e.g. accommodative monetary policies, declining risk aversion and search for yield) factors. The reforms may have contributed to this growth by increasing the relative cost of bank-based finance.22
■ The shift toward more market-based finance represents a welcome increase in diversity of the sources of finance supporting economic activity, but will need to be matched with appropriate measures to monitor and address any associated financial stability risks.
Non-bank credit intermediation has been growing Graph 19
The share of total credit granted by insurers, pension funds and other non-bank financial institutions is growing
The share of non-bank lending to the private non-financial sector has increased in the Euro area and EMs
Portion (Percent) Portion (Percent)
Left panel: Data refers to credit granted to all sectors. The data is for 21 jurisdictions and the euro area. Exchange rate effects have been netted out using a constant exchange rate (from 2015). ICPFs = Insurance corporations and pension funds. OFIs = Other financial intermediaries. Source: FSB Global Shadow Banking Monitoring Report 2016. Right panel: Portion of total credit to private non-financial sector granted by non-banks (debt securities, including bonds and short-term paper as well as currency/deposits). The data for 2016 is for Q3. AP advanced=Australia/Hong Kong/ Japan/Korea/Singapore. Other Europe=Switzerland/UK. NA=Canada/US. EM=Emerging Markets (Argentina/Brazil/ China/India/Indonesia/Mexico/Russia/Saudi Arabia/South Africa/Turkey). Source: BIS Credit to the non-financial sector.
22 See, for example, the FSB Global Shadow Banking Report 2016, the 2015 BIS Annual Report, and Assessing shadow
banking – non-bank financial intermediation in Europe by Grillet-Aubert et al (July 2016, ESRB Occasional Paper No. 10).
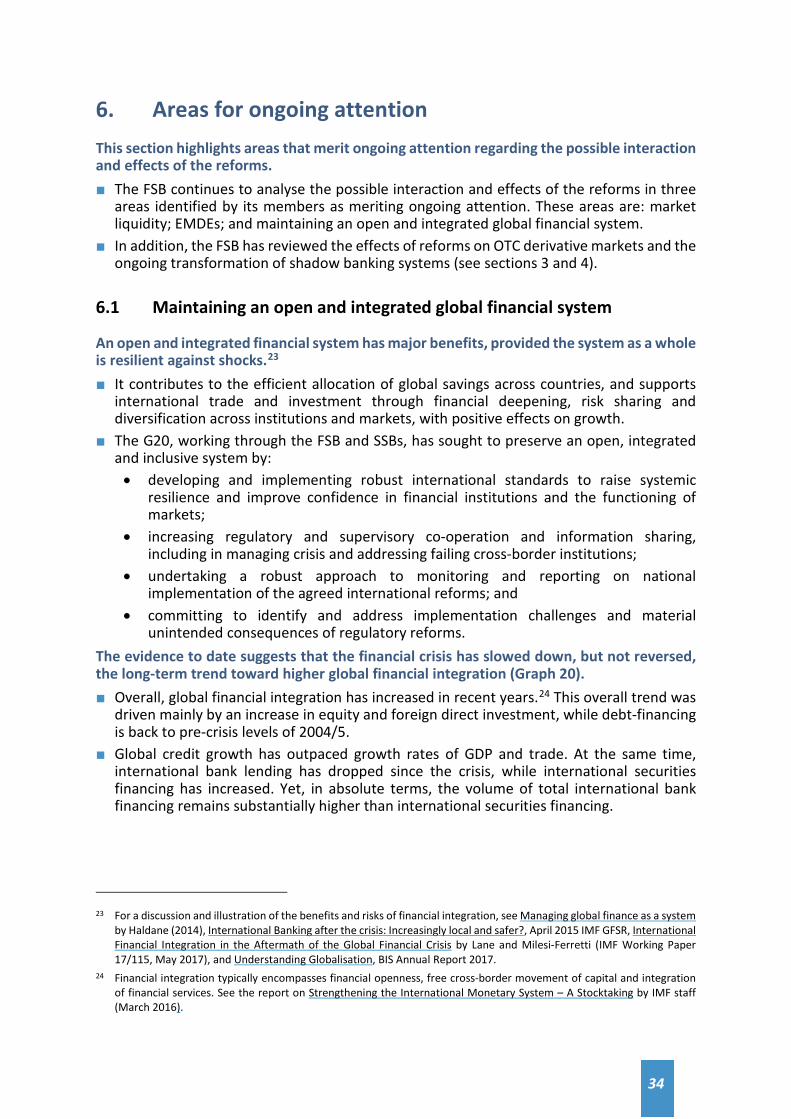
34
6. Areas for ongoing attention This section highlights areas that merit ongoing attention regarding the possible interaction and effects of the reforms. ■ The FSB continues to analyse the possible interaction and effects of the reforms in three
areas identified by its members as meriting ongoing attention. These areas are: market liquidity; EMDEs; and maintaining an open and integrated global financial system.
■ In addition, the FSB has reviewed the effects of reforms on OTC derivative markets and the ongoing transformation of shadow banking systems (see sections 3 and 4).
6.1 Maintaining an open and integrated global financial system
An open and integrated financial system has major benefits, provided the system as a whole is resilient against shocks.23 ■ It contributes to the efficient allocation of global savings across countries, and supports
international trade and investment through financial deepening, risk sharing and diversification across institutions and markets, with positive effects on growth.
■ The G20, working through the FSB and SSBs, has sought to preserve an open, integrated and inclusive system by: • developing and implementing robust international standards to raise systemic
resilience and improve confidence in financial institutions and the functioning of markets;
• increasing regulatory and supervisory co-operation and information sharing, including in managing crisis and addressing failing cross-border institutions;
• undertaking a robust approach to monitoring and reporting on national implementation of the agreed international reforms; and
• committing to identify and address implementation challenges and material unintended consequences of regulatory reforms.
The evidence to date suggests that the financial crisis has slowed down, but not reversed, the long-term trend toward higher global financial integration (Graph 20). ■ Overall, global financial integration has increased in recent years.24 This overall trend was
driven mainly by an increase in equity and foreign direct investment, while debt-financing is back to pre-crisis levels of 2004/5.
■ Global credit growth has outpaced growth rates of GDP and trade. At the same time, international bank lending has dropped since the crisis, while international securities financing has increased. Yet, in absolute terms, the volume of total international bank financing remains substantially higher than international securities financing.
23 For a discussion and illustration of the benefits and risks of financial integration, see Managing global finance as a system
by Haldane (2014), International Banking after the crisis: Increasingly local and safer?, April 2015 IMF GFSR, International Financial Integration in the Aftermath of the Global Financial Crisis by Lane and Milesi-Ferretti (IMF Working Paper 17/115, May 2017), and Understanding Globalisation, BIS Annual Report 2017.
24 Financial integration typically encompasses financial openness, free cross-border movement of capital and integration of financial services. See the report on Strengthening the International Monetary System – A Stocktaking by IMF staff (March 2016).
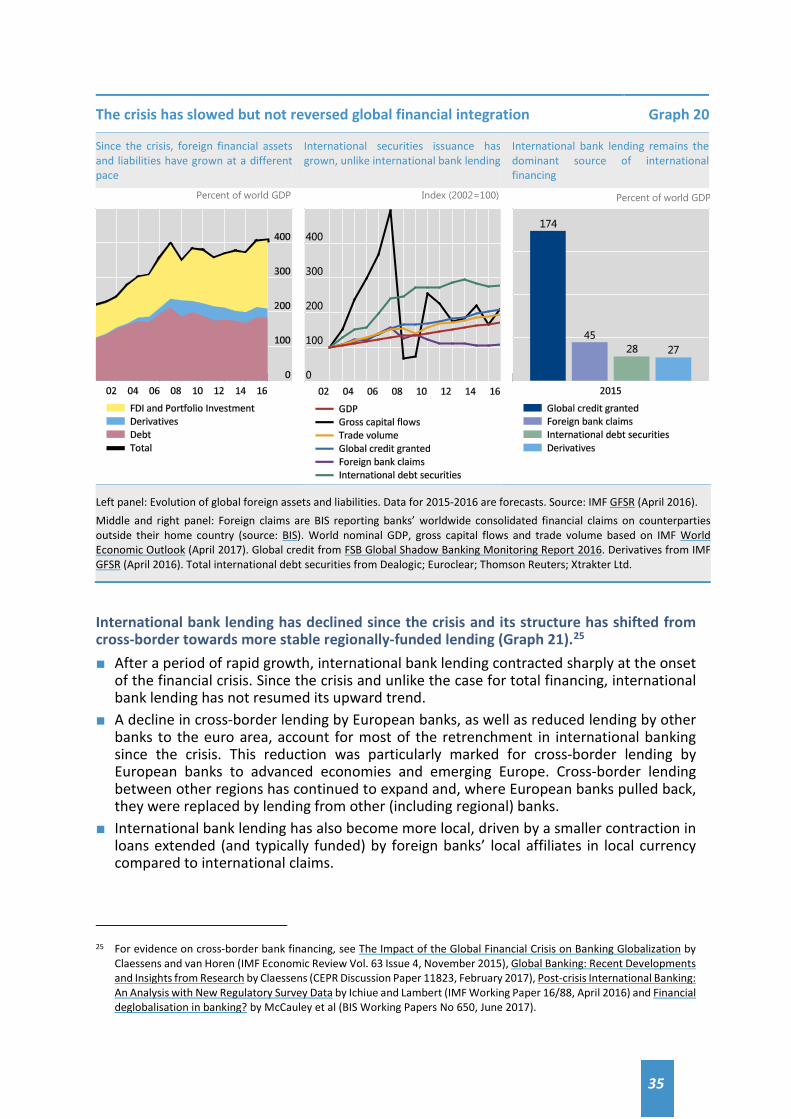
35
The crisis has slowed but not reversed global financial integration Graph 20
Since the crisis, foreign financial assets and liabilities have grown at a different pace
International securities issuance has grown, unlike international bank lending
International bank lending remains the dominant source of international financing
Percent of world GDP Index (2002=100) Percent of world GDP
Left panel: Evolution of global foreign assets and liabilities. Data for 2015-2016 are forecasts. Source: IMF GFSR (April 2016). Middle and right panel: Foreign claims are BIS reporting banks’ worldwide consolidated financial claims on counterparties outside their home country (source: BIS). World nominal GDP, gross capital flows and trade volume based on IMF World Economic Outlook (April 2017). Global credit from FSB Global Shadow Banking Monitoring Report 2016. Derivatives from IMF GFSR (April 2016). Total international debt securities from Dealogic; Euroclear; Thomson Reuters; Xtrakter Ltd.
International bank lending has declined since the crisis and its structure has shifted from cross-border towards more stable regionally-funded lending (Graph 21).25 ■ After a period of rapid growth, international bank lending contracted sharply at the onset
of the financial crisis. Since the crisis and unlike the case for total financing, international bank lending has not resumed its upward trend.
■ A decline in cross-border lending by European banks, as well as reduced lending by other banks to the euro area, account for most of the retrenchment in international banking since the crisis. This reduction was particularly marked for cross-border lending by European banks to advanced economies and emerging Europe. Cross-border lending between other regions has continued to expand and, where European banks pulled back, they were replaced by lending from other (including regional) banks.
■ International bank lending has also become more local, driven by a smaller contraction in loans extended (and typically funded) by foreign banks’ local affiliates in local currency compared to international claims.
25 For evidence on cross-border bank financing, see The Impact of the Global Financial Crisis on Banking Globalization by
Claessens and van Horen (IMF Economic Review Vol. 63 Issue 4, November 2015), Global Banking: Recent Developments and Insights from Research by Claessens (CEPR Discussion Paper 11823, February 2017), Post-crisis International Banking: An Analysis with New Regulatory Survey Data by Ichiue and Lambert (IMF Working Paper 16/88, April 2016) and Financial deglobalisation in banking? by McCauley et al (BIS Working Papers No 650, June 2017).
36
■ A substantial portion of the post-crisis decline in international lending is accounted for by interbank lending.
International bank lending has declined and its structure has shifted post-crisis1,2 Graph 21 International bank claims have contracted more than foreign banks’ local claims
International interbank claims have declined, unlike for the non-bank private and the official sectors
Percent of world GDP3 Percent of world GDP
European banks’ foreign claims on entities in advanced economies have dropped substantially
Other banks’ foreign claims on entities in all regions have continued to increase
European banks5 Percent of world GDP
Other banks6 Percent of world GDP
1 See below a detailed definition of international claims and foreign claims, which denote foreign claims by banks headquartered in the BIS reporting countries, and exclude claims on residents of banks’ home country. 2 Counterparty country regions as defined by the IMF, including banks and non-banks. 3 Amounts of outstanding claims as a percentage of World GDP converted to US dollars at the exchange rate prevailing on respective reference dates. 4 Claims to the private non-financial sector. The series uses actual data for 2014-16 and estimates based on the portion of the non-bank private sector as of end-2014 for the previous years. 5 Foreign claims by banks headquartered in reporting euro area countries (Austria, Belgium, Germany, Spain, Finland, France, Greece, Ireland, Italy, Luxembourg, Netherlands and Portugal); and those in other European countries (Denmark, Norway, Switzerland, Sweden and United Kingdom). 6 Foreign claims by banks headquartered in North America (Canada and United States), Advanced Asia-Pacific (Australia, Chinese Taipei, Hong Kong SAR, Japan, Singapore and South Korea) and EMDEs (Brazil, Chile, India, Mexico, Panama and Turkey). Top left panel: Foreign claims are BIS reporting banks’ worldwide consolidated financial claims on counterparties outside their home country. International claims are cross-border claims in any currency and local claims of foreign affiliates denominated in non-local currencies. Local claims in local currencies are claims with a counterparty located in the same country as the banking office and denominated in domestic currency. See BIS. Top right panel: All series relate to international claims. Bottom panels: All series relate to foreign claims. Sources: BIS consolidated banking statistics on immediate counterparty basis; IMF World Economic Outlook (October 2016).
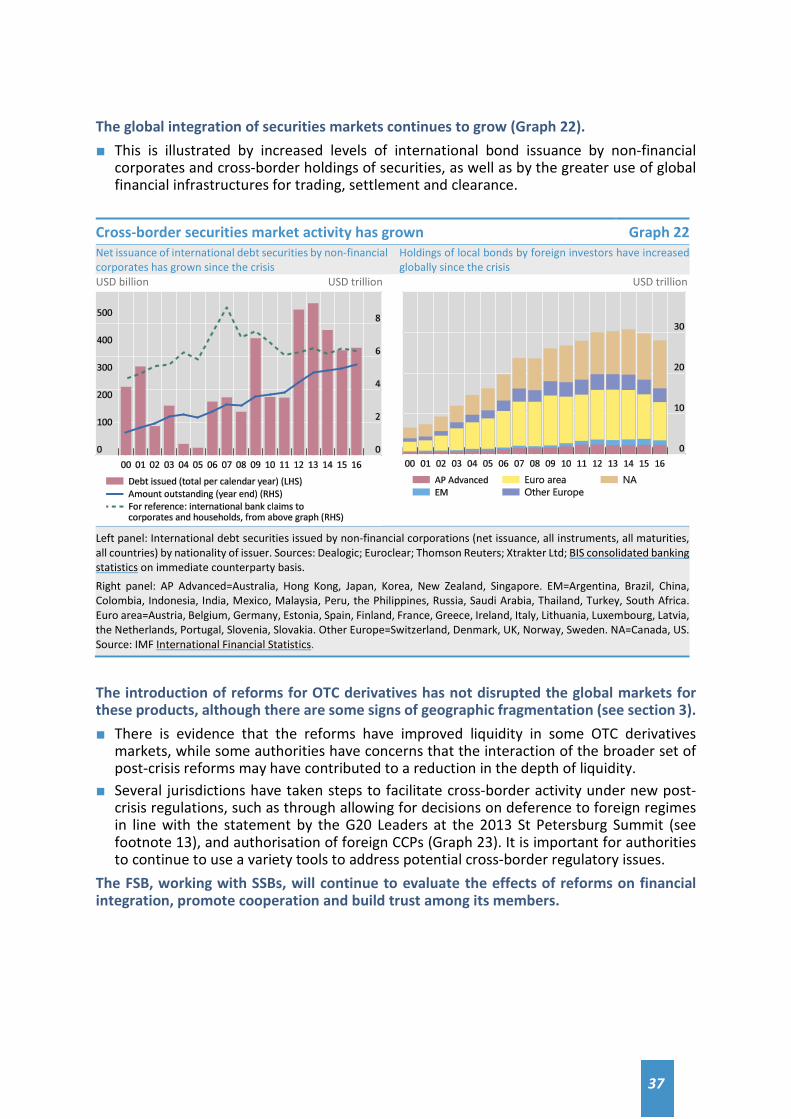
37
The global integration of securities markets continues to grow (Graph 22). ■ This is illustrated by increased levels of international bond issuance by non-financial
corporates and cross-border holdings of securities, as well as by the greater use of global financial infrastructures for trading, settlement and clearance.
Cross-border securities market activity has grown Graph 22 Net issuance of international debt securities by non-financial corporates has grown since the crisis
Holdings of local bonds by foreign investors have increased globally since the crisis
USD billion USD trillion USD trillion
Left panel: International debt securities issued by non-financial corporations (net issuance, all instruments, all maturities, all countries) by nationality of issuer. Sources: Dealogic; Euroclear; Thomson Reuters; Xtrakter Ltd; BIS consolidated banking statistics on immediate counterparty basis. Right panel: AP Advanced=Australia, Hong Kong, Japan, Korea, New Zealand, Singapore. EM=Argentina, Brazil, China, Colombia, Indonesia, India, Mexico, Malaysia, Peru, the Philippines, Russia, Saudi Arabia, Thailand, Turkey, South Africa. Euro area=Austria, Belgium, Germany, Estonia, Spain, Finland, France, Greece, Ireland, Italy, Lithuania, Luxembourg, Latvia, the Netherlands, Portugal, Slovenia, Slovakia. Other Europe=Switzerland, Denmark, UK, Norway, Sweden. NA=Canada, US. Source: IMF International Financial Statistics.
The introduction of reforms for OTC derivatives has not disrupted the global markets for these products, although there are some signs of geographic fragmentation (see section 3). ■ There is evidence that the reforms have improved liquidity in some OTC derivatives
markets, while some authorities have concerns that the interaction of the broader set of post-crisis reforms may have contributed to a reduction in the depth of liquidity.
■ Several jurisdictions have taken steps to facilitate cross-border activity under new post-crisis regulations, such as through allowing for decisions on deference to foreign regimes in line with the statement by the G20 Leaders at the 2013 St Petersburg Summit (see footnote 13), and authorisation of foreign CCPs (Graph 23). It is important for authorities to continue to use a variety tools to address potential cross-border regulatory issues.
The FSB, working with SSBs, will continue to evaluate the effects of reforms on financial integration, promote cooperation and build trust among its members.
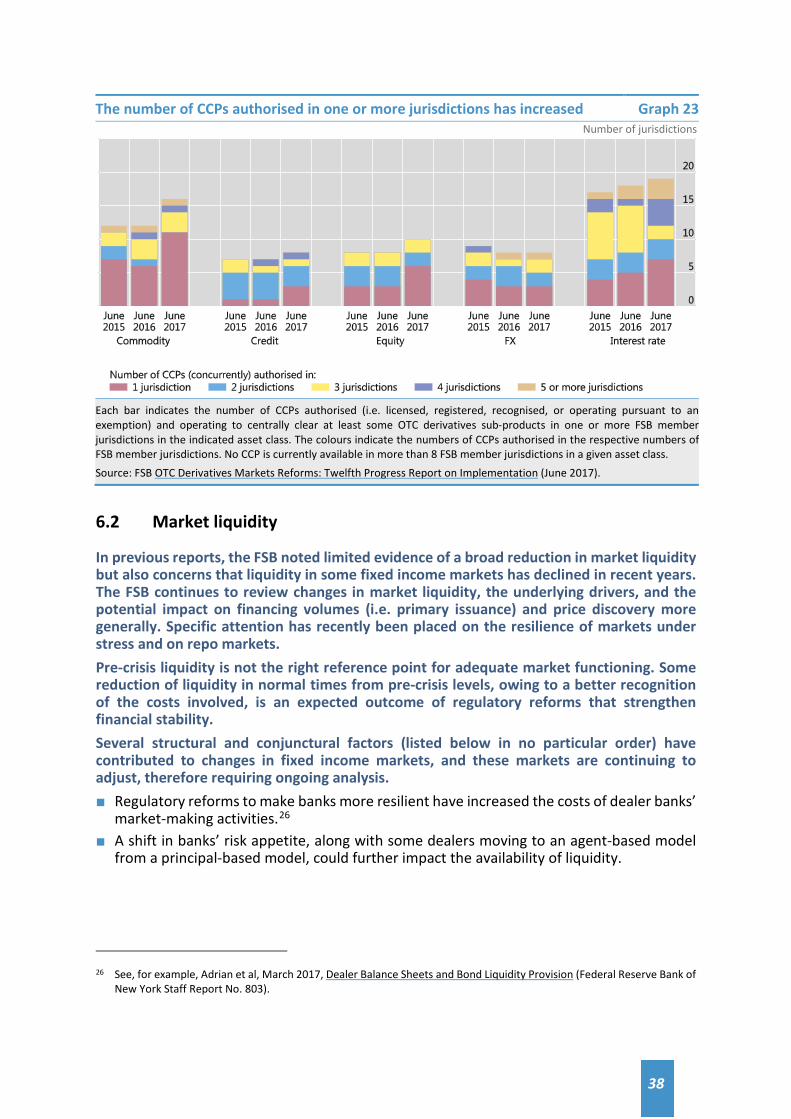
38
The number of CCPs authorised in one or more jurisdictions has increased Graph 23 Number of jurisdictions
Each bar indicates the number of CCPs authorised (i.e. licensed, registered, recognised, or operating pursuant to an exemption) and operating to centrally clear at least some OTC derivatives sub-products in one or more FSB member jurisdictions in the indicated asset class. The colours indicate the numbers of CCPs authorised in the respective numbers of FSB member jurisdictions. No CCP is currently available in more than 8 FSB member jurisdictions in a given asset class. Source: FSB OTC Derivatives Markets Reforms: Twelfth Progress Report on Implementation (June 2017).
6.2 Market liquidity
In previous reports, the FSB noted limited evidence of a broad reduction in market liquidity but also concerns that liquidity in some fixed income markets has declined in recent years. The FSB continues to review changes in market liquidity, the underlying drivers, and the potential impact on financing volumes (i.e. primary issuance) and price discovery more generally. Specific attention has recently been placed on the resilience of markets under stress and on repo markets. Pre-crisis liquidity is not the right reference point for adequate market functioning. Some reduction of liquidity in normal times from pre-crisis levels, owing to a better recognition of the costs involved, is an expected outcome of regulatory reforms that strengthen financial stability. Several structural and conjunctural factors (listed below in no particular order) have contributed to changes in fixed income markets, and these markets are continuing to adjust, therefore requiring ongoing analysis. ■ Regulatory reforms to make banks more resilient have increased the costs of dealer banks’
market-making activities.26 ■ A shift in banks’ risk appetite, along with some dealers moving to an agent-based model
from a principal-based model, could further impact the availability of liquidity.
26 See, for example, Adrian et al, March 2017, Dealer Balance Sheets and Bond Liquidity Provision (Federal Reserve Bank of
New York Staff Report No. 803).
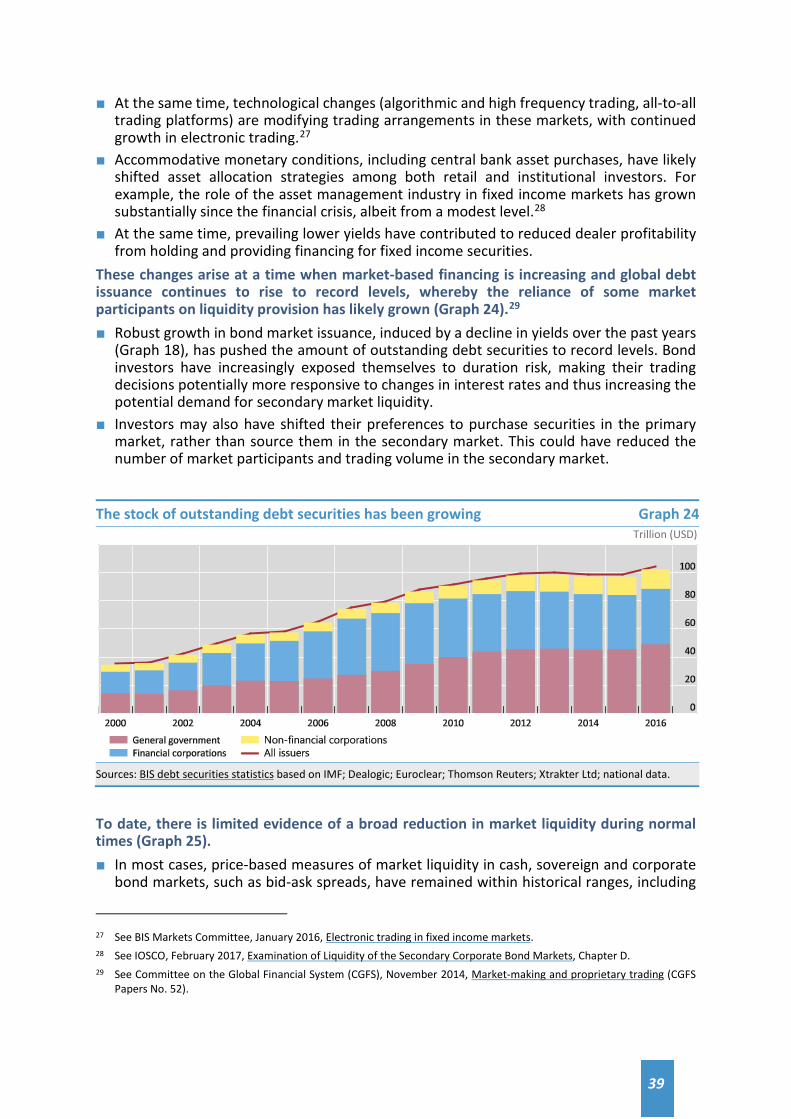
39
■ At the same time, technological changes (algorithmic and high frequency trading, all-to-all trading platforms) are modifying trading arrangements in these markets, with continued growth in electronic trading.27
■ Accommodative monetary conditions, including central bank asset purchases, have likely shifted asset allocation strategies among both retail and institutional investors. For example, the role of the asset management industry in fixed income markets has grown substantially since the financial crisis, albeit from a modest level.28
■ At the same time, prevailing lower yields have contributed to reduced dealer profitability from holding and providing financing for fixed income securities.
These changes arise at a time when market-based financing is increasing and global debt issuance continues to rise to record levels, whereby the reliance of some market participants on liquidity provision has likely grown (Graph 24).29 ■ Robust growth in bond market issuance, induced by a decline in yields over the past years
(Graph 18), has pushed the amount of outstanding debt securities to record levels. Bond investors have increasingly exposed themselves to duration risk, making their trading decisions potentially more responsive to changes in interest rates and thus increasing the potential demand for secondary market liquidity.
■ Investors may also have shifted their preferences to purchase securities in the primary market, rather than source them in the secondary market. This could have reduced the number of market participants and trading volume in the secondary market.
The stock of outstanding debt securities has been growing Graph 24 Trillion (USD)
Sources: BIS debt securities statistics based on IMF; Dealogic; Euroclear; Thomson Reuters; Xtrakter Ltd; national data.
To date, there is limited evidence of a broad reduction in market liquidity during normal times (Graph 25). ■ In most cases, price-based measures of market liquidity in cash, sovereign and corporate
bond markets, such as bid-ask spreads, have remained within historical ranges, including
27 See BIS Markets Committee, January 2016, Electronic trading in fixed income markets. 28 See IOSCO, February 2017, Examination of Liquidity of the Secondary Corporate Bond Markets, Chapter D. 29 See Committee on the Global Financial System (CGFS), November 2014, Market-making and proprietary trading (CGFS
Papers No. 52).
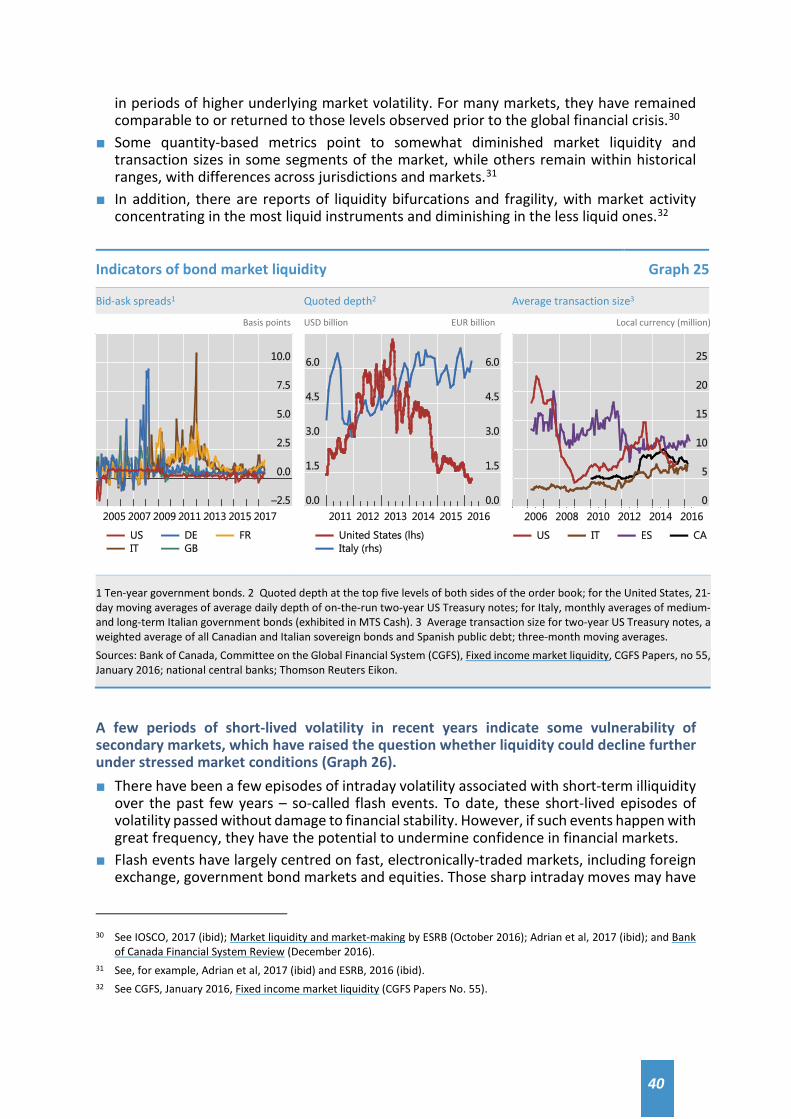
40
in periods of higher underlying market volatility. For many markets, they have remained comparable to or returned to those levels observed prior to the global financial crisis.30
■ Some quantity-based metrics point to somewhat diminished market liquidity and transaction sizes in some segments of the market, while others remain within historical ranges, with differences across jurisdictions and markets.31
■ In addition, there are reports of liquidity bifurcations and fragility, with market activity concentrating in the most liquid instruments and diminishing in the less liquid ones.32
Indicators of bond market liquidity Graph 25
Bid-ask spreads1 Quoted depth2 Average transaction size3
Basis points USD billion EUR billion Local currency (million)
1 Ten-year government bonds. 2 Quoted depth at the top five levels of both sides of the order book; for the United States, 21-day moving averages of average daily depth of on-the-run two-year US Treasury notes; for Italy, monthly averages of medium- and long-term Italian government bonds (exhibited in MTS Cash). 3 Average transaction size for two-year US Treasury notes, a weighted average of all Canadian and Italian sovereign bonds and Spanish public debt; three-month moving averages. Sources: Bank of Canada, Committee on the Global Financial System (CGFS), Fixed income market liquidity, CGFS Papers, no 55, January 2016; national central banks; Thomson Reuters Eikon.
A few periods of short-lived volatility in recent years indicate some vulnerability of secondary markets, which have raised the question whether liquidity could decline further under stressed market conditions (Graph 26). ■ There have been a few episodes of intraday volatility associated with short-term illiquidity
over the past few years – so-called flash events. To date, these short-lived episodes of volatility passed without damage to financial stability. However, if such events happen with great frequency, they have the potential to undermine confidence in financial markets.
■ Flash events have largely centred on fast, electronically-traded markets, including foreign exchange, government bond markets and equities. Those sharp intraday moves may have
30 See IOSCO, 2017 (ibid); Market liquidity and market-making by ESRB (October 2016); Adrian et al, 2017 (ibid); and Bank
of Canada Financial System Review (December 2016). 31 See, for example, Adrian et al, 2017 (ibid) and ESRB, 2016 (ibid). 32 See CGFS, January 2016, Fixed income market liquidity (CGFS Papers No. 55).
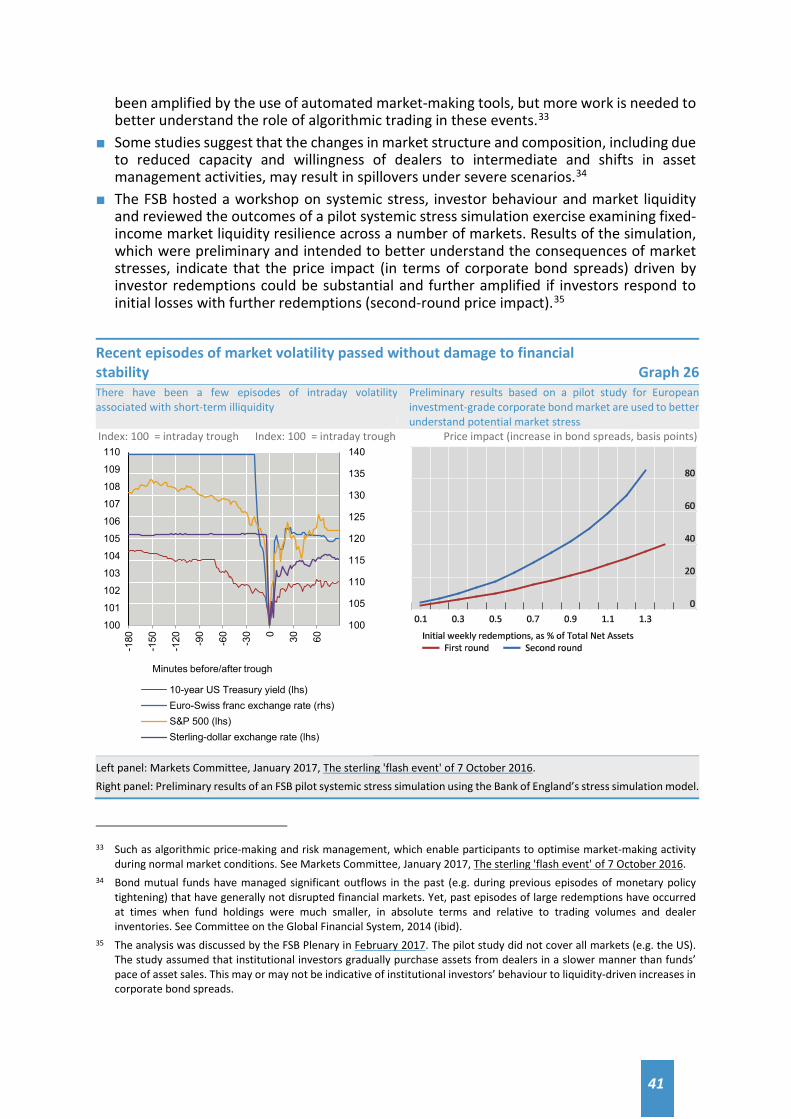
41
been amplified by the use of automated market-making tools, but more work is needed to better understand the role of algorithmic trading in these events.33
■ Some studies suggest that the changes in market structure and composition, including due to reduced capacity and willingness of dealers to intermediate and shifts in asset management activities, may result in spillovers under severe scenarios.34
■ The FSB hosted a workshop on systemic stress, investor behaviour and market liquidity and reviewed the outcomes of a pilot systemic stress simulation exercise examining fixed-income market liquidity resilience across a number of markets. Results of the simulation, which were preliminary and intended to better understand the consequences of market stresses, indicate that the price impact (in terms of corporate bond spreads) driven by investor redemptions could be substantial and further amplified if investors respond to initial losses with further redemptions (second-round price impact).35
Recent episodes of market volatility passed without damage to financial stability Graph 26 There have been a few episodes of intraday volatility associated with short-term illiquidity
Preliminary results based on a pilot study for European investment-grade corporate bond market are used to better understand potential market stress
Index: 100 = intraday trough Index: 100 = intraday trough Price impact (increase in bond spreads, basis points)
Left panel: Markets Committee, January 2017, The sterling 'flash event' of 7 October 2016. Right panel: Preliminary results of an FSB pilot systemic stress simulation using the Bank of England’s stress simulation model.
33 Such as algorithmic price-making and risk management, which enable participants to optimise market-making activity
during normal market conditions. See Markets Committee, January 2017, The sterling 'flash event' of 7 October 2016. 34 Bond mutual funds have managed significant outflows in the past (e.g. during previous episodes of monetary policy
tightening) that have generally not disrupted financial markets. Yet, past episodes of large redemptions have occurred at times when fund holdings were much smaller, in absolute terms and relative to trading volumes and dealer inventories. See Committee on the Global Financial System, 2014 (ibid).
35 The analysis was discussed by the FSB Plenary in February 2017. The pilot study did not cover all markets (e.g. the US). The study assumed that institutional investors gradually purchase assets from dealers in a slower manner than funds’ pace of asset sales. This may or may not be indicative of institutional investors’ behaviour to liquidity-driven increases in corporate bond spreads.
100
101
102
103
104
105
106
107
108
109
110
100
105
110
115
120
125
130
135
140
-180
-150
-120 -90
-60
-30 0 30 60
10-year US Treasury yield (lhs)Euro-Swiss franc exchange rate (rhs)S&P 500 (lhs)Sterling-dollar exchange rate (lhs)
Minutes before/after trough
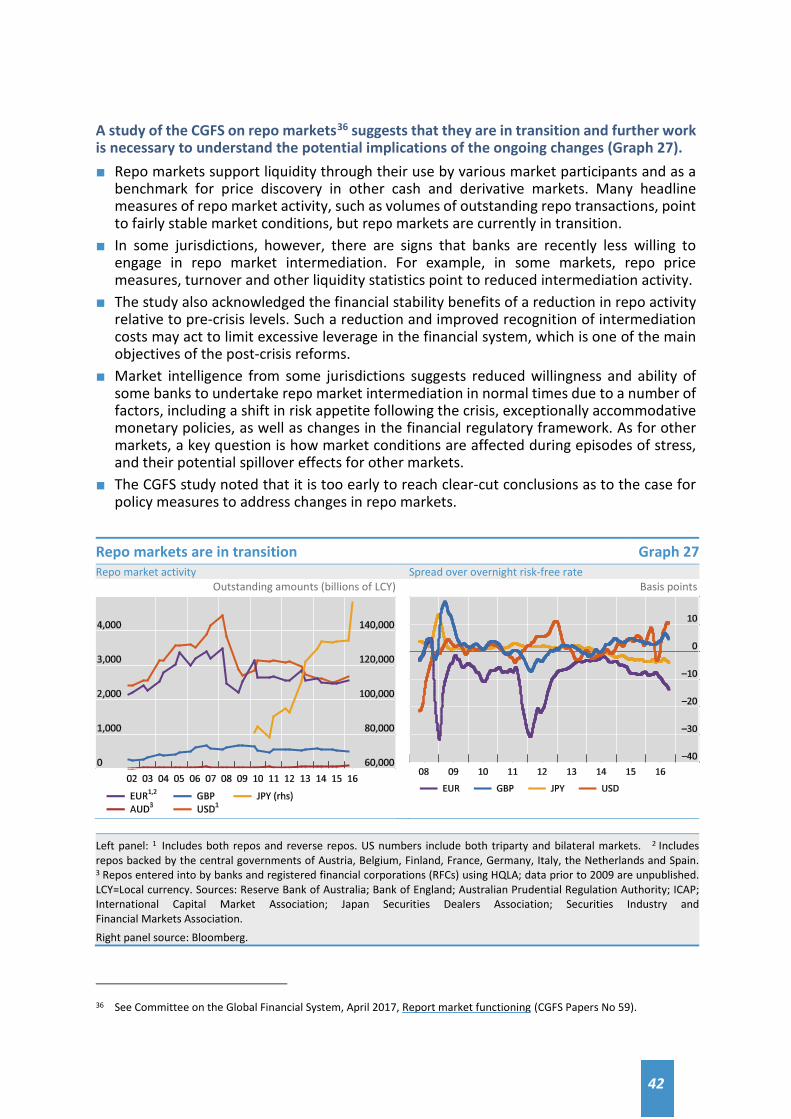
42
A study of the CGFS on repo markets36 suggests that they are in transition and further work is necessary to understand the potential implications of the ongoing changes (Graph 27). ■ Repo markets support liquidity through their use by various market participants and as a
benchmark for price discovery in other cash and derivative markets. Many headline measures of repo market activity, such as volumes of outstanding repo transactions, point to fairly stable market conditions, but repo markets are currently in transition.
■ In some jurisdictions, however, there are signs that banks are recently less willing to engage in repo market intermediation. For example, in some markets, repo price measures, turnover and other liquidity statistics point to reduced intermediation activity.
■ The study also acknowledged the financial stability benefits of a reduction in repo activity relative to pre-crisis levels. Such a reduction and improved recognition of intermediation costs may act to limit excessive leverage in the financial system, which is one of the main objectives of the post-crisis reforms.
■ Market intelligence from some jurisdictions suggests reduced willingness and ability of some banks to undertake repo market intermediation in normal times due to a number of factors, including a shift in risk appetite following the crisis, exceptionally accommodative monetary policies, as well as changes in the financial regulatory framework. As for other markets, a key question is how market conditions are affected during episodes of stress, and their potential spillover effects for other markets.
■ The CGFS study noted that it is too early to reach clear-cut conclusions as to the case for policy measures to address changes in repo markets.
Repo markets are in transition Graph 27 Repo market activity Spread over overnight risk-free rate
Outstanding amounts (billions of LCY) Basis points
36 See Committee on the Global Financial System, April 2017, Report market functioning (CGFS Papers No 59).
Left panel: 1 Includes both repos and reverse repos. US numbers include both triparty and bilateral markets. 2 Includes repos backed by the central governments of Austria, Belgium, Finland, France, Germany, Italy, the Netherlands and Spain. 3 Repos entered into by banks and registered financial corporations (RFCs) using HQLA; data prior to 2009 are unpublished. LCY=Local currency. Sources: Reserve Bank of Australia; Bank of England; Australian Prudential Regulation Authority; ICAP; International Capital Market Association; Japan Securities Dealers Association; Securities Industry and Financial Markets Association. Right panel source: Bloomberg.
43
The reforms have reduced the likelihood that a deterioration in market liquidity could result in wider financial stability problems, but their possible effect in constraining banks’ ability and willingness to act as market intermediaries needs monotoring. ■ The greater capital strength and more resilient funding of core financial intermediaries
mean that market liquidity erosions would be less likely to have systemic implications than in the past.
■ But less resilient liquidity in secondary fixed income markets has the potential to raise the cost of borrowing in the primary market and thus access to debt markets for some borrowers may continue at higher costs.
Continued monitoring and further analysis of market liquidity conditions, including during periods of stress, are warranted. ■ The FSB is surveying investment strategies and portfolio rebalancing of institutional
investors under different scenarios and potential implications for financial stability. It is also assessing changes in market structure related to algorithmic trading.
■ The CGFS will undertake a further study of repo markets within the next two years.
6.3 Effects of reforms on Emerging Market and Developing Economies (EMDEs)
Some EMDEs continue to report challenges in implementing regulatory reforms and concerns arising from the reduction in global banks’ activity in their domestic markets. To date, however, these do not seem to have significantly impacted EMDEs’ credit growth. ■ The FSB’s third annual EMDEs Forum took place in February 2017. Participants from EMDEs
discussed the reform agenda. To date, no major unintended consequences of implementing the regulatory reforms have been reported by EMDEs. Nevertheless, EMDEs raised a number of implementation challenges and possible effects of regulatory reforms.
■ In some cases, the implementation challenges cited by EMDEs stem from domestic factors (e.g. capacity constraints, shallow fixed-income markets, other policy priorities). In other cases, however, they stem from cross-border spillovers. These include the way that home jurisdictions of hosted global banks are implementing certain reforms (e.g. risk weighting of host jurisdictions’ debt, delays in bilateral recognition/equivalence assessments on OTC derivatives) and the adoption of national policy initiatives to improve financial stability that go beyond the internationally agreed standards (e.g. structural banking measures).
■ These factors, combined with broader macroeconomic developments (e.g. slower growth and drop in commodity prices) and the still-evolving business models of global banks, may have contributed to the reduced presence and activities of global banks in some EMDEs.
■ Bank lending growth in EMDEs has slowed down recently (Graph 17, left panel), but from high levels; in fact, such lending continues to grow as a share of GDP in many of those jurisdictions. There is also increased use of non-bank sources of financing (Graph 19, right panel). With the exception of some European banks, there is little evidence of a reduction since the financial crisis in cross-border lending by advanced economy banks to EMDE borrowers (Graph 21, bottom panel).
The FSB, in collaboration with SSBs and international financial institutions, is monitoring the effects of regulatory reforms on EMDEs and following up on implementation challenges. ■ The FSB will issue in July 2017, following a consultation process, high-level guiding
principles to assist home and host authorities (including from EMDEs) in the implementation of internal TLAC mechanisms consistent with the TLAC standard.
44
■ The FSB examined progress in implementing G20 reforms in recent peer reviews of EMDE members (Argentina, Brazil, India) and made recommendations to address identified gaps.
■ FSB Regional Consultative Groups have held workshops on the effects of reforms (e.g. in the Sub-Saharan Africa region), discussed implementation issues (e.g. with respect to TLAC), and set up working groups to analyse particular issues from a regional perspective (e.g. shadow banking in the Americas region).
■ The BCBS issued guidance in September 2016 on the application of the Basel Core Principles in the context of financial inclusion, and is continuing work on the regulatory capital treatment of sovereign exposures. It is also working on ways to increase the quality and timeliness of information shared among members of supervisory colleges and to provide guidance in promoting cooperation between home and host supervisors of G-SIBs.
■ The FSB and IOSCO jointly held a workshop in October 2016 for experts from advanced economies and EMDEs to share experiences in implementation of reforms to OTC derivatives markets. This workshop included discussions on the processes for cross-border recognition of FMI such as CCPs clearing OTC derivatives; how TR data are used to monitor systemic risk and inform policy choices; whether to establish local infrastructure for OTC derivatives transactions or rely instead on cross-border infrastructure; and the various ways in which cross-border regulatory cooperation and deference to foreign regimes based on similar outcomes, can work in practice.
Work is also underway by the FSB and other international bodies to explore other issues important to EMDEs, such as correspondent banking. ■ A decline in the number of correspondent banking relationships (CBRs) is a source of
concern for the international community because, in affected jurisdictions, it may impact the ability to send and receive international payments, or drive some payment flows underground, with potential consequences on growth, financial inclusion, as well as the stability and integrity of the financial system.
■ The FSB is coordinating an action plan, in partnership with other organisations, to assess and address international banks’ withdrawal of correspondent banking services, which is an issue of concern for many EMDEs but also for other countries (see Box 2).
Box 2: Update on implementation of the action plan on correspondent banking The FSB, through its Correspondent Banking Coordination Group, is implementing the action plan presented to G20 Leaders in November 2015 to assess and address the decline in correspondent banking. The action plan has four elements as follows: Data collection and analysis: The FSB will publish the results of a survey involving approximately 300 banks in almost 50 jurisdictions, as well as and an updated analysis of the SWIFT data originally published by the CPMI in July 2016. The decline in the number of CBRs affects all regions to a varying degree and appears more pronounced for USD and EUR. The decline generally does not result in a reduced number of wire transfers but may lead to longer payment chains, and a greater concentration where countries and banks rely on fewer CBRs. A range of reasons explain the terminations of CBRs, including industry consolidation, lack of profitability, the overall risk appetite, and various causes related to anti-money laundering and combating the financing of terrorism (AML/CFT) or sanctions regimes. The countries most affected by complete exits of foreign correspondent banks tend to be small economies or jurisdictions for which the compliance with AML/CFT standards is insufficient or unknown. Work on a process for ongoing monitoring of trends in correspondent banking continues.
45
Clarifying regulatory expectations: The Financial Action Task Force (FATF) published in October 2016 its guidance on correspondent banking that clarifies, among other aspects, that the FATF Recommendations do not require financial institutions to conduct customer due diligence on the customers of their respondent bank clients. In June 2017, the BCBS published revised guidance on correspondent banking in its guidelines on the Sound management of risks related to money laundering and financing of terrorism. The revisions develop the application of a risk-based approach for correspondent banking relationships, recognising that not all correspondent banking relationships bear the same level of risk and clarify expectations concerning downstream clearing (which allows for instance regional banks to serve as intermediaries for smaller local banks to access the international financial system) and “know your customer” (KYC) utilities (which may streamline the gathering and sharing of information among correspondent and respondent banks). Domestic capacity building: The inventory developed by international institutions of technical assistance (TA) and other capacity building activities now covers over 300 TA projects in 144 countries. This inventory will be regularly updated and, together with dialogue between TA providers, will assist in assessing and prioritising TA needs. The FSB is also promoting mechanisms to encourage capacity building by the private sector, and foster the communication by national authorities of the steps taken to strengthen their AML/CFT frameworks and the quality of financial sector supervision. Strengthening tools for due diligence by correspondent banks: The FSB, BCBS and CPMI support and monitor the implementation of the recommendations of the 2016 CPMI report on correspondent banking. These include the use of KYC utilities, information sharing, and improving the quality of information in payment messages. In addition, the FSB is working with the FATF and the Global Partnership for Financial Inclusion to identify whether there are remaining issues relating to remittance providers’ access to banking services that are not already being dealt with through existing initiatives and, where these are identified, address them.
46
7. FSB evaluation framework The FSB, in close collaboration with the SSBs and informed by work carried out by its members and other stakeholders, has developed a framework for the post-implementation evaluation of the effects of the G20 financial regulatory reforms. Objectives and scope ■ The framework aims to guide analyses of whether the G20 reforms are achieving their
intended outcomes, and help identify any material unintended consequences that may have to be addressed, without compromising on the objectives of the reforms.
■ The focus of the framework is on post-implementation evaluation; that is, evaluating the effects of G20 reforms, in particular the core reform areas, for which implementation is well underway or completed.37
■ Building on the experience with the FSB’s 2011 Coordination Framework for Implementation Monitoring (CFIM), the framework adds to the policy cycle by setting out general guidelines for post-implementation evaluations; clarifying roles and responsibilities; and helping to select and prioritise evaluation topics.
■ Applying such a framework will inform structured policy discussions among FSB and SSB members.
■ The framework is a living document that will be enhanced as experience is gained and its roll-out will take place progressively in the coming years.
Concepts and terms ■ An important objective of the evaluation framework is to clarify concepts and terms, with
the aim of achieving a common understanding by FSB members and relevant stakeholders. ■ The starting point for any post-implementation evaluation is to set out the reform’s
original objectives and the primary issues that the reform was intended to address. ■ Broad objectives are set out by the G20 relating to a resilient, open and integrated
global financial system that supports strong, sustainable and balanced economic growth. Specific objectives are set out by the relevant body(ies) for individual reforms.
■ Since a reform’s objectives are often expressed in fairly general (non-technical) terms, they must be translated into measurable benchmarks to assess whether the reform’s effects are in line with what was desired.
■ The evaluations undertaken by the FSB and SSBs may include analyses from three distinct but inter-related perspectives:
• the effectiveness of individual reforms; • the interaction and coherence among reforms; and • the overall effects of reforms on the G20 objectives.
■ Evaluations of the effects of reforms (particularly the overall effects) should focus on assessing the social benefits and costs, but should also consider private benefits and costs that accrue to particular market participants or end users as well as relevant distributional issues; and distinguish between temporary (during the transition period) and permanent effects.
37 The framework will cover ex ante analysis only to the extent that it is necessary for post-implementation evaluation, such
as translating policy objectives (set out at the time of development) into observable and measurable outcomes, and comparing available ex ante impact assessments with realised outcomes.
47
■ The analysis of benefits and costs may also involve a consideration of efficiency– namely, the extent to which reforms are working in a way that minimises net social cost for a given social benefit.
Evaluation approaches ■ Evaluations should address three main questions:
■ Did the reform “cause” an outcome? ■ Did the reform have broadly similar effects across relevant markets, states of world,
or jurisdictions and regions? ■ Did the reform achieve its overall objective?
■ Evaluations involve a number of challenges, which the framework should help to manage: ■ analysing a multitude of transmission channels and behavioural responses; ■ accounting for complex interactions among regulatory and non-regulatory factors; ■ estimating social benefits and costs (including long-term effects); and ■ considering data gaps.
■ One of the key challenges is the difficulty of establishing a counterfactual to quantify the benefits of policies.
Evaluation methods ■ There are a number of methods identified as being useful and increasingly employed for
policy evaluations. ■ They include qualitative analysis, indicators and descriptive statistics, partial
equilibrium analysis and general equilibrium analysis. ■ Methods vary greatly in their ability to address the challenges listed above, and there is no
“one-size-fits-all” approach. There is, however, a progression in the use of methods. ■ Simpler indicators and descriptive statistics may be particularly useful to provide some
insights for subsequent, more comprehensive and complex evaluations, such as those encompassing multiple reforms.
■ Evaluations of major reforms and of interaction of reforms could be expected to employ, at some point, the most complex types of analyses.
Operationalising evaluations ■ The process should be flexible and streamlined, and proportional to the scope and
complexity of the evaluation. It should facilitate consultation and collaboration between the SSBs and FSB as well as with external stakeholders where appropriate.
■ Evaluations would build as much as possible on the FSB’s and SSBs’ existing implementation monitoring and assessment frameworks, and would be carried out in accordance with those bodies’ governance structures.
■ The process for operationalising evaluations includes preparation, analysis, reporting, consultation and follow-up.
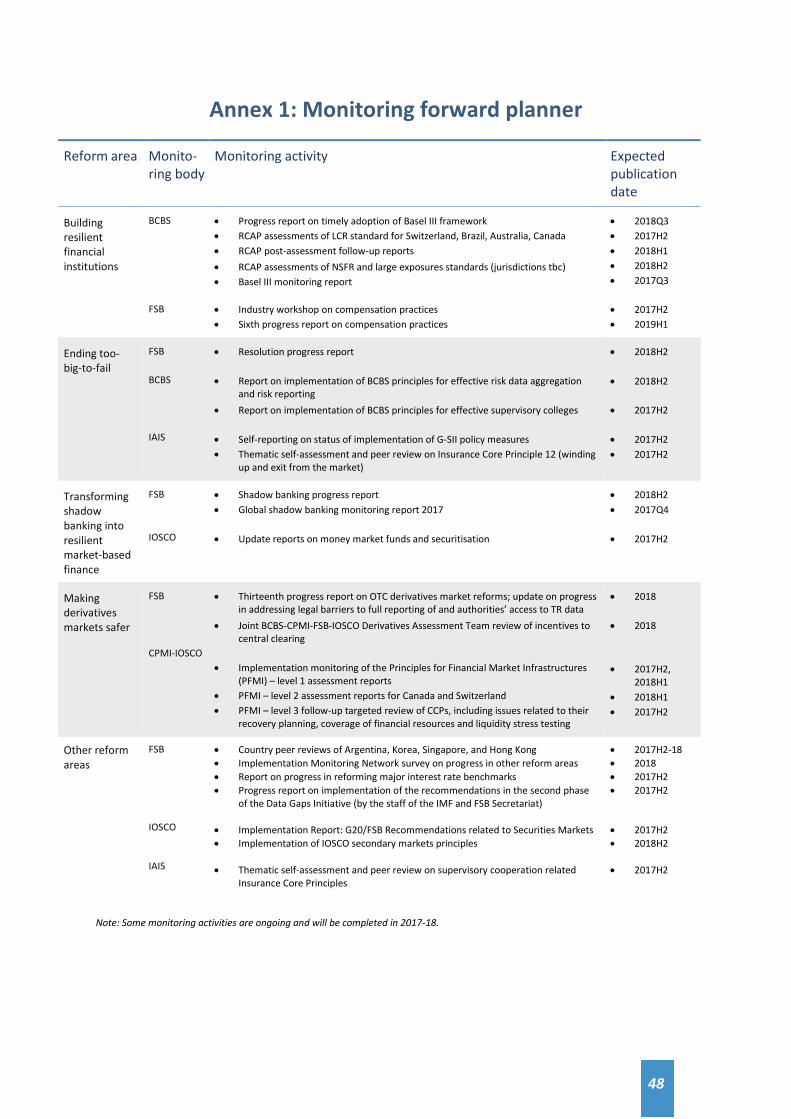
48
Annex 1: Monitoring forward planner
Reform area Monito-ring body
Monitoring activity Expected publication date
Building resilient financial institutions
BCBS • Progress report on timely adoption of Basel III framework • RCAP assessments of LCR standard for Switzerland, Brazil, Australia, Canada • RCAP post-assessment follow-up reports • RCAP assessments of NSFR and large exposures standards (jurisdictions tbc) • Basel III monitoring report
• 2018Q3 • 2017H2 • 2018H1 • 2018H2 • 2017Q3
FSB • Industry workshop on compensation practices • Sixth progress report on compensation practices
• 2017H2 • 2019H1
Ending too-big-to-fail
FSB BCBS IAIS
• Resolution progress report • Report on implementation of BCBS principles for effective risk data aggregation
and risk reporting • Report on implementation of BCBS principles for effective supervisory colleges • Self-reporting on status of implementation of G-SII policy measures • Thematic self-assessment and peer review on Insurance Core Principle 12 (winding
up and exit from the market)
• 2018H2 • 2018H2 • 2017H2 • 2017H2 • 2017H2
Transforming shadow banking into resilient market-based finance
FSB IOSCO
• Shadow banking progress report • Global shadow banking monitoring report 2017 • Update reports on money market funds and securitisation
• 2018H2 • 2017Q4 • 2017H2
Making derivatives markets safer
FSB CPMI-IOSCO
• Thirteenth progress report on OTC derivatives market reforms; update on progress in addressing legal barriers to full reporting of and authorities’ access to TR data
• Joint BCBS-CPMI-FSB-IOSCO Derivatives Assessment Team review of incentives to central clearing
• Implementation monitoring of the Principles for Financial Market Infrastructures
(PFMI) – level 1 assessment reports • PFMI – level 2 assessment reports for Canada and Switzerland • PFMI – level 3 follow-up targeted review of CCPs, including issues related to their
recovery planning, coverage of financial resources and liquidity stress testing
• 2018 • 2018 • 2017H2,
2018H1 • 2018H1 • 2017H2
Other reform areas
FSB IOSCO IAIS
• Country peer reviews of Argentina, Korea, Singapore, and Hong Kong • Implementation Monitoring Network survey on progress in other reform areas • Report on progress in reforming major interest rate benchmarks • Progress report on implementation of the recommendations in the second phase
of the Data Gaps Initiative (by the staff of the IMF and FSB Secretariat) • Implementation Report: G20/FSB Recommendations related to Securities Markets • Implementation of IOSCO secondary markets principles • Thematic self-assessment and peer review on supervisory cooperation related
Insurance Core Principles
• 2017H2-18 • 2018 • 2017H2 • 2017H2 • 2017H2 • 2018H2 • 2017H2
Note: Some monitoring activities are ongoing and will be completed in 2017-18.
49
Annex 2: Sources of information Basel III
■ Implementation of Basel standards: A report to G20 Leaders on implementation of the Basel III regulatory reforms, July 2017 (BCBS)
■ Twelfth progress report on adoption of the Basel regulatory framework, April 2017 (BCBS)
■ Basel III monitoring report, February 2017 (BCBS) ■ RCAP jurisdiction-level assessments of final Basel III regulations (BCBS) ■ RCAP assessments of the consistency of regulatory outcomes (BCBS)
Compensation practices
■ Implementing the FSB Principles for Sound Compensation Practices and their Implementation Standards: Fifth Progress Report, July 2017 (FSB)
■ Consultative Document on Supplementary Guidance to the FSB Principles and Standards on Sound Compensation Practices, June 2017 (FSB)
TBTF
■ Ten years on – taking stock of post-crisis resolution reforms: Sixth Report on the implementation of resolution reforms, July 2017 (FSB)
■ Progress in adopting the Principles for effective risk data aggregation and risk reporting, March 2017 (BCBS)
Shadow banking
■ Assessment of shadow banking activities, risks and the adequacy of post-crisis policy tools to address financial stability concerns, July 2017 (FSB)
■ Global Shadow Banking Monitoring Report 2016, May 2017 (FSB) OTC derivatives
■ Chairs’ Report on the Implementation of the Joint Workplan for Strengthening the Resilience, Recovery and Resolvability of Central Counterparties, July 2017 (FSB, CPMI, IOSCO and BCBS)
■ Review of OTC derivatives markets reforms: Effectiveness and broader effects of reforms, June 2017 (FSB)
■ OTC Derivatives Markets Reforms: Twelfth Progress Report on Implementation, June 2017 (FSB)
■ Progress report on FSB members’ plans to address legal barriers to reporting and accessing OTC derivatives trade data, June 2017 (FSB)
■ Implementation monitoring of the Principles for Financial Market Infrastructures (CPMI-IOSCO)
Other reform areas
■ Country peer reviews (FSB) ■ FSB jurisdictions’ responses to the Implementation Monitoring Network survey (FSB)
50
■ Implementation Report: G20/FSB Recommendations related to Securities Markets, forthcoming (IOSCO)
■ Legal Entity Identifier Progress report, forthcoming (LEI ROC) ■ FX Global Code: A set of global principles of good practice in the foreign exchange
market, May 2017 (BIS) ■ Second Review of the Implementation of IOSCO's Principles for Financial Benchmarks
in respect of the WM/Reuters 4 p.m. Closing Spot Rate, February 2017 (IOSCO) Adherence to international financial standards
■ Information on FSB members’ commitments to lead by example (FSB) ■ Initiative on international cooperation and information exchange (FSB) ■ Multilateral Memorandum of Understanding Concerning Consultation and
Cooperation and the Exchange of Information (IOSCO) ■ Multilateral Memorandum of Understanding (IAIS)
Emerging market and developing economies (EMDEs)
■ FSB action plan to assess and address the decline in correspondent banking: Progress report to G20 Summit of July 2017, July 2017 (FSB)
■ FSB Regional Consultative Group working group reports (FSB) Other
■ Framework for Post-Implementation Evaluation of the Effects of the G20 Financial Regulatory Reforms, July 2017 (FSB)
51
Abbreviations
ABCP Asset-backed commercial paper programmes AML/CFT Anti-Money Laundering/Combating the Financing of Terrorism BCBS Basel Committee on Banking Supervision BIS Bank for International Settlements CBR Correspondent Banking Relationship CCPs Central counterparties CDO Collateralised debt obligations CDS Credit default swap CET1 Common Equity Tier 1 Capital CFIM Coordination Framework for Implementation Monitoring CMG Crisis management groups CGFS Committee on the Global Financial System CoAgs Cross-border cooperation agreements CPMI Committee on Payments and Market Infrastructures CRAs Credit rating agencies DGI Data Gaps Initiative D-SIBs Domestic systemically important banks EF Economic functions EMDEs Emerging Market and Developing Economies EU European Union FSAP Financial Sector Assessment Program FSB Financial Stability Board FATF Financial Action Task Force FMI Financial market infrastructures GDP Gross domestic product G-SIBs Global systemically important banks G-SIFIs Global systemically important financial institutions G-SIIs
Global systemically important insurers
IAIS International Association of Insurance Supervisors IASB International Accounting Standards Board ICS International Capital Standard IFIAR International Forum of Independent Audit Regulators IMF International Monetary Fund IOSCO
International Organization of Securities Commissions ISDA International Swaps and Derivatives Association KYC Know your customer LCR Liquidity Coverage Ratio (Basel III) LEI Legal Entity Identifier MMFs Money market funds MMoUs Multilateral Memoranda of Understanding NAV Net asset value
NBNI Non-bank non-insurer (G-SIFI) NSFR Net Stable Funding Ratio (Basel III) OECD Organisation for Economic Co-operation and Development OFIs Other financial institutions OTC Over-the-counter (derivatives)
52
PFMI Principles for Financial Market Infrastructure (CPMI-IOSCO) QIS Quantitative impact study RCAP Regulatory Consistency Assessment Programme (BCBS) RWAs Risk-weighted assets SSBs Standard-setting bodies SIFIs Systemically important financial institutions SIVs Structured investment vehicles TBTF Too-big-to-fail TLAC Total Loss-Absorbing Capacity TOR Terms of Reference TRs Trade repositories