Embed Size (px)
Citation preview
Implementation of a Multi-band Equalizer in MATLAB and Simulink Using Algorithm Manipulation
Wesley C. Caruso, Benjamin C. Fisk, Jacob D. Whaley, Suhayb Alsaedi, Benjamin D. McPheron
School of Engineering, Computing & Construction Management Roger Williams University
Audio equalizers can be used to manipulate signal frequencies to improve sound quality for different listening environments. During analog to digital conversion, audio signals are subject to phase shift, quantization noise, and electromagnetic noise that can be reduced with the help of audio equalizers. Applying filters across multiple bandwidths and using algorithm modification can alter inaccurate signals in order to provide a higher quality output. This paper presents the analysis and implementation of filtering algorithms in digital signal processing to affect overall sound quality and reduce the effects of miscellaneous noise. These algorithms were tested in MATLAB and Simulink, and successful implementation of these algorithms can be observed by finding the impulse response and frequency response of the system. The results show an audio equalization algorithm that was verified by analyzing test signals to compare frequency response before and after equalization.
Corresponding Author: Benjamin D. McPheron, [email protected]
Introduction
One of the most used methods in digital signal processing is audio equalization. Equalizers are utilized in telecommunication systems, recording studios, acoustics, and many devices such as microphones and speakers. Audio equalization provides a way to obtain a cleaner sound since each listening environment changes how the sound is perceived. Phase shift, quantization noise, and electromagnetic noise are also common issues that arise during analog to digital conversion. The purpose of developing an equalizer is to limit these factors that have a negative impact on the quality of an audio signal, which can be accomplished by boosting or cutting parts of the signal. In digital signal processing (DSP), applications such as MATLAB and Simulink provide a range of tools that are applicable to audio equalization. These tools offer a useful, simpler way for users to create functions, scripts and models that can be implemented in a range of topics relating to different areas of study. MATLAB, like many other coding applications, contain multiple libraries of convenient toolboxes with algorithms and functions for filtering. MATLAB’s Butterworth function was used in order to design filters for this equalizer. Simulink is another useful application embedded in MATLAB that provides a wide range of filter types along with many other components relating to signal
manipulation. Simulink also helps provide a visual representation of what processes occur during signal equalization. This paper presents the implementation of a five band audio equalizer using filtering algorithms in MATLAB and Simulink along with methods from DSP.
Theory
During analog to digital conversion, signals pass through a sampler, quantizer and coder. In the sampler, two characteristics that relate to equalization are the sampling period, 𝑇" and the sampling frequency, 𝐹", of the signal. The sampling frequency commonly used for audio signals is 44100 Hz, because this allows for appropriate reconstruction of signal frequencies up to 22500 Hz, which is above the audible range for most humans. In practical life, signals exist as a function of time, in the time domain. The time domain is a representation of real values that occur over a given time interval. A better representation of these signals can be obtained in the frequency domain [1]. The frequency domain, which can be attributed to Joseph Fourier, shows that periodic signals are representable by an infinite series of sinusoids at discrete frequencies. In mathematics, a transformation between the time domain and the frequency domain is known as the Fourier Transform. The Fourier Transform (FT) is important to audio equalization since, during signal analysis in the time domain, it may be difficult to observe the important properties pertaining to that signal. Taking the Fourier
Transform of a signal provides more insightful information of the signal content at specific frequencies. A collection of algorithms used to compute the discrete Fourier Transform of a signal is commonly known as the Fast Fourier Transform (FFT) [1]. Another convenient way of representing a signal is from the Z-transform. In DSP, the Z-transform is useful in determining the stability of a signal and providing a way to represent sampled data signals. The Z-transform is related to the Fourier transform by setting 𝑧 = 𝑒'(. A. Cutoff Frequency The cutoff frequency, 𝜔*, is the boundary of a signal. A cutoff frequency can be established in order to determine where a signal needs to stop or be “cutoff” at for a certain frequency. For all filters, the cutoff frequency is established in the region where the signal needs to be enhanced [1]. B. Bandwidth In order to limit where the equalizer affects an audio signal, a bandwidth is established. The bandwidth refers to the frequencies over which the audio signal is manipulated by the equalizer. This is a necessary component of the system because it determines the range where the equalizer needs to be implemented in order to enhance the output signal [1]. C. Center Frequency The center frequency refers to the frequency that is in the middle of the lower and upper cutoff frequencies. Center frequency is important because the gain over a specified bandwidth has a maximum at the center frequency for audio signals. The center frequency can be shifted in order to skew the desired range of frequencies encompassed inside a single bandwidth [1]. D. Gain Gain is used to indicate the level of a signal at a specified frequency. The gain of a signal has a direct correlation to the loudness or amount of sound that is being produced at any given time. In some cases, the gain of a signal can be too great due to miscellaneous noise causing disruption to the audio signal. In order to compensate for this issue, the gain of the signal may be increased or decreased to produce the desired output [1]. E. Filter Types There are four commonly used types of filters in audio equalization: lowpass, bandpass, bandstop and highpass. These filters are devices that either permit or reject a specified range of frequencies based on the characteristics of the filter. For the purpose of this research, which utilizes all but the bandstop, only three will be discussed [2].
1. Lowpass Filter
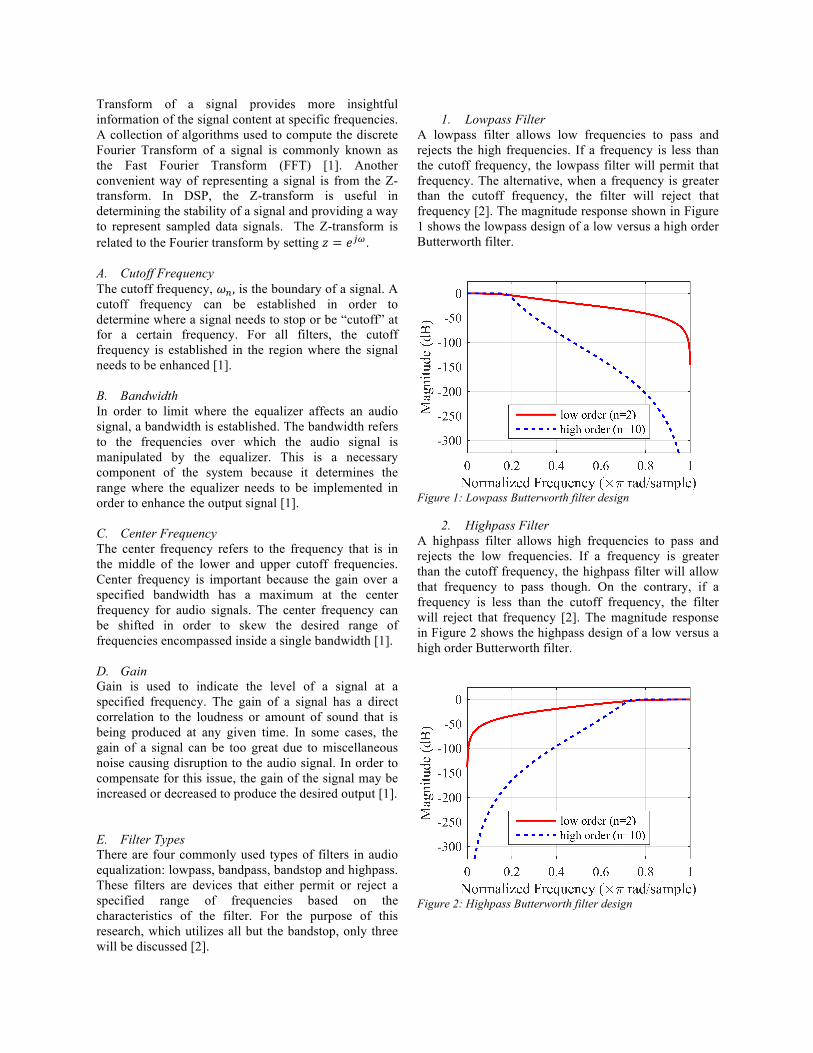
A lowpass filter allows low frequencies to pass and rejects the high frequencies. If a frequency is less than the cutoff frequency, the lowpass filter will permit that frequency. The alternative, when a frequency is greater than the cutoff frequency, the filter will reject that frequency [2]. The magnitude response shown in Figure 1 shows the lowpass design of a low versus a high order Butterworth filter.
Figure 1: Lowpass Butterworth filter design
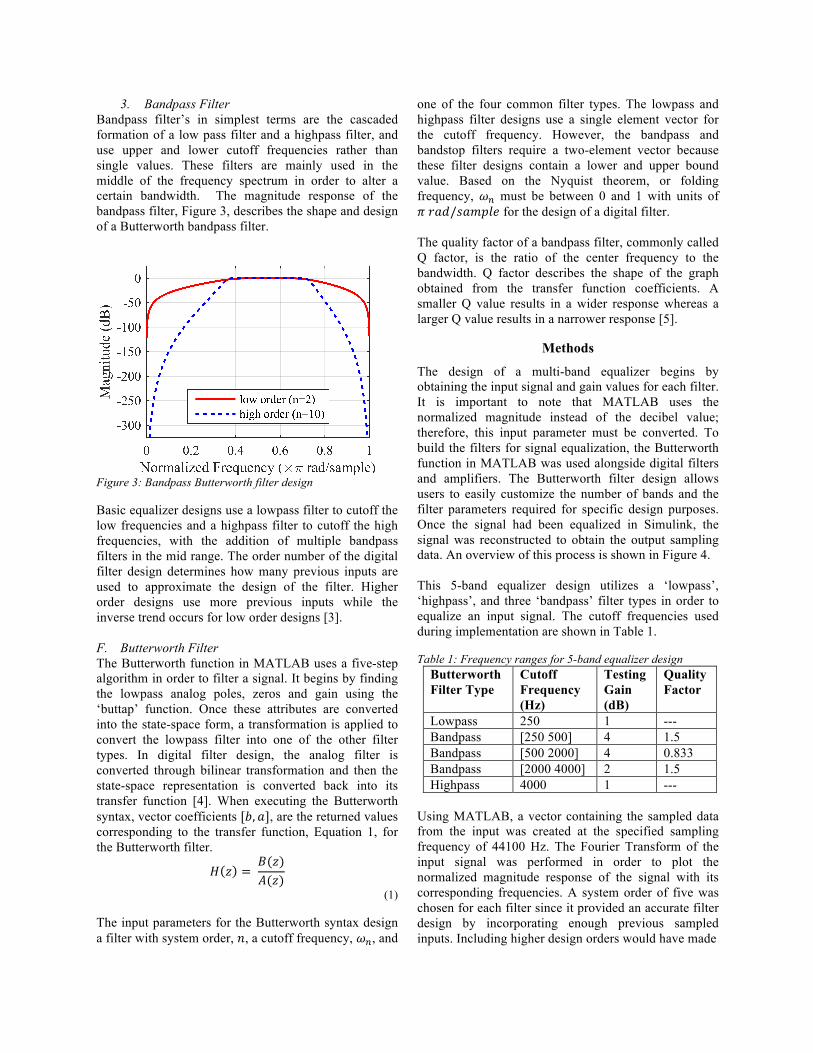
2. Highpass Filter A highpass filter allows high frequencies to pass and rejects the low frequencies. If a frequency is greater than the cutoff frequency, the highpass filter will allow that frequency to pass though. On the contrary, if a frequency is less than the cutoff frequency, the filter will reject that frequency [2]. The magnitude response in Figure 2 shows the highpass design of a low versus a high order Butterworth filter.
Figure 2: Highpass Butterworth filter design
3. Bandpass Filter Bandpass filter’s in simplest terms are the cascaded formation of a low pass filter and a highpass filter, and use upper and lower cutoff frequencies rather than single values. These filters are mainly used in the middle of the frequency spectrum in order to alter a certain bandwidth. The magnitude response of the bandpass filter, Figure 3, describes the shape and design of a Butterworth bandpass filter.
Figure 3: Bandpass Butterworth filter design
Basic equalizer designs use a lowpass filter to cutoff the low frequencies and a highpass filter to cutoff the high frequencies, with the addition of multiple bandpass filters in the mid range. The order number of the digital filter design determines how many previous inputs are used to approximate the design of the filter. Higher order designs use more previous inputs while the inverse trend occurs for low order designs [3]. F. Butterworth Filter The Butterworth function in MATLAB uses a five-step algorithm in order to filter a signal. It begins by finding the lowpass analog poles, zeros and gain using the ‘buttap’ function. Once these attributes are converted into the state-space form, a transformation is applied to convert the lowpass filter into one of the other filter types. In digital filter design, the analog filter is converted through bilinear transformation and then the state-space representation is converted back into its transfer function [4]. When executing the Butterworth syntax, vector coefficients [𝑏, 𝑎], are the returned values corresponding to the transfer function, Equation 1, for the Butterworth filter.
𝐻 𝑧 = 𝐵(𝑧)𝐴(𝑧)
(1)
The input parameters for the Butterworth syntax design a filter with system order, 𝑛, a cutoff frequency, 𝜔*, and
one of the four common filter types. The lowpass and highpass filter designs use a single element vector for the cutoff frequency. However, the bandpass and bandstop filters require a two-element vector because these filter designs contain a lower and upper bound value. Based on the Nyquist theorem, or folding frequency, 𝜔* must be between 0 and 1 with units of 𝜋𝑟𝑎𝑑/𝑠𝑎𝑚𝑝𝑙𝑒 for the design of a digital filter. The quality factor of a bandpass filter, commonly called Q factor, is the ratio of the center frequency to the bandwidth. Q factor describes the shape of the graph obtained from the transfer function coefficients. A smaller Q value results in a wider response whereas a larger Q value results in a narrower response [5].
Methods
The design of a multi-band equalizer begins by obtaining the input signal and gain values for each filter. It is important to note that MATLAB uses the normalized magnitude instead of the decibel value; therefore, this input parameter must be converted. To build the filters for signal equalization, the Butterworth function in MATLAB was used alongside digital filters and amplifiers. The Butterworth filter design allows users to easily customize the number of bands and the filter parameters required for specific design purposes. Once the signal had been equalized in Simulink, the signal was reconstructed to obtain the output sampling data. An overview of this process is shown in Figure 4. This 5-band equalizer design utilizes a ‘lowpass’, ‘highpass’, and three ‘bandpass’ filter types in order to equalize an input signal. The cutoff frequencies used during implementation are shown in Table 1.
Table 1: Frequency ranges for 5-band equalizer design Butterworth Filter Type
Cutoff Frequency (Hz)
Testing Gain (dB)
Quality Factor
Lowpass 250 1 --- Bandpass [250 500] 4 1.5 Bandpass [500 2000] 4 0.833 Bandpass [2000 4000] 2 1.5 Highpass 4000 1 ---
Using MATLAB, a vector containing the sampled data from the input was created at the specified sampling frequency of 44100 Hz. The Fourier Transform of the input signal was performed in order to plot the normalized magnitude response of the signal with its corresponding frequencies. A system order of five was chosen for each filter since it provided an accurate filter design by incorporating enough previous sampled inputs. Including higher design orders would have made
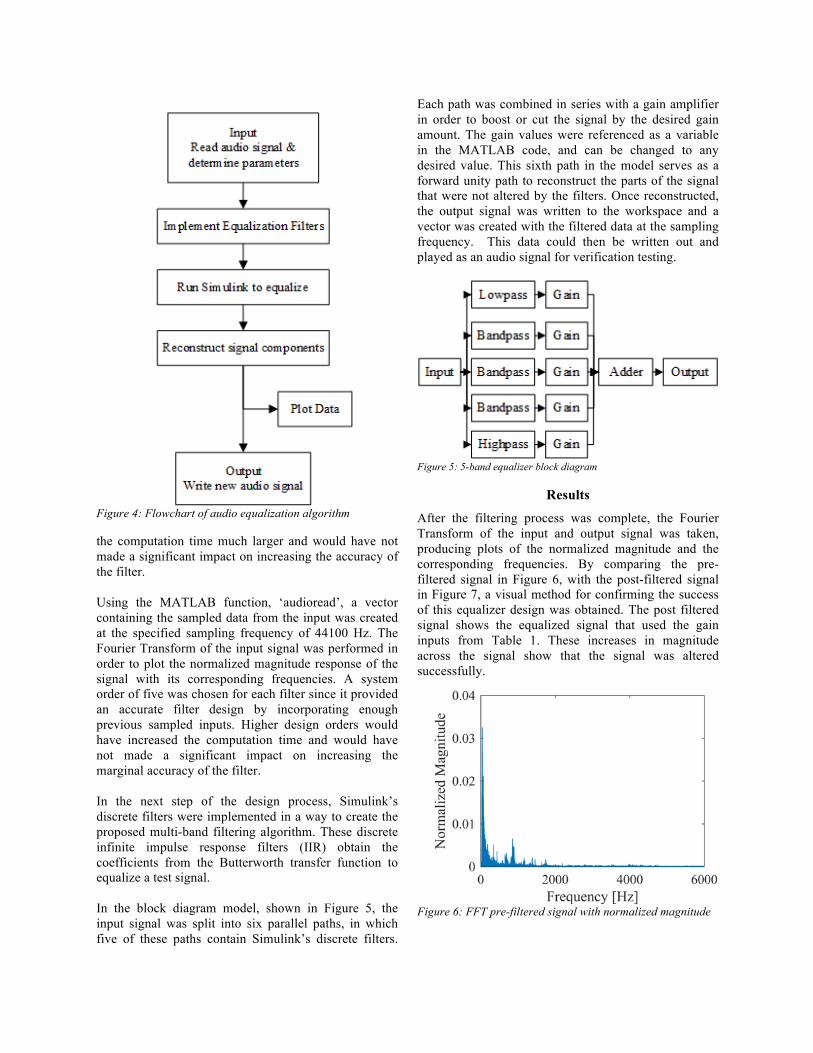
Figure 4: Flowchart of audio equalization algorithm
the computation time much larger and would have not made a significant impact on increasing the accuracy of the filter. Using the MATLAB function, ‘audioread’, a vector containing the sampled data from the input was created at the specified sampling frequency of 44100 Hz. The Fourier Transform of the input signal was performed in order to plot the normalized magnitude response of the signal with its corresponding frequencies. A system order of five was chosen for each filter since it provided an accurate filter design by incorporating enough previous sampled inputs. Higher design orders would have increased the computation time and would have not made a significant impact on increasing the marginal accuracy of the filter. In the next step of the design process, Simulink’s discrete filters were implemented in a way to create the proposed multi-band filtering algorithm. These discrete infinite impulse response filters (IIR) obtain the coefficients from the Butterworth transfer function to equalize a test signal. In the block diagram model, shown in Figure 5, the input signal was split into six parallel paths, in which five of these paths contain Simulink’s discrete filters.
Each path was combined in series with a gain amplifier in order to boost or cut the signal by the desired gain amount. The gain values were referenced as a variable in the MATLAB code, and can be changed to any desired value. This sixth path in the model serves as a forward unity path to reconstruct the parts of the signal that were not altered by the filters. Once reconstructed, the output signal was written to the workspace and a vector was created with the filtered data at the sampling frequency. This data could then be written out and played as an audio signal for verification testing.
Figure 5: 5-band equalizer block diagram
Results
After the filtering process was complete, the Fourier Transform of the input and output signal was taken, producing plots of the normalized magnitude and the corresponding frequencies. By comparing the pre-filtered signal in Figure 6, with the post-filtered signal in Figure 7, a visual method for confirming the success of this equalizer design was obtained. The post filtered signal shows the equalized signal that used the gain inputs from Table 1. These increases in magnitude across the signal show that the signal was altered successfully.
Figure 6: FFT pre-filtered signal with normalized magnitude
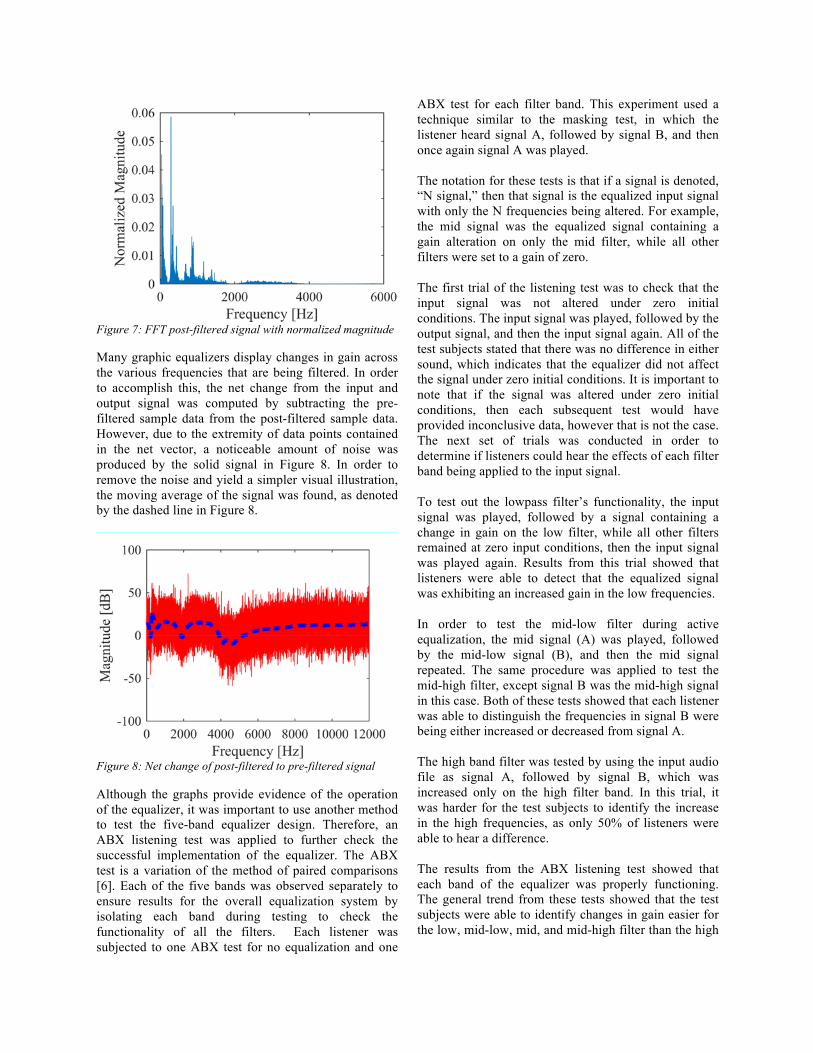
Figure 7: FFT post-filtered signal with normalized magnitude
Many graphic equalizers display changes in gain across the various frequencies that are being filtered. In order to accomplish this, the net change from the input and output signal was computed by subtracting the pre-filtered sample data from the post-filtered sample data. However, due to the extremity of data points contained in the net vector, a noticeable amount of noise was produced by the solid signal in Figure 8. In order to remove the noise and yield a simpler visual illustration, the moving average of the signal was found, as denoted by the dashed line in Figure 8.
Figure 8: Net change of post-filtered to pre-filtered signal
Although the graphs provide evidence of the operation of the equalizer, it was important to use another method to test the five-band equalizer design. Therefore, an ABX listening test was applied to further check the successful implementation of the equalizer. The ABX test is a variation of the method of paired comparisons [6]. Each of the five bands was observed separately to ensure results for the overall equalization system by isolating each band during testing to check the functionality of all the filters. Each listener was subjected to one ABX test for no equalization and one
ABX test for each filter band. This experiment used a technique similar to the masking test, in which the listener heard signal A, followed by signal B, and then once again signal A was played. The notation for these tests is that if a signal is denoted, “N signal,” then that signal is the equalized input signal with only the N frequencies being altered. For example, the mid signal was the equalized signal containing a gain alteration on only the mid filter, while all other filters were set to a gain of zero. The first trial of the listening test was to check that the input signal was not altered under zero initial conditions. The input signal was played, followed by the output signal, and then the input signal again. All of the test subjects stated that there was no difference in either sound, which indicates that the equalizer did not affect the signal under zero initial conditions. It is important to note that if the signal was altered under zero initial conditions, then each subsequent test would have provided inconclusive data, however that is not the case. The next set of trials was conducted in order to determine if listeners could hear the effects of each filter band being applied to the input signal. To test out the lowpass filter’s functionality, the input signal was played, followed by a signal containing a change in gain on the low filter, while all other filters remained at zero input conditions, then the input signal was played again. Results from this trial showed that listeners were able to detect that the equalized signal was exhibiting an increased gain in the low frequencies. In order to test the mid-low filter during active equalization, the mid signal (A) was played, followed by the mid-low signal (B), and then the mid signal repeated. The same procedure was applied to test the mid-high filter, except signal B was the mid-high signal in this case. Both of these tests showed that each listener was able to distinguish the frequencies in signal B were being either increased or decreased from signal A. The high band filter was tested by using the input audio file as signal A, followed by signal B, which was increased only on the high filter band. In this trial, it was harder for the test subjects to identify the increase in the high frequencies, as only 50% of listeners were able to hear a difference. The results from the ABX listening test showed that each band of the equalizer was properly functioning. The general trend from these tests showed that the test subjects were able to identify changes in gain easier for the low, mid-low, mid, and mid-high filter than the high
filter. This can be attributed to the fact that higher frequencies are harder to distinguish than the lows.
Discussion
An audio equalizer is an effective way to manipulate and improve the quality of an input signal. There are many methods that can be used in order to improve the quality of a signal in MATLAB and Simulink. For this research, the Butterworth filter was utilized in order to reduce any interference created in the processing of signals across multiple bandwidths. The result of filtering an input signal is an uninterrupted signal that improves upon the sound quality of the input. Signals that are subject to noise, phase shifts, and frequency interference will often manipulate the signal in such a way that it is difficult to process or hear. Graphical methods are useful in providing a visual way to observe the characteristics of a signal. MATLAB and Simulink have proved to be extremely useful tools for digital signal processing. The methods applied in this paper can be implemented to build customized equalizers using the various properties and filter types with the Butterworth syntax. Equalizers are an essential component of communications and sound systems because of the ability to improve sound quality and drain out miscellaneous noise. This work presents the assessment instruments and the guidelines used to develop an audio equalizer in MATLAB and Simulink. It is expected that this work could be used to guide readers in future exploration of applying audio equalization in these programs.
References
1. Dick Blanford, John Parr. Introduction to
Digital Signal Processing. First Edition. Upper Saddle River: Pearson, 2013. Print.
2. John G. Proakis, Dimitris G. Manolakis. Digital Signal Processing: Principles, Algorithms, and Applications. Fourth Edition. Upper Saddle River: Pearson, 2007. Print
3. College of Saint Benedict & Saint Johns University. 5 March 2016. <http://www.physics.csbsju.edu/217/digital_filter.pdf>
4. Mathworks. 25 Feb 2016. <http://www.mathworks.com/help/signal/ref/butter.html>
5. Richard Oliver, Jean-Marc Jot, “Efficient Multi-Band Digital Audio Graphic Equalizer with Accurate Frequency Response Control,” AES 139th Convention (2015).
6. W.A. Munson and M.B. Gardner, “Standardizing auditory tests,” The Journal of the Acoustical Society of America 22 (1950) 675.