Embed Size (px)
Citation preview
Linköping University | Department of Computer and Information ScienceBachelor’s Thesis, 16 ECTS | Computer Engineering
Spring 2018 | LIU-IDA/LITH-EX-G–18/003–SE
Implementation of a Water FlowSensor Node and EnergyEvaluation of 2G TransmissionStrategies
Johan Levinsson
Supervisor: Ahmed RezineExaminer: Mikael Asplund
UpphovsrättDetta dokument hålls tillgängligt på Internet – eller dess framtida ersättare –under 25 år från publiceringsdatum under förutsättning att inga extraordinäraomständigheter upps tår. Tillgång till dokumentet innebär tillstånd för var ochen att läsa, ladda ner, skriva ut enstaka kopior för enskilt bruk och att användadet oförändrat för ickekommersiell forskning och för undervisning. Överföringav upphovsrätten vid en senare tidpunkt kan inte upphäva detta tillstånd. Allannan användning av dokumentet kräver upphovsmannens medgivande. För attgarantera äktheten, säkerheten och tillgängligheten finns lösningar av tekniskoch administrativ art. Upphovsmannens ideella rätt innefa ttar rätt att blinämnd som upphovsman i den omfattning som god sed kräver vid användningav dokumentet på ovan beskrivna sätt samt skydd mot att dokumentet ändraseller presenteras i sådan form eller i sådant sammanhang som är kränkandeför upphovsmannens litterära eller konstnärliga anseende eller egenart. Förytterligare information om Linköping University Electronic Press se förlagetshemsida http://www.ep.liu.se/.
CopyrightThe publishers will keep this document online on the Internet – or its possiblereplacement – for a period of 25 years starting from the date of publication bar-ring exceptional circumstances. The online availability of the document impliespermanent permission for anyone to read, to download, or to print out singlecopies for his/hers own use and to use it unchanged for non -commercial researchand educational purpose. Subsequent transfers of copyright cannot revoke thispermission. All other uses of the document are conditional upon the consentof the copyright owner. The publisher has taken technical and administrativemeasures to assure authenticity, security and accessibility. According to intel-lectual property law the author has the right to be mentioned when his/herwork is accessed as desc ribed above and to be protected against infringement.For additional information about the Linköping University Electronic Press andits procedures for publication and for assurance of document integrity, pleaserefer to its www home page: http://www.ep.liu.se/.
c© Johan Levinsson
ii
AbstractIn this report, the design choices made during the making of a water flow mea-suring sensor node are described and discussed to various extents. The node isto ultimately be deployed in South Sudan to monitor mini-water yards managedby the International Aid Services. A design using a hall effect water flow sensor,a microcontroller and a GSM modem is presented. Various lengths of SMS andHTTP messages are sent and the current signature they produce are comparedto find out which transmission strategy is the most energy conservative. It isconcluded that for a constant data volume, sending it in as few messages aspossible is beneficial in terms of saving energy. It is also found that for shortmessages, SMS seems to be cheaper in energy compared to HTTP and the oppo-site is true for bigger messages. Avoiding actuators altogether has the potentialto be beneficial in terms of battery life for a sensor node.
iii
AcknowledgementsI’d like to thank my examiner Mikael Asplund and my supervisor Ahmed Rezinefor solid input. I’d also like to thank my friends at Etteplan, Erica Dahlberg,Lars Karlsson and Samuel Zetterlund for making this possible and providingneeded hardware, tools and discussion throughout the process. Last, thanks toGitHub user NicoHood for creating and sharing good libraries for arduino.
iv

v
Contents
Abstract iii
Acknowledgements iv
Contents vi
1 Introduction 11.1 Justification . . . . . . . . . . . . . . . . . . . . . . . . . . . . . . 11.2 Purpose . . . . . . . . . . . . . . . . . . . . . . . . . . . . . . . . 11.3 Research Questions . . . . . . . . . . . . . . . . . . . . . . . . . . 21.4 International Aid Services . . . . . . . . . . . . . . . . . . . . . . 21.5 Delimitations . . . . . . . . . . . . . . . . . . . . . . . . . . . . . 31.6 Background . . . . . . . . . . . . . . . . . . . . . . . . . . . . . . 3
2 Theory 42.1 Sensor Nodes . . . . . . . . . . . . . . . . . . . . . . . . . . . . . 4
2.1.1 Quality of Service Requirements . . . . . . . . . . . . . . 42.1.2 Resource Constraints . . . . . . . . . . . . . . . . . . . . . 52.1.3 Energy Consumption for Transmitting Data . . . . . . . . 52.1.4 Energy Consumption for Receiving Data . . . . . . . . . . 52.1.5 Energy Consumption for Microcontroller . . . . . . . . . . 6
2.2 Transmission Technology . . . . . . . . . . . . . . . . . . . . . . . 62.2.1 General Packet Radio Service . . . . . . . . . . . . . . . . 62.2.2 Energy cost of GSM . . . . . . . . . . . . . . . . . . . . . 6
2.3 Related Work . . . . . . . . . . . . . . . . . . . . . . . . . . . . . 7
3 Method 93.1 Sensor Node Design . . . . . . . . . . . . . . . . . . . . . . . . . 9
3.1.1 Data Processing and Transmission . . . . . . . . . . . . . 93.1.2 SMS Commands . . . . . . . . . . . . . . . . . . . . . . . 103.1.3 Cloud Service . . . . . . . . . . . . . . . . . . . . . . . . . 10
3.2 Power Management . . . . . . . . . . . . . . . . . . . . . . . . . . 113.2.1 Frequency of Transmission . . . . . . . . . . . . . . . . . . 113.2.2 Test Setup for Overall Power Usage . . . . . . . . . . . . 123.2.3 Test Setup for Transmission Power Usage . . . . . . . . . 13
vi
4 Result 154.1 Overall Power Usage by Transmission Strategy . . . . . . . . . . 154.2 SMS Energy Consumption . . . . . . . . . . . . . . . . . . . . . . 154.3 GPRS Energy Consumption . . . . . . . . . . . . . . . . . . . . . 164.4 Idle and suspended energy usage . . . . . . . . . . . . . . . . . . 174.5 Extrapollation of Current Signatures . . . . . . . . . . . . . . . . 17
4.5.1 Comparing Bundling Strategies . . . . . . . . . . . . . . . 174.5.2 Impact of Sleep . . . . . . . . . . . . . . . . . . . . . . . . 18
5 Discussion 225.1 Method . . . . . . . . . . . . . . . . . . . . . . . . . . . . . . . . 22
5.1.1 Sensor Node Design . . . . . . . . . . . . . . . . . . . . . 225.1.2 Energy Evaluation . . . . . . . . . . . . . . . . . . . . . . 23
5.2 Result . . . . . . . . . . . . . . . . . . . . . . . . . . . . . . . . . 235.2.1 Implementation Problems . . . . . . . . . . . . . . . . . . 235.2.2 Overall Power Usage by Transmission Strategy . . . . . . 235.2.3 Power Usage for Communication . . . . . . . . . . . . . . 245.2.4 HTTP for Sensor Nodes . . . . . . . . . . . . . . . . . . . 255.2.5 Tradeoffs in Energy Savings . . . . . . . . . . . . . . . . . 25
5.3 Answering the research questions . . . . . . . . . . . . . . . . . . 265.4 The work in a wider context . . . . . . . . . . . . . . . . . . . . . 26
6 Conclusions 27
References 28
vii
Chapter 1
Introduction
1.1 JustificationIn this report, difficulties with surveillance of a Mini-Water Yard are adressed.A Mini-Water Yard is a solar powered structure which pumps up ground waterand stores it in a large container. This water is made available for the personaluse of the local residents. Maintenance, or periodical visits of geographicallydispersed water yards can be both tedious and expensive. In South Sudan, thereare a number of Mini-Water Yards that do exist are spread out far away fromeach other around South Sudan. If the attributes that are to be observed can besent from the station to the maintenance personnel, the frequency of requiredmaintenance visits can be reduced as the need for the maintenance personnelto travel to the station can be elminated or reduced. To gather informationabout the extent to which the mini water yards are utilized, one might observethe volume of outbound water. The volume of water going out does not onlygive information regarding the normal utilization of the tower, anomalies in thiswater flow could indicate the need for a service visit.
1.2 PurposeThe aim of this thesis is to design and implement a Sensor Node for monitoringthe water usage of yards. A sensor node is a small computer with the purposeof forwarding information read from its sensor or sensors to a server or cloudservice. What this does is that it lets a remote party, such as a maintenanceworker to gain information about the environmental conditions of the node,depending on what sensors the node utilizes. This relieves the maintenancepersonnel of having to travel to the node to observe whatever the node’s sensoris there to measure.
Designing a sensor node requires a set of choices to be made, all the wayfrom the sensor to the communications medium. In this report, the designchoices made for this particular sensor node will be discussed. However, there
1
will also be some suggestions provided regarding sensor nodes in general in othercontexts. For example if a similar sensor node was designed for use in Sweden,one might favourably select another communication technology.
1.3 Research QuestionsDesigning the sensor node normally has to be done according to the require-ment specification. In this particular case, there was no finalized requirementspecification. However, there was a rough outlining of a requirement specifi-cation. This document stated that the node should be able to operate for asensible amount of days (assumed to be somewhere around 5 to 7), the nodeshall send data every hour. It also would have the node being able to receivecommands such as Restart, or Shutdown, in case the node malfunctioned. Sincethe requirement specification oultine had very little information about thingsthat were not directly communications related, and the purpose of this thesis isto investigate communications strategies, it should be sufficient for designing anode that is able to satisfy the research questions and the aim of the thesis.
Proceeding from our requirement specification, design choices should bemade to support an autonomous node. That is a node which has the abil-ity to recharge more energy than it has to expend so that it has a net zero orpositive battery charge. The research questions aim to achieve this mainly inregards to battery life. The nodes should be able to run on their battery foras long as it could reasonably take inbetween two opportunities for charging.Ideally, for a node that is run by solar power, this would be the length of anight. However because of more unpredicatble factors such as clouds, this timeshould be a bit longer. A few days is deemed a reasonable assumption.
RQ1: Can a sensor node be designed so that it meets it’s requirements whilealso being able to operate autonomously?
RQ2: To what extent does the requirement of communication affect longevityof the node?
To answer RQ1, a prototype sensor node that fills this purpose will be designedand implemented. The energy it needs to operate will be compared to it’sbattery capacity.
To answer RQ2, energy measurements during various transmission strategieswill be compared to each other. The aim of this research question is to obtain anoverview of a sensor node communicating as sparsely as possible while fulfillingit’s purpose.
1.4 International Aid ServicesThe International Aid Services1 (IAS) is an international, non-governmentalaid organization founded in 1989. They are largely dependent on donations and
1http://www.ias-intl.org/
2
partnerships with orgnazitions and corportations. One of the areas in whichthey conduct work relevant to this thesis is water and sanitation, the othersbeing education, agriculture, evangelism, etc. The IAS mostly operate withineastern Africa. In South Sudan, the IAS has constructed autonomous watertowers, which they refer to as Mini-Water Yards. A Mini-Water Yard is awater tower and ground water pump which is solar powered and operates largelyautonomously. The IAS requested for a way to be able to observe the utilizationof these water yards. Some of these yards are located in areas which servicepersonnel can not easily reach.
1.5 DelimitationsBecause of limitations regarding the network availability in South Sudan, therewere no other apparent choices for transmission technologies. The design in thisreport instead utilizes 2G. Seeing as 2G is widely being shut down in devel-oped countries, future projects should consider the use of other communicationstechnologies.
In the common application areas of sensor nodes, conserving energy is ofgreat importance and a major challenge as the nodes in the normal case run onbatteries. This becomes less critical as the location in which we place the nodeshave access to electricity during daytime. This is still relevant to some extentseeing as a power management solution has to take into consideration at thevery least nighttime, but also extended cloudy periods. Therefore we can notfully rely on the solar panels and require some form of battery management.
1.6 BackgroundIt should be noted that there are similar products2 on the market by the timethis report was written. However, these were not designed in the spirit of asensor node as they were in comparison very expensive to deploy. These alsoran on common household batteries, which is suboptimal since there is a solarpanel available. Therefore it is likely that the sensor node design in this reportis better suited to our context.
2https://sonsetlink.org/?page_id=85
3
Chapter 2
Theory
This chapter will serve the purpose of providing an all round understanding ofsensor nodes in general so that the context of the thesis can be better under-stood. It also provides ground for the decision to focus on the transmitting datapart of sensor nodes for this thesis.
2.1 Sensor NodesThe backbone component of a Wireless Sensor Network (WSN), the SensorNode is as Akyildiz et al. [1] describes, a unit that has one or several sensors,some form of data processing and the ability to send this information onward.This enables the node to be in a location of interest, while whoever reads theinformation can be wherever he or she pleases. A sensor node also requiresa power source. When available, this could be grid power. Some sensor nodesutilize electricity generated on location. However, most commonly a sensor nodewill run on batteries.
Respecting that the nodes are heterogenous, Akyildiz et al. [1] (2002) clari-fies several trade offs that have to be accounted for when designing the nodes.As in any design process, the trade offs need to be taken into considerationfor the particular design in question. These trade offs are as explained in thesections below.
2.1.1 Quality of Service RequirementsGungor et al. [2] write that Quality of Service (QoS) refers to how accurate thesensor nodes’ data transmissions to the server are, compared to the reality ofwhat the sensor nodes are meant to observe. In other words, the accuracy ofthe values reported to the server or cloud service.
The time it takes beetwen that the sensor node does a sensor reading, andthat the processed data reaches the server or cloud service, are also part of QoSas explained by Gungor et al. [2].
4
2.1.2 Resource ConstraintsEach node in a sensor network should have a low hardware cost so that manyof them can be deployed. Theft or destruction of a few nodes should be ex-pected, more so depending on location of deployment, and thus not producehuge expenses. This should be taken into account when designing the nodes sothat they are cheap enough for a few of them to be replaced every once in awhile. It is true that a node which resides out of reach for curious fingers in anindoor environment does not have to be as replaceable or robust as a node thatis placed in a more volatile location.
Exposed nodes also call for a robust build, more so depending on whatconditions the nodes are placed under. A node placed close to water needs tobe water resistant. A human reachable node needs to be low in theft appeal, ifit is not, it needs to be tough to detach and steal. A node reachable by variousanimals should be sturdy enough to have them do whatever harmful actionthey are capable of to it. Gungor [2] et al. stress that every component of anIndustrial Wireless Sensor Network can be utilized to save energy, and that itis important for them to do so in order to achieve the longest possible batterylifetime without violating the QoS constraints of the requirement specification.
2.1.3 Energy Consumption for Transmitting DataWhile a low energy consumption is always desireable, the nature of the WSNdetermines the extent as to how energy conservative the nodes are required tobe. If the node does not have access to a supply of electricity such as a grid-tieor a local renewable power source, it is going to be run on batteries. This shouldbe thought of as a common occurance for wireless sensor networks.
A battery driven sensor node has to be designed in a way so that it can doenough good during the discharge time of the battery to be worthwhile for thepurpose of the sensor nodes. This is naturally not as critical for a non-batterypowered node.
Akyildiz et al. [1] explain that generally, the cost of data processing is rela-tively cheap in terms of energy compared to that of communication. Therefore,communicating as little as possible is beneficial in terms of convserving energy.Because of the difference in energy cost for data transmission and data pro-cessing, something to consider is that it should be worthwhile to move workfrom the communication module to data processing. For example, if a node hasmultiple sensor reads for a period of time, bundling them by the end of thattime rather than sending them continuously could save a lot of energy and thusbattery lifetime, especially if the transmission hardware is put to sleep duringthis time. This method is known as duty cycling.
2.1.4 Energy Consumption for Receiving DataAbdeleel et al. [3] show that both receiving and transmitting radio signals arerelatively energy consuming actions compared to utilizing sensors and processing
5
data. A sensor node per definition has to transmit data. However, by the samedefinition, it does not need to receive any data. Because receiving data alsocosts a lot of energy, it is beneficial to avoid actuators as much as possible andthereby avoid the need for the node to receive data. Not only does the actualreceiving of data cost energy, if the node expects to never receive data, it canknow exactly when it’s transmission module needs to be used since the node isthe only thing that actually utilizes it. When the node has access to the entirework schedule for the transmission module, the node can suspend it wheneverthere is a block of spare time, in order to save energy.
2.1.5 Energy Consumption for MicrocontrollerAs for selecting the microcontroller to use, Lorentzen [4] explains that a micro-controller used for such a system should feature a sleep mode. A power conser-vative design alongside a battery that is charged on location could produce anautonomous or close to autonomous sensor node. An autonomous sensor nodeis a sensor node with battery life longer than the time it has to run inbetweenrecharges.
2.2 Transmission TechnologyAs previously stated, the energy cost of the transmission devices are expensivecompared to both sensing and data processing. While selecting transmissiontechnology might be of importance in general when designing a sensor node, ageographical area, or circumstances of the nodes deployment can be limiting inthe possible choices. GSM can be a solid candidate for transmission technologyeven when there are other available alternatives as it has its advantages, Perrucciet al. [12] (2009) found text messages sent by 2G to be cheaper in energy costthan messages with the same data sent by 3G.
2.2.1 General Packet Radio ServiceThe General Packet Radio Service or GPRS, is a packet switched data servicethat runs on 2G or 3G, which is what currently exists in Sudan. It is anolder technology dating back to the year 2000, and thus is limited by the datarates. The small data volumes that the sensor node in this report has to workwith, being at most a few hundred bytes, does not pose a problem for GPRSutilization. Essentially, GPRS allows sending general internet packets throughthe 2G network.
2.2.2 Energy cost of GSMGSM draws different levels of power depending on what level of utilization it iscurrently under. Carrol et al. [5] distinguishes two low-use states, suspendedand idle. A suspended device is a device that is in a state in which it periodically
6
makes sure it is connected to it’s network but performs no other task. This isto make sure that the particular device can receive text messages or calls butaims to save power. An idle device is a device that is awake, but not performingany task. Carrol el. al show that an idle GSM device draws almost double thepower compared to that of a suspended device.
Intuitively, Perrucci et al. [12] show that the energy cost of a text message isproportional to the length of the message. Therefore, if possible, the outboundvolume of data should be reduced by the node rather than the end server.Sending messages has energy cost that is not related to the actual data sent,there is a ramp up energy cost and a tail cost. When a message is about tobe sent, the energy that the device draws increases for a short while before anyactual information is transmitted. This is known as ramp up energy cost. Aftera message has been sent, the energy cost remains at sending-levels for a shortwhile before retunring to idle energy usage. This is known as tail energy cost.Therefore, bundling data as much as possible so that as much data as possibleis sent while sharing the expenses of just one tail and one ramp should be agood strategy.
2.3 Related WorkThis section will serve the purpose of providing insight as to what other similarprojects have been made and how they differ from the one in this report. Whatfollows is a summary of those systems.
Wang et al. [7] describe a Wireless Sensor Network based water monitoringsystem with the focus on water quality rather than just water flow. The Mini-Water Yards should already provide clean enough drinking water. However,adding water quality control to the Mini Water Yards, or to similar projectsmight be a good decision in the case of anomalies.
A similar node, which measures water flow and communicate using SMSmessages which is described by Mahjoubi et al. [8]. They use a different platformfor the microcontroller, they do use GSM but different hardware. They also tryout various communications technologies but conclude that GSM reduces theenergy cost the most.
A water monitoring sensor network implemented in northern Australia isdescribed in the article by Le Dinh et al. [9]. It describes sensor nodes thatamongst other things measure water flow similarly to the sensor node describedin this report. It is aimed more towards monitoring the system when it isdeployed. The report is extremely informative in regards to deploying a sensornetwork or a node in a practical sense such as how a lot of GPRS modules tendto malfunction after an extended period of time connected to the network.
An enviromental monitoring wireless sensor network called SoilWeather isimplemented by Kotamäki et al. [10]. Its main focus is not water flow, butrather air properties. It is also a more practical report, for example it detailsmaintenance of the system. It is a good resource for practical purposes indeploying and maintaining an outdoors WSN. Unlike a lot of sensor network
7
reports, since this was implemented in Finland, this deals with problems thatoccur with freezing temperatures, such as sensor inaccuracies.
Jiang et al. [11] have designed a WSN for water monitoring. Unlike thesensor of this report, each node do not have a 2G module each. Instead, a set ofnodes are close to a base station which has a 2G module utilizing GPRS. Thenodes communicate to the base stations via the ZigBee protocol.
8
Chapter 3
Method
This chapter provides an overview of the system and then an in-depth look atthe design choices and implementation of the node. The first half will adressRQ1, it’s purpose is to explain the design of the sensor node. The second halfwill adress RQ2 and thus aims to evaluate the impact on power consumption thechosen strategy to communicate will have. Two prototypes will be constructed,each using a microcontroller, a hall sensor and a GSM module.
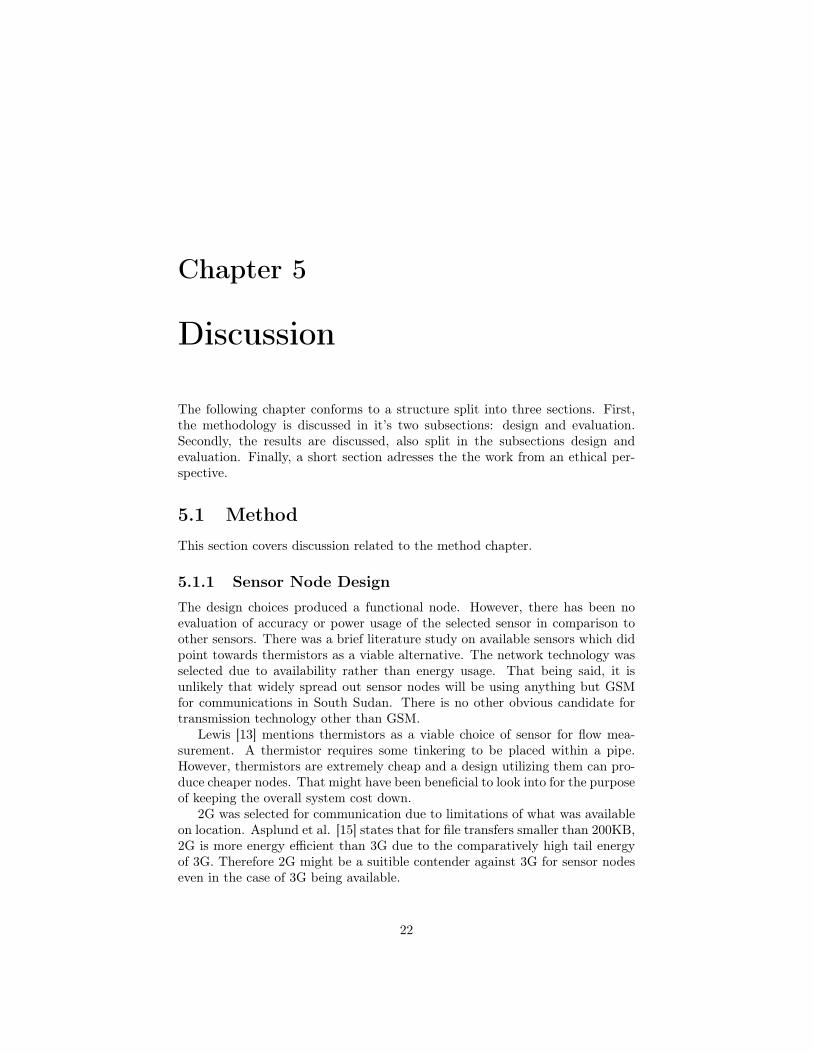
3.1 Sensor Node DesignAn overview of the system can be found in Figure 3.1. The gray border labeledNode signifies the actual sensor node and thus what is adressed in this report.Arrows drawn in between boxes are information transferred between those en-tities. The leftmost box indicates the water flow sensor, which outputs to themicrocontroller. The microcontroller in turn translates the sensor output tohuman readable data. That data is sent via the GSM modem to a cloud service.There is also a box labeled SMS commands. SMS commands can be sent tothe GSM modem, they are then parsed by the microcontroller and a responseis sent back to the phone that sent the command.
3.1.1 Data Processing and TransmissionTo measure water volume from a hall sensor output, the following formula isused. pulseCount is the amount of pulses the hall sensor has produced, Q is afactor for the sensor which is used. The prototype uses a 7.5Q sensor. Q signi-fies the amount of Pulses Per Second produced per Litres Per Minute. PulsesPer Minute * 60 is Pulses Per Second. 60Q is Pulses Per Litre. Therefore,pulseCount / Pulses Per Litre gives the volume in litres.
V = pulseCount/(60Q)
9
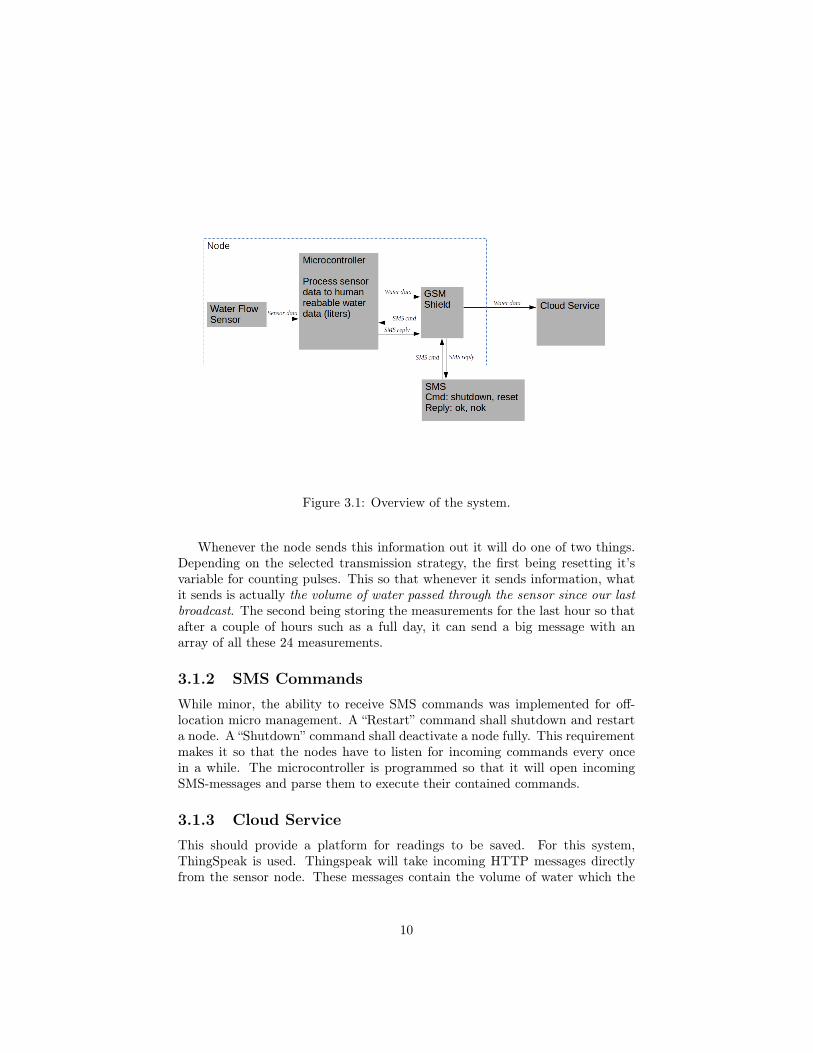
Figure 3.1: Overview of the system.
Whenever the node sends this information out it will do one of two things.Depending on the selected transmission strategy, the first being resetting it’svariable for counting pulses. This so that whenever it sends information, whatit sends is actually the volume of water passed through the sensor since our lastbroadcast. The second being storing the measurements for the last hour so thatafter a couple of hours such as a full day, it can send a big message with anarray of all these 24 measurements.
3.1.2 SMS CommandsWhile minor, the ability to receive SMS commands was implemented for off-location micro management. A “Restart” command shall shutdown and restarta node. A “Shutdown” command shall deactivate a node fully. This requirementmakes it so that the nodes have to listen for incoming commands every oncein a while. The microcontroller is programmed so that it will open incomingSMS-messages and parse them to execute their contained commands.
3.1.3 Cloud ServiceThis should provide a platform for readings to be saved. For this system,ThingSpeak is used. Thingspeak will take incoming HTTP messages directlyfrom the sensor node. These messages contain the volume of water which the
10
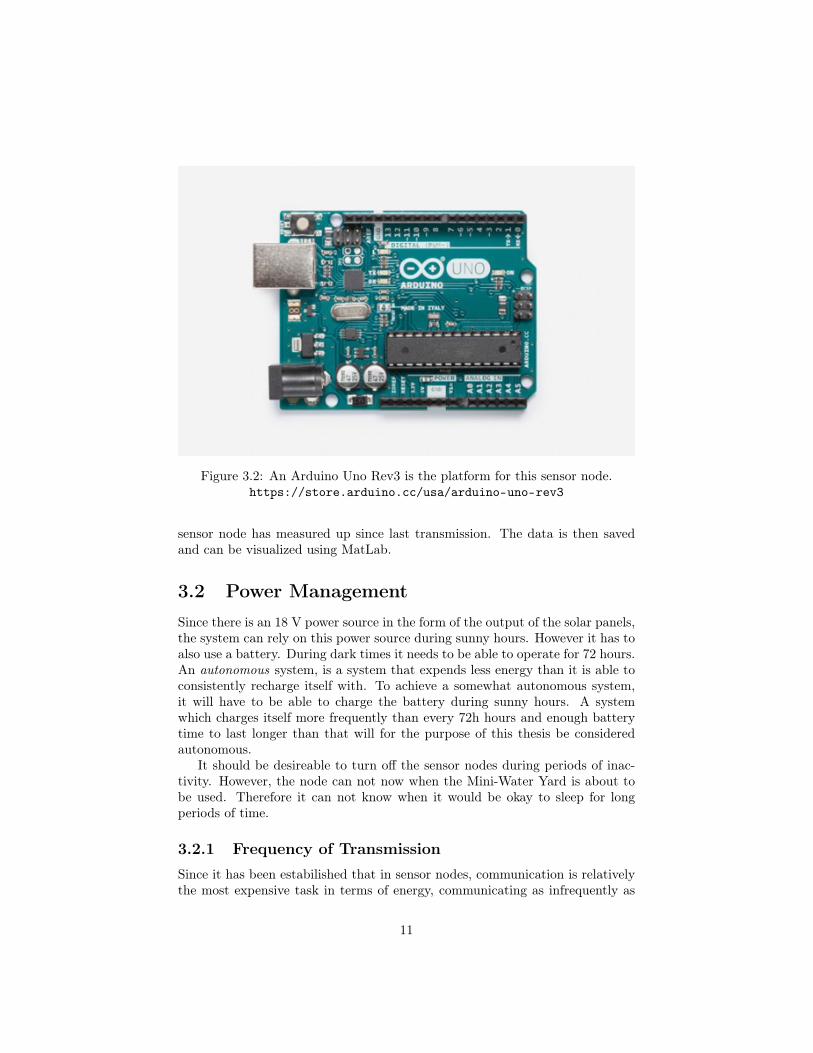
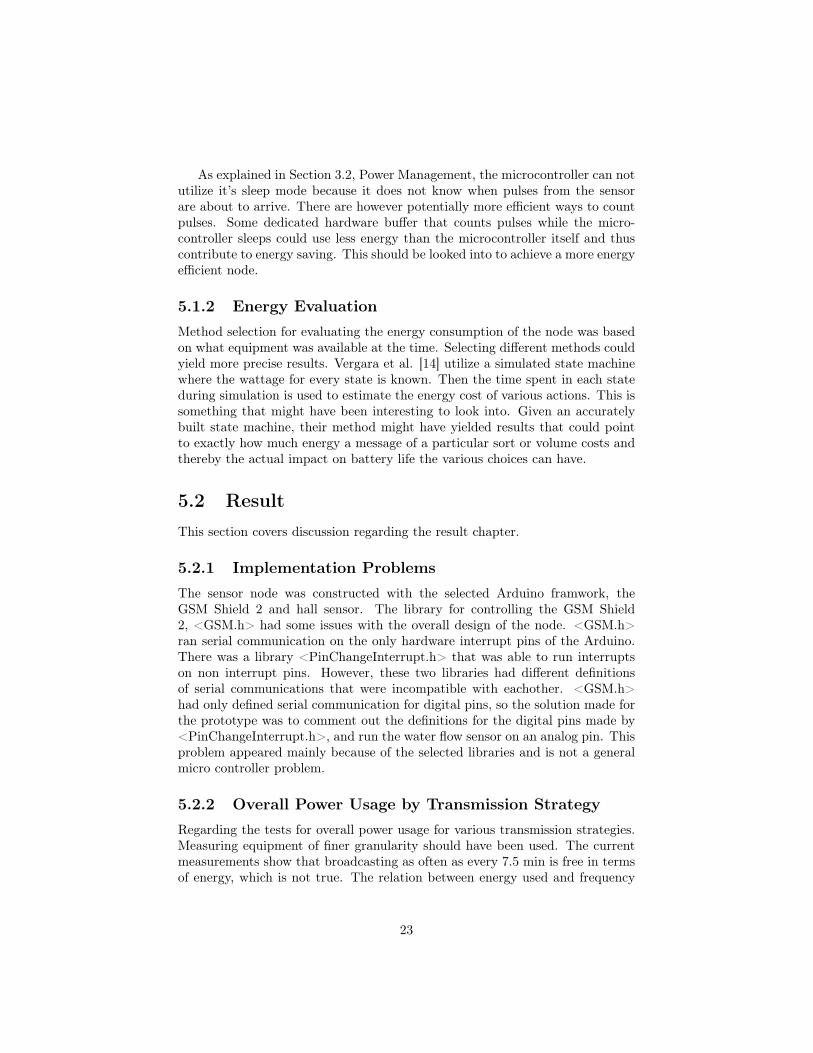
Figure 3.2: An Arduino Uno Rev3 is the platform for this sensor node.https://store.arduino.cc/usa/arduino-uno-rev3
sensor node has measured up since last transmission. The data is then savedand can be visualized using MatLab.
3.2 Power ManagementSince there is an 18 V power source in the form of the output of the solar panels,the system can rely on this power source during sunny hours. However it has toalso use a battery. During dark times it needs to be able to operate for 72 hours.An autonomous system, is a system that expends less energy than it is able toconsistently recharge itself with. To achieve a somewhat autonomous system,it will have to be able to charge the battery during sunny hours. A systemwhich charges itself more frequently than every 72h hours and enough batterytime to last longer than that will for the purpose of this thesis be consideredautonomous.
It should be desireable to turn off the sensor nodes during periods of inac-tivity. However, the node can not now when the Mini-Water Yard is about tobe used. Therefore it can not know when it would be okay to sleep for longperiods of time.
3.2.1 Frequency of TransmissionSince it has been estabilished that in sensor nodes, communication is relativelythe most expensive task in terms of energy, communicating as infrequently as
11
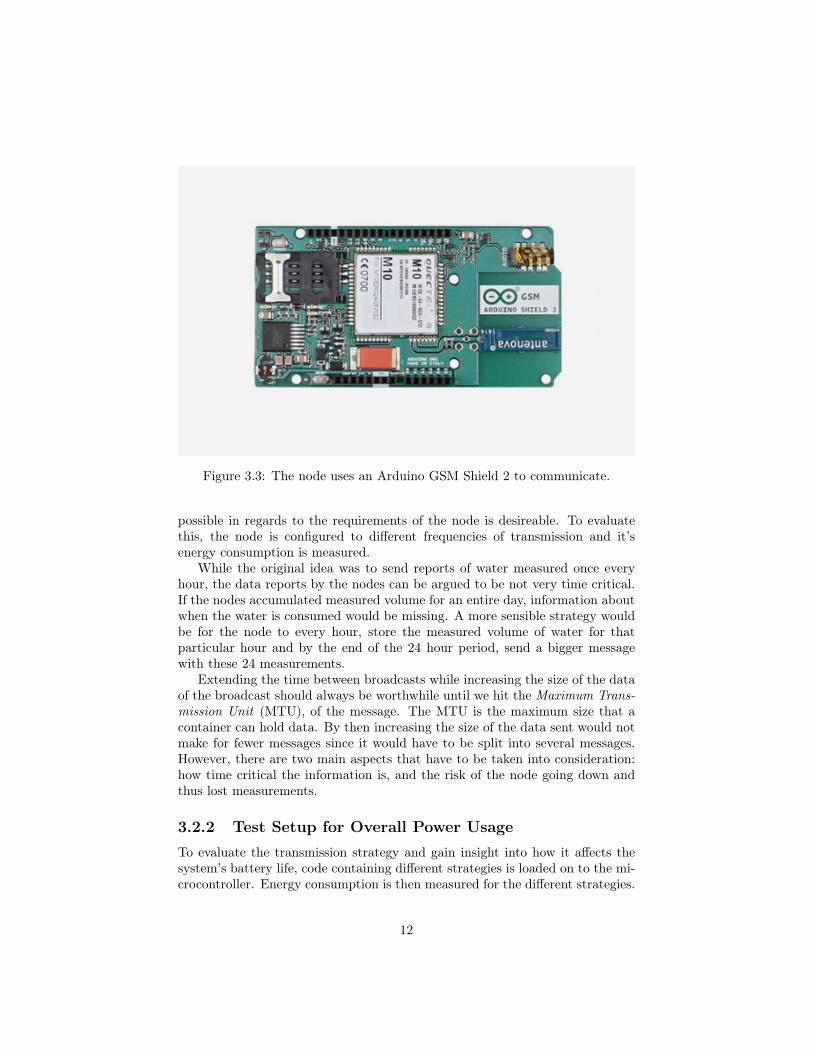
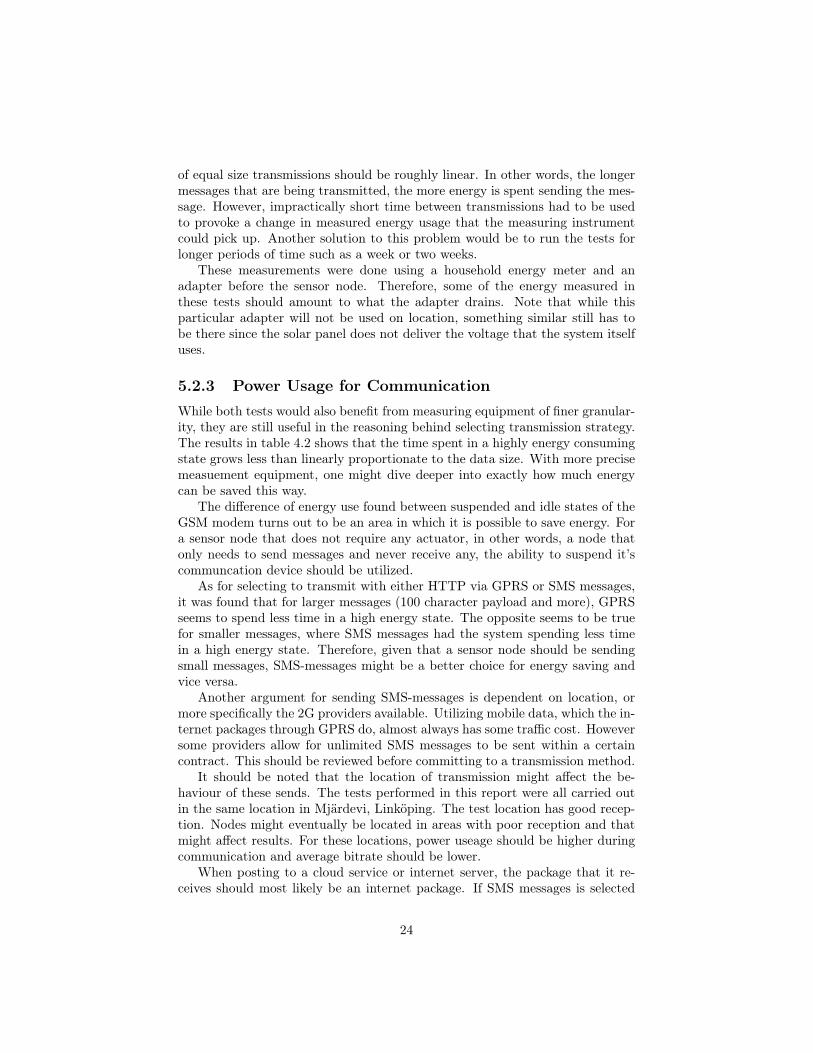
Figure 3.3: The node uses an Arduino GSM Shield 2 to communicate.
possible in regards to the requirements of the node is desireable. To evaluatethis, the node is configured to different frequencies of transmission and it’senergy consumption is measured.
While the original idea was to send reports of water measured once everyhour, the data reports by the nodes can be argued to be not very time critical.If the nodes accumulated measured volume for an entire day, information aboutwhen the water is consumed would be missing. A more sensible strategy wouldbe for the node to every hour, store the measured volume of water for thatparticular hour and by the end of the 24 hour period, send a bigger messagewith these 24 measurements.
Extending the time between broadcasts while increasing the size of the dataof the broadcast should always be worthwhile until we hit the Maximum Trans-mission Unit (MTU), of the message. The MTU is the maximum size that acontainer can hold data. By then increasing the size of the data sent would notmake for fewer messages since it would have to be split into several messages.However, there are two main aspects that have to be taken into consideration:how time critical the information is, and the risk of the node going down andthus lost measurements.
3.2.2 Test Setup for Overall Power UsageTo evaluate the transmission strategy and gain insight into how it affects thesystem’s battery life, code containing different strategies is loaded on to the mi-crocontroller. Energy consumption is then measured for the different strategies.
12
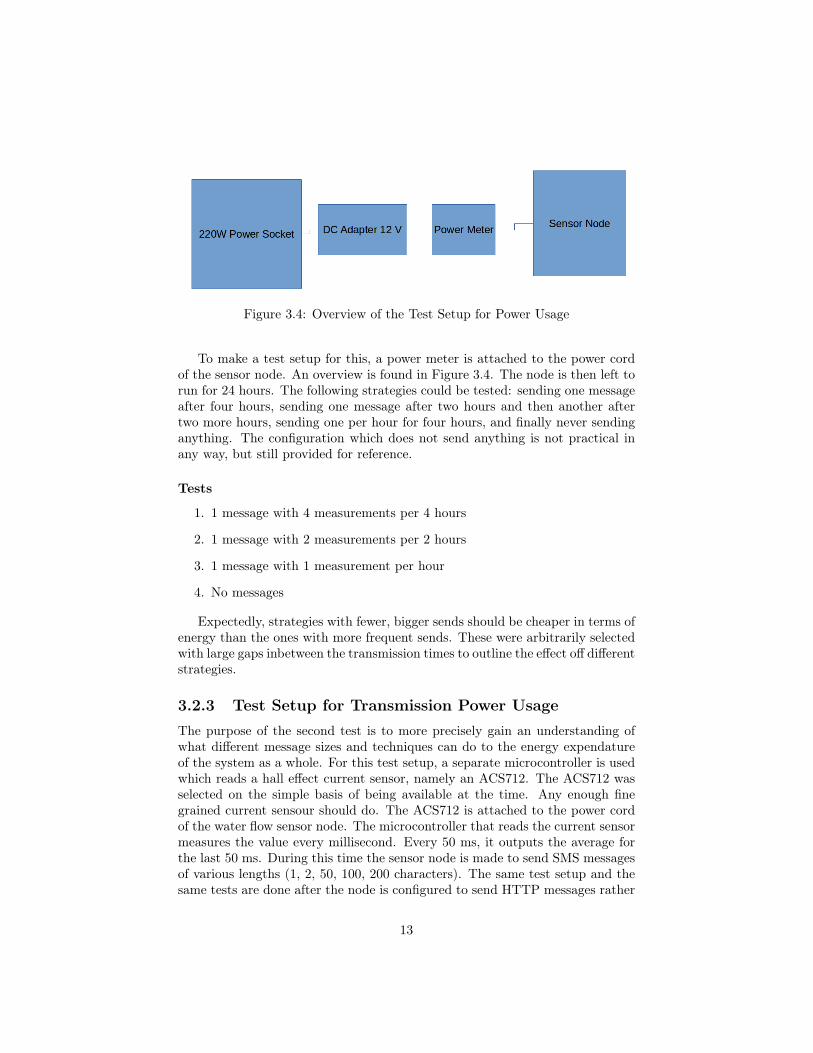
Figure 3.4: Overview of the Test Setup for Power Usage
To make a test setup for this, a power meter is attached to the power cordof the sensor node. An overview is found in Figure 3.4. The node is then left torun for 24 hours. The following strategies could be tested: sending one messageafter four hours, sending one message after two hours and then another aftertwo more hours, sending one per hour for four hours, and finally never sendinganything. The configuration which does not send anything is not practical inany way, but still provided for reference.
Tests
1. 1 message with 4 measurements per 4 hours
2. 1 message with 2 measurements per 2 hours
3. 1 message with 1 measurement per hour
4. No messages
Expectedly, strategies with fewer, bigger sends should be cheaper in terms ofenergy than the ones with more frequent sends. These were arbitrarily selectedwith large gaps inbetween the transmission times to outline the effect off differentstrategies.
3.2.3 Test Setup for Transmission Power UsageThe purpose of the second test is to more precisely gain an understanding ofwhat different message sizes and techniques can do to the energy expendatureof the system as a whole. For this test setup, a separate microcontroller is usedwhich reads a hall effect current sensor, namely an ACS712. The ACS712 wasselected on the simple basis of being available at the time. Any enough finegrained current sensour should do. The ACS712 is attached to the power cordof the water flow sensor node. The microcontroller that reads the current sensormeasures the value every millisecond. Every 50 ms, it outputs the average forthe last 50 ms. During this time the sensor node is made to send SMS messagesof various lengths (1, 2, 50, 100, 200 characters). The same test setup and thesame tests are done after the node is configured to send HTTP messages rather
13
than SMS-messages. This is to see if there is any difference in the energy costof these two techniques. Idle and suspended current is also measured with theACS712.
When the sensor node is configured to send HTTP packages across GPRS.The message sent is POST header trailed by a string of characters. This stringis set to various lengths and the tests were carried out in the same manner asthe SMS tests.
14
Chapter 4
Result
In this chapter the major steps taken in the design process are explained sothat a node can be replicated. It also presents the results from the variousenergy related measurements done on that particular design for the differenttransmission strategies.
4.1 Overall Power Usage by Transmission Strat-egy
Utilizing the test setup described in section 3.2.2, the total energy used duringeach of these 24 hour periods is measured. To achieve as equal circumstancesas possible for the test runs, no water is ran through the water flow sensor.Because of the identical result of the first four tests, more tests were conductedthat decreased the time between sends even further. In Table 4.1, the leftcolumns holds time between transmissions of the microcontroller and the rightcolumn show how much energy the system used in total for the 24 hours of thetest. The only observable effect was that when the time between transmissionwas set to 3.25 minutes or less, there was a slight increase in overall energyexpendature.
4.2 SMS Energy ConsumptionThe test setup described in section 3.2.3 is used to measure the current that thewater flow sensor node draws. The current for every output time can be seenin the figures in this section. Two distinct states should be recognized acrossevery diagram; The idle state that has the current meter at the two lowestmeasurement values and the sending state which is strictly above said values.
Leaving the the sensor node turned on and connected to the GSM networkhas the ampere meter fluctuating at 0.12 to 0.13 ampere. This is the idle stateas described in section 2.2.2.
15
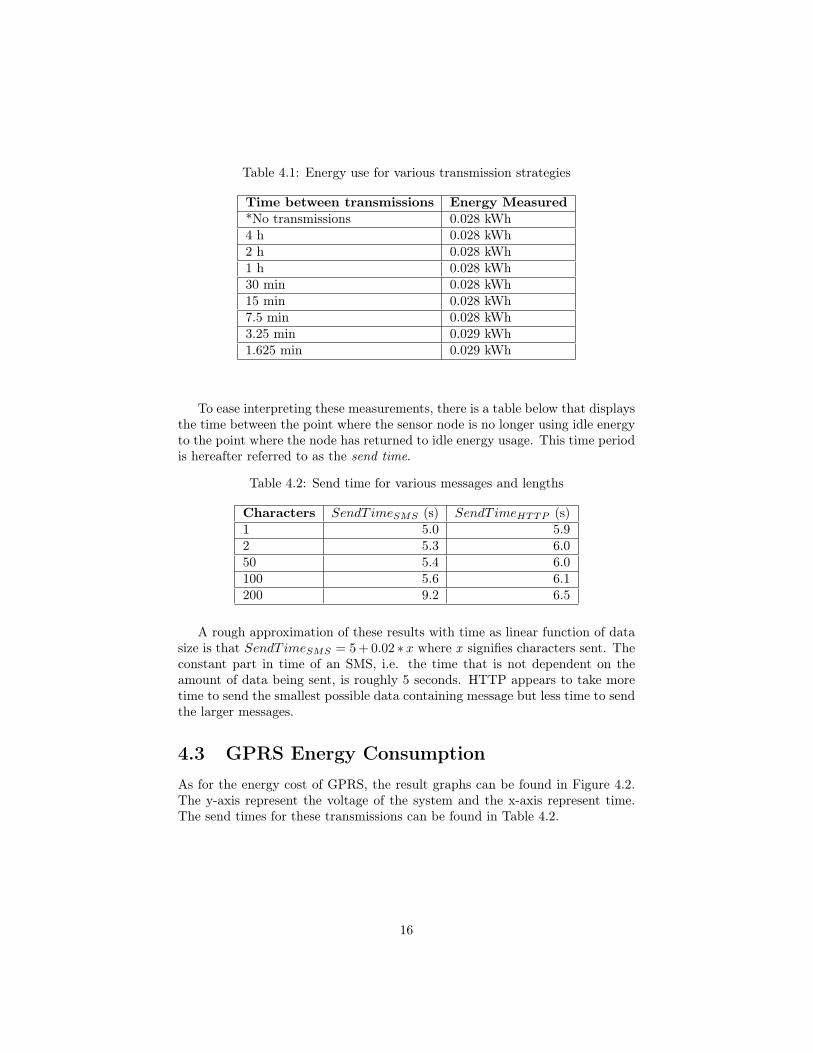
Table 4.1: Energy use for various transmission strategies
Time between transmissions Energy Measured*No transmissions 0.028 kWh4 h 0.028 kWh2 h 0.028 kWh1 h 0.028 kWh30 min 0.028 kWh15 min 0.028 kWh7.5 min 0.028 kWh3.25 min 0.029 kWh1.625 min 0.029 kWh
To ease interpreting these measurements, there is a table below that displaysthe time between the point where the sensor node is no longer using idle energyto the point where the node has returned to idle energy usage. This time periodis hereafter referred to as the send time.
Table 4.2: Send time for various messages and lengths
Characters SendT imeSMS (s) SendT imeHTTP (s)1 5.0 5.92 5.3 6.050 5.4 6.0100 5.6 6.1200 9.2 6.5
A rough approximation of these results with time as linear function of datasize is that SendT imeSMS = 5+0.02 ∗ x where x signifies characters sent. Theconstant part in time of an SMS, i.e. the time that is not dependent on theamount of data being sent, is roughly 5 seconds. HTTP appears to take moretime to send the smallest possible data containing message but less time to sendthe larger messages.
4.3 GPRS Energy ConsumptionAs for the energy cost of GPRS, the result graphs can be found in Figure 4.2.The y-axis represent the voltage of the system and the x-axis represent time.The send times for these transmissions can be found in Table 4.2.
16
Table 4.3: Idle and suspended current
State Current (mA)Suspended 115Idle 125
4.4 Idle and suspended energy usageThe following test measures current for each state described in section 2.2.2.The node is left with the GSM modem in an idle state, and then in a suspendedstate and the average current for each state is measured and can be found inTable 4.3.
4.5 Extrapollation of Current Signatures
4.5.1 Comparing Bundling StrategiesAssume that a node is to be created and it has to last 7 days without batteryrecharge while still meeting it’s requirements of communication, which is occa-sionally sending data to the server. The requirement that a node should be ableto operate for a week without recharge is translated to 168 hours.
For this example, assume we send 200 characters of measurement data every24 hours for 7 days, or 168 hours. That is 7 200 Bytes sendings, or 6.5 secondperiods averaging at about 130 mA. Note that this assumes that we use HTTPpackets to send these messages as they are more efficient than SMS for this datasize. Assume also that we have the modem fully turned on 20 seconds daily forthis send and suspend it for the remainder of the day (23h 59m 40s). This letsus divide a day into the three following time periods. Note that they sum to24h.
TSuspendedHours + TIdleHours + TSendingHours = 24
TSuspendedHours = 23 + (59/60) + (1/60 ∗ 2/3)
TIdleHours = (1/60) ∗ (1/3)− TSendingHours
TSendingHours = (1/60) ∗ (6.5/60)
Now the energy consumption of the system for a day would be all thattime multiplied by the corresponding consumption for the state the system isin during those times.
17
JDaily = (TSuspendedHours∗115mA)+(TIdleHours∗125mA)+(TSendingHours∗130mA)
JDaily ≈ 2760 mAh
JWeekly = 19320 mAh
Seeing as there are common phone batteries with 20000 mAh capacity, it issafe to say that there is an autonomous node design possible that can last for 7full days without battery recharge.
Assume that we are given the requirement that the node has to communi-cate it’s readings hourly. Now 24 different 10 second periods with the modemswitched on are required and the node needs to send 9 characters every time toreach the data size of the first scenario. This time SMS is selected due to thesmaller data size of the sending.
TSuspendedHours = 23 + (56/60)
TIdleHours = (4/60)− TSMSSendingHours
TSMSSendingHours = 24 ∗ (1/60) ∗ (5.2/60)
The energy of these follows the same pattern as for HTTP.
JDaily = (TSuspendedHours∗115mA)+(TIdleHours∗125mA)+(TSMSSendingHours∗130mA)
JDaily ≈ 2761 mAh
JWeekly = 19327 mAh
The difference is 7 mAh. While noticeable, this does not make a distinctdifference in the batteries that are available to fulfill the requirements.
4.5.2 Impact of SleepAssume that the node has to utilize actuators. This has the effect that the nodehas to constantly listen for incoming messages. In other words, the node has toalways be able to receive data and thus can not suspend it’s modem. For thisscenario, GPRS messages of 200 characters are to be sent once a day.
TIdleHours = 24− TSendingHours
18
TSendingHours = (1/60) ∗ (6.5/60)
Energy consumption is as follows.
JDaily = (TIdleHours ∗ 125 mA) + (TSendingHours ∗ 130 mA)
JDaily ≈ 3000 mAh
JWeekly = 21000 mAh
Now this scenario produces a significantly higher energy consumption. 20000mAh batteries are no longer acceptible for this sensor node.
19
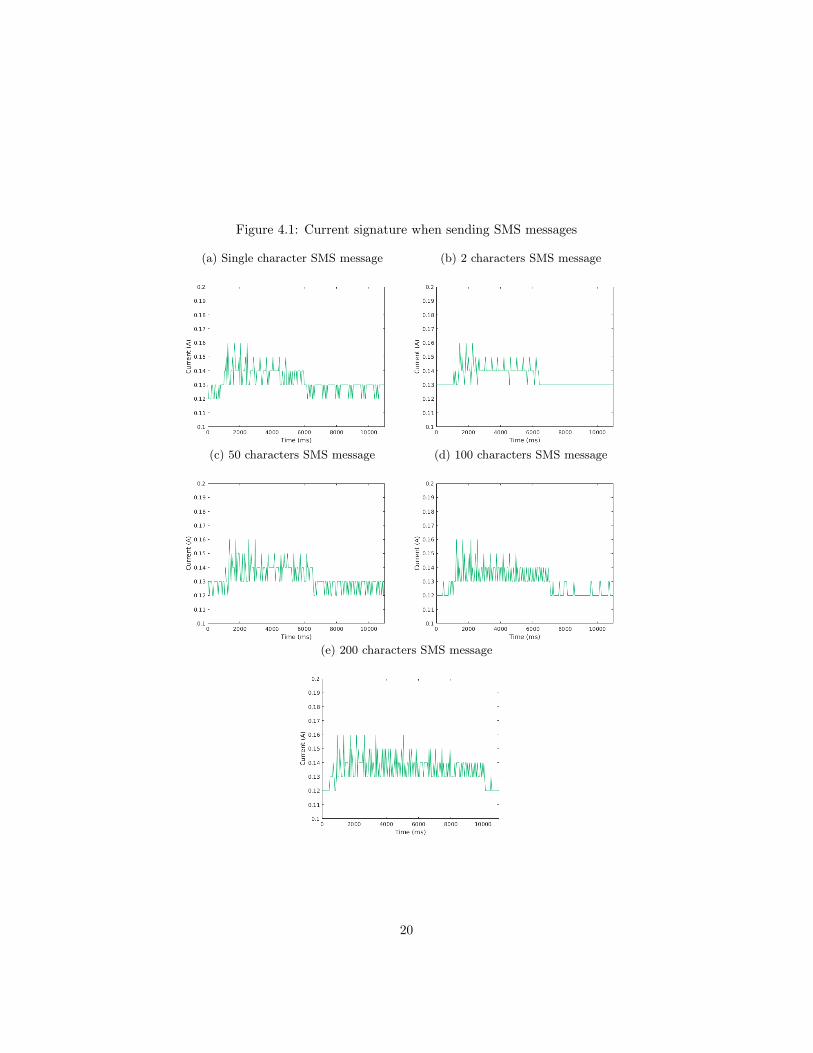
Figure 4.1: Current signature when sending SMS messages
(a) Single character SMS message (b) 2 characters SMS message
(c) 50 characters SMS message (d) 100 characters SMS message
(e) 200 characters SMS message
20
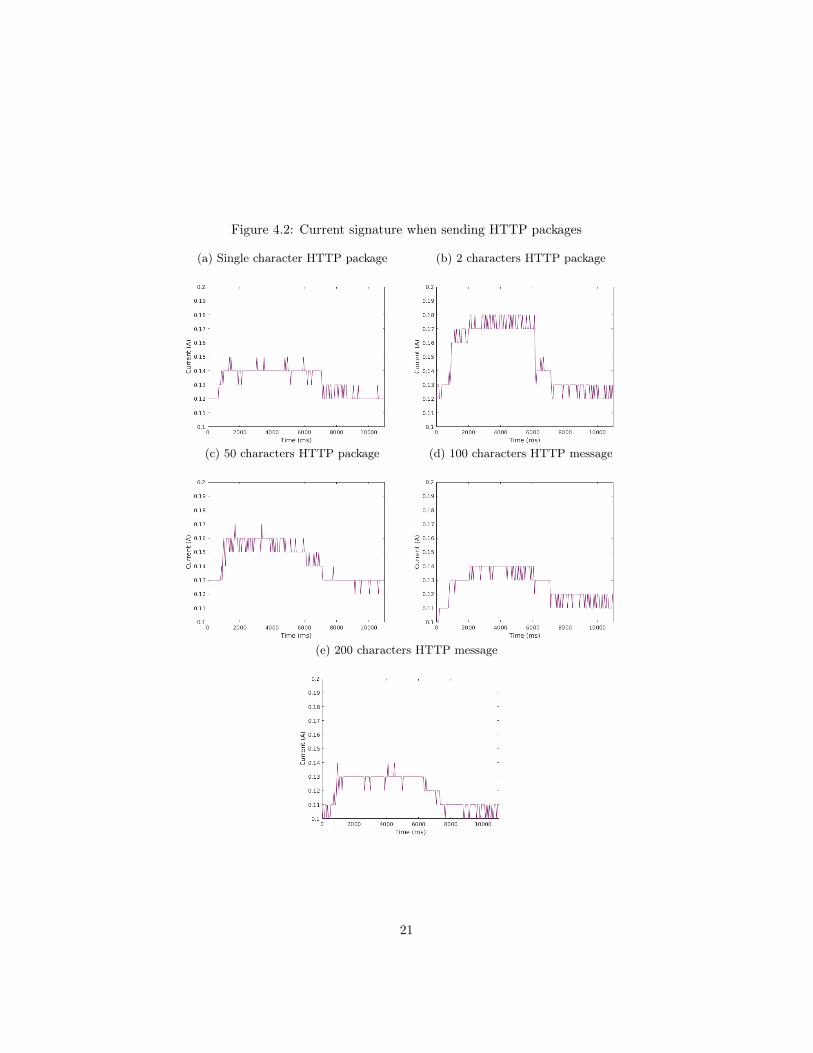
Figure 4.2: Current signature when sending HTTP packages
(a) Single character HTTP package (b) 2 characters HTTP package
(c) 50 characters HTTP package (d) 100 characters HTTP message
(e) 200 characters HTTP message
21
Chapter 5
Discussion
The following chapter conforms to a structure split into three sections. First,the methodology is discussed in it’s two subsections: design and evaluation.Secondly, the results are discussed, also split in the subsections design andevaluation. Finally, a short section adresses the the work from an ethical per-spective.
5.1 MethodThis section covers discussion related to the method chapter.
5.1.1 Sensor Node DesignThe design choices produced a functional node. However, there has been noevaluation of accuracy or power usage of the selected sensor in comparison toother sensors. There was a brief literature study on available sensors which didpoint towards thermistors as a viable alternative. The network technology wasselected due to availability rather than energy usage. That being said, it isunlikely that widely spread out sensor nodes will be using anything but GSMfor communications in South Sudan. There is no other obvious candidate fortransmission technology other than GSM.
Lewis [13] mentions thermistors as a viable choice of sensor for flow mea-surement. A thermistor requires some tinkering to be placed within a pipe.However, thermistors are extremely cheap and a design utilizing them can pro-duce cheaper nodes. That might have been beneficial to look into for the purposeof keeping the overall system cost down.
2G was selected for communication due to limitations of what was availableon location. Asplund et al. [15] states that for file transfers smaller than 200KB,2G is more energy efficient than 3G due to the comparatively high tail energyof 3G. Therefore 2G might be a suitible contender against 3G for sensor nodeseven in the case of 3G being available.
22
As explained in Section 3.2, Power Management, the microcontroller can notutilize it’s sleep mode because it does not know when pulses from the sensorare about to arrive. There are however potentially more efficient ways to countpulses. Some dedicated hardware buffer that counts pulses while the micro-controller sleeps could use less energy than the microcontroller itself and thuscontribute to energy saving. This should be looked into to achieve a more energyefficient node.
5.1.2 Energy EvaluationMethod selection for evaluating the energy consumption of the node was basedon what equipment was available at the time. Selecting different methods couldyield more precise results. Vergara et al. [14] utilize a simulated state machinewhere the wattage for every state is known. Then the time spent in each stateduring simulation is used to estimate the energy cost of various actions. This issomething that might have been interesting to look into. Given an accuratelybuilt state machine, their method might have yielded results that could pointto exactly how much energy a message of a particular sort or volume costs andthereby the actual impact on battery life the various choices can have.
5.2 ResultThis section covers discussion regarding the result chapter.
5.2.1 Implementation ProblemsThe sensor node was constructed with the selected Arduino framwork, theGSM Shield 2 and hall sensor. The library for controlling the GSM Shield2, <GSM.h> had some issues with the overall design of the node. <GSM.h>ran serial communication on the only hardware interrupt pins of the Arduino.There was a library <PinChangeInterrupt.h> that was able to run interruptson non interrupt pins. However, these two libraries had different definitionsof serial communications that were incompatible with eachother. <GSM.h>had only defined serial communication for digital pins, so the solution made forthe prototype was to comment out the definitions for the digital pins made by<PinChangeInterrupt.h>, and run the water flow sensor on an analog pin. Thisproblem appeared mainly because of the selected libraries and is not a generalmicro controller problem.
5.2.2 Overall Power Usage by Transmission StrategyRegarding the tests for overall power usage for various transmission strategies.Measuring equipment of finer granularity should have been used. The currentmeasurements show that broadcasting as often as every 7.5 min is free in termsof energy, which is not true. The relation between energy used and frequency
23
of equal size transmissions should be roughly linear. In other words, the longermessages that are being transmitted, the more energy is spent sending the mes-sage. However, impractically short time between transmissions had to be usedto provoke a change in measured energy usage that the measuring instrumentcould pick up. Another solution to this problem would be to run the tests forlonger periods of time such as a week or two weeks.
These measurements were done using a household energy meter and anadapter before the sensor node. Therefore, some of the energy measured inthese tests should amount to what the adapter drains. Note that while thisparticular adapter will not be used on location, something similar still has tobe there since the solar panel does not deliver the voltage that the system itselfuses.
5.2.3 Power Usage for CommunicationWhile both tests would also benefit from measuring equipment of finer granular-ity, they are still useful in the reasoning behind selecting transmission strategy.The results in table 4.2 shows that the time spent in a highly energy consumingstate grows less than linearly proportionate to the data size. With more precisemeasuement equipment, one might dive deeper into exactly how much energycan be saved this way.
The difference of energy use found between suspended and idle states of theGSM modem turns out to be an area in which it is possible to save energy. Fora sensor node that does not require any actuator, in other words, a node thatonly needs to send messages and never receive any, the ability to suspend it’scommuncation device should be utilized.
As for selecting to transmit with either HTTP via GPRS or SMS messages,it was found that for larger messages (100 character payload and more), GPRSseems to spend less time in a high energy state. The opposite seems to be truefor smaller messages, where SMS messages had the system spending less timein a high energy state. Therefore, given that a sensor node should be sendingsmall messages, SMS-messages might be a better choice for energy saving andvice versa.
Another argument for sending SMS-messages is dependent on location, ormore specifically the 2G providers available. Utilizing mobile data, which the in-ternet packages through GPRS do, almost always has some traffic cost. Howeversome providers allow for unlimited SMS messages to be sent within a certaincontract. This should be reviewed before committing to a transmission method.
It should be noted that the location of transmission might affect the be-haviour of these sends. The tests performed in this report were all carried outin the same location in Mjärdevi, Linköping. The test location has good recep-tion. Nodes might eventually be located in areas with poor reception and thatmight affect results. For these locations, power useage should be higher duringcommunication and average bitrate should be lower.
When posting to a cloud service or internet server, the package that it re-ceives should most likely be an internet package. If SMS messages is selected
24
as transmission method then it might need to be received and parsed before itreaches the server. This can be achieved with a microcontroller, a GSM modemand an Ethernet module.
Looking at Figure 4.2b, it remains unknown as to why that test in particularhad the sensor node reaching and holding noticeably higher currents through-out the test. The test still shows a distinct idle current and a send current,and it shows a send time that is similar to that of Figure 4.2a which followsexpectations. The only thing that should really increase overall current usageof transmission is if the node reads the signal strength of the network as weak;The tests were all conducted in the same location and should therefore be underpractically the same conditions regarding percieved signal strength. Since themessage size should not affect idle energy, and that is read noticeably different,the high current of this test is most likely an inaccuracy of the current sensor.
5.2.4 HTTP for Sensor NodesThe messages used for the current signature tests had the sensor node transmita HTTP message. As it costs energy to receive data as stated in the EnergyConsumption section 2.1.4, a sensor node would save energy by using a connec-tionless protocol, such as a UDP-based application rather than HTTP, which isTCP-based.
5.2.5 Tradeoffs in Energy SavingsAs one might notice in green computing, reducing the energy cost usually comeswith a price, often materialized in performance. This section aims to adresssome of the weigh offs with this particular sensor node. The current used whentransmitting SMS-messages averages at around 0.14 A at 5 V, and when idling0.125 also at 5 V. Sending 200 characters in 50 character messages has the nodein the high energy state for 21.6 seconds as opposed to 9.2 seconds which is thelength of time that would take for one 200 character send. If a certain node isrequired to send 200 characters daily, sending them all at once as opposed to inpackets of 50 will save it 8,68 J every day.
One should also consider the risk for destruction that a node is in and weighthat against the importance of battery life. As mentioned earlier, if a nodeis storing a value that is to be sent and it is destroyed before being able totransmit, that measured value is also lost. Therefore the balance goes betweensaving as much energy as possible and making sure that the measurements reachthe server. While one can argue for any frequency of transmission, the valuewhich is selected is to some extent an arbitrary weigh off. However when takingenergy consumption into consideration the answer to the question How oftenshould a node transmit data?, the answer would be as infrequently as reasonablypossible.
The degree as to which the measurements are time-critical should be con-sidered and weighed in as well. For this sensor node in particular, there isno problem with having a few days to a week of slack between measuring and
25
transmitting. For some sensor network such as a fire alarm, a few seconds slackmight be the greatest acceptible time between sensing and transmitting.
5.3 Answering the research questionsTo answer the research questions, the extrapollations from the result chaptersare used. First off, RQ1, wether or not we can create a node that can last 7 dayswithout battery recharge while still meeting it’s requirements of communication.The answer to that draws from section 4.5.1. Yes, since this example creates anode which draws around 19000 mAh weekly, and there are common batteriesthat has 20000 mAh or more, it is undoubtedly possible to create such a node.
The answer to RQ2 draws from the same extrapollation, but also from thatfollowing section, 4.5.2. The research question aims to explore the impact thatthe requirement of communication has on the battery lifetime as a whole. Thesetwo extrapollations investigate the impact from both the frequency of communi-cation but also the the utilization of sleepmode. This because wether or not thenode needs actuators should be part of the requirement. To answer the researchquestion, the impact of bundling messages seems to be very small whereas theimpact of actuators is more significant.
5.4 The work in a wider contextThe sensor node could be seen as a form of surveillance. However, seeing asvirtually every home with water pipes has the same form of surveillance at aneven more personal level (per home rather than per community), this should notbe a violation of privacy. A goal with the work is to help the remote communitiesand could thus be thought of as positive.
Another topic to bring up would be the network security. Currently the nodedoes not bring anything more to the table than what is already given with the2G network. What is created in this project is a proof of concept. Should onewant to deploy such a unit, some security evaluation should be done. Currentlyit is very easy to send false messages to the sensor node and break open thenode to have it send false messages to the cloud service.
26
Chapter 6
Conclusions
This report concludes that bundling data can be beneficial for GSM-basedprojects. Bundling data produces a fewer total of outbound messages, andthus avoids some of the energy ramps and tails that come with each message.This should be done as much ass possible to save energy. It is concluded that fora constant amount of characters, sending those in as few messages as possibleis the best strategy for reducing power cost. Regarding wether to chose SMSor HTTP given the availability of GPRS, it is concluded that SMS messageshas the node spending less time in a high energy state for small messages (100characters or less) while for large packages (200 characters or more), HTTPperforms better. Therefore, SMS is a sensible choice for small messages butHTTP makes more sense with bigger payloads. A sensor node’s need for actu-ators should be discussed since a node with a suspended GSM modem saves anoticeable amount of energy as opposed to a node with an idle GSM modem.
27
References
[1] Akyildiz, I. F., Su, W., Sankarasubramaniam, Y., & Cayirci, E. (2002).Wireless sensor networks: a survey. Computer networks, 38(4), 393-422.
[2] Gungor, V. C., & Hancke, G. P. (2009). Industrial wireless sensor networks:Challenges, design principles, and technical approaches. IEEE Transactionson industrial electronics, 56(10), 4258-4265.
[3] Abdelaal, M., & Theel, O. (2013). Power management in wireless sensornetworks: Challenges and solutions. In 2013 International Conference inCenteral Asia on Internet ((ICI 2013)).
[4] Lorentzen, A. V. (2004). Low-power processors for the hogthrob project(Master’s thesis, Technical University of Denmark, DTU, DK-2800 Kgs.Lyngby, Denmark).
[5] Carroll, A., & Heiser, G. (2010, June). An Analysis of Power Consumption ina Smartphone. In USENIX annual technical conference (Vol. 14, pp. 21-21).
[6] Balasubramanian, N., Balasubramanian, A., & Venkataramani, A. (2009,November). Energy consumption in mobile phones: a measurement studyand implications for network applications. In Proceedings of the 9th ACMSIGCOMM conference on Internet measurement conference (pp. 280-293).ACM.
[7] Wang, Z., Wang, Q., & Hao, X. (2009, September). The design of the remotewater quality monitoring system based on WSN. In Wireless Communica-tions, Networking and Mobile Computing, 2009. WiCom’09. 5th Interna-tional Conference (pp. 1-4). IEEE.
[8] Mahjoubi, A., Fethi Mechlouch, R., & Ben Brahim, A. (2011). A low costwireless data acquisition system for a remote photovoltaic (PV) water pump-ing system. Energies, 4(1), 68-89.
[9] Le Dinh, T., Hu, W., Sikka, P., Corke, P., Overs, L., & Brosnan, S. (2007,October). Design and deployment of a remote robust sensor network: Experi-ences from an outdoor water quality monitoring network. In Local ComputerNetworks, 2007. LCN 2007. 32nd IEEE Conference on (pp. 799-806). IEEE.
28
[10] Kotamäki, N., Thessler, S., Koskiaho, J., Hannukkala, A. O., Huitu, H.,Huttula, T., ... & Järvenpää, M. (2009). Wireless in-situ sensor network foragriculture and water monitoring on a river basin scale in southern Finland:Evaluation from a data user’s perspective. Sensors, 9(4), 2862-2883.
[11] Jiang, P., Xia, H., He, Z., &Wang, Z. (2009). Design of a water environmentmonitoring system based on wireless sensor networks. Sensors, 9(8), 6411-6434.
[12] Perrucci, G. P., Fitzek, F. H., Sasso, G., Kellerer, W., & Widmer, J. (2009,May). On the impact of 2G and 3G network usage for mobile phones’ batterylife. In Wireless Conference, 2009. EW 2009. European (pp. 255-259). IEEE.
[13] Lewis, F. L. (2004). Wireless sensor networks. Smart environments: tech-nologies, protocols, and applications, 11-46.
[14] Vergara, E. J., Andersson, S., & Nadjm-Tehrani, S. (2014, June). Whenmice consume like elephants: instant messaging applications. In Proceedingsof the 5th international conference on Future energy systems (pp. 97-107).ACM.
[15] Asplund, M., Thomasson, A., Vergara, E. J., & Nadjm-Tehrani, S. (2011,October). Software-related energy footprint of a wireless broadband mod-ule. In Proceedings of the 9th ACM international symposium on Mobilitymanagement and wireless access (pp. 75-82). ACM.
29


![EB Flow II EF x2000T · EBTRON ® SPECIFICATIONS: EF-x2000-T General Probe and Sensor Node Configurations 1 probe x 1 sensor node/probe (4 inch [101.6 mm] probe) 1 probe x 2 …](https://img.pdfslide.net/doc/110x75/5e7aee23f61ef276884f237e/eb-flow-ii-ef-x2000t-ebtron-specifications-ef-x2000-t-general-probe-and-sensor.jpg)