Embed Size (px)
Citation preview

Cellular Oncology 27 (2005) 225–230 225IOS Press
Implementation of accurate and fast DNAcytometry by confocal microscopy in 3D
Lennert S. Ploeger a, André Huisman a, Jurryt van der Gugten a, Dionne M. van der Giezen a,Jeroen A.M. Beliën b, Abdelhadi Y. Abbaker b, Hub F.J. Dullens a, William Grizzle c, Neal M. Poulin a,Gerrit A. Meijer b and Paul J. van Diest a,∗,∗∗a Department of Pathology, University Medical Center Utrecht, Utrecht, The Netherlandsb Department of Pathology, VU University Medical Center, Amsterdam, The Netherlandsc Department of Pathology, University of Alabama at Birmingham, Birmingham, AL, USA
Abstract. Background: DNA cytometry is a powerful method for measuring genomic instability. Standard approaches that mea-sure DNA content of isolated cells may induce selection bias and do not allow interpretation of genomic instability in the contextof the tissue. Confocal Laser Scanning Microscopy (CLSM) provides the opportunity to perform 3D DNA content measurementson intact cells in thick histological sections. Because the technique is technically challenging and time consuming, only a smallnumber of usually manually selected nuclei were analyzed in different studies, not allowing wide clinical evaluation. The aimof this study was to describe the conditions for accurate and fast 3D CLSM cytometry with a minimum of user interaction toarrive at sufficient throughput for pilot clinical applications. Methods: Nuclear DNA was stained in 14 µm thick tissue sectionsof normal liver and adrenal stained with either YOYO-1 iodide or TO-PRO-3 iodide. Different pre-treatment strategies wereevaluated: boiling in citrate buffer (pH 6.0) followed by RNase application for 1 or 18 hours, or hydrolysis. The image stacksobtained with CLSM at microscope magnifications of ×40 or ×100 were analyzed off-line using in-house developed softwarefor semi-automated 3D fluorescence quantitation. To avoid sectioned nuclei, the top and bottom of the stacks were identified fromZX and YZ projections. As a measure of histogram quality, the coefficient of variation (CV) of the diploid peak was assessed.Results: The lowest CV (10.3%) was achieved with a protocol without boiling, with 1 hour RNase treatment and TO-PRO-3iodide staining, and a final image recording at ×60 or ×100 magnifications. A sample size of 300 nuclei was generally achiev-able. By filtering the set of automatically segmented nuclei based on volume, size and shape, followed by interactive removal ofthe few remaining faulty objects, a single measurement was completely analyzed in approximately 3 hours. Conclusions: Thedescribed methodology allows to obtain a largely unbiased sample of nuclei in thick tissue sections using 3D DNA cytometry byconfocal laser scanning microscopy within an acceptable time frame for pilot clinical applications, and with a CV small enoughto resolve smaller near diploid stemlines. This provides a suitable method for 3D DNA ploidy assessment of selected rare cellsbased on morphologic characteristics and of clinical samples that are too small to prepare adequate cell suspensions.
Keywords: Confocal laser scanning microscopy, 3D, DNA ploidy, image analysis
1. Introduction
The DNA content of prostate cancer cells is stronglyrelated to tumor grade and stage [1,5]. Confocal LaserScanning Microscopy (CLSM) presents the opportu-nity to perform 3D DNA content measurements on in-tact cells in thick histological sections [13]. This has
*Corresponding author: Paul J. van Diest, MD, PhD, Professorof Pathology, Department of Pathology, University Medical CenterUtrecht, PO Box 85500, 3508 GA Utrecht, The Netherlands. Tel.:+31 30 2506565; Fax: +31 30 2544990; E-mail: [email protected].
**Supported by grant #1 R01-AG021397-01 of the NIH.
major advantages over the established techniques offlow cytometry and conventional 2D image cytometryon cytospins. The advantage is that dissociation of tis-sue with consequently loss of tissue architecture is notrequired, and inaccuracies caused by cutting or overlapas present in conventional image cytometry on thin tis-sue sections is almost completely avoided [7,14]. Sincethe content measurements on the nuclei are directly re-lated to the images they are obtained from, other quan-tities can also be measured on those nuclei, which cantogether be used for classification purposes [10]. Fur-thermore, 3D DNA measurements are also possible onbiopsy material of prostate tissue, where the amount oftissue is limited. However, to obtain a sample of nuclei
1570-5870/05/$17.00 2005 – IOS Press and the authors. All rights reserved
226 L.S. Ploeger et al. / Implementation of accurate and fast DNA cytometry
that is representative for the specimen remains a prob-lem [6,11]. Typically, image stacks of optically slicedthick sections are acquired interactively, after which in-dividual nuclei are manually segmented. Of these twosteps image acquisition is relatively quick, althoughit may be more time consuming when several imagestacks need to be combined to obtain a representativesample size. The manual segmentation procedure istraditionally very time consuming as it has been esti-mated that samples sizes of approximately 300 nucleiare necessary to arrive at a coefficient of variation (CV)of about 10% which allows resolution of smaller neardiploid stemlines [6]. We previously described the firststeps in automation of this technology by introducingautomated collection of 3D image stacks and segmen-tation of nuclei [2]. However, the quality of the result-ing histograms was yet insufficient for clinical appli-cation that requires detection of small aneuploid stem-lines. At the same time, an even higher degree of au-tomation was required to arrive at specimen throughputallowing initial clinical studies.
The aim of this study was therefore to develop amethod for accurate and fast 3D CLSM based DNA cy-tometry suitable for pilot clinical studies. For this pur-pose, analysis of the image stacks was optimized by in-troduction of filtering of the automatically segmentedobjects to remove faulty objects and sectioned nuclei.The parameters involved to automatically segment thenuclei were set in such a way that user interventionwas minimal. Further, the influence of several tissueprocessing steps on histogram quality was investigatedto arrive at the optimal protocol.
2. Materials and methods
2.1. Tissue preparation
Healthy liver and adrenal tissue with the lowest CVas determined by DNA flow or image cytometry wereselected. Tissue sections of 14 µm healthy paraffin-embedded tissue were cut. Several staining conditionswere varied: incubation time of RNase A (1 or 18hours), pretreatment with citrate buffer and hydrolysis,and DNA staining with either YOYO-1 iodide (488 nmexcitation, maximum emission at 509 nm) or TO-PRO-3 iodide (633 nm excitation, maximum emission at661 nm).
The first experiment compared liver and adrenal tis-sue staining with YOYO-1 and TO-PRO-3 (Molecu-lar Probes, Eugene, OR, USA) for 2 hours at room
temperature at a magnification of ×100 without addi-tional zoom, applying no pretreatment. After rinsingwith distilled water the tissues were mounted in Vec-tashield (Vector Laboratories, Burlingame, CA, USA)and sealed with a coverslip.
Having identified the normal tissue and stain provid-ing the lowest CVs in the first experiment, for the sec-ond experiment, the duration of RNase A (Boehringer,Mannheim) treatment was varied (1 versus 18 hours).Magnification was again ×100.
Having identified optimal duration of RNase treat-ment in the second experiment, in the final experimenttissue sections were boiled for 20 min in a 10 mMsodium citrate buffer (pH 6.0) or hydrolyzed with 2 NHCl for 30 minutes at room temperature. Imaging wasperformed at magnifications of ×60 (×40 objectivecombined with a zoom factor of 1.5) and ×100 (×100objective without additional zoom).
2.2. Image acquisition and analysis
Image stacks were acquired with a confocal laserscanning microscope (Leica TCS SP2 AOBS, Le-ica Microsystems, Heidelberg, Germany) fitted with×40/1.25 NA and ×100/1.40 NA oil immersion objec-tives. With zoom factors of 1.5 and 1, respectively, fi-nal magnifications were achieved of ×60 and ×100.Zooming in our confocal system is achieved by adjust-ing the mirror settings leading to an increase in reso-lution. In each field of vision, stacks of approximately100 2D digital images (512 × 512 pixels) were ob-tained, depending on the effective thickness of the tis-sue sections. The bottom and top of the stack wereidentified interactively as the slices where only a few(cut) nuclei remained, after which image acquisitionstarted with the lowest slice. Voxel size at the specimenlevel was 0.49 × 0.49 × 0.49 µm3 for the ×40 objec-tive, and 0.29×0.29×0.29 µm3 for the ×100 objective(NB: resolution in z-direction is lower than in x–y di-rection). The dynamic range was 12 bits, in order to ac-commodate the extended dynamic range of the fluores-cence signal. To obtain measurements for at least 300nuclei as previously set [12], 12 fields of vision wereimaged for each magnification. The fields of visionwere approximately 2 mm apart to avoid any bleachingof neighboring fields during image acquisition. Analy-sis was stopped when sufficient nuclei were collected.Hence, usually some of the image stacks were not an-alyzed for the ×60 magnification. Results of indepen-dent experiments were combined by quadratic averag-
L.S. Ploeger et al. / Implementation of accurate and fast DNA cytometry 227
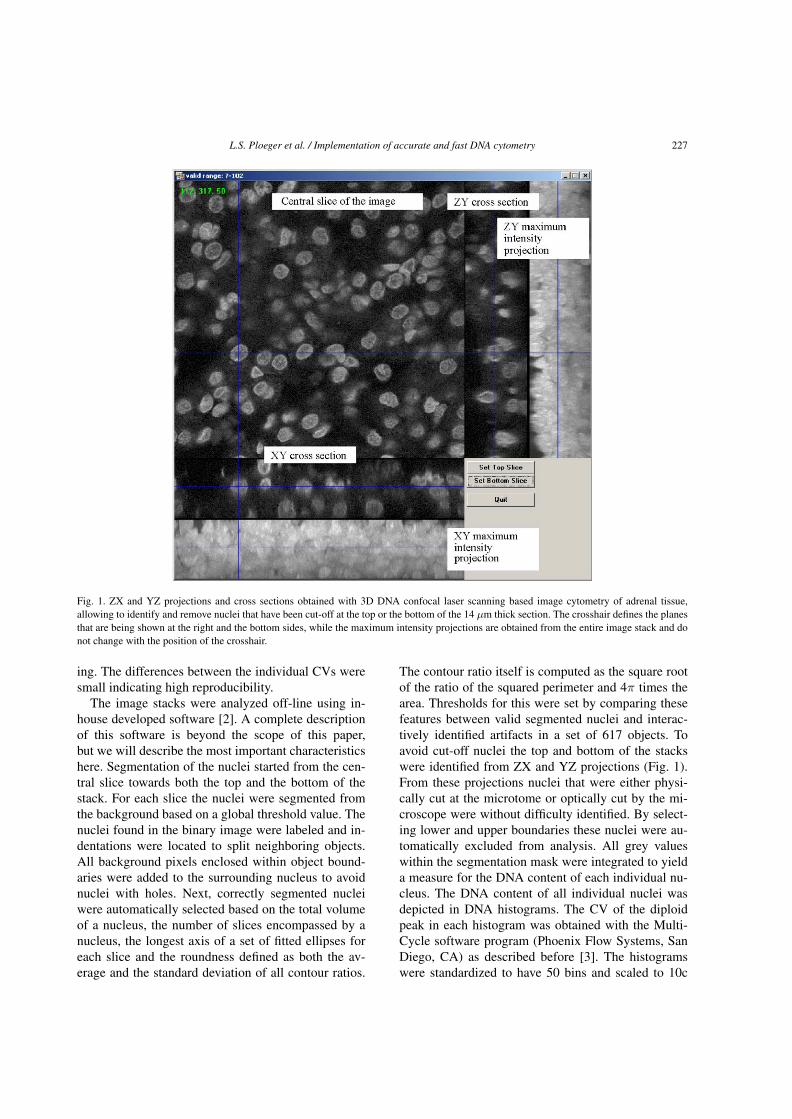
Fig. 1. ZX and YZ projections and cross sections obtained with 3D DNA confocal laser scanning based image cytometry of adrenal tissue,allowing to identify and remove nuclei that have been cut-off at the top or the bottom of the 14 µm thick section. The crosshair defines the planesthat are being shown at the right and the bottom sides, while the maximum intensity projections are obtained from the entire image stack and donot change with the position of the crosshair.
ing. The differences between the individual CVs weresmall indicating high reproducibility.
The image stacks were analyzed off-line using in-house developed software [2]. A complete descriptionof this software is beyond the scope of this paper,but we will describe the most important characteristicshere. Segmentation of the nuclei started from the cen-tral slice towards both the top and the bottom of thestack. For each slice the nuclei were segmented fromthe background based on a global threshold value. Thenuclei found in the binary image were labeled and in-dentations were located to split neighboring objects.All background pixels enclosed within object bound-aries were added to the surrounding nucleus to avoidnuclei with holes. Next, correctly segmented nucleiwere automatically selected based on the total volumeof a nucleus, the number of slices encompassed by anucleus, the longest axis of a set of fitted ellipses foreach slice and the roundness defined as both the av-erage and the standard deviation of all contour ratios.
The contour ratio itself is computed as the square rootof the ratio of the squared perimeter and 4π times thearea. Thresholds for this were set by comparing thesefeatures between valid segmented nuclei and interac-tively identified artifacts in a set of 617 objects. Toavoid cut-off nuclei the top and bottom of the stackswere identified from ZX and YZ projections (Fig. 1).From these projections nuclei that were either physi-cally cut at the microtome or optically cut by the mi-croscope were without difficulty identified. By select-ing lower and upper boundaries these nuclei were au-tomatically excluded from analysis. All grey valueswithin the segmentation mask were integrated to yielda measure for the DNA content of each individual nu-cleus. The DNA content of all individual nuclei wasdepicted in DNA histograms. The CV of the diploidpeak in each histogram was obtained with the Multi-Cycle software program (Phoenix Flow Systems, SanDiego, CA) as described before [3]. The histogramswere standardized to have 50 bins and scaled to 10c
228 L.S. Ploeger et al. / Implementation of accurate and fast DNA cytometry
because the number of bins theoretically influences thefitting procedure. It finds the best fit of several curvesthrough the data points, including the Gaussian G0/1and G2/M phase components. The CV is based uponthis mathematical model of the DNA content distri-bution. Linearity of the system was also assessed withMultiCycle by calculating the G2/G1 ratios.
3. Results
The system for automated segmentation was ableto segment approximately 60% of the nuclei correctlywithout the need for any user interaction. During man-ual intervention about 5–10% of the rejected nuclei
Table 1
Comparison of coefficients of variations (CVs) of DNA histogramsobtained with confocal laser scanning microscopy based 3D DNAcytometry using 2 tissue types and 2 DNA binding dyes
CV (%)
Liver ×100 Adrenal ×100
YOYO-1 18.0 16.3
TO-PRO-3 16.1 11.6
Table 2
Comparison of coefficients of variations (CVs) of DNA histogramsobtained with confocal laser scanning microscopy based 3D DNAcytometry in normal adrenal tissue stained with TO-PRO-3 iodideand treated with RNase for 0, 1 or 18 hours
Duration of RNase treatment (hr) CV (%)
0 13.8
1 10.3
18 11.4
were found to be lymphocytes. The other fraction con-tained nuclei that were positioned either on top of eachother or next to each other.
Table 1 shows that in the first experiment, the bestCVs were achieved with TO-PRO-3 staining of adrenaltissue. Table 2 lists the results for the experiment wherethe optimal duration of application of RNase was deter-mined for adrenal tissue stained with TO-PRO-3. TheCVs between RNase incubation for 1 or 18 hours didnot vary much, but the CV for the experiment when noRNase was applied was lowest. In Table 3, the influ-ence of pre-treatment is listed for 2 different magnifi-cations. Pre-treatment with cooking in citrate buffer orhydrolysis deteriorated the CVs when RNase was ap-plied for 1 hour and staining was done with TO-PRO-3. Imaging at ×60 instead of ×100 appeared not to de-teriorate the CVs for the 2 best protocols.
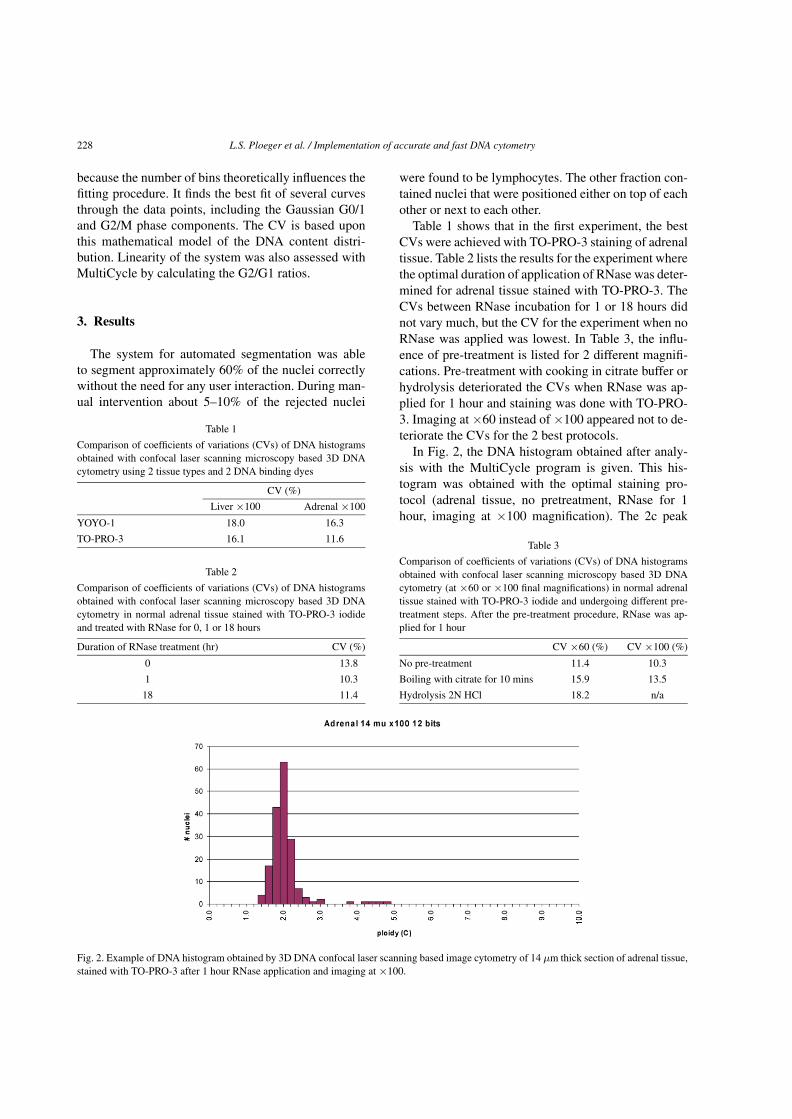
In Fig. 2, the DNA histogram obtained after analy-sis with the MultiCycle program is given. This his-togram was obtained with the optimal staining pro-tocol (adrenal tissue, no pretreatment, RNase for 1hour, imaging at ×100 magnification). The 2c peak
Table 3
Comparison of coefficients of variations (CVs) of DNA histogramsobtained with confocal laser scanning microscopy based 3D DNAcytometry (at ×60 or ×100 final magnifications) in normal adrenaltissue stained with TO-PRO-3 iodide and undergoing different pre-treatment steps. After the pre-treatment procedure, RNase was ap-plied for 1 hour
CV ×60 (%) CV ×100 (%)
No pre-treatment 11.4 10.3
Boiling with citrate for 10 mins 15.9 13.5
Hydrolysis 2N HCl 18.2 n/a
Fig. 2. Example of DNA histogram obtained by 3D DNA confocal laser scanning based image cytometry of 14 µm thick section of adrenal tissue,stained with TO-PRO-3 after 1 hour RNase application and imaging at ×100.

L.S. Ploeger et al. / Implementation of accurate and fast DNA cytometry 229
was well-defined and a few nuclei in the G2/M phasewere identified. The system appeared to be reasonablylinear with a G2/G1 ratio of 2.07.
4. Discussion
The aim of this study was to describe the conditionsfor accurate and fast 3D CLSM cytometry with a min-imum of user interaction. To this end, previously de-scribed in-house software [2] was further developed toimprove the throughput of the existing software andto ensure that all nuclei were measured unimpaired.After interactively setting the top and bottom slice ofthe field of vision based on the ZX and YZ projec-tions, image recording and segmentation of nuclei wasdone automatically. Next, artifacts were automaticallyremoved based on volume, number of slices, size androundness. Afterwards, only a minimum amount of in-spection and correction of segmented objects by theuser was necessary. All together, completing a mea-surement took approximately 3 hours, divided over ac-quisition, processing and manual intervention as fol-lows: 45 minutes acquisition, 15 minutes automatedsegmentation and 2 hours of manual intervention. Al-though this still is relatively long, this new approachdoes allow pilot clinical studies with this advancedtechnology for the first time. As operator variability isminimized, sampling can be performed unbiased andreproducibility is probably at its highest. To further in-crease the sample size and reduce operator bias we aredeveloping a system for automated systematic randomsampling of fields of vision. Further progress to reducethe time of analysis will largely depend on improve-ments in the speed of image acquisition with the CLSMand improvements of Z-resolution that will make seg-mentation easier. Finally, a reduction of the number ofslices will also make results available in a shorter pe-riod of time, but this may lead to less accurate results.Furthermore, semi-cubic voxels (the 3D equivalent ofa pixel) are more suitable for texture analysis.
We analyzed different tissue processing and imagingvariables in normal liver and adrenal tissue. Liver waschosen because it is known that the presence of 4N nu-clei is relatively high and it has ample cytoplasm facil-itating nuclear segmentation and assessment of linear-ity. Adrenal tissue was selected as an alternative withexpected similar features. Adrenal tissue appeared toprovide better CVs, but it is unclear why. DNA cytom-etry showed comparable results (results not shown),
so apparently adrenal tissue is less sensitive to tissueprocessing than normal liver.
TO-PRO-3, a relatively new stoichiometric DNAbinding fluorescent dye [15], provided consistentlybetter CVs than YOYO-1. This can be explained bythe fact that TO-PRO-3 is a smaller molecule that bet-ter penetrates the 14 µm thick sections and therebyprovides a more homogeneous staining throughout thesection than YOYO-1. This was indeed visually con-firmed. The lower intensity of the fluorescent signalfrom TO-PRO-3 compared to YOYO-1 appeared notto be a disadvantage; segmentation from the back-ground was still relatively easy. With TO-PRO-3, aclear improvement in the uniformity and reproducibil-ity of quantitative DNA staining in routinely processedformalin fixed tissue was obtained.
RNase incubation was applied to make sure thatno RNA remained, although affinity of TO-PRO-3 forRNA is low [4]. Incubation for more than 1 hour didnot clearly influence the results, so for practical rea-sons this incubation period is to be preferred. Antigenretrieval was tested as this has proven to lead to bet-ter results for DNA flow cytometry of paraffin embed-ded tissue [9]. Cooking in citrate buffer and hydrolysis,however, deteriorated the CVs for 3D confocal DNAcytometry. A possible explanation for this is that thenuclear membrane bursts open and DNA flows out ofthe nucleus.
After having used the ×100 magnification as a goldstandard, we tested also a ×60 magnification as this in-creases throughput, especially during acquisition (thedesired number of nuclei are expected to be imagedwith 5 stacks instead of 12) but also during manualintervention (a typical nucleus will encompass fewerslices). Fortunately, imaging at ×60 did not deteriorateCVs, indicating that 3D DNA ploidy measurementscan well be done at this magnification.
Besides tissue preparation, factors that may influ-ence the CV include laser stability, performance ofthe photo multiplier, system linearity, dynamic range,Z-resolution, and lens quality. Each of these factorsshould be optimized for best performance. It is ex-pected that with each new generation of CLSM, someof these system variables will be improved. Especiallyincreasing Z-resolution with a novel technique like 4Pimicroscopy [8] is promising in this respect.
5. Conclusion
In conclusion, we developed a protocol for accuratemeasurement of DNA content in thick histological sec-

230 L.S. Ploeger et al. / Implementation of accurate and fast DNA cytometry
tions using CLSM. We showed that the proposed tech-nique allows tissue processing to obtain a largely un-biased sample of nuclei for reproducible 3D DNA cy-tometry within a time frame acceptable for pilot clin-ical applications. Further studies will reveal whetherthis approach yields clinically or biologically usefuldata.
References
[1] J. Adolfsson, Prognostic value of deoxyribonucleic acid con-tent in prostate cancer: a review of current results, Int. J. Can-cer 58 (1994), 211.
[2] J.A. Belien, A.H. van Ginkel, P. Tekola, L.S. Ploeger, N.M.Poulin, J.P. Baak and P.J. van Diest, Confocal DNA cytometry:a contour-based segmentation algorithm for automated three-dimensional image segmentation, Cytometry 49 (2002), 12.
[3] E. Bergers, P.J. van Diest and J.P. Baak, Reliable DNA his-togram interpretation. Number of nuclei requiring measure-ment with flow cytometry, Anal. Quant. Cytol. Histol. 19(1997), 277.
[4] K. Bink, A. Walch, A. Feuchtinger, H. Eisenmann, P. Hutzler,H. Hofler and M. Werner, TO-PRO-3 is an optimal fluorescentdye for nuclear counterstaining in dual-colour FISH on paraffinsections, Histochemistry and Cell Biology 115 (2001), 293.
[5] A. Bocking, J. Stockhause and D. Meyer-Ebrecht, Towardsa single cell cancer diagnosis. Multimodal and monocellularmeasurements of markers and morphology (5M), Cell. Oncol.26 (2004), 73.
[6] C. Boudry, P. Herlin, M. Coster and J.L. Chermant, Influence ofsample size on image cytometry of DNA ploidy measurements,Anal. Quant. Cytol. Histol. 21 (1999), 209.
[7] R. Chamgoulov, P. Lane and C. Macaulay, Optical computed-tomographic microscope for three-dimensional quantitativehistology, Cell. Oncol. 26 (2005), 319.
[8] S.W. Hell, M. Schrader and H.T. van der Voort, Far-field fluo-rescence microscopy with three-dimensional resolution in the100-nm range, J. Microsc. 187 (1997), 1.
[9] M.P. Leers, B. Schutte, P.H. Theunissen, F.C. Ramaekers andM. Nap, Heat pretreatment increases resolution in DNA flowcytometry of paraffin-embedded tumor tissue, Cytometry 35(1999), 260.
[10] T. Mattfeldt, D. Trijic, H. Gottfried and H.A. Kestler, Classi-fication of incidental carcinoma of the prostate using learningvector quantization and support vector machines, Cell. Oncol.26 (2004), 45.
[11] A. Panizo-Santos, J.J. Sola, F.J. Pardo-Mindan, M. Hernan-dez, E. Cenarruzabeitia and J. Diez, Angiotensin converting en-zyme inhibition prevents polyploidization of cardiomyocytesin spontaneously hypertensive rats with left ventricular hyper-trophy, J. Pathol. 177 (1995), 431.
[12] L.S. Ploeger, J.A. Belien, N.M. Poulin, W. Grizzle and P.J. vanDiest, Confocal 3D DNA cytometry: assessment of requiredcoefficient of variation by computer simulation, Cell. Oncol. 26(2004), 93.
[13] J.P. Rigaut, J. Vassy, P. Herlin, F. Duigou, E. Masson, D. Bri-ane, J. Foucrier, S. Carvajal-Gonzalez, A.M. Downs and A.M.Mandard, 3-dimensional DNA image cytometry by confocalscanning laser microscopy in thick tissue blocks, Cytometry 12(1991), 511.
[14] Z. Sapi, J.B. Hendricks, P.G. Pharis and E.J. Wilkinson, Tissuesection image analysis of breast neoplasms. Evidence of falseaneuploidy, Am. J. Clin. Pathol. 99 (1993), 714.
[15] K.M. Sovenyhazy, J.A. Bordelon and J.T. Petty, Spectroscopicstudies of the multiple binding modes of a trimethine-bridgedcyanine dye with DNA, Nucleic Acids Res. 31 (2003), 2561.

Submit your manuscripts athttp://www.hindawi.com
Stem CellsInternational
Hindawi Publishing Corporationhttp://www.hindawi.com Volume 2014
Hindawi Publishing Corporationhttp://www.hindawi.com Volume 2014
MEDIATORSINFLAMMATION
of
Hindawi Publishing Corporationhttp://www.hindawi.com Volume 2014
Behavioural Neurology
EndocrinologyInternational Journal of
Hindawi Publishing Corporationhttp://www.hindawi.com Volume 2014
Hindawi Publishing Corporationhttp://www.hindawi.com Volume 2014
Disease Markers
Hindawi Publishing Corporationhttp://www.hindawi.com Volume 2014
BioMed Research International
OncologyJournal of
Hindawi Publishing Corporationhttp://www.hindawi.com Volume 2014
Hindawi Publishing Corporationhttp://www.hindawi.com Volume 2014
Oxidative Medicine and Cellular Longevity
Hindawi Publishing Corporationhttp://www.hindawi.com Volume 2014
PPAR Research
The Scientific World JournalHindawi Publishing Corporation http://www.hindawi.com Volume 2014
Immunology ResearchHindawi Publishing Corporationhttp://www.hindawi.com Volume 2014
Journal of
ObesityJournal of
Hindawi Publishing Corporationhttp://www.hindawi.com Volume 2014
Hindawi Publishing Corporationhttp://www.hindawi.com Volume 2014
Computational and Mathematical Methods in Medicine
OphthalmologyJournal of
Hindawi Publishing Corporationhttp://www.hindawi.com Volume 2014
Diabetes ResearchJournal of
Hindawi Publishing Corporationhttp://www.hindawi.com Volume 2014
Hindawi Publishing Corporationhttp://www.hindawi.com Volume 2014
Research and TreatmentAIDS
Hindawi Publishing Corporationhttp://www.hindawi.com Volume 2014
Gastroenterology Research and Practice
Hindawi Publishing Corporationhttp://www.hindawi.com Volume 2014
Parkinson’s Disease
Evidence-Based Complementary and Alternative Medicine
Volume 2014Hindawi Publishing Corporationhttp://www.hindawi.com


![University of Twente Research Information - DNA … · &DNARecognition DNA DetectionbyFlow Cytometry usingPNA-Modified Metal– Organic FrameworkParticles Raquel Mejia-Ariza,[a] JessicaRosselli,[a,](https://img.pdfslide.net/doc/110x75/5e7b480bf37b132481688480/university-of-twente-research-information-dna-dnarecognition-dna-detectionbyflow.jpg)