Embed Size (px)
Citation preview

Jeffrey B. ArmstrongASRC Aerospace Corporation, Cleveland, Ohio
Donald L. SimonGlenn Research Center, Cleveland, Ohio
Implementation of an Integrated On-Board Aircraft Engine Diagnostic Architecture
NASA/TM—2012-217279
April 2012
AIAA–2011–5859

NASA STI Program . . . in Profile
Since its founding, NASA has been dedicated to the advancement of aeronautics and space science. The NASA Scientific and Technical Information (STI) program plays a key part in helping NASA maintain this important role.
The NASA STI Program operates under the auspices of the Agency Chief Information Officer. It collects, organizes, provides for archiving, and disseminates NASA’s STI. The NASA STI program provides access to the NASA Aeronautics and Space Database and its public interface, the NASA Technical Reports Server, thus providing one of the largest collections of aeronautical and space science STI in the world. Results are published in both non-NASA channels and by NASA in the NASA STI Report Series, which includes the following report types: • TECHNICAL PUBLICATION. Reports of
completed research or a major significant phase of research that present the results of NASA programs and include extensive data or theoretical analysis. Includes compilations of significant scientific and technical data and information deemed to be of continuing reference value. NASA counterpart of peer-reviewed formal professional papers but has less stringent limitations on manuscript length and extent of graphic presentations.
• TECHNICAL MEMORANDUM. Scientific
and technical findings that are preliminary or of specialized interest, e.g., quick release reports, working papers, and bibliographies that contain minimal annotation. Does not contain extensive analysis.
• CONTRACTOR REPORT. Scientific and
technical findings by NASA-sponsored contractors and grantees.
• CONFERENCE PUBLICATION. Collected papers from scientific and technical conferences, symposia, seminars, or other meetings sponsored or cosponsored by NASA.
• SPECIAL PUBLICATION. Scientific,
technical, or historical information from NASA programs, projects, and missions, often concerned with subjects having substantial public interest.
• TECHNICAL TRANSLATION. English-
language translations of foreign scientific and technical material pertinent to NASA’s mission.
Specialized services also include creating custom thesauri, building customized databases, organizing and publishing research results.
For more information about the NASA STI program, see the following:
• Access the NASA STI program home page at http://www.sti.nasa.gov
• E-mail your question via the Internet to help@
sti.nasa.gov • Fax your question to the NASA STI Help Desk
at 443–757–5803 • Telephone the NASA STI Help Desk at 443–757–5802 • Write to:
NASA Center for AeroSpace Information (CASI) 7115 Standard Drive Hanover, MD 21076–1320

Jeffrey B. ArmstrongASRC Aerospace Corporation, Cleveland, Ohio
Donald L. SimonGlenn Research Center, Cleveland, Ohio
Implementation of an Integrated On-Board Aircraft Engine Diagnostic Architecture
NASA/TM—2012-217279
April 2012
AIAA–2011–5859
National Aeronautics andSpace Administration
Glenn Research Center Cleveland, Ohio 44135
Prepared for the47th Joint Propulsion Conference and Exhibitcosponsored by the AIAA, ASME, SAE, and ASEESan Diego, California, July 31–August 3, 2011

Available from
NASA Center for Aerospace Information7115 Standard DriveHanover, MD 21076–1320
National Technical Information Service5301 Shawnee Road
Alexandria, VA 22312
Available electronically at http://www.sti.nasa.gov
Level of Review: This material has been technically reviewed by technical management.

NASA/TM—2012-217279 1
Implementation of an Integrated On-Board Aircraft Engine Diagnostic Architecture
Jeffrey B. Armstrong ASRC Aerospace Corporation
Cleveland, Ohio 44135
Donald L. Simon National Aeronautics and Space Administration
Glenn Research Center Cleveland, Ohio 44135
Abstract An on-board diagnostic architecture for aircraft turbofan engine performance trending, parameter
estimation, and gas-path fault detection and isolation has been developed and evaluated in a simulation environment. The architecture incorporates two independent models: a real-time self-tuning performance model providing parameter estimates and a performance baseline model for diagnostic purposes reflecting long-term engine degradation trends. This architecture was evaluated using flight profiles generated from a nonlinear model with realistic fleet engine health degradation distributions and sensor noise. The architecture was found to produce acceptable estimates of engine health and unmeasured parameters, and the integrated diagnostic algorithms were able to perform correct fault isolation in approximately 70 percent of the tested cases.
Nomenclature C-MAPSS Commercial Modular Aero Propulsion System Simulation FDI Fault Detection and Isolation Fn Net thrust H Fault influence coefficient matrix h Health parameter vector HPC High Pressure Compressor HPT High Pressure Turbine LPC Low Pressure Compressor LPT Low Pressure Turbine m Numerical representation of a gas-path fault magnitude Nf Fan rotational speed and related sensor Nc Core rotational speed and related sensor P2 Pressure at engine inlet P24 Low Pressure Compressor exit pressure p Percentage contribution to the sum-squared of residuals PLA Power lever angle PBM Performance Baseline Model Ps30 Static pressure at High Pressure Compressor exit q Engine tuning parameter vector R Sensor measurement covariance matrix ROC Receiver Operating Characteristic RTAPM Real-Time Adaptive Performance Model SmLPC Low pressure compressor stall margin SQL Structured Query Language
NASA/TM—2012-217279 2
T2 Temperature at engine inlet T24 Low Pressure Compressor exit temperature T40 High Pressure Turbine inlet temperature T48 Low Pressure Turbine inlet temperature T50 Exhaust gas temperature V* Transformation matrix mapping health parameters into engine tuning parameters VBV Variable Bleed Valve VSV Variable Stator Vanes Wf Fuel flow w Weighting parameter y Sensed engine parameter vector z Unmeasured engine parameter vector γ Flow capacity η Efficiency
Introduction Modern aircraft gas turbine engines are complex systems where reliability and efficiency are of
particular interest to operators. To manage a collection of such assets, the accurate estimation of current engine performance and the fast diagnosis and correction of problems are necessary to maintain safety and reduce operating costs. Gas-path health management refers to the application of these concepts to an engine’s flow path, including turbomachinery modules, control system sensors, and related actuators.
A commercial turbofan engine will exhibit gradual degradation over its operating life. Turbomachinery module efficiencies will slowly degrade as parts wear from regular use. The estimation of engine performance can help operators determine flight hours remaining until regular maintenance is necessary and manage the replacement of these modules as performance approaches unacceptable levels. Furthermore, like all complex systems, turbofans can experience a variety of faults, including turbomachinery performance shifts, sensor measurement biases, and actuator malfunctions. These faults may occur suddenly or intermittently, or they may gradually develop as a slow drift from nominal operation. To ensure efficient and safe operation, gas-path performance trending and fault diagnostics are essential.
The conventional strategy for gas-path diagnostics and performance trending relies on simple on-board diagnostics and ground-based performance trending and fault diagnostics. Conventional on-board diagnostics include range checks, rate-of-change limits, and built-in-test logic to ensure proper operation of the engine control systems. Ground stations rely on snapshot sensed data measured during flight to trend engine performance and diagnose possible faults. A reliance on this strategy may require multiple flights before detecting and isolating gas-path faults, and intermittent faults are unlikely to be detected at all unless advanced on-board diagnostics are available to diagnose the problem (Ref. 1).
Enhanced on-board diagnostics offer advantages over the conventional ground-based architecture. With advancements in computational power available in avionics systems, model-based on-board diagnostics are possible, and the benefits of such systems can be exploited. Specifically, an on-board solution potentially has access to streaming sensed values from engine controllers; in contrast, the conventional ground-based snapshot approach utilizes far less data to track engine degradation trends and diagnose faults. The availability of real-time data can decrease fault detection and isolation latency significantly, and intermittent engine faults have a greater probability of detection. When used in conjunction with conventional ground-based approaches and existing on-board built-in-tests, fault detection and isolation accuracy is expected to improve significantly. Additionally, a model-based solution offers the ability to estimate unmeasured engine parameters, which can potentially be employed by control systems at both the engine and aircraft levels.
This paper provides details of an implemented integrated architecture for on-board gas-path diagnostics. This model-based diagnostic architecture design is first reviewed in detail, including the real-
NASA/TM—2012-217279 3
time filter applied to track performance deterioration, the diagnostic model, and the performance trending storage algorithm. Two gas-path fault detection techniques and two fault isolation algorithms implemented in conjunction with this architecture are also explained. The architecture is then exercised against a nonlinear engine model simulating a 90,000 lbf class turbofan engine. The diagnostic architecture’s accuracy in estimating engine health parameters and other unmeasured engine outputs, or auxiliary parameters, is evaluated. Finally, based on a database of engines containing simulated gas-path faults, the fault detection and isolation algorithms are also evaluated.
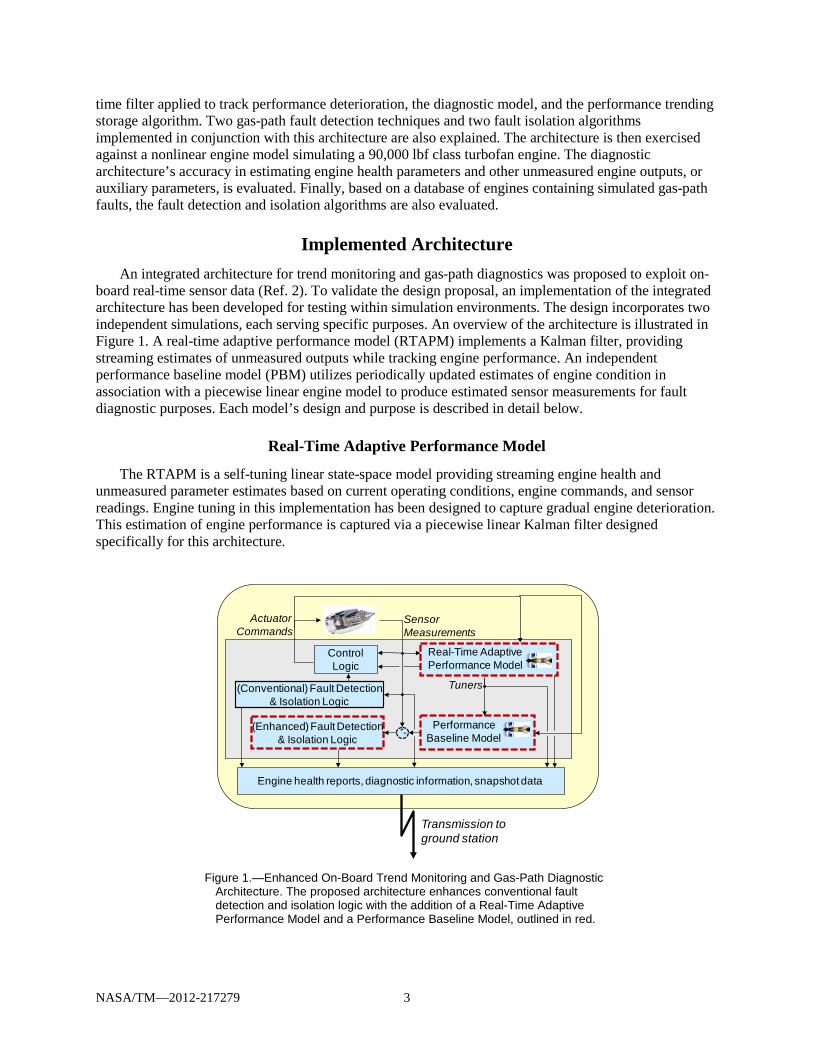
Implemented Architecture An integrated architecture for trend monitoring and gas-path diagnostics was proposed to exploit on-
board real-time sensor data (Ref. 2). To validate the design proposal, an implementation of the integrated architecture has been developed for testing within simulation environments. The design incorporates two independent simulations, each serving specific purposes. An overview of the architecture is illustrated in Figure 1. A real-time adaptive performance model (RTAPM) implements a Kalman filter, providing streaming estimates of unmeasured outputs while tracking engine performance. An independent performance baseline model (PBM) utilizes periodically updated estimates of engine condition in association with a piecewise linear engine model to produce estimated sensor measurements for fault diagnostic purposes. Each model’s design and purpose is described in detail below.
Real-Time Adaptive Performance Model
The RTAPM is a self-tuning linear state-space model providing streaming engine health and unmeasured parameter estimates based on current operating conditions, engine commands, and sensor readings. Engine tuning in this implementation has been designed to capture gradual engine deterioration. This estimation of engine performance is captured via a piecewise linear Kalman filter designed specifically for this architecture.
Figure 1.—Enhanced On-Board Trend Monitoring and Gas-Path Diagnostic
Architecture. The proposed architecture enhances conventional fault detection and isolation logic with the addition of a Real-Time Adaptive Performance Model and a Performance Baseline Model, outlined in red.
ControlLogic
SensorMeasurements
ActuatorCommands
(Enhanced) Fault Detection& Isolation Logic
Engine health reports, diagnostic information, snapshot data
Real-Time AdaptivePerformance Model
Performance Baseline Model
Tuners(Conventional) Fault Detection& Isolation Logic
Transmission toground station
+-
NASA/TM—2012-217279 4
The Kalman filter itself has been generated from a piecewise linear approximation of a nonlinear engine model. The piecewise linear model, including all state-space system matrices and the resultant piecewise linear Kalman filter are scheduled on three engine operating conditions: pressure altitude, Mach number, and corrected fan speed or power lever angle (PLA), which acts as a power reference parameter. The use of a three-dimensional scheduling algorithm was found to provide the best estimation accuracy versus the nonlinear model in this study. Depending on accuracy requirements, the number of scheduling dimensions can be configured appropriately.
Selection of Engine Model Tuning Parameters
The RTAPM Kalman filter is constructed to estimate engine dynamic states plus additional tuning parameters designed to capture gradual engine performance deterioration effects. Health parameters, modeled as efficiencies and flow capacities associated with each major rotating engine module in this study, are used as a measure of engine degradation. However, health parameters are not directly measurable. Additionally, for this study as well as most other aircraft engine applications, health parameters outnumber available engine sensed measurements, which leads to an underdetermined estimation problem. A common practice in the design of adaptive engine models is to define the tuning parameters to be a subset of the available engine health parameters. While this will enable Kalman filter-based estimation, it can result in “smearing” the effects of un-estimated health parameters onto those that are estimated, and in turn introduce error in the accuracy of overall model-based performance estimation applications (Ref. 3).
Instead of following the conventional approach of selecting a subset of health parameters to serve as the model tuner vector, this study applies a tuner vector, q, defined as a linear combination of all health parameters, h, constructed as:
hVq *= (1)
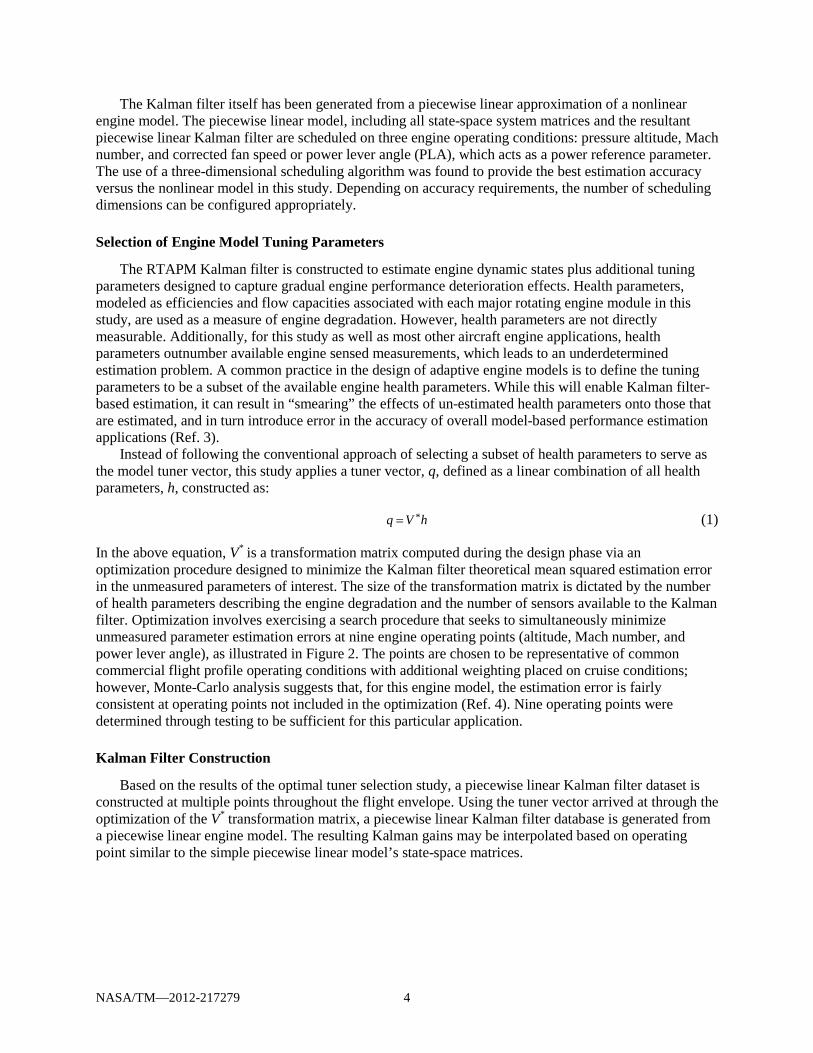
In the above equation, V* is a transformation matrix computed during the design phase via an optimization procedure designed to minimize the Kalman filter theoretical mean squared estimation error in the unmeasured parameters of interest. The size of the transformation matrix is dictated by the number of health parameters describing the engine degradation and the number of sensors available to the Kalman filter. Optimization involves exercising a search procedure that seeks to simultaneously minimize unmeasured parameter estimation errors at nine engine operating points (altitude, Mach number, and power lever angle), as illustrated in Figure 2. The points are chosen to be representative of common commercial flight profile operating conditions with additional weighting placed on cruise conditions; however, Monte-Carlo analysis suggests that, for this engine model, the estimation error is fairly consistent at operating points not included in the optimization (Ref. 4). Nine operating points were determined through testing to be sufficient for this particular application.
Kalman Filter Construction
Based on the results of the optimal tuner selection study, a piecewise linear Kalman filter dataset is constructed at multiple points throughout the flight envelope. Using the tuner vector arrived at through the optimization of the V* transformation matrix, a piecewise linear Kalman filter database is generated from a piecewise linear engine model. The resulting Kalman gains may be interpolated based on operating point similar to the simple piecewise linear model’s state-space matrices.
NASA/TM—2012-217279 5
Figure 2.—Selected Operating Points for Engine Tuner Optimization. A
collection of common operating points are selected to be representative of a commercial flight profile.
Performance Baseline Model
The PBM provides estimates of sensed engine values based on periodically updated engine performance estimates, a power reference parameter, and engine commands. The difference in true engine sensor values and the PBM’s sensor estimates is available for use by diagnostic algorithms. The model applies a piecewise linear engine model to capture dynamics coupled with periodically updated engine tuner parameters to incorporate the effects of engine performance degradation; performance estimates are calculated externally, passed periodically as inputs to the PBM. By only using periodically updated tuner estimates, the PBM avoids the possibility of engine tuners absorbing the effects of gas-path faults, which may occur if instantaneous Kalman filter tuner estimates are used. The PBM’s piecewise linear dataset has been generated via a linearization of a nonlinear engine model at multiple operating points, identical to the original data employed to generate the RTAPM’s Kalman filter. Similar to the Kalman filter present in the RTAPM, the PBM is scheduled on three parameters: altitude, Mach number, and corrected fan speed, which acts as this implementation’s power reference parameter.
This diagnostic architecture uses a power reference parameter as an explicit input into the PBM. The power reference parameter input protects the PBM against divergence of the model’s internal states. In this particular example, sensed fan speed is employed as an input rather than using fan speed as an internal model state. By treating fan speed as an input, the number of internal states within the embedded piecewise linear model is decreased by one.
The PBM does not employ instantaneous tuner estimates, and the PBM sensor estimates will differ from actual sensed engine values. Because engine degradation is assumed to be gradual, the deterioration effects due to normal engine operation are captured and accounted for in the PBM using periodic tuner updates. As gas-path engine faults are expected to manifest themselves as sudden performance shifts, the real-time tuner estimates generated by the RTAPM’s Kalman filter will immediately absorb sudden performance shifts. Because the tuners employed by the PBM are updated only periodically, a gas-path fault that can be manifested as sudden performance shifts will not be reflected in the tuner inputs to the PBM, leading to a measurable divergence of actual sensor values from respective PBM estimates.
0 0.1 0.2 0.3 0.4 0.5 0.6 0.7 0.8 0.9-0.5
0
0.5
1
1.5
2
2.5
3
3.5
4
4.5x 10
4
Mach Number
Alti
tude
(ft)
Tuner Optimization Points
← PLA=80
← PLA=80
← PLA=80
← PLA=60,80
PLA=60,80 →
PLA=60,80 →

NASA/TM—2012-217279 6
Periodic Tuner Update
The PBM is provided with tuner update vectors calculated from real-time data from earlier flights. The periodic tuner update procedure can be separated into two distinct tasks: storage and retrieval. Additionally, the update system has been designed to support a “cellular” approach to storage and retrieval. The flight envelope is partitioned along three dimensions (altitude, Mach number, and power level) into a grid of cells; the grid density along any dimension is a design parameter that can be adjusted depending on accuracy requirements and storage constraints. As the engine transitions through different cells within the flight envelope, the periodic update storage and retrieval routines can both apply and retrieve tuner data specific to that portion of the flight envelope.
In this architecture, the tuner data that is provided to the PBM is taken from data collected from the self-tuning RTAPM at least one flight prior to the current. Utilizing the older tuner data where gas-path faults are not expected to be present allows the PBM to operate without any absorption of fault signatures by the real-time tuners generated in the RTAPM.
Storage
Real-time tuners calculated by the RTAPM are continuously streamed to a storage module. The storage module also accepts operating point information to allow for cellular storage during the flight. An incoming tuner vector is added to a running sum of tuner vectors for the flight envelope cell in which the engine is currently operating and a counter is incremented. At the conclusion of a flight, the number of samples collected for each cell is examined. An average tuner vector is computed for cells where a sufficient number of samples were stored to consider the data significant. This average tuning vector for any given cell is then committed to a backend storage system for later retrieval by the PBM. Some consideration is given to existing data in the long-term storage backend. Namely, the incoming data is linearly weighted against the existing data based on the age at the time of commit. The weighting of data based on age is a tunable design parameter.
Retrieval
The retrieval module provides engine tuning vectors from a backend storage module. Retrieval is achieved by requesting a tuner vector based on current operating conditions. Two methods of calculating the tuning vector for use by the PBM are implemented. The first employs a three-dimensional lookup table, where the tuning vector provided to the PBM is simply retrieved from the cell in which the engine is currently operating. This simple technique does not perform any smoothing during cell transitions. The second technique utilizes a three-dimensional interpolation of tuning vectors based on current operating conditions. Based on pressure altitude, Mach number, and power setting, a weighted average of the tuning vectors from bounding cell centers is computed. This process, however, is complicated by the fact that data in select cells may be substantially older than data present in other cells. To overcome the data age differences, the weighting of each cell’s tuner data is computed from a combination of both distance from schedule points and age relative to the current flight profile. Given n points on which to base engine tuner parameters, a best-guess estimate of the current tuner vector would be calculated as:
∑∑
=
== n
i idistiage
n
i iidistiage
ww
qwwq
1 ,,
1 ,,ˆ (2)
The age-related weighting, wage, is computed from the tuner vector’s age in long-term storage, while the distance weighting, wdist, is based purely on scheduling axes and operating point. An equivalent age estimate is computed using these same weighting parameters. The technique attempts to produce a

NASA/TM—2012-217279 7
compromise between applicability of surrounding cells based on operating point and the age of the stored data.
Tuner Vector Storage and Management
Two backend database solutions for long-term storage of tuner vectors are provided. The first solution uses true database to store tuner vectors and their relative ages for each cell in a SQLite database (Ref. 5). The SQLite backend is desirable as it is able to store substantial information concerning all modifications to the database, permitting specific profiles to be backed out in case a fault is detected. Also, the SQLite backend has the benefit of being in a standardized format, allowing a host of other programs to explore and modify the stored data. A minor drawback of the database backend is a slight speed penalty due to a substantial number of Structured Query Language (SQL) statements executed at the initiation and conclusion of each flight. However, in a realistic implementation for on-board usage, the SQLite solution is desirable for the benefits listed above.
The second backend, referred to as the custom backend, relies on a simple binary file storing the most current tuner estimates for each cell. The main benefit of this backend is the speed benefit of loading binary data directly into storage arrays in memory. However, this backend does not provide a standardized solution for exploring and modifying stored data. Also, the ability to back out any given tuner vector due to the possible presence of a fault in a flight profile is limited to the previous flight alone. While this backend solution is optimal for performing Monte-Carlo analyses in a simulation environment, the drawbacks with regards to examining and modifying data may preclude this backend from actual on-board implementation.
Diagnostic Algorithms
The estimated sensor outputs of the PBM are designed to be used by a diagnostic algorithm for the diagnosis of gas-path faults. Gradual engine deterioration is accounted for by the periodic tuner update system and the PBM; therefore, engine sensor estimates generated by the PBM will account for engine degradation. Because the output from the PBM represents a fault-free estimate of engine measurements, the residual between the actual engine sensors and the PBM’s estimates can be used for the diagnosis of faults.
The diagnostic algorithms evaluated in this study partition the diagnostic process into two steps: 1) detecting the occurrence of an engine fault, and 2) isolating the root cause of any detected faults. Prior to processing, sensor residuals are normalized by either full-power sea-level values, in the cases of rotational speeds, combustor inlet pressure, and exhaust temperature, or standard day sea-level conditions, in the cases of inlet and interstage compressor conditions. This implementation considers two detection algorithms designed to analyze these sensor residuals. The first calculates a sum-squared of sensor residuals, which is compared to a fixed threshold. The second technique involves isolating the maximum sensor residual for comparison against a threshold. Both detection algorithms require a persistent threshold violation to raise a warning of possible fault. After a fault is detected, an isolation algorithm is activated, continually evaluating streaming data for the remainder of the flight profile.
Two single-fault isolation algorithms have been designed for integration with this architecture. The isolation algorithms are designed to classify faults of 16 possible types, outlined in Table 1. Fault sources include turbomachinery module faults, actuator biases, and sensor drifts and biases. Each algorithm is described in detail below. Once a fault is detected, the selected isolation algorithm is executed every 5 seconds for the remainder of the profile, and the algorithm is provided with time-averaged sensor residuals. When the flight profile ends, the most frequently isolated fault source is reported. The two isolation algorithms, an inverse least-squares solution and a neural network technique, are explained in detail below.

NASA/TM—2012-217279 8
TABLE 1.—CLASSIFIABLE FAULT SOURCES [Isolation algorithms are designed to
detect these gas-path faults.] Sensors Actuators Modules
Nf Wf Fan Nc VSV LPC P2 VBV HPC
P24 ----- HPT Ps30 ----- LPT T2 ----- -----
T24 ----- ----- T48 ----- -----
Inverse Least-Squares Isolation Algorithm
The inverse least-squares isolation algorithm attempts to locate a fault source by estimating fault scales necessary for all possible fault scenarios and selecting the most likely fault source. The algorithm relies on a database of precalculated influence coefficient matrices. These matrices are computed by applying faults to a nonlinear engine model, computing the resulting sensor residuals based on a piecewise linear model, and computing each individual influence coefficient term as:
j
iji m
yH ∆=,
(3)
In the above equation, the Δyi represents the difference between nonlinear sensed engine measurements and the piecewise linear model’s estimates of engine measurements given appropriate system inputs and mj represents a numerical measure of an applied fault magnitude. Complete influence coefficient matrices have been constructed at multiple operating points to improve estimation accuracy based on changes to engine response in different flight regimes.
Based on operating conditions, a single influence coefficient matrix, H, is selected for use. Using the sensor residual values, fault magnitude estimates are generated for each fault type:
( ) yRHHRHm Tjj
Tjj ∆= −−− 111ˆ (4)
In the above equation, Hj represents one column of the influence coefficient matrix corresponding to fault type j. Once an estimate of fault magnitude, jm̂ , is computed for each possible single-source fault, the estimated sensor residuals can be computed based on the estimated fault scale:
( ) jjj mHy ˆˆ =∆ (5)
A sum-squared error between the estimated residuals as calculated in Equation (5) and the actual residuals is computed for each fault hypothesis. The fault source resulting in the lowest sum squared error is selected as the most likely source of the fault.
Neural Network Isolation Algorithm
An alternative isolation algorithm has been designed using a probabilistic neural network as a fault classification system. This classifier uses a database of neural networks to select the most likely source of a given engine fault signature. The networks are trained by applying faults to an ideal nonlinear engine model and computing residuals relative to an ideal piecewise linear model. Each of the squares of the normalized sensor residuals is in turn normalized by the sum squared of all sensor residuals, effectively
NASA/TM—2012-217279 9
creating a vector of percentage contribution of each sensor to the normalized sum squared of residuals. Each percentage is signed to be consistent with the sign of the residual from which it was derived:
( )
∑=
∆
∆∆=
yn
jj
iii
y
yysignp
1
2
2 (6)
The signed percentages have been found to improve classification results by effectively removing the variation in residual scaling due to fault magnitude differences. Each neural network is trained with five datasets per fault per operating point.
The neural networks analyze the provided running average of the signed percent-of-sum-squared residuals. The probabilistic neural network will return a fault identifier of the most likely candidate fault source based on training data. While additional training data can improve results, the marginal utility of adding training data has been found to be below the marginal cost measured in terms of storage and computing time required. This technique, in contrast with the inverse least-squares technique, does not provide an estimate of fault magnitude.
Results The implemented architecture was evaluated against the NASA-developed Commercial Modular
Aero Propulsion System Simulation (C-MAPSS) nonlinear model (Ref. 6). The C-MAPSS engine represents a two-spool high-bypass turbofan engine with five rotating turbomachinery modules. Integrated with the engine model is a controller based on corrected fan speed. The nonlinear model has been enhanced with realistic engine noise on sensor lines which was qualitatively tuned against actual flight data, and the sensor noise is present in the controller sensed feedback parameters. Additionally, the simulation models gradual engine health degradation via two health modifiers per module, an efficiency and a flow capacity. To simulate realistic engine degradation trends, a randomized statistical distribution based on actual engine fleet data is employed (Ref. 7).
Based on the described engine configuration, the diagnostic architecture was configured for compatibility with C-MAPSS. To construct the piecewise linear Kalman filter, the sensor measurement covariance matrix of a “fleet-average” C-MAPSS engine has been empirically estimated. Additionally, the formulation used to estimate the state covariance includes the covariance of health; the health modifier covariance has been empirically computed from the statistical data used to randomize engine health (Ref. 4).
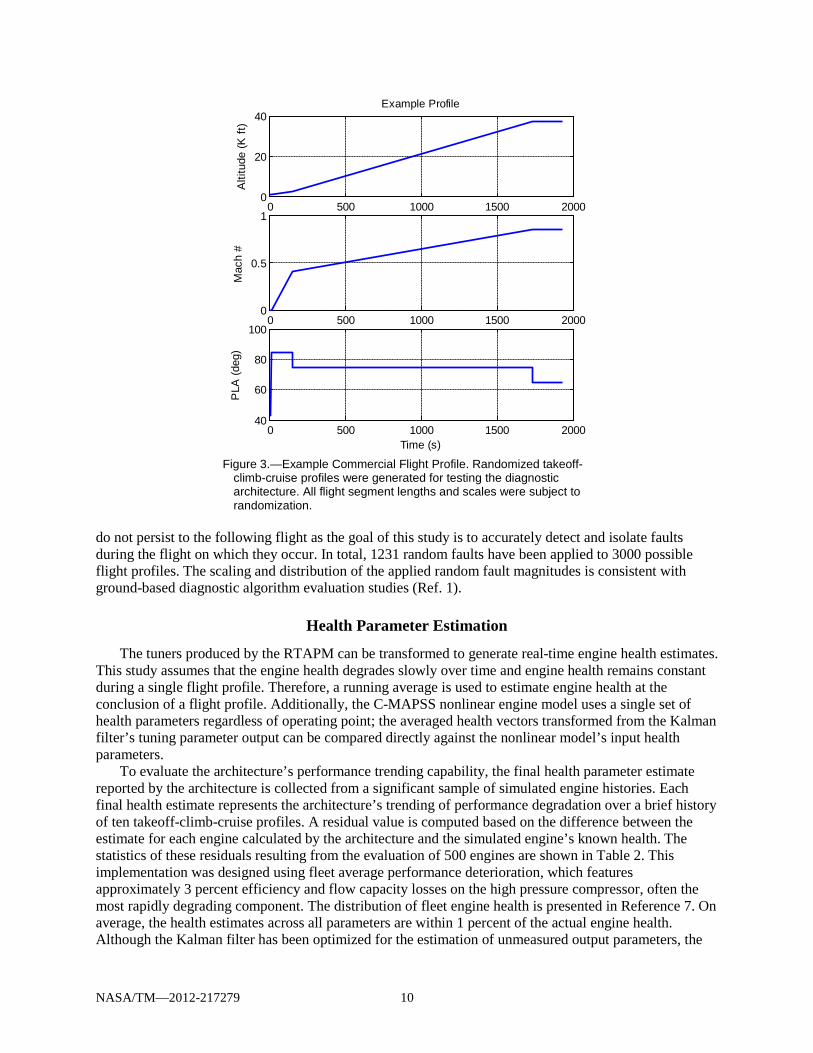
The analyses for evaluating the diagnostic architecture involve simulations of realistic commercial flight profiles. A collection of randomized takeoff-climb-cruise flight profiles, an example of which is outlined in Figure 3, was generated using C-MAPSS. The architecture’s ability to accurately estimate engine health and unmeasured parameters is tested against a collection of nominal flight profiles consisting of 500 engines with brief 10-flight histories. The engines have turbomachinery module health degradation randomly applied based on fleet statistics (Ref. 1). The diagnostic architecture’s ability to estimate engine health and unmeasured engine parameters are quantified based on the nonlinear model output.
Evaluation of fault detection and isolation is achieved using a similar collection of commercial flight profiles. A database of 300 engines, each with 20 takeoff-climb-cruise flight profiles, has been generated. The initial ten flights are considered training flights where faults are known to be absent. Gas-path faults have been applied randomly to the latter ten profiles of each engine to evaluate fault detection and isolation capabilities of the architecture. Faults include turbomachinery efficiency and flow capacity biases, actuator biases, and sensor signal biases, all applied suddenly during a single flight. These faults
NASA/TM—2012-217279 10
Figure 3.—Example Commercial Flight Profile. Randomized takeoff-
climb-cruise profiles were generated for testing the diagnostic architecture. All flight segment lengths and scales were subject to randomization.
do not persist to the following flight as the goal of this study is to accurately detect and isolate faults during the flight on which they occur. In total, 1231 random faults have been applied to 3000 possible flight profiles. The scaling and distribution of the applied random fault magnitudes is consistent with ground-based diagnostic algorithm evaluation studies (Ref. 1).
Health Parameter Estimation
The tuners produced by the RTAPM can be transformed to generate real-time engine health estimates. This study assumes that the engine health degrades slowly over time and engine health remains constant during a single flight profile. Therefore, a running average is used to estimate engine health at the conclusion of a flight profile. Additionally, the C-MAPSS nonlinear engine model uses a single set of health parameters regardless of operating point; the averaged health vectors transformed from the Kalman filter’s tuning parameter output can be compared directly against the nonlinear model’s input health parameters.
To evaluate the architecture’s performance trending capability, the final health parameter estimate reported by the architecture is collected from a significant sample of simulated engine histories. Each final health estimate represents the architecture’s trending of performance degradation over a brief history of ten takeoff-climb-cruise profiles. A residual value is computed based on the difference between the estimate for each engine calculated by the architecture and the simulated engine’s known health. The statistics of these residuals resulting from the evaluation of 500 engines are shown in Table 2. This implementation was designed using fleet average performance deterioration, which features approximately 3 percent efficiency and flow capacity losses on the high pressure compressor, often the most rapidly degrading component. The distribution of fleet engine health is presented in Reference 7. On average, the health estimates across all parameters are within 1 percent of the actual engine health. Although the Kalman filter has been optimized for the estimation of unmeasured output parameters, the
0 500 1000 1500 20000
20
40
Alti
tude
(K ft
)
Example Profile
0 500 1000 1500 20000
0.5
1
Mac
h #
0 500 1000 1500 200040
60
80
100
PLA
(deg
)
Time (s)
NASA/TM—2012-217279 11
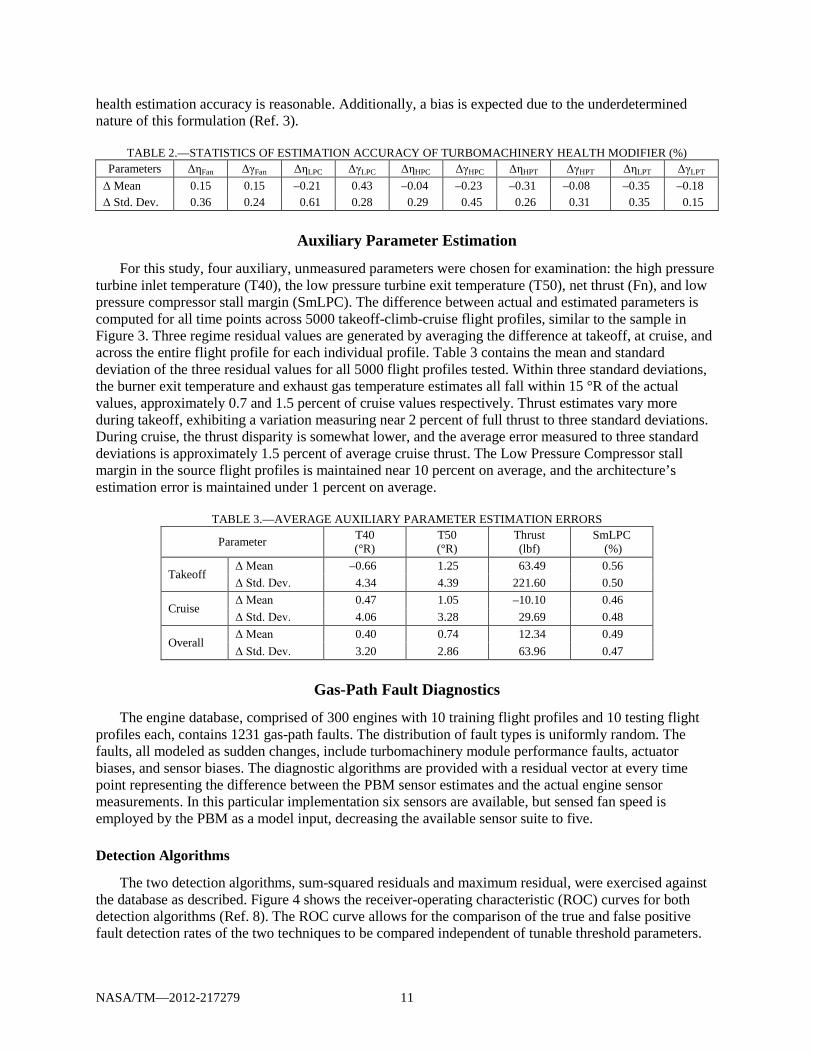
health estimation accuracy is reasonable. Additionally, a bias is expected due to the underdetermined nature of this formulation (Ref. 3).
TABLE 2.—STATISTICS OF ESTIMATION ACCURACY OF TURBOMACHINERY HEALTH MODIFIER (%) Parameters ΔηFan ΔγFan ΔηLPC ΔγLPC ΔηHPC ΔγHPC ΔηHPT ΔγHPT ΔηLPT ΔγLPT
Δ Mean 0.15 0.15 –0.21 0.43 –0.04 –0.23 –0.31 –0.08 –0.35 –0.18 Δ Std. Dev. 0.36 0.24 0.61 0.28 0.29 0.45 0.26 0.31 0.35 0.15
Auxiliary Parameter Estimation
For this study, four auxiliary, unmeasured parameters were chosen for examination: the high pressure turbine inlet temperature (T40), the low pressure turbine exit temperature (T50), net thrust (Fn), and low pressure compressor stall margin (SmLPC). The difference between actual and estimated parameters is computed for all time points across 5000 takeoff-climb-cruise flight profiles, similar to the sample in Figure 3. Three regime residual values are generated by averaging the difference at takeoff, at cruise, and across the entire flight profile for each individual profile. Table 3 contains the mean and standard deviation of the three residual values for all 5000 flight profiles tested. Within three standard deviations, the burner exit temperature and exhaust gas temperature estimates all fall within 15 °R of the actual values, approximately 0.7 and 1.5 percent of cruise values respectively. Thrust estimates vary more during takeoff, exhibiting a variation measuring near 2 percent of full thrust to three standard deviations. During cruise, the thrust disparity is somewhat lower, and the average error measured to three standard deviations is approximately 1.5 percent of average cruise thrust. The Low Pressure Compressor stall margin in the source flight profiles is maintained near 10 percent on average, and the architecture’s estimation error is maintained under 1 percent on average.
TABLE 3.—AVERAGE AUXILIARY PARAMETER ESTIMATION ERRORS
Parameter T40 (°R)
T50 (°R)
Thrust (lbf)
SmLPC (%)
Takeoff Δ Mean –0.66 1.25 63.49 0.56 Δ Std. Dev. 4.34 4.39 221.60 0.50
Cruise Δ Mean 0.47 1.05 –10.10 0.46 Δ Std. Dev. 4.06 3.28 29.69 0.48
Overall Δ Mean 0.40 0.74 12.34 0.49 Δ Std. Dev. 3.20 2.86 63.96 0.47
Gas-Path Fault Diagnostics
The engine database, comprised of 300 engines with 10 training flight profiles and 10 testing flight profiles each, contains 1231 gas-path faults. The distribution of fault types is uniformly random. The faults, all modeled as sudden changes, include turbomachinery module performance faults, actuator biases, and sensor biases. The diagnostic algorithms are provided with a residual vector at every time point representing the difference between the PBM sensor estimates and the actual engine sensor measurements. In this particular implementation six sensors are available, but sensed fan speed is employed by the PBM as a model input, decreasing the available sensor suite to five.
Detection Algorithms
The two detection algorithms, sum-squared residuals and maximum residual, were exercised against the database as described. Figure 4 shows the receiver-operating characteristic (ROC) curves for both detection algorithms (Ref. 8). The ROC curve allows for the comparison of the true and false positive fault detection rates of the two techniques to be compared independent of tunable threshold parameters.

NASA/TM—2012-217279 12
The maximum residual threshold technique in general performs better than a sum-squared residual technique in this particular application. The area under the ROC curve for the maximum residual threshold algorithm is 0.96, in contrast to the residual sum-squared algorithm’s area under the curve of 0.88. The detection rates all refer to detecting a fault during processing of the same flight profile in which the gas-path fault occurred.
The ROC analysis presented shows that, independent of threshold settings, the maximum residual detection algorithm performs better than the residual sum-squared algorithm. While maintaining a false positive rate of 1 percent, the maximum residual algorithm is able to achieve a true positive rate of 81 percent. Figure 5 shows the detection rates using the maximum residual algorithm as a function of the fault type. The algorithm performs well when detecting turbomachinery component faults. In contrast, Variable Bleed Valve faults often remain undetected due to the relatively small impact of such faults on gas-path sensor measurements.
Figure 4.—Comparison of Detection Techniques. The
ROC curves show the relative detection performance independent of threshold tuning.
Figure 5.—Detection Rates for the Maximum Residual Algorithm. The detection rate for the given algorithm is
dependent on both the fault type and the magnitudes of gas-path faults.
0 0.2 0.4 0.6 0.8 10
0.2
0.4
0.6
0.8
1
False Positive Rate
True
Pos
itive
Rat
e
Max ResidualSum-Squared Residuals

NASA/TM—2012-217279 13
Isolation Algorithms
The two isolation algorithms, inverse least-squares and neural networks, were evaluated using the same database. To quantify the ability to correctly classify gas-path faults, confusion matrices were constructed based on the results from processing the database of 300 engine histories. Only the fault cases correctly detected using the maximum residual detection algorithm with a threshold established to maintain a 1 percent false positive rate are considered. Table 4 and Table 5 present the fault isolation results for both isolation techniques. The values within the confusion matrices represent the fraction of correctly detected faults classified as the noted type; the fractions in each row should therefore sum to 1.0. Values residing on the diagonal represent correct classifications.
TABLE 4.—CONFUSION MATRIX FOR INVERSE LEAST-SQUARES CLASSIFIER
TABLE 5.—CONFUSION MATRIX FOR NEURAL NETWORK CLASSIFIER
Nf Nc P2 P24 Ps30 T2 T24 T48 Wf VBV VSV Fan LPC HPC HPT LPTNf 0. 95 0. 00 0. 00 0. 00 0. 00 0. 00 0. 00 0. 00 0. 00 0. 04 0. 00 0. 00 0. 01 0. 00 0. 00 0. 00Nc 0. 00 0. 70 0. 00 0. 00 0. 00 0. 00 0. 00 0. 00 0. 06 0. 00 0. 25 0. 00 0. 00 0. 00 0. 00 0. 00P2 0. 06 0. 00 0. 76 0. 04 0. 00 0. 00 0. 00 0. 00 0. 03 0. 00 0. 00 0. 10 0. 00 0. 00 0. 00 0. 00
P24 0. 00 0. 00 0. 03 0. 97 0. 00 0. 00 0. 00 0. 00 0. 00 0. 00 0. 00 0. 00 0. 00 0. 00 0. 00 0. 00Ps30 0. 00 0. 00 0. 00 0. 00 0. 98 0. 00 0. 00 0. 00 0. 02 0. 00 0. 00 0. 00 0. 00 0. 00 0. 00 0. 00
T2 0. 00 0. 00 0. 00 0. 00 0. 02 0. 98 0. 00 0. 00 0. 00 0. 00 0. 00 0. 00 0. 00 0. 00 0. 00 0. 00T24 0. 00 0. 00 0. 00 0. 00 0. 00 0. 00 0. 96 0. 00 0. 02 0. 00 0. 00 0. 00 0. 00 0. 00 0. 02 0. 00T48 0. 00 0. 00 0. 00 0. 00 0. 00 0. 00 0. 00 0. 99 0. 01 0. 00 0. 00 0. 00 0. 00 0. 00 0. 00 0. 00
Wf 0. 00 0. 00 0. 00 0. 00 0. 00 0. 00 0. 00 0. 00 1. 00 0. 00 0. 00 0. 00 0. 00 0. 00 0. 00 0. 00VBV 1. 00 0. 00 0. 00 0. 00 0. 00 0. 00 0. 00 0. 00 0. 00 0. 00 0. 00 0. 00 0. 00 0. 00 0. 00 0. 00VSV 0. 00 0. 21 0. 00 0. 00 0. 00 0. 00 0. 00 0. 00 0. 06 0. 00 0. 73 0. 00 0. 00 0. 00 0. 00 0. 00Fan 0. 02 0. 00 0. 05 0. 02 0. 00 0. 00 0. 00 0. 00 0. 05 0. 00 0. 00 0. 85 0. 03 0. 00 0. 00 0. 00
LPC 0. 09 0. 00 0. 04 0. 01 0. 00 0. 00 0. 00 0. 00 0. 03 0. 03 0. 00 0. 16 0. 65 0. 00 0. 00 0. 00HPC 0. 00 0. 00 0. 00 0. 00 0. 00 0. 00 0. 00 0. 00 0. 00 0. 00 0. 00 0. 00 0. 00 1. 00 0. 00 0. 00HPT 0. 00 0. 00 0. 00 0. 00 0. 00 0. 00 0. 00 0. 00 0. 00 0. 00 0. 00 0. 00 0. 00 0. 00 1. 00 0. 00LPT 0. 00 0. 00 0. 00 0. 00 0. 00 0. 00 0. 00 0. 00 0. 00 0. 00 0. 00 0. 00 0. 00 0. 00 0. 00 1. 00
Predicted Condition
Tru
e C
ondi
tion
Nf Nc P2 P24 Ps30 T2 T24 T48 Wf VBV VSV Fan LPC HPC HPT LPTNf 0. 87 0. 00 0. 01 0. 00 0. 00 0. 00 0. 00 0. 00 0. 01 0. 06 0. 00 0. 02 0. 02 0. 00 0. 00 0. 00Nc 0. 00 0. 43 0. 00 0. 00 0. 00 0. 00 0. 00 0. 00 0. 08 0. 00 0. 49 0. 00 0. 00 0. 00 0. 00 0. 00P2 0. 00 0. 00 0. 96 0. 00 0. 00 0. 00 0. 00 0. 00 0. 01 0. 00 0. 00 0. 03 0. 00 0. 00 0. 00 0. 00
P24 0. 01 0. 00 0. 01 0. 96 0. 00 0. 00 0. 00 0. 00 0. 00 0. 01 0. 00 0. 00 0. 00 0. 00 0. 00 0. 00Ps30 0. 00 0. 00 0. 00 0. 00 0. 96 0. 02 0. 00 0. 00 0. 02 0. 00 0. 00 0. 00 0. 00 0. 00 0. 00 0. 00
T2 0. 00 0. 00 0. 00 0. 00 0. 00 0. 95 0. 00 0. 00 0. 03 0. 00 0. 00 0. 00 0. 00 0. 00 0. 02 0. 00T24 0. 00 0. 00 0. 00 0. 00 0. 00 0. 00 0. 94 0. 00 0. 04 0. 00 0. 00 0. 00 0. 00 0. 00 0. 02 0. 00T48 0. 00 0. 00 0. 00 0. 00 0. 00 0. 00 0. 00 1. 00 0. 00 0. 00 0. 00 0. 00 0. 00 0. 00 0. 00 0. 00
Wf 0. 00 0. 00 0. 00 0. 00 0. 00 0. 00 0. 00 0. 00 1. 00 0. 00 0. 00 0. 00 0. 00 0. 00 0. 00 0. 00VBV 0. 00 0. 00 0. 50 0. 00 0. 00 0. 00 0. 00 0. 00 0. 00 0. 50 0. 00 0. 00 0. 00 0. 00 0. 00 0. 00VSV 0. 00 0. 15 0. 00 0. 00 0. 00 0. 00 0. 00 0. 00 0. 00 0. 00 0. 83 0. 00 0. 00 0. 00 0. 00 0. 02Fan 0. 00 0. 00 0. 20 0. 00 0. 00 0. 00 0. 00 0. 00 0. 05 0. 00 0. 00 0. 64 0. 12 0. 00 0. 00 0. 00
LPC 0. 06 0. 00 0. 16 0. 00 0. 00 0. 00 0. 00 0. 00 0. 03 0. 03 0. 00 0. 34 0. 38 0. 00 0. 00 0. 00HPC 0. 00 0. 00 0. 00 0. 00 0. 00 0. 00 0. 00 0. 00 0. 01 0. 00 0. 00 0. 00 0. 00 0. 98 0. 01 0. 00HPT 0. 00 0. 00 0. 00 0. 00 0. 00 0. 00 0. 00 0. 00 0. 01 0. 00 0. 00 0. 00 0. 00 0. 00 0. 99 0. 00LPT 0. 00 0. 00 0. 00 0. 00 0. 00 0. 00 0. 00 0. 00 0. 00 0. 00 0. 00 0. 00 0. 00 0. 00 0. 00 1. 00
Tru
e C
ondi
tion
Predicted Condition

NASA/TM—2012-217279 14
Both classifiers exhibit similar performance processing the given database of fault-containing flights. Two major confusion points stand out in both classifiers. Core speed (Nc) sensor faults and Variable Stator Vane (VSV) actuator faults are often confused by the algorithms. Additionally, Fan and Low Pressure Compressor (LPC) module performance faults are misclassified regularly. Confusion related to the Variable Bleed Valve faults may be misleading such fault cases are rarely detected given the VBV fault magnitudes considered in this study. Because both algorithms operate using significantly different classification strategies, these misclassifications common to both classification algorithms suggest that the signatures of the faults in this model do not allow for reliable discrimination.
The overall correct classification rates of detected faults for the inverse least-squares and neural network classifiers are 73 and 70 percent, respectively. The inverse least-squares technique performs marginally better than the neural network classifier. Specifically, the neural network classifier exhibits significant confusion with Fan and LPC turbomachinery performance faults, incorrectly classifying them as station 2 pressure (P2) sensor faults.
Conclusion A proposed on-board diagnostic architecture has been designed to improve parameter estimation
accuracy and fault detection and isolation by exploiting the availability of streaming engine sensor data. A real-time adaptive performance model based on a self-tuning Kalman filter provides streaming estimates of unmeasured engine and health parameters, while a separate performance baseline model utilizes recent past performance data to produce expected estimates of engine sensor measurements for diagnostic purposes. The implementation was evaluated against the Commercial Modular Aero Propulsion System Simulation, C-MAPSS. This nonlinear turbofan aerothermal model was updated with realistic sensor noise, and simulated engine fleets with brief histories and varying degradation levels were produced for processing by the diagnostic architecture. This diagnostic architecture was able to provide reasonable estimates of health and unmeasured engine parameters. Additionally, two detection algorithms were evaluated using the architecture. Receiver-operating characteristic curves showed detection using a maximum residual threshold technique to be superior to a sum-squared of sensor residuals technique. The maximum residual detection algorithm was combined with two fault classification algorithms, an inverse least-squares classifier and a neural network classifier, both exhibiting approximately 70 percent correct classification accuracy on detected faults. All detection and isolation results consider only conclusions arrived at during the processing of the fault-containing flight profile. The on-board diagnostic architecture has shown promise when evaluated using data generated by a nonlinear engine model. Access to streaming flight data allows for accurate fault detection rates while effectively decreasing detection latency to a single flight, in contrast to ground-based snapshot solutions, which may require multiple flights for fault detection. Although not tested, the availability of streaming data can allow for the capture and diagnosis of intermittent engine fault symptoms. Additional testing against actual engine flight data is also needed to validate the reliability and robustness of the design.
This study has discussed the architecture in an on-board application, but the design does not preclude its use in ground-based solutions. Given advances in data storage capacity and transfer bandwidth, full flight data may soon be available for download from aircraft for ground-based analysis. The enhanced architecture as described can also be employed to analyze retrieved flight data in a ground-based computing system for diagnostic purposes, effectively retaining the single flight latency and high accuracy in fault detection and isolation without the need to implement the architecture in an on-board system. While ground processing would eliminate the availability of streaming, unmeasured engine parameters during flight, the performance degradation trending and diagnostics would still be available to operators.

NASA/TM—2012-217279 15
References 1. Simon, D. L., Bird, J., Davison, C., Volponi, A., Iverson, E. R., “Benchmarking Gas Path Diagnostic
Methods: A Public Approach,” NASA/TM—2008-215271, 2008. 2. Simon, D. L., “An Integrated Architecture for Onboard Aircraft Engine Performance Trend
Monitoring and Gas Path Fault Diagnostics,” Proceedings of the 2010 JANNAF Joint Subcomittee Meeting, 2010.
3. Simon, D. L., Garg, S., ‘Optimal Tuner Selection for Kalman Filter-Based Aircraft Engine Performance Estimation,” Journal of Engineering for Gas Turbines and Power, vol. 132, March 2010.
4. Simon, D. L., Armstrong, J. B., Garg, S., “Application of an Optimal Tuner Selection Approach for On-Board Self-Tuning Engine Models,” Proceedings of the ASME Turbo Expo 2011, GT2011–46408, 2011.
5. Kreibich, J. A. Using SQLite. Sebastopol, CA: O'Reilly Media, 2010. 6. Frederick, D. K., DeCastro, J. A., Litt, J. S., “User’s Guide for the Commercial Modular Aero-
Propulsion System Simulation (C-MAPSS),” NASA/TM–2007-215026,2007. 7. Sallee, G. P., “Performance Deterioration Based on Existing (Historical) Data – JT9D Jet Engine
Diagnostics Program,” NASA Contractor Report CR–135448, Pratt & Whitney Aircraft Group Report PWA–5512–21, 1978.
8. Fawcett, T. “An Introduction to ROC Analysis,” Pattern Recognition Letters, v. 27, p. 861–874, 2006.
REPORT DOCUMENTATION PAGE Form Approved OMB No. 0704-0188
The public reporting burden for this collection of information is estimated to average 1 hour per response, including the time for reviewing instructions, searching existing data sources, gathering and maintaining the data needed, and completing and reviewing the collection of information. Send comments regarding this burden estimate or any other aspect of this collection of information, including suggestions for reducing this burden, to Department of Defense, Washington Headquarters Services, Directorate for Information Operations and Reports (0704-0188), 1215 Jefferson Davis Highway, Suite 1204, Arlington, VA 22202-4302. Respondents should be aware that notwithstanding any other provision of law, no person shall be subject to any penalty for failing to comply with a collection of information if it does not display a currently valid OMB control number. PLEASE DO NOT RETURN YOUR FORM TO THE ABOVE ADDRESS. 1. REPORT DATE (DD-MM-YYYY) 01-04-2012
2. REPORT TYPE Technical Memorandum
3. DATES COVERED (From - To)
4. TITLE AND SUBTITLE Implementation of an Integrated On-Board Aircraft Engine Diagnostic Architecture
5a. CONTRACT NUMBER
5b. GRANT NUMBER
5c. PROGRAM ELEMENT NUMBER
6. AUTHOR(S) Armstrong, Jeffrey, B.; Simon, Donald, L.
5d. PROJECT NUMBER
5e. TASK NUMBER
5f. WORK UNIT NUMBER WBS 284848.02.03.03.02.03
7. PERFORMING ORGANIZATION NAME(S) AND ADDRESS(ES) National Aeronautics and Space Administration John H. Glenn Research Center at Lewis Field Cleveland, Ohio 44135-3191
8. PERFORMING ORGANIZATION REPORT NUMBER E-18034
9. SPONSORING/MONITORING AGENCY NAME(S) AND ADDRESS(ES) National Aeronautics and Space Administration Washington, DC 20546-0001
10. SPONSORING/MONITOR'S ACRONYM(S) NASA
11. SPONSORING/MONITORING REPORT NUMBER NASA/TM-2012-217279
12. DISTRIBUTION/AVAILABILITY STATEMENT Unclassified-Unlimited Subject Category: 07 Available electronically at http://www.sti.nasa.gov This publication is available from the NASA Center for AeroSpace Information, 443-757-5802
13. SUPPLEMENTARY NOTES
14. ABSTRACT An on-board diagnostic architecture for aircraft turbofan engine performance trending, parameter estimation, and gas-path fault detection and isolation has been developed and evaluated in a simulation environment. The architecture incorporates two independent models: a real-time self-tuning performance model providing parameter estimates and a performance baseline model for diagnostic purposes reflecting long-term engine degradation trends. This architecture was evaluated using flight profiles generated from a nonlinear model with realistic fleet engine health degradation distributions and sensor noise. The architecture was found to produce acceptable estimates of engine health and unmeasured parameters, and the integrated diagnostic algorithms were able to perform correct fault isolation in approximately 70 percent of the tested cases. 15. SUBJECT TERMS Systems health monitoring; Gas turbine engines; Fault detection; Kalman filters
16. SECURITY CLASSIFICATION OF: 17. LIMITATION OF ABSTRACT UU
18. NUMBER OF PAGES
22
19a. NAME OF RESPONSIBLE PERSON STI Help Desk (email:[email protected])
a. REPORT U
b. ABSTRACT U
c. THIS PAGE U
19b. TELEPHONE NUMBER (include area code) 443-757-5802
Standard Form 298 (Rev. 8-98)Prescribed by ANSI Std. Z39-18