Embed Size (px)
Citation preview
Implementation of Holistic
Response-time Analysis in Rubus-ICE
Saad Mubeen*, Jukka Maki-Turja*† and Mikael Sjodin**Malardalen Real-Time Research Centre (MRTC), Malardalen University, Sweden
† Arcticus Systems, Jarfalla, Sweden
{saad.mubeen, jukka.maki-turja, mikael.sjodin}@mdh.se
Abstract
The process of implementing and integrating state-of-the-art real-timeanalysis techniques with an existing industrial tool suite for the devel-opment of Distributed Real-time Embedded (DRE) systems offers manychallenges. The implementer has to not only code and implement theanalysis in the tool suite, but also deal with several issues. In this pa-per we present an implementation of the Holistic Response-Time Analysis(HRTA) as a plug-in for an industrial tool suite Rubus-ICE that is usedfor the component based development of DRE systems. We discuss andsolve the issues encountered and highlight the experiences gained duringthe process of implementation, integration and evaluation of HRTA plug-in. We provide a proof of concept by modeling an automotive application(autonomous cruise control system) using component-based developmentand analyzing it with HRTA plug-in.Keywords : Distributed real-time embedded systems; holistic response-time analysis; component-based development.
1 Introduction
In order to provide evidence that each action in the system will meet its dead-line, a priori analysis techniques, also known as schedulability analysis tech-niques, have been developed by the research community. Response Time Anal-ysis (RTA) [1, 2] is one of the methods to check the schedulability of a sys-tem. It calculates upper bounds on response times of tasks or messages ina real-time system or a network respectively. Holistic Response-Time Analysis(HRTA) [3, 4, 5] is an academic well established schedulability analysis techniqueto calculate upper bounds on the response times of event chains (distributedtransactions) in a distributed real-time system. The process of transferringsuch academic research results to industrial use can be challenging.
A tool chain for the industrial development of component-based DistributedReal-time Embedded (DRE) systems consists of a number of tools such as de-signer, compiler, builder, debugger, inspector, analyzer, coder, simulator, syn-thesizer, etc. Often, a tool chain may comprise of tools that are developed bydifferent tool vendors. The implementation of state-of-the-art complex real-timeanalysis techniques such as RTA, HRTA, etc. in such a tool chain is non-trivial
because there are several issues that are encountered apart from merely codingand testing the analysis algorithms.
1.1 Goals and Paper Contributions
In this paper, we discuss the implementation of HRTA as a standalone plug-in in the industrial tool suite Rubus-ICE (Integrated Component developmentEnvironment) [6]. Our goals in this paper are as follows.
1. Report on transferring state-of-the-art real-time analysis results, i.e., holis-tic response-time analysis for the industrial use.
2. Discuss and solve several issues encountered during the implementation,integration and evaluation of HRTA as a plug-in for Rubus-ICE.
3. Discuss the experiences gained during the implementation, integration andevaluation of HRTA plug-in.
4. Provide a proof of concept by conducting an automotive industrial casestudy.
We believe that most of the implementation issues discussed in this paper aregenerally applicable when real-time analysis is transferred to any industrial oracademic tool suite. Moreover, the contributions in this paper may provideguidance for the implementation of other complex real-time analysis techniquesin any industrial tool suite that supports a plug-in framework (for the integrationof new tools) and component-based development of DRE systems.
1.2 Paper Layout
The rest of the paper is organized as follows. Section II presents the backgroundand related work. Section III discusses the implemented analysis. Section IVdescribes the experiences gained and issues encountered during the implementa-tion of HRTA. Section V presents a test plan. In Section VI, we present an au-tomotive case study by modeling and analyzing a DRE application. Section VIIconcludes the paper and presents the future work.
2 Background and Related Work
2.1 The Rubus Concept
Rubus is a collection of methods and tools for model- and component-based de-velopment of dependable embedded real-time systems. Rubus is developed byArcticus Systems [6] in close collaboration with several academic and industrialpartners. Rubus is today mainly used for development of control functionalityin vehicles. The Rubus concept is based around the Rubus Component Model(RCM) [7] and its development environment Rubus-ICE, which includes model-ing tools, code generators, analysis tools and run-time infrastructure. The over-all goal of Rubus is to be aggressively resource efficient and to provide means fordeveloping predictable and analyzable control functions in resource-constrainedembedded systems.
RCM expresses the infrastructure for software functions, i.e., the interactionbetween software functions in terms of data and control flow separately. Thecontrol flow is expressed by triggering objects such as internal periodic clocks,interrupts, internal and external events. In RCM, the basic component is calledSoftware Circuit (SWC). The execution semantics of an SWC is simply: upontriggering, read data on data in-ports; execute the function; write data on dataout-ports; and activate the output trigger. Recently, we extended RCM for thedevelopment of DRE systems by introducing new components [8, 9]. A detailedcomparison of RCM with several component models is presented in [8].
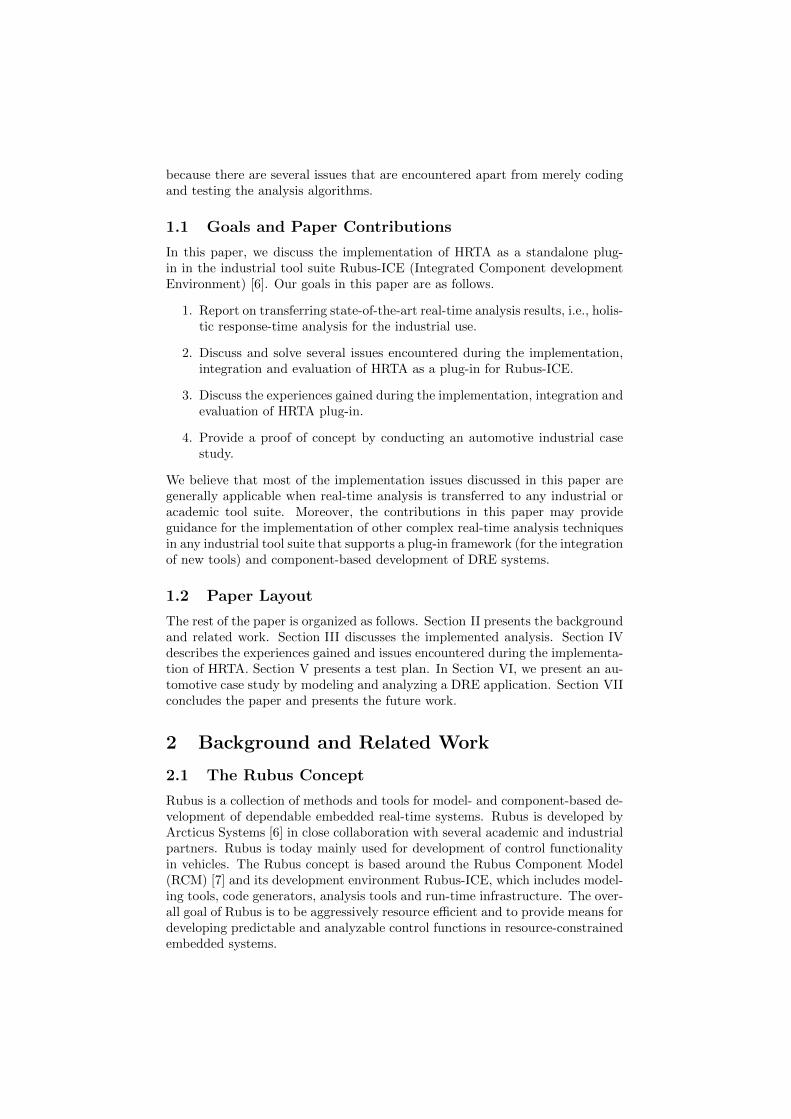
Figure 1 depicts the sequence of main steps followed in Rubus-ICE frommodeling of an application to the generation of code. The component-baseddesign of an application is modeled in the Rubus Designer tool. Then thecompiler compiles the design model into an Intermediate Compiled ComponentModel (ICCM). After that the builder tool sequentially runs a set of plug-ins.Finally, a coder tool generates the code.
API Calls
Analysis Algorithms
API Calls
User Interaction
Error Handling
API CallsAnalysis
Algorithms
User Interaction
Error Handling
API Calls
Designer Compiler Builder Coder
XML XML
Plug-ins
ICCM Code
Figure 1: Sequence of steps from design to code generation in Rubus-ICE
2.2 Plug-in Framework in Rubus-ICE
The plug-in framework in Rubus-ICE [10] facilitates the implementation ofstate-of-the-art research results in an isolation (without needing Rubus tools)and their integration as add-on plug-ins (as binaries or source code) with theintegrated development environment. A plug-in is interfaced with a buildertool as shown in Figure 1. The plug-ins are executed sequentially which meansthat the next plug-in can execute only when the previous plug-in has run tocompletion. Hence, each plug-in reads required attributes as an input, runs tocompletion and finally writes the results to ICCM file. An Application Program-ming Interface (API) defines the services required and provided by a plug-in.Each plug-in specifies the supported system model, required inputs, providedoutputs, error handling mechanisms and a user interface. Figure 2 shows aconceptual organization of a Rubus-ICE plug-in.
API Calls
Analysis Algorithms
API Calls
User Interaction
Error Handling
API CallsAnalysis
Algorithms
User Interaction
Error Handling
API Calls
Figure 2: Conceptual organization of a plug-in in Rubus-ICE
2.3 Response-Time Analysis
2.3.1 RTA of Tasks in a Node
Liu and Layland [11] provided theoretical foundation for analysis of fixed-priority scheduled systems. Joseph and Pandya published the first RTA [12]for the simple task model presented by Liu and Layland which assumes inde-pendent periodic tasks. Subsequently, it has been applied and extended in anumber of ways by the research community such as, lifting independent task as-sumption, analysis of communication networks, analyzing distributed systems,modeling of operating systems overheads, reducing pessimism from traditionalRTA, making RTA faster and tighter, etc. RTA [1, 2] has become a powerful,mature and well established schedulability analysis technique. In crux, RTAis used to perform a schedulability test which means it checks whether or nottasks in the system will satisfy their deadlines. RTA applies to systems wheretasks are scheduled with respect to their priorities and which is the predominantscheduling technique used in real-time operating systems today [13]. In [13], itis claimed that amongst the more traditional, analytical, schedulability analysistechniques, RTA of tasks with offsets stands out as the prime candidate becauseof its better precision and ability to analyze quite complex system behaviors.
Tindell [4] developed the schedulability analysis for tasks with offsets forfixed-priority systems and it was further extended by Palencia and GonzalezHarbour [5]. Later, Maki-Turja and Nolin [14] reduced pessimism from RTAdeveloped in [4, 5] and presented a tighter RTA for tasks with offsets by ac-curately modeling inter-task interference. We implemented RTA of tasks withoffsets [14] as part of HRTA plug-in.
2.3.2 RTA of Messages in a Network
There are many protocols such as, CAN (Controller Area Network), TTCAN(Time-Triggered CAN), FlexRay, etc., that are used for real-time communica-tion in distributed real-time systems. In this paper, we will focus only on CANand its high-level protocols. Tindell et al. [15] developed the schedulabilityanalysis of CAN by adapting the theory of fixed-priority preemptive schedulingfor uniprocessor systems. This analysis has served as a basis for many researchprojects. Later on, this analysis was revisited and revised by Davis et al. [16].
2.3.3 HRTA
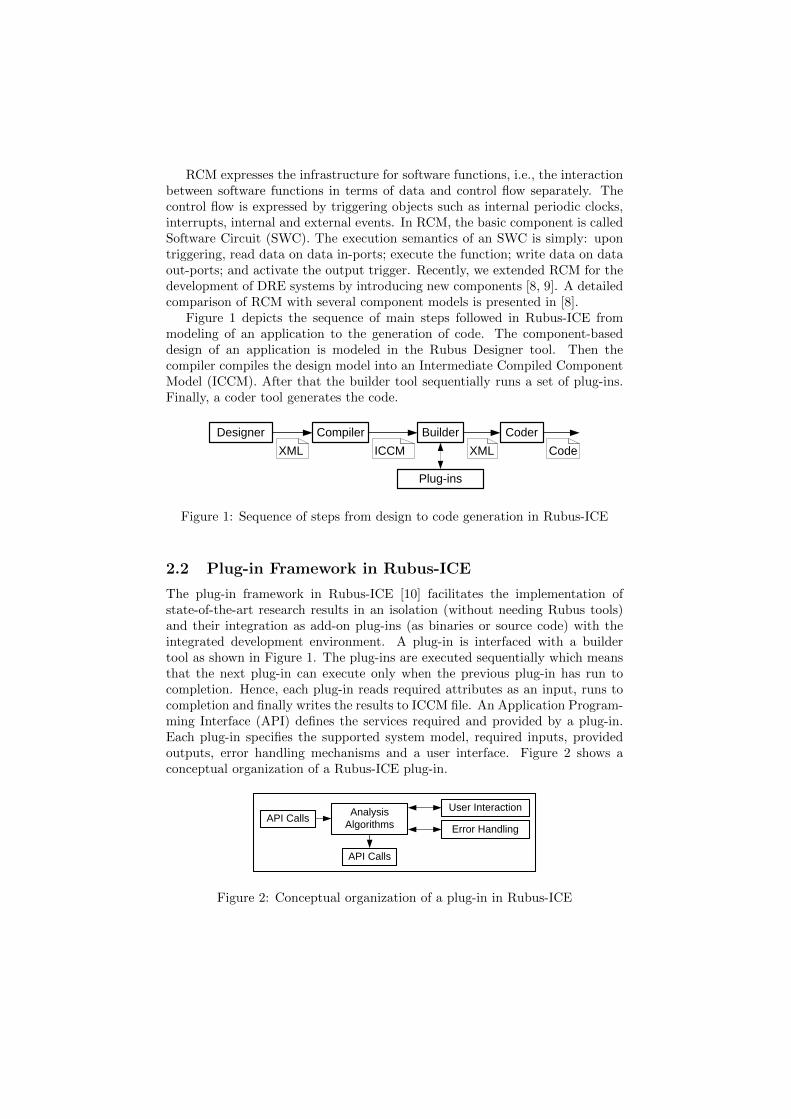
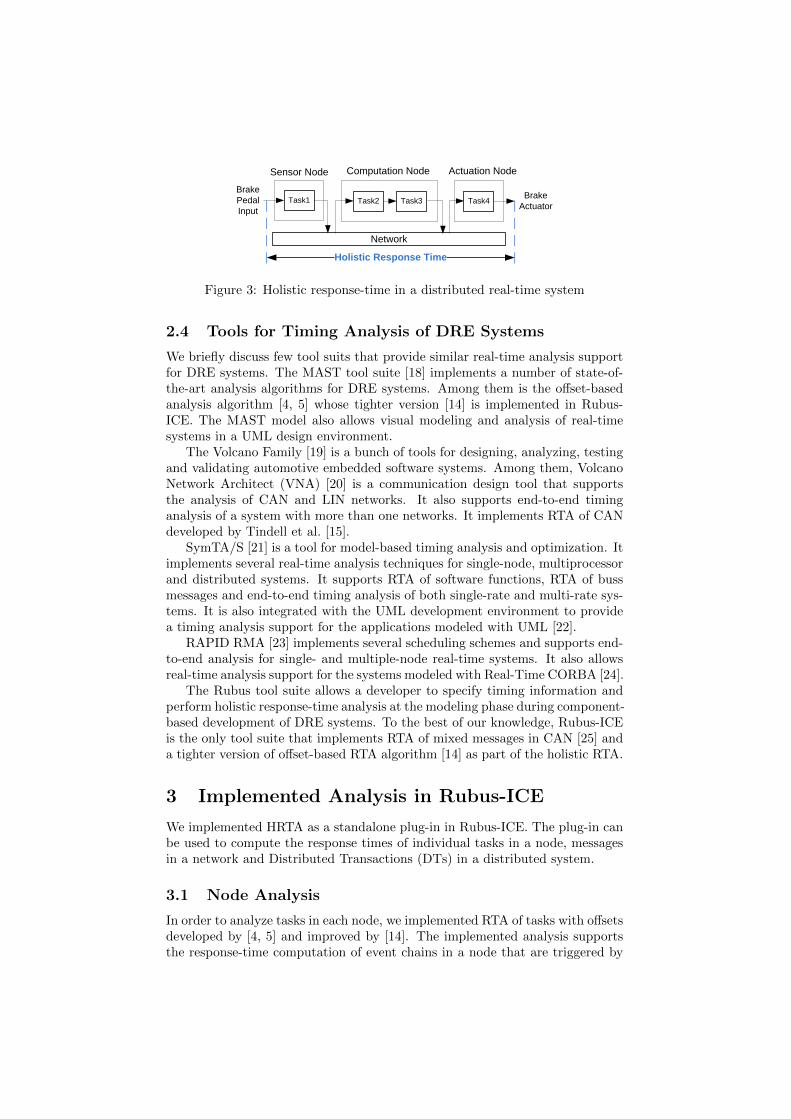
It combines the analysis of nodes (uniprocessors) and a network. Hence, itcomputes the response times of event chains that are distributed over severalnodes in a DRE system. In this paper, we consider the timing model thatcorresponds to the holistic schedulability analysis for distributed hard real-timesystems [3]. An example distributed transaction in a DRE system is shown inFigure 3. The holistic response time is equal to the elapsed time between theactivation of Task1 in the Sensor Node (corresponds to the arrival of brake pedalinput) and the completion of Task4 in the Actuation Node (corresponds to theproduction of a signal for brake actuation).
In [17], we discussed our preliminary findings about the implementationissues that are encountered when HRTA is transferred to industrial tool suit.
Node RTA Plug-in
Rubus Builder
Algorithms for RTA of Tasks in a Node
Node Timing Information
Network RTA Plug-in
Algorithms for RTA of messages in a Network
Network Timing Information
HRTA Plug-in
Algorithms for HRTA
End-to-endTiming Information
Rubus Builder
HRTA Plug-in
Algorithms for RTA of Tasks
in a Node
Algorithms for RTA of messages
in a Network
Algorithms for HRTA
End-to-endTiming Information
Analysis Results
Analysis Results Analysis Results
Analysis Results
Option A Option B
Task1 Task2 Task3 Task4
Network
Sensor Node Computation Node Actuation Node
Holistic Response Time
Brake Pedal Input
Brake Actuator
Figure 3: Holistic response-time in a distributed real-time system
2.4 Tools for Timing Analysis of DRE Systems
We briefly discuss few tool suits that provide similar real-time analysis supportfor DRE systems. The MAST tool suite [18] implements a number of state-of-the-art analysis algorithms for DRE systems. Among them is the offset-basedanalysis algorithm [4, 5] whose tighter version [14] is implemented in Rubus-ICE. The MAST model also allows visual modeling and analysis of real-timesystems in a UML design environment.
The Volcano Family [19] is a bunch of tools for designing, analyzing, testingand validating automotive embedded software systems. Among them, VolcanoNetwork Architect (VNA) [20] is a communication design tool that supportsthe analysis of CAN and LIN networks. It also supports end-to-end timinganalysis of a system with more than one networks. It implements RTA of CANdeveloped by Tindell et al. [15].
SymTA/S [21] is a tool for model-based timing analysis and optimization. Itimplements several real-time analysis techniques for single-node, multiprocessorand distributed systems. It supports RTA of software functions, RTA of bussmessages and end-to-end timing analysis of both single-rate and multi-rate sys-tems. It is also integrated with the UML development environment to providea timing analysis support for the applications modeled with UML [22].
RAPID RMA [23] implements several scheduling schemes and supports end-to-end analysis for single- and multiple-node real-time systems. It also allowsreal-time analysis support for the systems modeled with Real-Time CORBA [24].
The Rubus tool suite allows a developer to specify timing information andperform holistic response-time analysis at the modeling phase during component-based development of DRE systems. To the best of our knowledge, Rubus-ICEis the only tool suite that implements RTA of mixed messages in CAN [25] anda tighter version of offset-based RTA algorithm [14] as part of the holistic RTA.
3 Implemented Analysis in Rubus-ICE
We implemented HRTA as a standalone plug-in in Rubus-ICE. The plug-in canbe used to compute the response times of individual tasks in a node, messagesin a network and Distributed Transactions (DTs) in a distributed system.
3.1 Node Analysis
In order to analyze tasks in each node, we implemented RTA of tasks with offsetsdeveloped by [4, 5] and improved by [14]. The implemented analysis supportsthe response-time computation of event chains in a node that are triggered by
a single event or a clock (single-rate system) as well as by multiple events orclocks with independent activations (multi-rate system).
3.2 Network Analysis
We implemented a network RTA that supports the analysis of CAN and itshigh-level protocols. It is based on the following RTA profiles for CAN.
1. RTA of CAN [15, 16].
2. RTA of CAN for mixed messages [25].
The above analysis assumes that the CAN nodes implement priority-orderedqueues. The next step will be the implementation of CAN analysis that alsosupports FIFO ordered queues, i.e., RTA of CAN with FIFO queues [26] andRTA of CAN with FIFO Queues for Mixed Messages [27].
3.3 Holistic Analysis
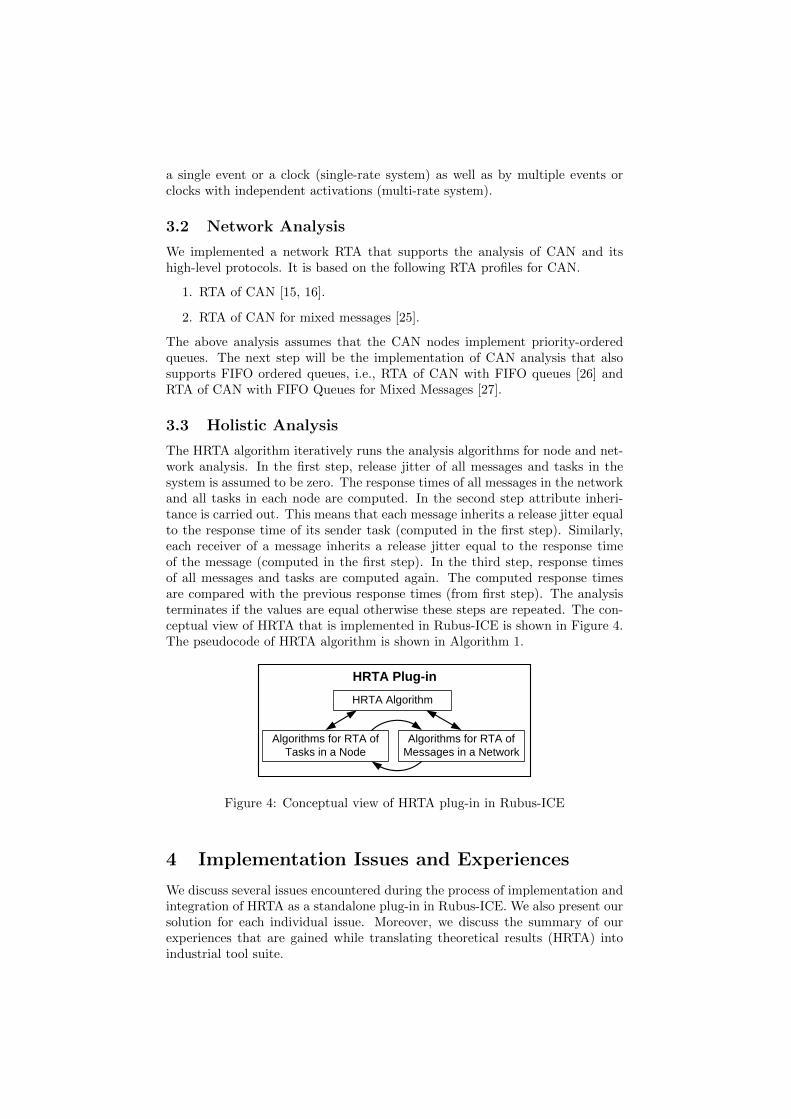
The HRTA algorithm iteratively runs the analysis algorithms for node and net-work analysis. In the first step, release jitter of all messages and tasks in thesystem is assumed to be zero. The response times of all messages in the networkand all tasks in each node are computed. In the second step attribute inheri-tance is carried out. This means that each message inherits a release jitter equalto the response time of its sender task (computed in the first step). Similarly,each receiver of a message inherits a release jitter equal to the response timeof the message (computed in the first step). In the third step, response timesof all messages and tasks are computed again. The computed response timesare compared with the previous response times (from first step). The analysisterminates if the values are equal otherwise these steps are repeated. The con-ceptual view of HRTA that is implemented in Rubus-ICE is shown in Figure 4.The pseudocode of HRTA algorithm is shown in Algorithm 1.
Designer
Compiler
Builder
Coder
XML
ICCM
XML
Code
HRTA Plug-in
Algorithms for RTA of Tasks
in a Node
Algorithms for RTA of messages
in a Network
Algorithms for HRTA
Designer
Compiler
Builder
Coder
XML
ICCM
XML
Code
HRTA Plug-in
Algorithms for RTA of Tasks
in a Node
Algorithms for RTA of messages
in a Network
HRTA Algorithm
HRTA Plug-in
Algorithms for RTA of Tasks in a Node
Algorithms for RTA of Messages in a Network
HRTA Algorithm
Figure 4: Conceptual view of HRTA plug-in in Rubus-ICE
4 Implementation Issues and Experiences
We discuss several issues encountered during the process of implementation andintegration of HRTA as a standalone plug-in in Rubus-ICE. We also present oursolution for each individual issue. Moreover, we discuss the summary of ourexperiences that are gained while translating theoretical results (HRTA) intoindustrial tool suite.
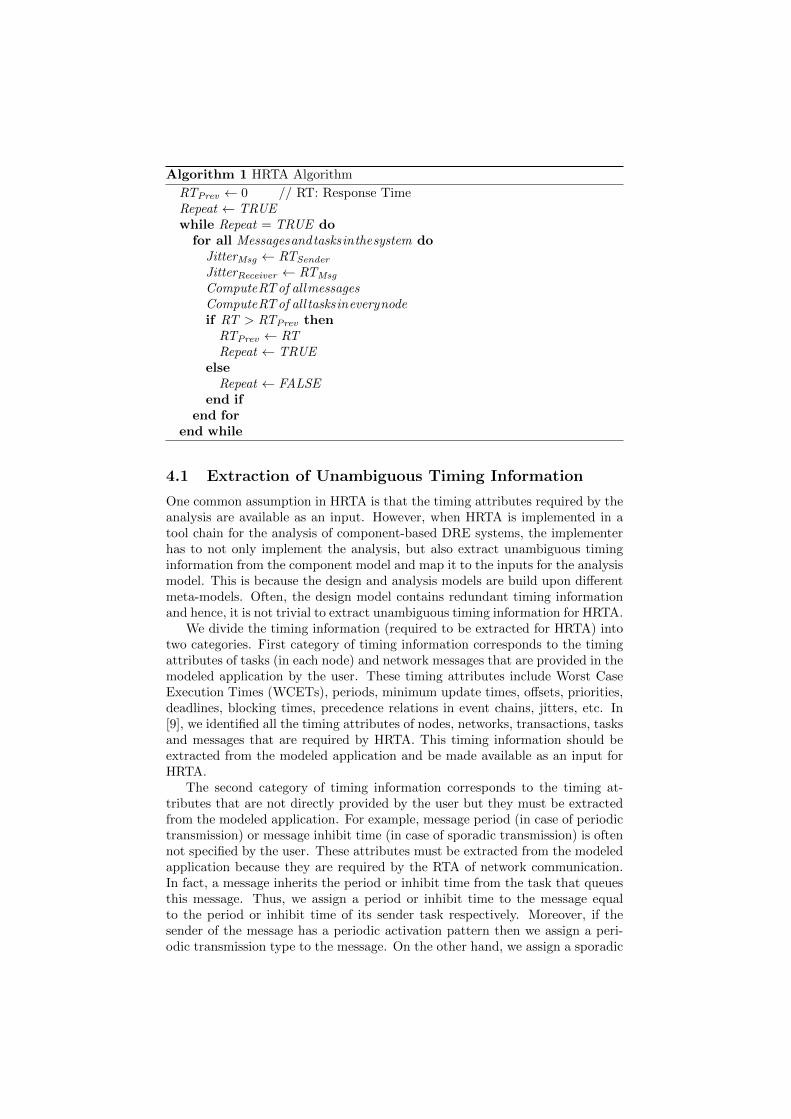
Algorithm 1 HRTA Algorithm
RTPrev ← 0 // RT: Response TimeRepeat ← TRUEwhile Repeat = TRUE dofor all Messagesandtasksinthesystem do
JitterMsg ← RTSender
JitterReceiver ← RTMsg
ComputeRTof allmessagesComputeRTof all tasksineverynodeif RT > RTPrev thenRTPrev ← RTRepeat ← TRUE
elseRepeat ← FALSE
end ifend for
end while
4.1 Extraction of Unambiguous Timing Information
One common assumption in HRTA is that the timing attributes required by theanalysis are available as an input. However, when HRTA is implemented in atool chain for the analysis of component-based DRE systems, the implementerhas to not only implement the analysis, but also extract unambiguous timinginformation from the component model and map it to the inputs for the analysismodel. This is because the design and analysis models are build upon differentmeta-models. Often, the design model contains redundant timing informationand hence, it is not trivial to extract unambiguous timing information for HRTA.
We divide the timing information (required to be extracted for HRTA) intotwo categories. First category of timing information corresponds to the timingattributes of tasks (in each node) and network messages that are provided in themodeled application by the user. These timing attributes include Worst CaseExecution Times (WCETs), periods, minimum update times, offsets, priorities,deadlines, blocking times, precedence relations in event chains, jitters, etc. In[9], we identified all the timing attributes of nodes, networks, transactions, tasksand messages that are required by HRTA. This timing information should beextracted from the modeled application and be made available as an input forHRTA.
The second category of timing information corresponds to the timing at-tributes that are not directly provided by the user but they must be extractedfrom the modeled application. For example, message period (in case of periodictransmission) or message inhibit time (in case of sporadic transmission) is oftennot specified by the user. These attributes must be extracted from the modeledapplication because they are required by the RTA of network communication.In fact, a message inherits the period or inhibit time from the task that queuesthis message. Thus, we assign a period or inhibit time to the message equalto the period or inhibit time of its sender task respectively. Moreover, if thesender of the message has a periodic activation pattern then we assign a peri-odic transmission type to the message. On the other hand, we assign a sporadic
transmission type to a message if its sender task bears a sporadic activationpattern.
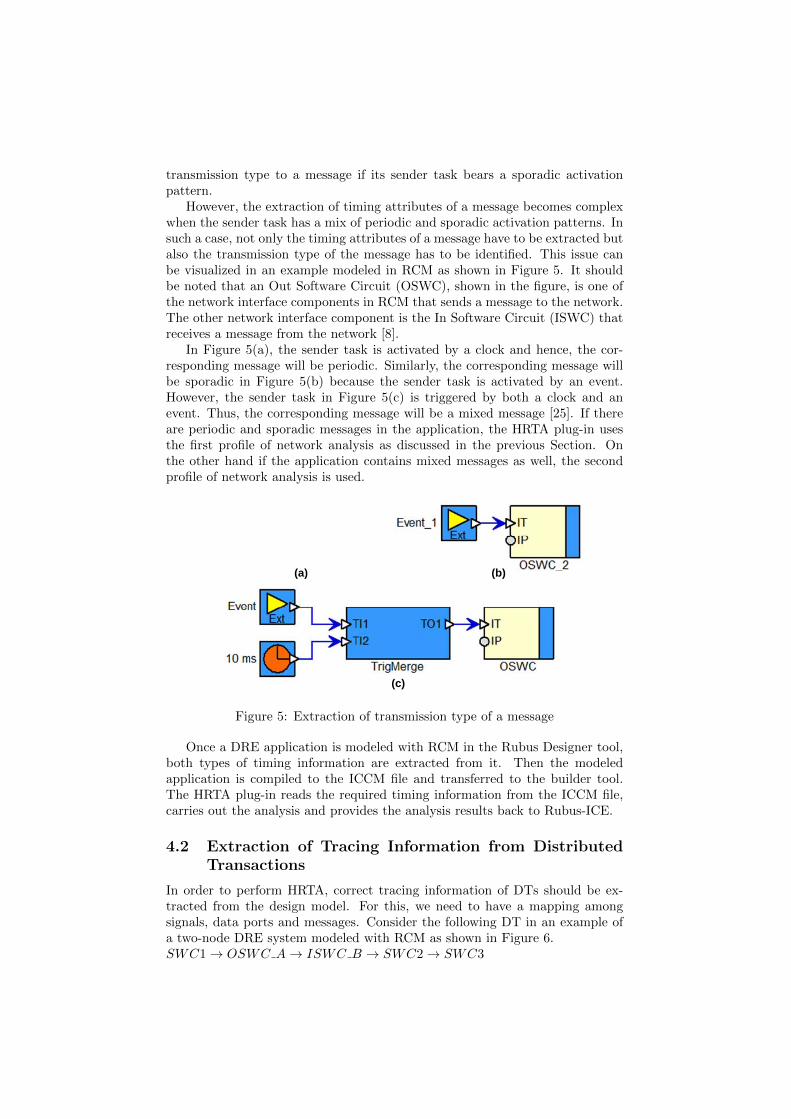
However, the extraction of timing attributes of a message becomes complexwhen the sender task has a mix of periodic and sporadic activation patterns. Insuch a case, not only the timing attributes of a message have to be extracted butalso the transmission type of the message has to be identified. This issue canbe visualized in an example modeled in RCM as shown in Figure 5. It shouldbe noted that an Out Software Circuit (OSWC), shown in the figure, is one ofthe network interface components in RCM that sends a message to the network.The other network interface component is the In Software Circuit (ISWC) thatreceives a message from the network [8].
In Figure 5(a), the sender task is activated by a clock and hence, the cor-responding message will be periodic. Similarly, the corresponding message willbe sporadic in Figure 5(b) because the sender task is activated by an event.However, the sender task in Figure 5(c) is triggered by both a clock and anevent. Thus, the corresponding message will be a mixed message [25]. If thereare periodic and sporadic messages in the application, the HRTA plug-in usesthe first profile of network analysis as discussed in the previous Section. Onthe other hand if the application contains mixed messages as well, the secondprofile of network analysis is used.
(c)
(a) (b)
Figure 5: Extraction of transmission type of a message
Once a DRE application is modeled with RCM in the Rubus Designer tool,both types of timing information are extracted from it. Then the modeledapplication is compiled to the ICCM file and transferred to the builder tool.The HRTA plug-in reads the required timing information from the ICCM file,carries out the analysis and provides the analysis results back to Rubus-ICE.
4.2 Extraction of Tracing Information from DistributedTransactions
In order to perform HRTA, correct tracing information of DTs should be ex-tracted from the design model. For this, we need to have a mapping amongsignals, data ports and messages. Consider the following DT in an example ofa two-node DRE system modeled with RCM as shown in Figure 6.SWC1→ OSWC A→ ISWC B → SWC2→ SWC3

In this example, our focus is on the network interface components, i.e.,OSWC and ISWC [8]. In order to compute holistic response time of this DT, weneed to extract tracing information from the component model. We identifieda need for the following mappings in the component model.
• At the sender node, mapping between signals and input data ports ofOSWC components.
• At the sender node, mapping between signals and a message that is sentto the network.
• At the receiver node, mapping between data output ports of ISWC com-ponents and the signals to be sent to the desired components.
• At the receiver node, mapping between message received from the networkand the signals to be sent to the desired component.
• Mapping between multiple signals and a complex data port. For example,mapping of multiple signals extracted from a received message to a dataport that sends a complex signal (structure of signals).
• Mapping of all trigger ports of network interface components along a DTas shown by a bidirectional arrow in Figure 6.
Controller Area Network (CAN)
Node A
Signals
SWC3
OSWC A1
CAN SEND
Ext
messages
Signals
ISWC B1
SWC5 SWC6
CAN RECEIVE
Node BData Port
Trigger Port
External Event
Ext
Data Source
Data Sink
Controller Area Network (CAN)
Node A
Signals
SWC1
OSWC_A
CAN SEND
Ext
messages
Signals
ISWC_B
SWC2 SWC3
CAN RECEIVE
Node BData Port
Trigger Port
External Event
Ext
Data Source
Data Sink
Figure 6: Two-node DRE system modeled in RCM
4.3 Impact of Design Decisions in Component Model onthe Implementation of Analysis
Design decisions made in the component model can have indirect impact onthe response times computed by the analysis. For example, design decisionscould have impact on WCETs and blocking times which in turn have impacton the response times. In order to implement, integrate and test HRTA, theimplementer needs to understand the design model (component model), analysismodel and run-time translation of the design model. In the design model, thearchitecture of an application is described in terms of software components,their interactions and software architectures. Whereas in the analysis model,the application is defined in terms of tasks, transactions, messages and timingparameters. At run-time, a task may correspond to a single component or chainof components. The run-time translation of a software component may differamong different component models.
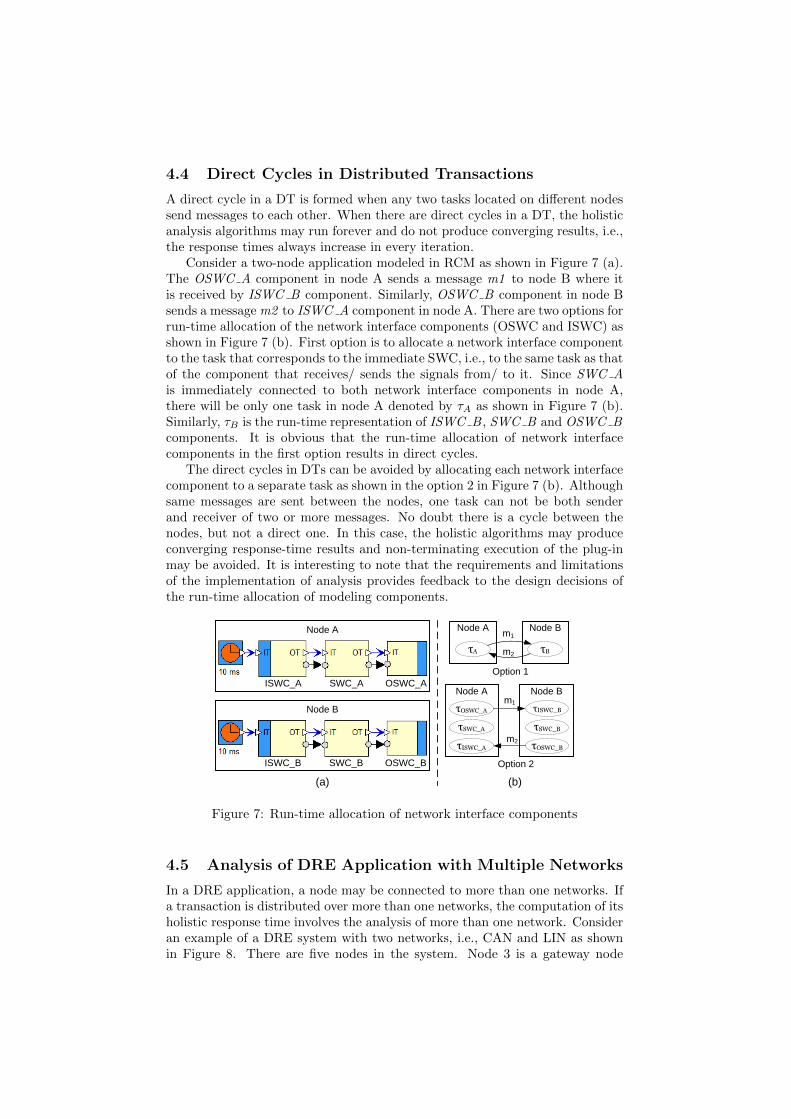
4.4 Direct Cycles in Distributed Transactions
A direct cycle in a DT is formed when any two tasks located on different nodessend messages to each other. When there are direct cycles in a DT, the holisticanalysis algorithms may run forever and do not produce converging results, i.e.,the response times always increase in every iteration.
Consider a two-node application modeled in RCM as shown in Figure 7 (a).The OSWC A component in node A sends a message m1 to node B where itis received by ISWC B component. Similarly, OSWC B component in node Bsends a message m2 to ISWC A component in node A. There are two options forrun-time allocation of the network interface components (OSWC and ISWC) asshown in Figure 7 (b). First option is to allocate a network interface componentto the task that corresponds to the immediate SWC, i.e., to the same task as thatof the component that receives/ sends the signals from/ to it. Since SWC Ais immediately connected to both network interface components in node A,there will be only one task in node A denoted by τA as shown in Figure 7 (b).Similarly, τB is the run-time representation of ISWC B , SWC B and OSWC Bcomponents. It is obvious that the run-time allocation of network interfacecomponents in the first option results in direct cycles.
The direct cycles in DTs can be avoided by allocating each network interfacecomponent to a separate task as shown in the option 2 in Figure 7 (b). Althoughsame messages are sent between the nodes, one task can not be both senderand receiver of two or more messages. No doubt there is a cycle between thenodes, but not a direct one. In this case, the holistic algorithms may produceconverging response-time results and non-terminating execution of the plug-inmay be avoided. It is interesting to note that the requirements and limitationsof the implementation of analysis provides feedback to the design decisions ofthe run-time allocation of modeling components.
(c)
(a) (b)
Node B
ISWC_B OSWC_BSWC_B
Node A
ISWC_A OSWC_ASWC_A
m2
Node B
τSWC_B
τOSWC_B
τISWC_B
Node A
τSWC_A
τISWC_A
τOSWC_A
Option 2
Node B
τB
Node A
τA
Option 1
m1
m2
m1
(a) (b)
Figure 7: Run-time allocation of network interface components
4.5 Analysis of DRE Application with Multiple Networks
In a DRE application, a node may be connected to more than one networks. Ifa transaction is distributed over more than one networks, the computation of itsholistic response time involves the analysis of more than one network. Consideran example of a DRE system with two networks, i.e., CAN and LIN as shownin Figure 8. There are five nodes in the system. Node 3 is a gateway node
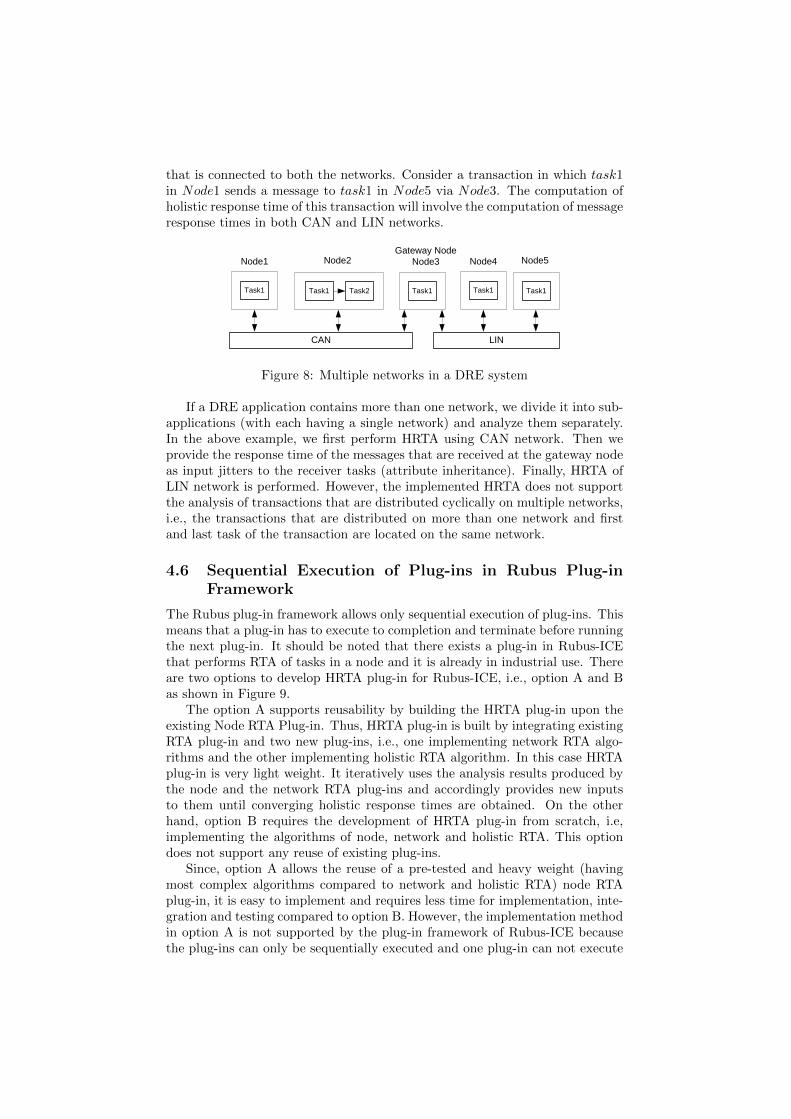
that is connected to both the networks. Consider a transaction in which task1in Node1 sends a message to task1 in Node5 via Node3. The computation ofholistic response time of this transaction will involve the computation of messageresponse times in both CAN and LIN networks.
Controller Area Network (CAN)
Data Port
Trigger Port
External Event
Clock
Ext
Data Source
Data Sink
Node B
End-to-end Response Time
SWC4 SWC5
CAN RECEIVE CAN SEND
ISWC B1
OSWC B1
SWC6
Ext
Inside the Model
Outside the Model
FramesFrames
Signals
CAN SEND
OSWC A1
Node A
SWC1 SWC2
SWC3
CAN RECEIVE
ISWC A1
FramesFrames
SignalsSignals
Signals
Task1 Task1 Task2 Task1
CAN
Node1 Node2Gateway Node
Node3
Task1
LIN
Node4 Node5
Task1
Figure 8: Multiple networks in a DRE system
If a DRE application contains more than one network, we divide it into sub-applications (with each having a single network) and analyze them separately.In the above example, we first perform HRTA using CAN network. Then weprovide the response time of the messages that are received at the gateway nodeas input jitters to the receiver tasks (attribute inheritance). Finally, HRTA ofLIN network is performed. However, the implemented HRTA does not supportthe analysis of transactions that are distributed cyclically on multiple networks,i.e., the transactions that are distributed on more than one network and firstand last task of the transaction are located on the same network.
4.6 Sequential Execution of Plug-ins in Rubus Plug-inFramework
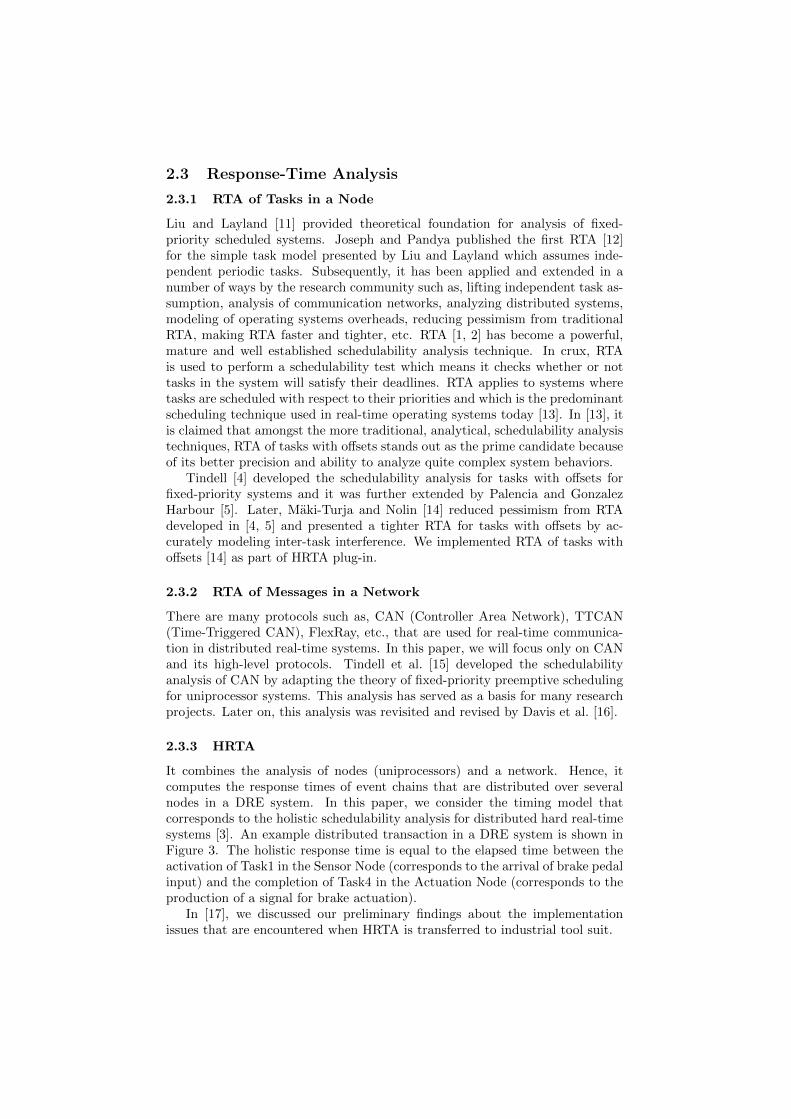
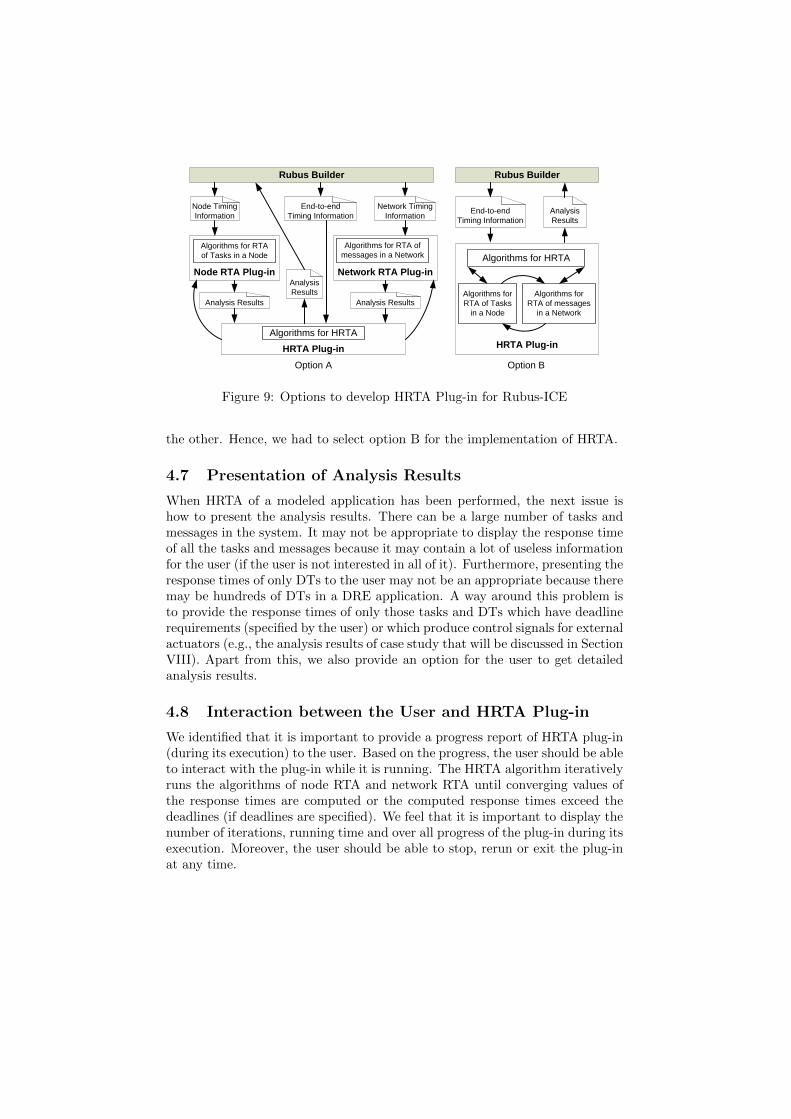
The Rubus plug-in framework allows only sequential execution of plug-ins. Thismeans that a plug-in has to execute to completion and terminate before runningthe next plug-in. It should be noted that there exists a plug-in in Rubus-ICEthat performs RTA of tasks in a node and it is already in industrial use. Thereare two options to develop HRTA plug-in for Rubus-ICE, i.e., option A and Bas shown in Figure 9.
The option A supports reusability by building the HRTA plug-in upon theexisting Node RTA Plug-in. Thus, HRTA plug-in is built by integrating existingRTA plug-in and two new plug-ins, i.e., one implementing network RTA algo-rithms and the other implementing holistic RTA algorithm. In this case HRTAplug-in is very light weight. It iteratively uses the analysis results produced bythe node and the network RTA plug-ins and accordingly provides new inputsto them until converging holistic response times are obtained. On the otherhand, option B requires the development of HRTA plug-in from scratch, i.e,implementing the algorithms of node, network and holistic RTA. This optiondoes not support any reuse of existing plug-ins.
Since, option A allows the reuse of a pre-tested and heavy weight (havingmost complex algorithms compared to network and holistic RTA) node RTAplug-in, it is easy to implement and requires less time for implementation, inte-gration and testing compared to option B. However, the implementation methodin option A is not supported by the plug-in framework of Rubus-ICE becausethe plug-ins can only be sequentially executed and one plug-in can not execute
Node RTA Plug-in
Rubus Builder
Algorithms for RTA of Tasks in a Node
Node Timing Information
Network RTA Plug-in
Algorithms for RTA of messages in a Network
Network Timing Information
Rubus-ICE
Rubus Desiner
Modeled DRE Application
Rubus Analysis Framework
End-to-end Timing Model
End-to-End Timing Analysis
ICCM File
Analysis Results(XML File)
End-to-end Timing Model
System Timing Model
Network TimingModel
System Tracing Model
Node TimingModel
HRTA Plug-in
Response Time Analysis of messages in a Network
Holistic Response-Time Analysis
Analysis Results
HRTA Plug-in
Algorithms for HRTA
End-to-endTiming Information
Rubus Builder
HRTA Plug-in
Algorithms for RTA of Tasks
in a Node
Algorithms for RTA of messages
in a Network
Algorithms for HRTA
End-to-endTiming Information
Analysis Results
Analysis Results Analysis Results
Analysis Results
Option A Option B
Figure 9: Options to develop HRTA Plug-in for Rubus-ICE
the other. Hence, we had to select option B for the implementation of HRTA.
4.7 Presentation of Analysis Results
When HRTA of a modeled application has been performed, the next issue ishow to present the analysis results. There can be a large number of tasks andmessages in the system. It may not be appropriate to display the response timeof all the tasks and messages because it may contain a lot of useless informationfor the user (if the user is not interested in all of it). Furthermore, presenting theresponse times of only DTs to the user may not be an appropriate because theremay be hundreds of DTs in a DRE application. A way around this problem isto provide the response times of only those tasks and DTs which have deadlinerequirements (specified by the user) or which produce control signals for externalactuators (e.g., the analysis results of case study that will be discussed in SectionVIII). Apart from this, we also provide an option for the user to get detailedanalysis results.
4.8 Interaction between the User and HRTA Plug-in
We identified that it is important to provide a progress report of HRTA plug-in(during its execution) to the user. Based on the progress, the user should be ableto interact with the plug-in while it is running. The HRTA algorithm iterativelyruns the algorithms of node RTA and network RTA until converging values ofthe response times are computed or the computed response times exceed thedeadlines (if deadlines are specified). We feel that it is important to display thenumber of iterations, running time and over all progress of the plug-in during itsexecution. Moreover, the user should be able to stop, rerun or exit the plug-inat any time.
4.9 Suggestions to Improve Schedulability Based on Anal-ysis Results
If the analysis results indicate that the modeled system is unschedulable, itcan be interesting if HRTA plug-in is able to provide suggestions (e.g., varyingsystem parameters) guiding the user to make the system schedulable. However,it is not trivial to provide such feedback because there can be so many reasonsbehind the system being not schedulable.
4.10 Requirement for Continuous Collaboration betweenIntegrator and Implementer
Our experience of integrating HRTA plug-in with Rubus-ICE shows that thereis a need of continuous collaboration between the integrator of the plug-in andits implementer especially in the phase of integration testing (see next Section).This collaboration is more obvious when the plug-in is developed in isolation bythe implementer (from research background) and integrated with the industrialtool chain by the integrator (with limited experience of integrating complexreal-time analysis but aware of overall objective). A continuous consultationand communication was required between the integrator and the implementerfor the verification of the plug-in. Examples of small DRE systems with varyingarchitectures were created for the verification. The implementer had to verifythese examples by hand. The integration testing and verification of HRTA plug-in was non-trivial and most tedious activity.
5 Testing and Evaluation
In this section we discuss our test plan for both standalone and integrationtesting of HRTA plug-in. Error handling and sanity checking routines makea significant part of the implementation. The purpose of these routines is todetect and isolate faults and present them to the user during the analysis. Ourtest plan contains following sets of error handling routines.
• A set of routines evaluating the validity of all inputs: attributes of allnodes, transactions, tasks, networks and messages in the system.
• A set of routines evaluating the validity of linking and tracing informationof all DTs in the system.
• A set of routines evaluating the validity of intermediate results that areiteratively inherited as inputs (e.g., a message inheriting the worst-caseresponse time of the sender tasks as a release jitter).
• A set of routines evaluating the overload conditions during the analysis.For example, processor utilization exceeding 100%, presence of direct cy-cles in the system, etc. Since HRTA algorithm is iterative, the analysismay never terminate in the presence of these conditions.
• A set of routines evaluating variable overflow during the analysis.

5.1 Standalone Testing
Standalone testing means testing the implementation of HRTA before it is in-tegrated as a plug-in with the Rubus builder tool. In other words, it refers tothe testing of HRTA in an isolation. The following input methods were used forstandalone testing.
1. Hard coded input test vectors.
2. Test vectors are read from external files.
3. Test vectors are generated using a test case generator (a separate pro-gram). This generator produces test cases with varying architectures. Italso randomly inserts invalid inputs to check if the error handling routinesare able to catch the errors.
The analysis results provided by the plug-in corresponding to the test vectorsthat were hard coded and read from external files were also verified by hand.
5.2 Integration Testing
Integration testing refers to testing of HRTA plug-in after integrating it withthe Rubus builder tool. Although standalone testing is already performed, theintegration of HRTA with Rubus-ICE may induce unexpected errors. Our expe-rience shows that integration testing is much more difficult and time consumingactivity compared to standalone testing. The following input methods wereused for integration testing.
1. Test vectors are read from external files.
2. Test vectors are manually written in ICCM file (see Figure 1) to make itappear as if test vectors were extracted from the modeled application.
3. Test vectors are automatically extracted from several DRE applicationsmodeled with RCM.
The analysis results provided by the plug-in corresponding to all types of testcases were also verified by hand.
6 Automotive Case Study
We provide a proof of concept for the analysis approach that we implementedin Rubus-ICE by conducting an automotive case study. First, we model anAutonomous Cruise Control (ACC) system with RCM using Rubus-ICE. Then,we analyze the ACC system using HRTA plug-in.
6.1 Autonomous Cruise Control System
A cruise control system is an automotive feature that allows a vehicle to au-tomatically maintain a steady speed to the value that is preset by the driver.It uses velocity feedback from the speed sensor (e.g., a speedometer) and ac-cordingly controls the engine throttle. However, it does not take into accounttraffic conditions around the vehicle. Whereas, an Autonomous Cruise Control
(ACC) system allows the cruise control of the vehicle to adapt itself to the trafficenvironment without communicating with the surrounding vehicles. Often, ituses a radar to create a feedback of distance to and velocity of the precedingvehicle. Based on the feedback, it either reduces the vehicle speed to keep a safedistance and time gap from the preceding vehicle or accelerates the vehicle tomatch the preset speed specified by the driver [28].
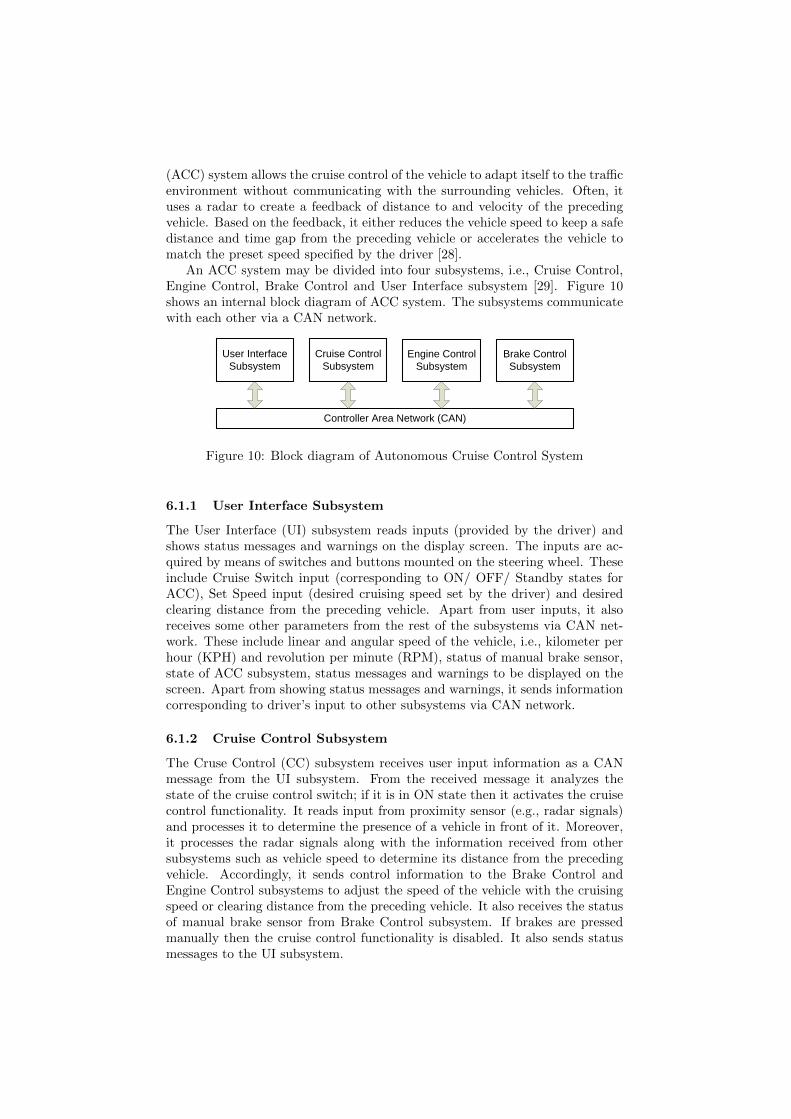
An ACC system may be divided into four subsystems, i.e., Cruise Control,Engine Control, Brake Control and User Interface subsystem [29]. Figure 10shows an internal block diagram of ACC system. The subsystems communicatewith each other via a CAN network.
Controller Area Network (CAN)
Brake Control Subsystem
Engine Control Subsystem
Cruise Control Subsystem
User Interface Subsystem
Figure 10: Block diagram of Autonomous Cruise Control System
6.1.1 User Interface Subsystem
The User Interface (UI) subsystem reads inputs (provided by the driver) andshows status messages and warnings on the display screen. The inputs are ac-quired by means of switches and buttons mounted on the steering wheel. Theseinclude Cruise Switch input (corresponding to ON/ OFF/ Standby states forACC), Set Speed input (desired cruising speed set by the driver) and desiredclearing distance from the preceding vehicle. Apart from user inputs, it alsoreceives some other parameters from the rest of the subsystems via CAN net-work. These include linear and angular speed of the vehicle, i.e., kilometer perhour (KPH) and revolution per minute (RPM), status of manual brake sensor,state of ACC subsystem, status messages and warnings to be displayed on thescreen. Apart from showing status messages and warnings, it sends informationcorresponding to driver’s input to other subsystems via CAN network.
6.1.2 Cruise Control Subsystem
The Cruse Control (CC) subsystem receives user input information as a CANmessage from the UI subsystem. From the received message it analyzes thestate of the cruise control switch; if it is in ON state then it activates the cruisecontrol functionality. It reads input from proximity sensor (e.g., radar signals)and processes it to determine the presence of a vehicle in front of it. Moreover,it processes the radar signals along with the information received from othersubsystems such as vehicle speed to determine its distance from the precedingvehicle. Accordingly, it sends control information to the Brake Control andEngine Control subsystems to adjust the speed of the vehicle with the cruisingspeed or clearing distance from the preceding vehicle. It also receives the statusof manual brake sensor from Brake Control subsystem. If brakes are pressedmanually then the cruise control functionality is disabled. It also sends statusmessages to the UI subsystem.
6.1.3 Engine Control Subsystem
The Engine Control (EC) subsystem is responsible for controlling the vehiclespeed by adjusting engine throttle. It reads sensor input and accordingly deter-mines engine torque. It receives CAN messages sent by other subsystems. Themessages include information regarding vehicle speed, status of manual brakesensor, and input information processed by UI system. Based on the receivedinformation, it determines whether to increase or decrease engine throttle. Itthen sends new throttle position to the actuators that control engine throttle.
6.1.4 Brake Control Subsystem
The Brake Control (BC) subsystem receives inputs from sensor for manualbrakes status and linear and angular speed sensors connected to all wheels.It also receives a CAN message that includes control information processed byCC subsystem. Based on this feedback, it computes new vehicle speed. Ac-cordingly, it produces control signals and sends them to the brake and backlight actuators. It also sends CAN messages to other subsystems that carryinformation regarding status of manual brake, vehicle speed and RPM.
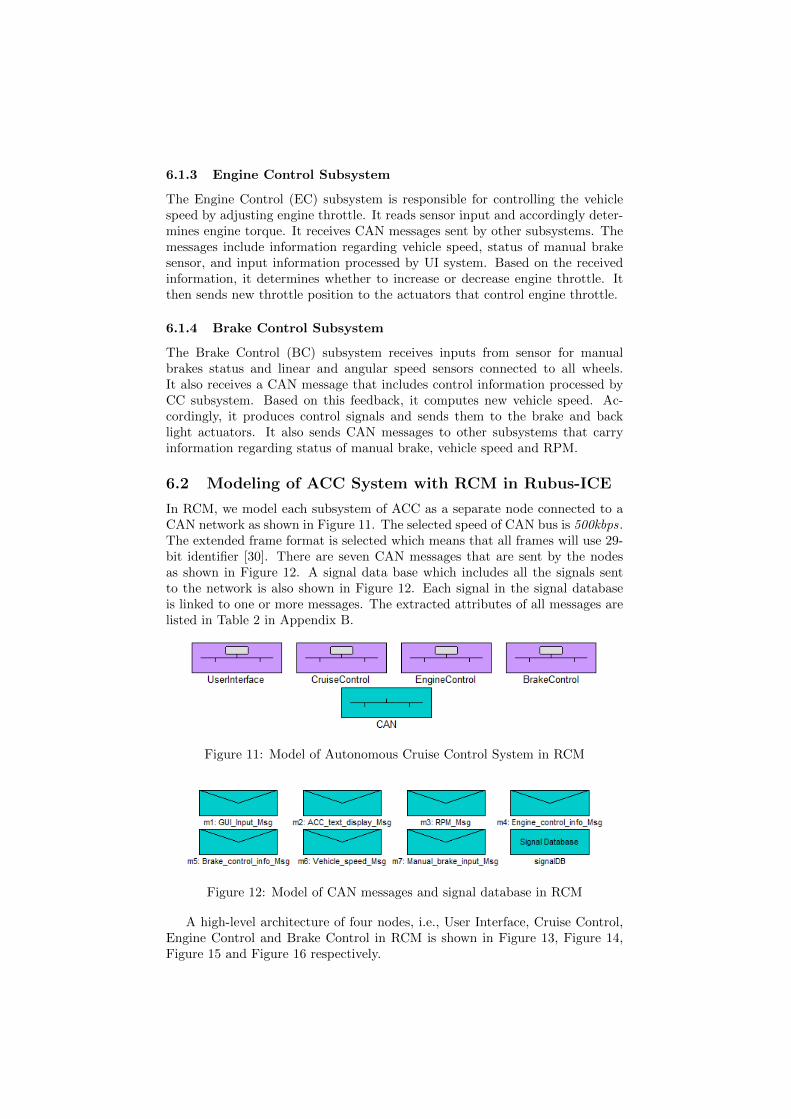
6.2 Modeling of ACC System with RCM in Rubus-ICE
In RCM, we model each subsystem of ACC as a separate node connected to aCAN network as shown in Figure 11. The selected speed of CAN bus is 500kbps.The extended frame format is selected which means that all frames will use 29-bit identifier [30]. There are seven CAN messages that are sent by the nodesas shown in Figure 12. A signal data base which includes all the signals sentto the network is also shown in Figure 12. Each signal in the signal databaseis linked to one or more messages. The extracted attributes of all messages arelisted in Table 2 in Appendix B.
Figure 11: Model of Autonomous Cruise Control System in RCM
Figure 12: Model of CAN messages and signal database in RCM
A high-level architecture of four nodes, i.e., User Interface, Cruise Control,Engine Control and Brake Control in RCM is shown in Figure 13, Figure 14,Figure 15 and Figure 16 respectively.
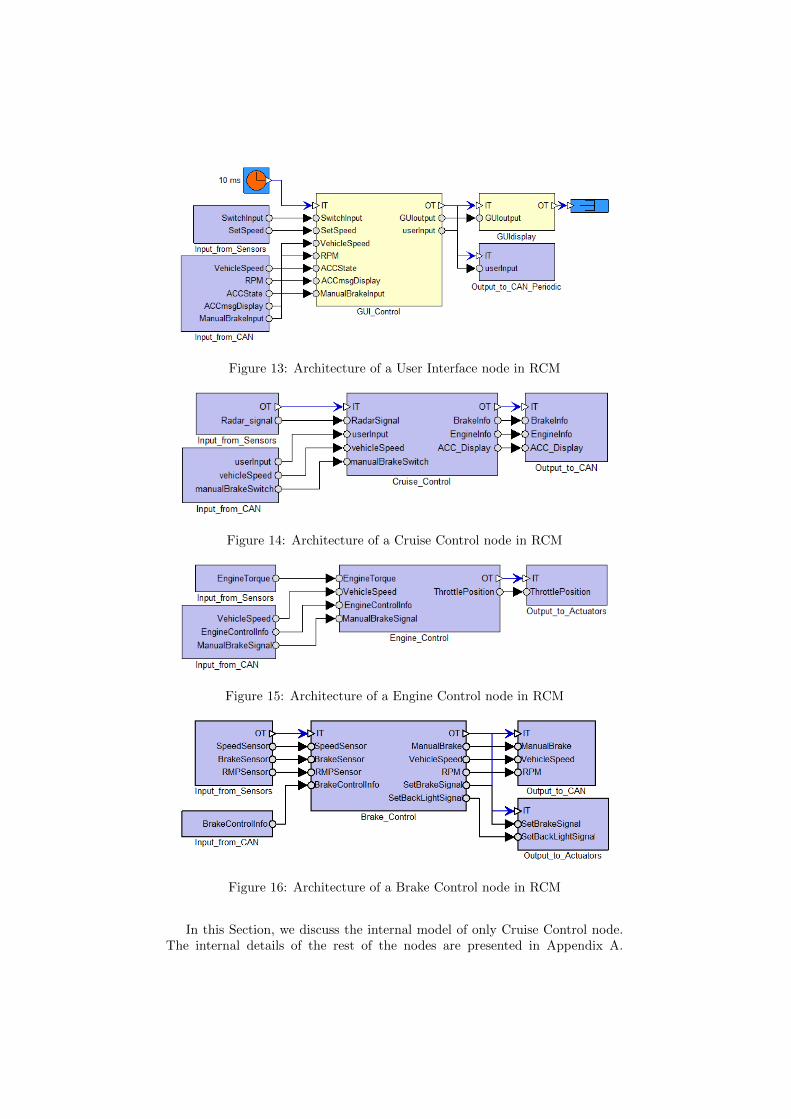
Figure 13: Architecture of a User Interface node in RCM
Cruise Control
Figure 14: Architecture of a Cruise Control node in RCM
Engine Control
Figure 15: Architecture of a Engine Control node in RCM
Brake Control
Figure 16: Architecture of a Brake Control node in RCM
In this Section, we discuss the internal model of only Cruise Control node.The internal details of the rest of the nodes are presented in Appendix A.

The Cruise Control node is modeled with four assemblies as shown in Fig-ure 14. An assembly in RCM is a container for various software items. TheInput from Sensors assembly contains an SWC that reads radar sensor values asshown in Figure 17. The Input from CAN assembly contains three ISWCs, i.e.,GUI Input Msg ISWC, Vehicle speed Msg ISWC and Manual brake input Msg ISWCas depicted in Figure 18. These components receive respective messages m1 ,m6 and m7 from CAN network. Similarly, the assembly Output to CAN con-tains three OSWC components as shown in Figure 19. These components sendmessages m5 , m4 and m2 to CAN network. The Cruise Control assembly con-tains two SWCs: one handles the input and cruise control mode signals whilethe other processes the received information and produces control messages forother nodes. The internal structure of this assembly is shown in Figure 20.
Figure 17: Internals of an assembly reading sensors
Figure 18: Internals of an assembly reading CAN messages
6.3 Modeling of Deadline Requirements
We specify the deadline requirements on four DTs in the model of ACC systemusing a deadline object in RCM. Upon reading the radar signal, these DTs pro-duce brake and engine actuation signals and display information for the driver.All these transactions have a common initiator, i.e., their first task correspondsto the SWC that reads radar signal and is located in the Cruise Control node.The last tasks of first and second DTs are located in the Brake Control node.These tasks correspond to the SWCs SetBrakeSignal and SetBackLightSignalas shown in Figure. 16. The last task of third DT corresponds to SetThrottle-Position SWC and is located in the Engine Control node as shown in Figure. 15.Finally, the last task of fourth DT corresponds to GUIdisplay SWC and is lo-cated in the User Interface node as shown in Figure. 13.
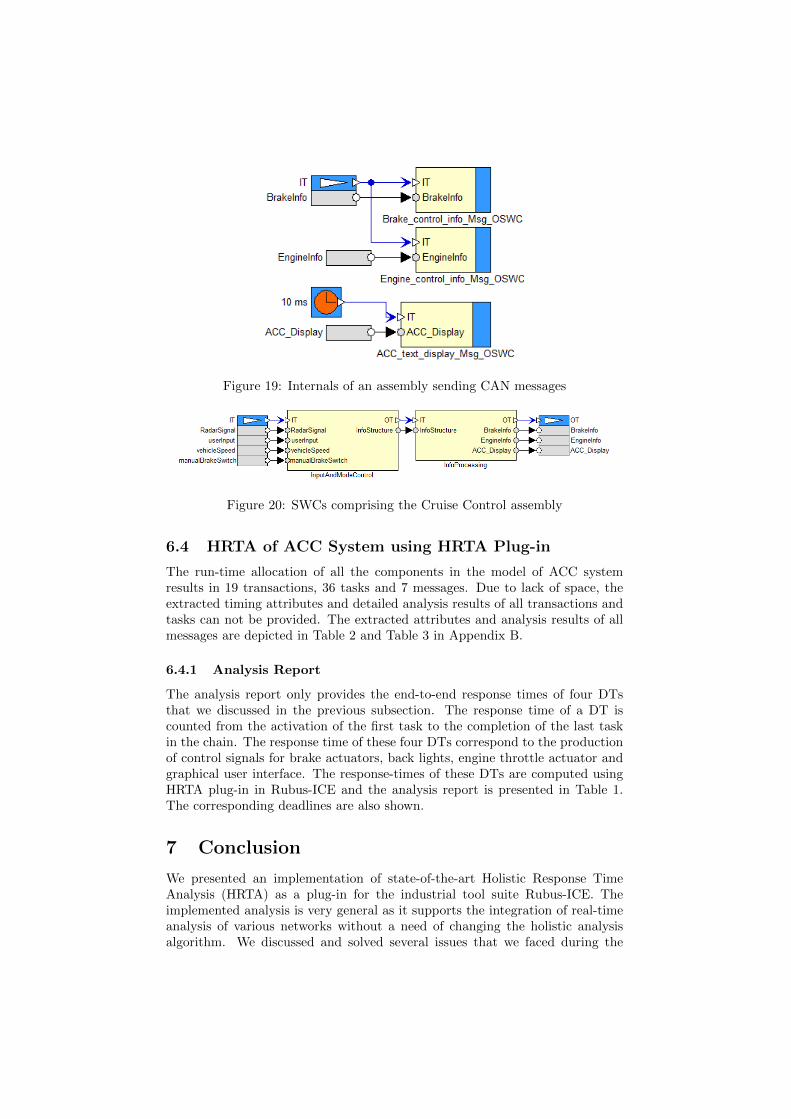
Figure 19: Internals of an assembly sending CAN messages
Figure 20: SWCs comprising the Cruise Control assembly
6.4 HRTA of ACC System using HRTA Plug-in
The run-time allocation of all the components in the model of ACC systemresults in 19 transactions, 36 tasks and 7 messages. Due to lack of space, theextracted timing attributes and detailed analysis results of all transactions andtasks can not be provided. The extracted attributes and analysis results of allmessages are depicted in Table 2 and Table 3 in Appendix B.
6.4.1 Analysis Report
The analysis report only provides the end-to-end response times of four DTsthat we discussed in the previous subsection. The response time of a DT iscounted from the activation of the first task to the completion of the last taskin the chain. The response time of these four DTs correspond to the productionof control signals for brake actuators, back lights, engine throttle actuator andgraphical user interface. The response-times of these DTs are computed usingHRTA plug-in in Rubus-ICE and the analysis report is presented in Table 1.The corresponding deadlines are also shown.
7 Conclusion
We presented an implementation of state-of-the-art Holistic Response TimeAnalysis (HRTA) as a plug-in for the industrial tool suite Rubus-ICE. Theimplemented analysis is very general as it supports the integration of real-timeanalysis of various networks without a need of changing the holistic analysisalgorithm. We discussed and solved several issues that we faced during the
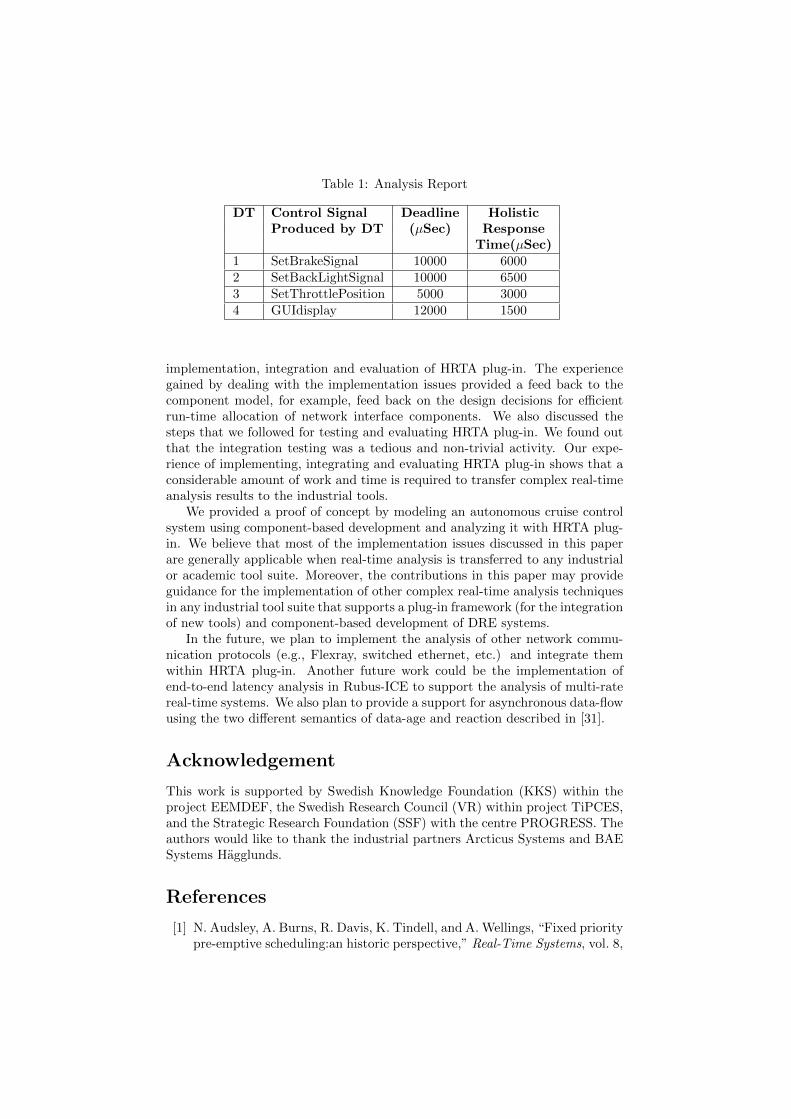
Table 1: Analysis Report
DT Control Signal Deadline HolisticProduced by DT (µSec) Response
Time(µSec)1 SetBrakeSignal 10000 60002 SetBackLightSignal 10000 65003 SetThrottlePosition 5000 30004 GUIdisplay 12000 1500
implementation, integration and evaluation of HRTA plug-in. The experiencegained by dealing with the implementation issues provided a feed back to thecomponent model, for example, feed back on the design decisions for efficientrun-time allocation of network interface components. We also discussed thesteps that we followed for testing and evaluating HRTA plug-in. We found outthat the integration testing was a tedious and non-trivial activity. Our expe-rience of implementing, integrating and evaluating HRTA plug-in shows that aconsiderable amount of work and time is required to transfer complex real-timeanalysis results to the industrial tools.
We provided a proof of concept by modeling an autonomous cruise controlsystem using component-based development and analyzing it with HRTA plug-in. We believe that most of the implementation issues discussed in this paperare generally applicable when real-time analysis is transferred to any industrialor academic tool suite. Moreover, the contributions in this paper may provideguidance for the implementation of other complex real-time analysis techniquesin any industrial tool suite that supports a plug-in framework (for the integrationof new tools) and component-based development of DRE systems.
In the future, we plan to implement the analysis of other network commu-nication protocols (e.g., Flexray, switched ethernet, etc.) and integrate themwithin HRTA plug-in. Another future work could be the implementation ofend-to-end latency analysis in Rubus-ICE to support the analysis of multi-ratereal-time systems. We also plan to provide a support for asynchronous data-flowusing the two different semantics of data-age and reaction described in [31].
Acknowledgement
This work is supported by Swedish Knowledge Foundation (KKS) within theproject EEMDEF, the Swedish Research Council (VR) within project TiPCES,and the Strategic Research Foundation (SSF) with the centre PROGRESS. Theauthors would like to thank the industrial partners Arcticus Systems and BAESystems Hagglunds.
References
[1] N. Audsley, A. Burns, R. Davis, K. Tindell, and A. Wellings, “Fixed prioritypre-emptive scheduling:an historic perspective,” Real-Time Systems, vol. 8,
no. 2/3, pp. 173–198, 1995.
[2] L. Sha, T. Abdelzaher, K.-E. A. rzen, A. Cervin, T. P. Baker, A. Burns,G. Buttazzo, M. Caccamo, J. P. Lehoczky, and A. K. Mok, “Real TimeScheduling Theory: A Historical Perspective,” Real-Time Systems, vol. 28,no. 2/3, pp. 101–155, 2004.
[3] K. Tindell and J. Clark, “Holistic schedulability analysis for distributedhard real-time systems,” Microprocess. Microprogram., vol. 40, pp. 117–134, April 1994.
[4] K. W. Tindell, “Using offset information to analyse static priority preemp-tively scheduled task sets,” Dept. of Computer Science, University of York,Tech. Rep. YCS 182, 1992.
[5] J. Palencia and M. G. Harbour, “Schedulability Analysis for Tasks withStatic and Dynamic Offsets,” Real-Time Systems Symposium, IEEE Inter-national, p. 26, 1998.
[6] “Arcticus Systems,” http://www.arcticus-systems.com.
[7] K. Hanninen et.al., “The Rubus Component Model for Resource Con-strained Real-Time Systems,” in 3rd IEEE International Symposium onIndustrial Embedded Systems, June 2008.
[8] S. Mubeen, J. Maki-Turja, M. Sjodin, and J. Carlson, “Analyzable Model-ing of Legacy Communication in Component-Based Distributed EmbeddedSystems,” in Software Engineering and Advanced Applications (SEAA),2011 37th EUROMICRO Conference on, Sep. 2011, pp. 229 –238.
[9] S. Mubeen, J. Maki-Turja, and M. Sjodin, “Extraction of end-to-end timingmodel from component-based distributed real-time embedded systems,” inTime Analysis and Model-Based Design, from Functional Models to Dis-tributed Deployments (TiMoBD) workshop located at Embedded SystemsWeek. Springer, October 2011, pp. 1–6.
[10] K. Hanninen et.al., “Framework for real-time analysis in Rubus-ICE,” inEmerging Technologies and Factory Automation, 2008. ETFA 2008. IEEEInternational Conference on, 2008, pp. 782 –788.
[11] C. Liu and J. Layland, “Scheduling algorithms for multi-programming ina hard-real-time environment,” ACM, vol. 20, no. 1, pp. 46–61, 1973.
[12] M. Joseph and P. Pandya, “Finding Response Times in a Real-Time Sys-tem,” The Computer Journal (British Computer Society), vol. 29, no. 5,pp. 390–395, October 1986.
[13] M. Nolin, J. Maki-Turja, and K. Hanninen, “Achieving Industrial StrengthTiming Predictions of Embedded System Behavior,” in ESA, 2008, pp.173–178.
[14] J. Maki-Turja, , and M. Nolin, “Tighter response-times for tasks with off-sets,” in Real-time and Embedded Computing Systems and ApplicationsConference (RTCSA). Springer-Verlag, August 2004.
[15] K. Tindell, H. Hansson, and A. Wellings, “Analysing real-time communica-tions: controller area network (CAN),” in Real-Time Systems Symposium(RTSS) 1994, pp. 259 –263.
[16] R. Davis, A. Burns, R. Bril, and J. Lukkien, “Controller Area Network(CAN) schedulability analysis: Refuted, revisited and revised,” Real-TimeSystems, vol. 35, pp. 239–272, 2007.
[17] S. Mubeen, J. Maki-Turja, and M. Sjodin, “Implementation of HolisticResponse-Time Analysis in Rubus-ICE: Preliminary Findings, Issues andExperiences,” in The 32nd IEEE Real-Time Systems Symposium (RTSS),WIP Session, December 2011, pp. 9–12.
[18] “MAST–Modeling and Analysis Suite for Real-Time Applications,”http://mast.unican.es/.
[19] “The Volcano Family,” http://www.mentor.com/products/vnd.
[20] “Volcano Network Architect (VNA). Mentor Graph-ics,” http://www.mentor.com/products/vnd/communication-management/vna.
[21] A. Hamann, R. Henia, R. Racu, M. Jersak, K. Richter, and R. Ernst,“Symta/s - symbolic timing analysis for systems,” 2004.
[22] M. Hagner and U. Goltz, “Integration of scheduling analysis into uml baseddevelopment processes through model transformation,” in Computer Sci-ence and Information Technology (IMCSIT), Proceedings of the 2010 In-ternational Multiconference on, oct. 2010, pp. 797 –804.
[23] “RAPID RMA: The Art of Modeling Real-Time Systems,”http://www.tripac.com/rapid-rma.
[24] D. Schmidt and F. Kuhns, “An overview of the Real-Time CORBA speci-fication,” Computer, vol. 33, no. 6, pp. 56 –63, Jun. 2000.
[25] S. Mubeen, J. Maki-Turja, and M. Sjodin, “Extending schedulability anal-ysis of controller area network (CAN) for mixed (periodic/sporadic) mes-sages,” in Emerging Technologies Factory Automation (ETFA), IEEE 16thConference on, sept. 2011.
[26] R. I. Davis, S. Kollmann, V. Pollex, and F. Slomka, “Controller Area Net-work (CAN) Schedulability Analysis with FIFO queues,” in 23rd EuromicroConference on Real-Time Systems (ECRTS11), July 2011.
[27] Mubeen, Saad and Maki-Turja, Jukka and Sjodin, Mikael, “Extend-ing response-time analysis of controller area network (CAN) with FIFOqueues for mixed messages,” in Emerging Technologies Factory Automa-tion (ETFA), IEEE 16th Conference on, sept. 2011, pp. 1–4.
[28] P. Berggren, “Autonomous Cruise Control for Chalmers Vehicle Simula-tor,” Master’s thesis, Department of Signals and Systems, Chalmers Uni-versity of Technology, 2008.

[29] “Adaptive Cruise Control System Overview,” in Workshop of Software Sys-tem Safety Working Group, April 2005, Anaheim, California, USA. Avail-able at: sunnyday.mit.edu/Adaptive Cruise Control Sys Overview.pdf.
[30] ISO 11898-1, “Road Vehicles interchange of digital information controllerarea network (CAN) for high-speed communication, ISO Standard-11898,Nov. 1993.”
[31] N. Feiertag, K. Richter, J. Nordlander, and J. Jonsson, “A CompositionalFramework for End-to-End Path Delay Calculation of Automotive Systemsunder Different Path Semantics,” in Compositional Theory and Technologyfor Real-Time Embedded Systems, 2008. CRTS 2008. Workshop on, dec.2008.

Appendix A
Internal Model of User Interface Node
The User Interface node is modeled with three assemblies along with two SWCsas shown in Figure 13. The GUI Control SWC handles the input from thesensors and messages from the CAN network. After processing the information,it not only produces information for Graphical User Interface (GUI), but alsocomputes control signals for the other nodes. The GUIdisplay SWC sends thesignals (corresponding to updated information) to GUI in the car.
The Input from Sensors assembly contains two SWCs as shown in Figure 21.One of them reads the sensor values that correspond to the state of the cruisecontrol switch on the steering wheel. The other SWC reads the sensor valuesthat correspond to the vehicle cruising speed set by the driver.
Figure 21: User Interface Node: internals of an assembly reading sensors
The Input from CAN assembly contains four ISWC components, i.e., Vehi-cle Speed Msg ISWC, RPM Msg ISWC, ACC text display Msg ISWC and Man-ual brake input Msg ISWC as shown in Figure 22. These components receiverespective messages m6 , m3 , m2 and m7 from CAN network.
Figure 22: User Interface Node: internals of an assembly reading CAN messages
The third assembly, i.e., Output to CAN Periodic sends a message m1 to
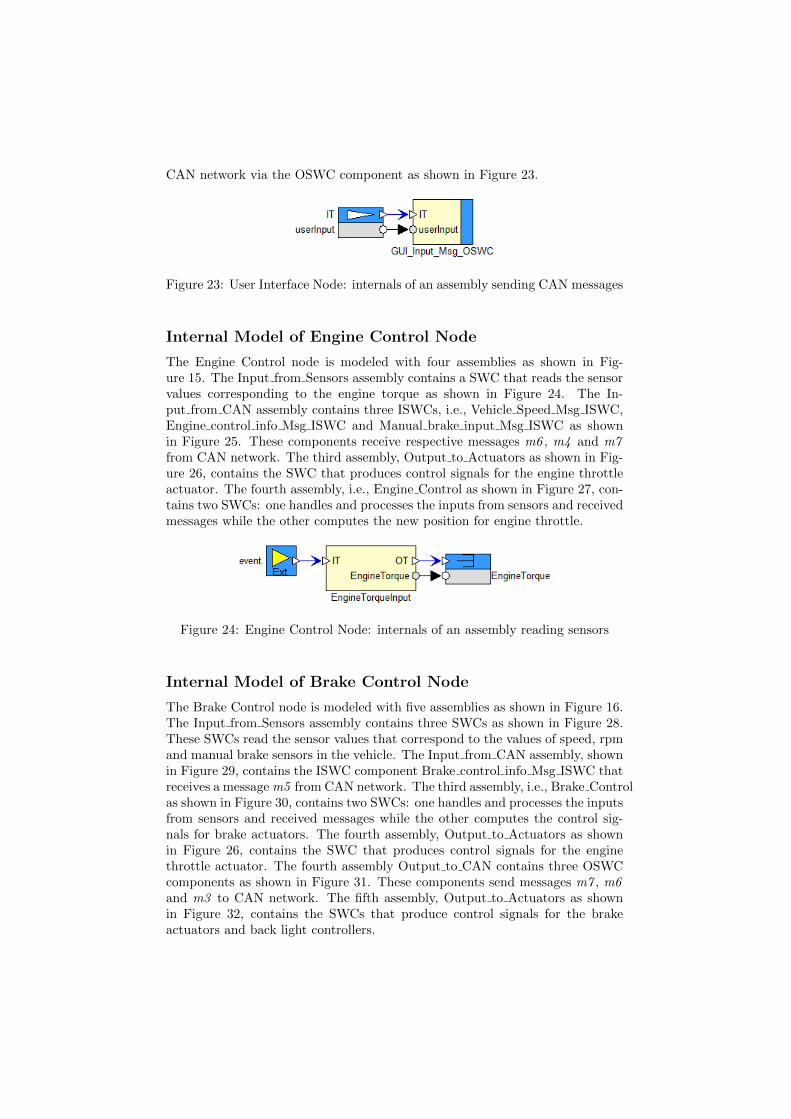
CAN network via the OSWC component as shown in Figure 23.
Figure 23: User Interface Node: internals of an assembly sending CAN messages
Internal Model of Engine Control Node
The Engine Control node is modeled with four assemblies as shown in Fig-ure 15. The Input from Sensors assembly contains a SWC that reads the sensorvalues corresponding to the engine torque as shown in Figure 24. The In-put from CAN assembly contains three ISWCs, i.e., Vehicle Speed Msg ISWC,Engine control info Msg ISWC and Manual brake input Msg ISWC as shownin Figure 25. These components receive respective messages m6 , m4 and m7from CAN network. The third assembly, Output to Actuators as shown in Fig-ure 26, contains the SWC that produces control signals for the engine throttleactuator. The fourth assembly, i.e., Engine Control as shown in Figure 27, con-tains two SWCs: one handles and processes the inputs from sensors and receivedmessages while the other computes the new position for engine throttle.
Figure 24: Engine Control Node: internals of an assembly reading sensors
Internal Model of Brake Control Node
The Brake Control node is modeled with five assemblies as shown in Figure 16.The Input from Sensors assembly contains three SWCs as shown in Figure 28.These SWCs read the sensor values that correspond to the values of speed, rpmand manual brake sensors in the vehicle. The Input from CAN assembly, shownin Figure 29, contains the ISWC component Brake control info Msg ISWC thatreceives a message m5 from CAN network. The third assembly, i.e., Brake Controlas shown in Figure 30, contains two SWCs: one handles and processes the inputsfrom sensors and received messages while the other computes the control sig-nals for brake actuators. The fourth assembly, Output to Actuators as shownin Figure 26, contains the SWC that produces control signals for the enginethrottle actuator. The fourth assembly Output to CAN contains three OSWCcomponents as shown in Figure 31. These components send messages m7 , m6and m3 to CAN network. The fifth assembly, Output to Actuators as shownin Figure 32, contains the SWCs that produce control signals for the brakeactuators and back light controllers.

Figure 25: Engine Control Node: internals of an assembly reading CAN mes-sages
Figure 26: Engine Control Node: internals of an assembly producing actuationsignals
Figure 27: Engine Control Node: SWCs comprising the Engine Control assem-bly
Figure 28: Brake Control Node: Internals of an assembly reading sensors
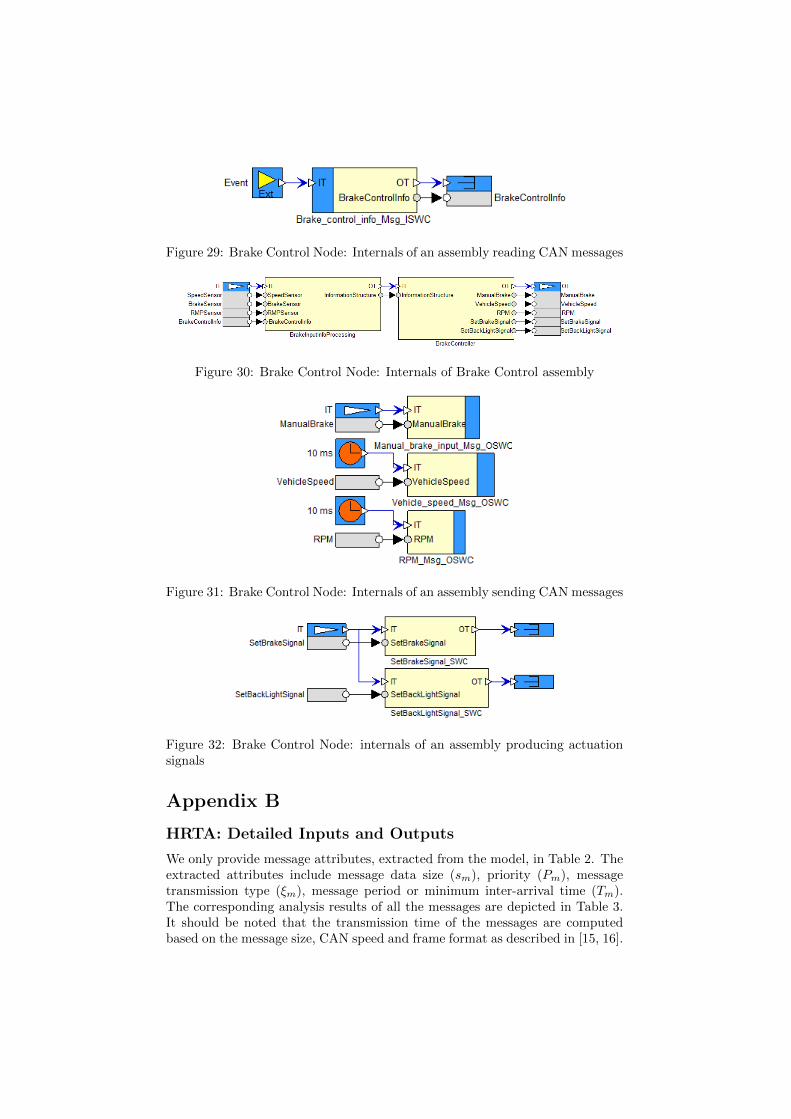
Figure 29: Brake Control Node: Internals of an assembly reading CAN messages
Figure 30: Brake Control Node: Internals of Brake Control assembly
Figure 31: Brake Control Node: Internals of an assembly sending CAN messages
Figure 32: Brake Control Node: internals of an assembly producing actuationsignals
Appendix B
HRTA: Detailed Inputs and Outputs
We only provide message attributes, extracted from the model, in Table 2. Theextracted attributes include message data size (sm), priority (Pm), messagetransmission type (ξm), message period or minimum inter-arrival time (Tm).The corresponding analysis results of all the messages are depicted in Table 3.It should be noted that the transmission time of the messages are computedbased on the message size, CAN speed and frame format as described in [15, 16].
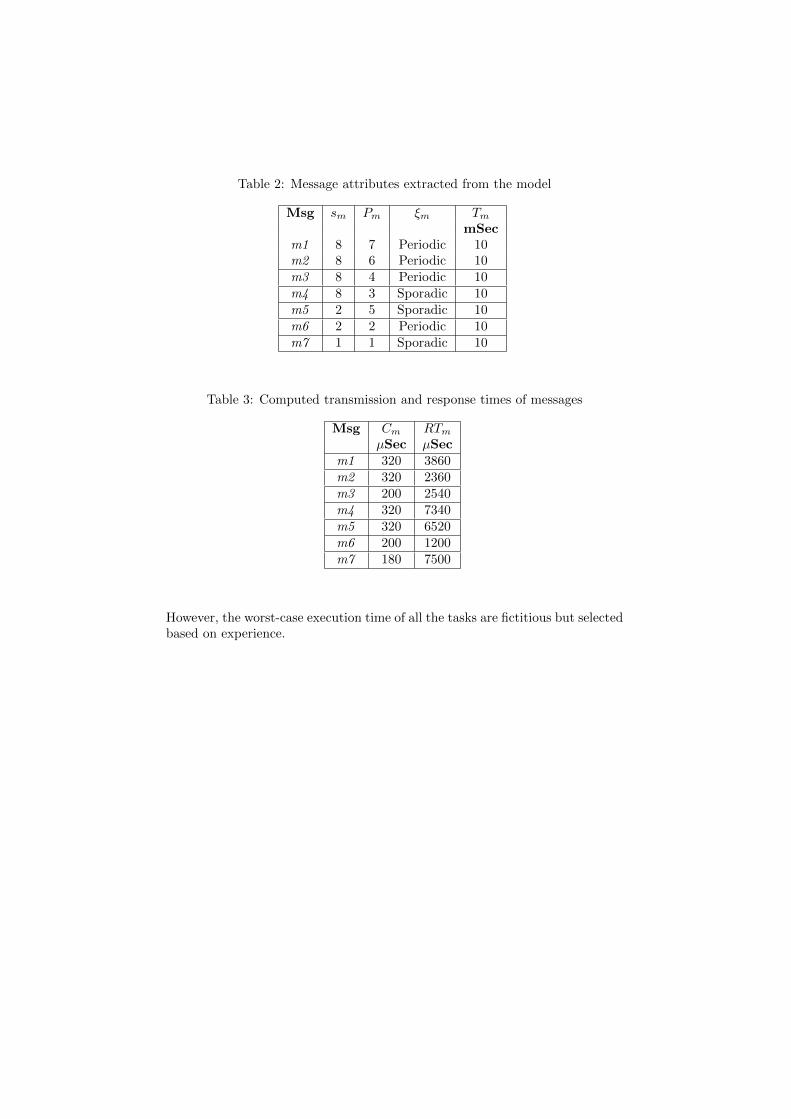
Table 2: Message attributes extracted from the model
Msg sm Pm ξm TmmSec
m1 8 7 Periodic 10m2 8 6 Periodic 10m3 8 4 Periodic 10m4 8 3 Sporadic 10m5 2 5 Sporadic 10m6 2 2 Periodic 10m7 1 1 Sporadic 10
Table 3: Computed transmission and response times of messages
Msg Cm RTmµSec µSec
m1 320 3860m2 320 2360m3 200 2540m4 320 7340m5 320 6520m6 200 1200m7 180 7500
However, the worst-case execution time of all the tasks are fictitious but selectedbased on experience.