Embed Size (px)
Citation preview
24/2017 CLIMATE CHANGE
Implementation of Nationally Determined Contributions Indonesia Country Report

CLIMATE CHANGE 24/2017
Environmental Research of the Federal Ministry for the Environment, Nature Conservation, Building and Nuclear Safety
Project No. (FKZ) 3716 4111 80
Implementation of Nationally Determined Contributions Indonesia Country Report
by
Florian Mersmann, Timon Wehnert, Tatiana Andreeva Wuppertal Institute for Climate, Environment and Energy, Wuppertal
in cooperation with
Hanna Fekete, Lisa Luna NewClimate Institute, Cologne
Verena Streitferdt Synergy Efficiency Solutions, Jakarta
On behalf of the German Environment Agency
Imprint
Publisher: Umweltbundesamt Wörlitzer Platz 1 06844 Dessau-Roßlau Tel: +49 340-2103-0 Fax: +49 340-2103-2285 [email protected] Internet: www.umweltbundesamt.de
/umweltbundesamt.de /umweltbundesamt
Study performed by: Wuppertal Institute for Climate, Environment and Energy Döppersberg 19 42103 Wuppertal NewClimate Institute Am Hof 20 – 26 50667 Cologne Synergy Efficiency Solutions Jl. Kh. Mas Mansyur Jakarta Pusat DKI Jakarta - Indonesia 10220 Study completed in: August 2017 Edited by: Section I 2.1 Climate Protection Lara Mia Herrmann Publication as pdf: http://www.umweltbundesamt.de/publikationen ISSN 1862-4359 Dessau-Roßlau, October 2017 The project underlying this report was financed by the Federal Ministry for the Environment, Nature Conservation, Building and Nuclear safety under project number FKZ 3716 4111 80. The responsibility for the content of this publication lies with the author(s).
Implementation of Nationally Determined Contributions: Indonesia
5
Introduction to the project
This country report is part of the “Implementation of Nationally Determined Contributions” (NDCs) project (FKZ 3716 4111 80), which considers NDC implementation in 10 countries: Colombia, Ethiopia, Georgia, Indonesia, Iran, Kenya, Marshall Islands, Morocco, Peru, and Viet Nam. This project places a special emphasis on identifying potential barriers to NDC implementation and mitigation potentials which could go beyond the current NDCs.
The country reports analyze the NDCs in terms of their robustness and coherence with other national or sectoral plans and targets, and put them into the context of additional mitigation potentials and other national circumstances. For countries where coal plays a critical role in consumption or national production, the analysis covers further details on this sector, including the economic relevance and local impacts of coal production or consumption. The content is based on available literature from research and public sector information on policies and institutions.
To be able to analyze the content in more detail, the authors focus the research on a number of relevant fields of action. The fields of action were selected based on historic and projected sectoral emissions development, comprehensive literature on GHG mitigation potentials, identified barriers and emissions reductions as well as feasibility, costs, and co-benefits.
The project was suggested and is financed by the Federal Ministry for the Environment, Nature Conservation, Building and Nuclear Safety, supervised by the German Environment Agency and carried out by independent think tanks - NewClimate Institute and Wuppertal Institute. The studies are a continuation of similar previous efforts (project numbers 3713 41 102, 3711 41 120, 360 16 022, 364 01 003 and 363 01 128) and aim to inform policy makers and the interested public about the implementation of NDCs in individual countries. The choice of countries is based on developing countries with which Germany works closely on climate change topics.
The papers are scientific in nature, and all suggestions are derived by the authors from careful analysis, having in mind the individual backgrounds of countries. They aim to increase knowledge about implementation of mitigation potentials to meet the globally agreed goal of staying within a temperature increase of 1.5°C or well below 2°C above preindustrial levels, without intending to prescribe specific policies.
Implementation of Nationally Determined Contributions: Indonesia
6
Table of Contents
Table of Contents .............................................................................................................................................. 6
List of Figures ..................................................................................................................................................... 8
List of Tables ...................................................................................................................................................... 9
List of Abbreviations ........................................................................................................................................ 10
1 Part I: Summary ....................................................................................................................................... 12
1.1 Country background .............................................................................................................. 12 1.2 Emission trends ..................................................................................................................... 13 1.3 Ongoing activities and barriers .............................................................................................. 17 1.4 NDC and further mitigation potential ..................................................................................... 19
2 Part II: Selected fields of action ............................................................................................................... 22
2.1 LULUCF governance and monitoring....................................................................................... 22 2.2 Electricity demand and generation ......................................................................................... 23
3 Part III: Full country analysis .................................................................................................................... 25
3.1 Country background .............................................................................................................. 25 3.2 Institutional set up ................................................................................................................ 30 3.3 MRV of GHG emissions .......................................................................................................... 32 3.4 Description and evaluation of the NDC ................................................................................... 33 3.5 Climate change mitigation policies and strategies .................................................................. 34
3.5.1 National strategies ................................................................................................................... 34
3.5.2 NAMAs and carbon finance ..................................................................................................... 36
3.6 Additional mitigation potential .............................................................................................. 36
3.6.1 LULUCF ..................................................................................................................................... 37
3.6.2 Energy supply........................................................................................................................... 40
3.6.3 Energy efficiency in industry and transport ............................................................................ 43
3.7 Barriers to implementation of additional actions ................................................................... 44
3.7.1 Institutional and political barriers ........................................................................................... 44
3.7.2 Financial and economic barriers .............................................................................................. 45
3.7.3 Informational and capacity barriers ........................................................................................ 46
3.8 Assessment of the relevance and perspectives of coal use ...................................................... 47
3.8.1 Overview of coal use - historic development and status quo of coal in Indonesia ................. 47
3.8.2 Future outlook on coal use ...................................................................................................... 48
3.8.3 The economic role of coal ....................................................................................................... 49
3.8.4 Local impact of coal use........................................................................................................... 52
3.8.5 Conclusions on coal mining and use ........................................................................................ 53
4 References ............................................................................................................................................... 55
5 Annex 1 .................................................................................................................................................... 60

Implementation of Nationally Determined Contributions: Indonesia
7
Implementation of Nationally Determined Contributions: Indonesia
8
List of Figures
Figure 1: Emission profile of Indonesia.............................................................. 15
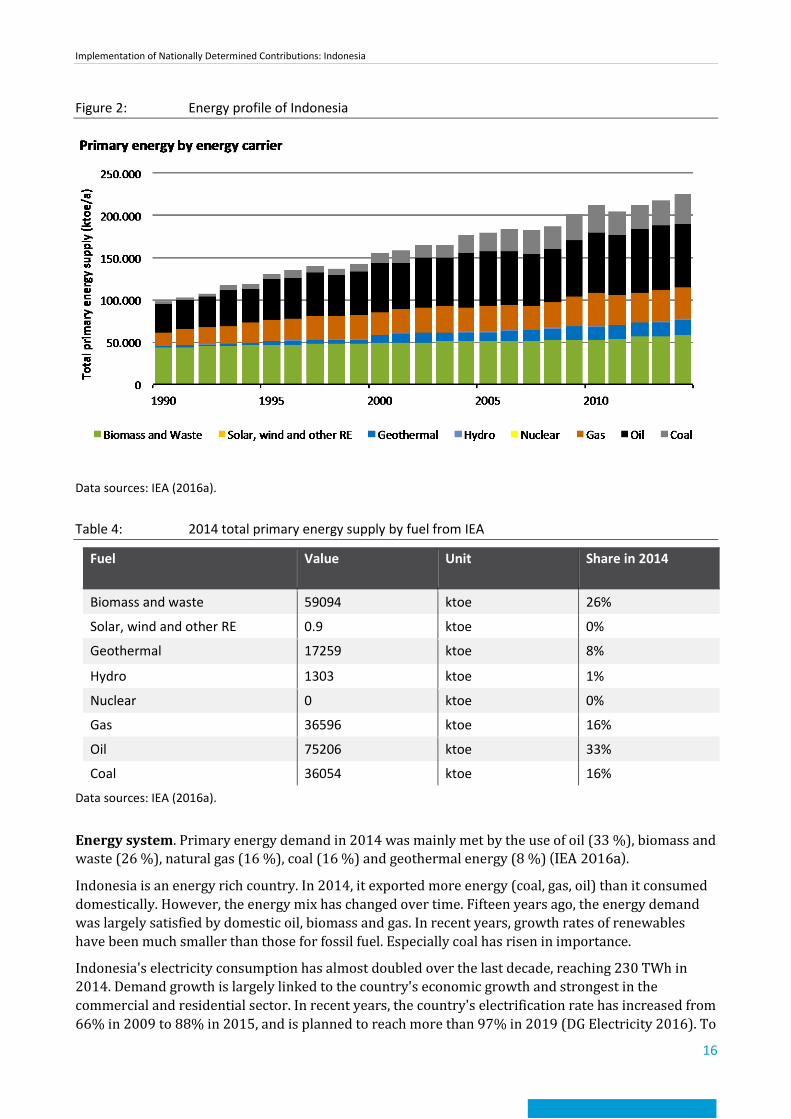
Figure 2: Energy profile of Indonesia ................................................................. 16
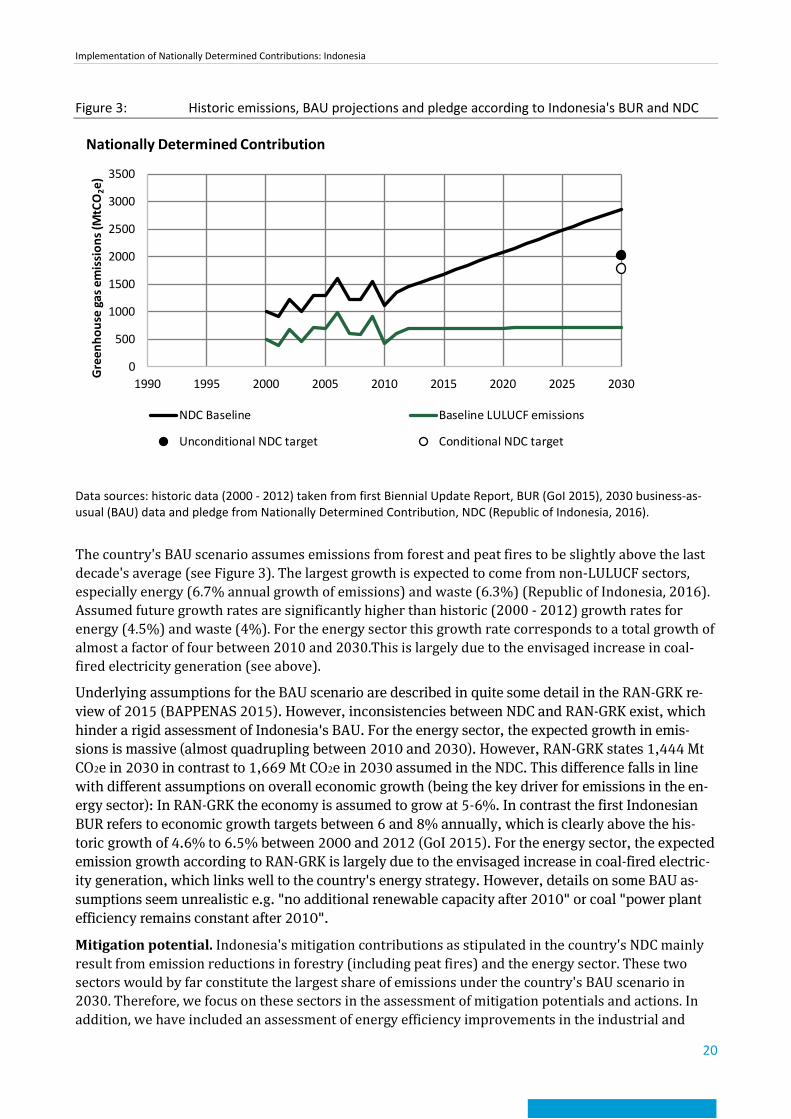
Figure 3: Historic emissions, BAU projections and pledge according to Indonesia's BUR and NDC ................................................................... 20
Figure 4: Map of Indonesia ................................................................................ 25
Figure 5: Emissions profile of Indonesia ............................................................ 27
Figure 6: Energy profile of Indonesia ................................................................. 28
Figure 7: Flowchart of organisational setup ...................................................... 31
Figure 8: Institutional mechanism for Indonesia's GHG inventory system ....... 32
Figure 9: Historic emissions, BAU projections and pledge according to Indonesia's BUR and NDC ................................................................... 33
Figure 10: 2030 emission scenarios according to NDC by sector ........................ 37
Figure 11: Historical development of total and coal-fired electricity production, GWh. ................................................................................................... 41
Figure 12: Indonesian energy mix in 2000 and 2014, in % of total electricity production. ......................................................................................... 41
Figure 13: Currently installed capacity, planned in RUPTL installed cumulative capacity and potential capacity of renewables in Indonesia, in GW. . 42
Figure 14: Domestic coal consumption 1990 - 2014 ........................................... 47
Figure 15: Coal consumption in Indonesia by type of coal in 2014 and shares of coal consumption by branch of industry ............................................ 48
Figure 16: Domestic coal consumption plans of Indonesian MEMR for the nearest years by branch ..................................................................... 49
Figure 17: Coal extraction, import and export in Indonesia (1990 - 2015) ......... 49
Figure 18: Indonesian export destinations in 2014 by type of coal .................... 50
Figure 19: Three main coal pools of Indonesia; proposed and existing coal export ports and coal reserves (in Mt) by destination ....................... 51
Figure 20: Historic development of the coal rent in Indonesia, in % of GDP. ..... 52
Figure 21: Government structure of Indonesia ................................................... 60
Implementation of Nationally Determined Contributions: Indonesia
9
List of Tables
Table 1: Key socio-economic figures (2014) ..................................................... 12
Table 2: 2012 emissions data from PRIMAP .................................................... 15
Table 3: Emissions data from UNFCCC ............................................................. 15
Table 4: 2014 total primary energy supply by fuel from IEA ............................ 16
Table 5: Key socio-economic figures (2014) ..................................................... 26
Table 6: 2012 emissions data from PRIMAP .................................................... 28
Table 7: Emissions data from UNFCCC ............................................................. 28
Table 8: 2014 total primary energy supply by fuel from IEA ............................ 29
Table 9: Overview of barriers to implementation ............................................ 46
Implementation of Nationally Determined Contributions: Indonesia
10
List of Abbreviations
BAPPENAS Ministry of National Development Planning / National Development Planning Agency
BAU Business as Usual
BUR Biennial Update Report
CCNCT Climate Change National Coordination Team
CDM Clean Development Mechanism
COP Conference of the Parties
CPP Coal Power Plant
G77 Group of 77
GDP Gross Domestic Product
GHG Greenhouse gas
GoI Government of Indonesia
HDI Human Development Index
ICCSR Indonesia Climate Change Sectoral Roadmap
IEA International Energy Agency
IKI German International Climate Initiative
INCAS Indonesian National Carbon Accounting System
IPCC International Panel on Climate Change
IPPU industrial processing and product use
ISPO Indonesian Sustainable Palm Oil
KEN National Energy Policy
ktoe kilotonne of oil equivalent
LCOE Levelized Costs of Electricity Production
LGE litres per gasoline equivalent
LULUCF Land Use, Land Use Change and Forestry
MoE Ministry of Environment
MoEF Ministry of Environment and Forestry
MRV Monitoring, Reporting and Verification
NAMA Nationally Appropriate Mitigation Action
NDC Nationally Determined Contribution
OPEC Organisation of Petroleum-Exporting Countries
PLN Perusahaan Listrik Negara (Indonesian state-owned electricity supplier)
PV photovoltaics
RAD-GRK Provincial Action Plan for Greenhouse Gas Reduction
Implementation of Nationally Determined Contributions: Indonesia
11
RAN-GRK National Action Plan for Greenhouse Gas Reduction
REDD+ Reducing Emissions from Deforestation and Forest Degradation and the role of conservation, sustainable management of forests and enhancement of forest carbon stocks in developing countries
RES Renewable Energy Sources
RIKEN National Energy Conservation Master Plan
RPJMN National Medium Term Development Plan
RUKN General Plan for National Electricity Development
RUPTL Electricity Supply Business Plan 2016-2025
UKP4 Delivery Unit for Development Monitoring and Oversight
Implementation of Nationally Determined Contributions: Indonesia
12
1 Part I: Summary 1.1 Country background Geography. Indonesia, the world's largest island country, covers an area of over 1.9 million km2. The country consists of five large islands (Sumatra, Java, Kalimantan, Sulawesi, Papua) and more than 17,000 smaller islands, of which only about 6,000 are populated (GoI 2015).
Population. With a population of 254 million in 2014 according to World Bank figures (World Bank 2017a), Indonesia is the fourth-most populated country in the world. 50% of the population is located on Java. The growth rate of the population is declining but still well over 1%. Projections of the Indonesian government indicate that the country's population will reach 300 million in 2030 (GoI 2015).
Economy. Indonesia was heavily affected by the Asian financial crisis in the late 1990s, leading to political unrest that triggered the shift from the Suharto regime to democratisation (Ardiansyah et al. 2015). Between 2000 and 2017, the country has seen high average economic growth rates. Having initially very high growth rates after the regime change (up to a record high of over 7% in 2004), economic growth stabilised at 5-6%, with an annual GDP of around USD 900 billion (nominal) in recent years according to World Bank figures (sixteenth-largest nominal GDP in the world) (World Bank 2017a).
Average nominal GDP per capita is moderately high at about USD 3,500. Indonesia's poverty rate has fallen rapidly from almost 70% in 1998 at the height of the Asian financial crisis, but is still high, with about 10% of the population living on less than USD 1.90 a day (ibid).
Main sectors of Indonesia's economy lie in agriculture (including the palm oil industry), mining (including coal) as well as oil and gas extraction, tourism, textile and electronics industry (GoI 2015).
Table 1: Key socio-economic figures (2014)
Indonesia
Population [million] 254 Urban population [% of total]
5
GDP [current billion USD] 890 Air pollution index (ug/m3) 15
GDP/Cap [current USD/cap] 3500 HDI 0.68
Gini-coefficient 39.5 Corruption index 3.0
Electrification rate 96% Vulnerability 0.4
Data sources: (ND-GAIN 2017; UNDP 2015; United Nations 2014; World Bank 2017a); GDP per capita calculated based on (World Bank 2017a). HDI: 0 – 1, with 1 being highest. GINI Index 0 – 100, 0 = equal income distribution. Corruption index: CPIA transparency, accountability, and corruption in the public sector rating (1=low to 6=high). Vulnerability: 0-1, (0 low to 1 high), element of ND-GAIN index.
Political system. Indonesia is a constitutional democratic republic, with a directly-elected president as head of state (currently Joko Widodo). The president appoints a council of ministers as the executive. Indonesia has currently 34 ministries, which are organised under four coordinating ministries (Coordinating Ministries for: Political, Legal, and Security Affairs; Economic Affairs; Maritime Affairs and Natural Resources; Human Development) (Ardiansyah et al. 2015).
With the installation of its democratic system, Indonesia has made a strong push towards decentralisation, giving regional and local political levels much more economic and political autonomy than under the Suharto regime. In recent years, there has been a trend back towards partial
Implementation of Nationally Determined Contributions: Indonesia
13
centralisation of political powers. This has created a complex web of governance that is not always clear as to whom decision-making power ultimately falls. Political experts have claimed that Indonesia's governance system is subject to clientelism and vested interests of powerful economic stakeholders such as the palm oil and coal mining industry (Di Gregorio et al. 2017).
Institutions. Overall, the executive branch of government plays the most important role in the field of climate change in Indonesia. The current President is committed to reducing greenhouse gas emissions and reducing deforestation. A number of different ministries play key roles in Indonesia's approach by issuing decrees and regulations and plans.
The Ministry of Environment and Forestry is one of the most important ministries in formulating Indonesia's approach to climate change. However, other ministries also play crucial roles for the country's climate-relevant policy architecture.
The Ministry of National Development Planning / National Development Planning Agency (BAPPENAS) plays another key role in the development of Indonesia's medium and long-term development strategies. It has led the formulation and review of Indonesia's National Action Plan for Greenhouse Gas Reduction (RAN-GRK) (BAPPENAS 2015), the country's main climate strategy.
From 2008 to 2015, the National Council on Climate Change, an independent body of 17 ministers chaired by the President, coordinated Indonesia's climate policies. An administrative reform in early 2015 subsumed the National Council, as well as the country's REDD+ body under the Directorate General of Climate Change in the newly-formed Ministry of Environment and Forestry (previously two separate ministries). The current institutional set-up for climate change protection is not entirely clear, as the institutional reforms of 2015 have still to clarify the respective responsibilities of the Ministry of Environment and Forestry on the one, and BAPPENAS on the other hand (van Tilburg et al. 2016).
Other influential ministries include the Ministry of Agriculture, the Ministry of Energy and Mineral Resources, the Ministry of Transport, the Ministry of Industry, the Ministry of Public Works and Housing, and the Ministry of Finance.
Position in the international climate negotiations. Indonesia is part of the G77 (the largest country grouping of developing countries), the Coalition of Rainforest Nations (mainly concerned with furthering REDD+ as a financing mechanism) and the Like Minded Group of countries (which strongly pushes for a continuing strong separation between developed and developing countries, and their respective responsibilities). It is also part of OPEC, being the first OPEC country to have ratified the Kyoto Protocol in 2004 (Reid 2012).
Indonesia has in the past played a mostly constructive, if not highly visible role in the climate negotiations under the UNFCCC. The country has often helped to further consensus-building among developing countries, and also with industrialised countries, e.g. by using its good relationship with Australia. Its most public effort was its role as host country of the highly successful COP13 in Bali in 2007 that resulted in the Bali Roadmap (ibid.).
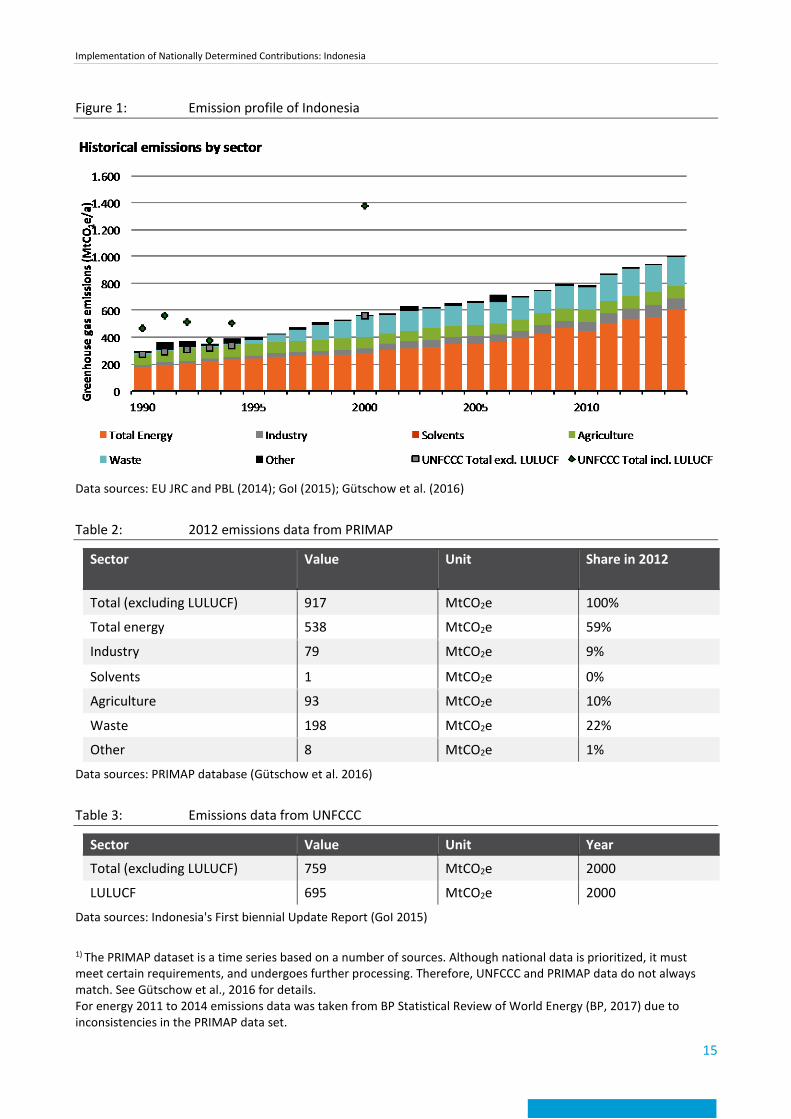
1.2 Emission trends Emissions. Emission data from different sources show considerable differences in detail, however, the overall picture is consistent. Up until today, Indonesia's GHG emissions have been dominated by forestry (LULUCF) emissions, mainly intended and unintended fires in rain forests and peat land (see Figure 5). Especially emissions from peat land fires show high variations from year to year, as they only occur in relatively dry years. Total emissions without LULUCF are given to be in the range between 554 MtCO2e (according to the country's first Biennial Update Report (GoI 2015) and 917 MtCO2e (according to the PRIMAP database). Differences mainly stem from higher waste related
Implementation of Nationally Determined Contributions: Indonesia
14
emissions in PRIMAP compared to data communicated in the BUR. Emission growth results mainly from increases in energy related emissions (from 180 MtCO2e in 1990 to 608 MtCO2e in 2014).
Future projections (see section on NDC) show stable or even decreasing forest emissions (in Indonesia's conditional mitigation scenario down to 64 MtCO2e). In contrast energy emissions are expected to increase massively - almost quadruple to more than 1,600 MtCO2 in 2030 in a BAU scenario. Even in the most optimistic conditional scenario energy emissions are expected to be almost three-fold today's level (Republic of Indonesia, 2016). Thus, with a short to mid-term perspective reducing emissions from forest fires should be a priority. Under a mid to long-term perspective it will be even more important to limit the emission growth in the energy sector.
While emissions per capita are currently at a relatively low level (3.8 tCO2e excluding LULUCF and 5 tCO2e including LULUCF) they are expected to grow considerably even in the unconditional pledge scenario of Indonesia's NDC (6 tCO2e excluding LULUCF and 7 tCO2e including LULUCF).
Implementation of Nationally Determined Contributions: Indonesia
15
Figure 1: Emission profile of Indonesia
Data sources: EU JRC and PBL (2014); GoI (2015); Gütschow et al. (2016)
Table 2: 2012 emissions data from PRIMAP
Sector Value Unit Share in 2012
Total (excluding LULUCF) 917 MtCO2e 100%
Total energy 538 MtCO2e 59%
Industry 79 MtCO2e 9%
Solvents 1 MtCO2e 0%
Agriculture 93 MtCO2e 10%
Waste 198 MtCO2e 22%
Other 8 MtCO2e 1%
Data sources: PRIMAP database (Gütschow et al. 2016)
Table 3: Emissions data from UNFCCC
Sector Value Unit Year
Total (excluding LULUCF) 759 MtCO2e 2000
LULUCF 695 MtCO2e 2000
Data sources: Indonesia's First biennial Update Report (GoI 2015)
1) The PRIMAP dataset is a time series based on a number of sources. Although national data is prioritized, it must meet certain requirements, and undergoes further processing. Therefore, UNFCCC and PRIMAP data do not always match. See Gütschow et al., 2016 for details. For energy 2011 to 2014 emissions data was taken from BP Statistical Review of World Energy (BP, 2017) due to inconsistencies in the PRIMAP data set.
Implementation of Nationally Determined Contributions: Indonesia
16
Figure 2: Energy profile of Indonesia
Data sources: IEA (2016a).
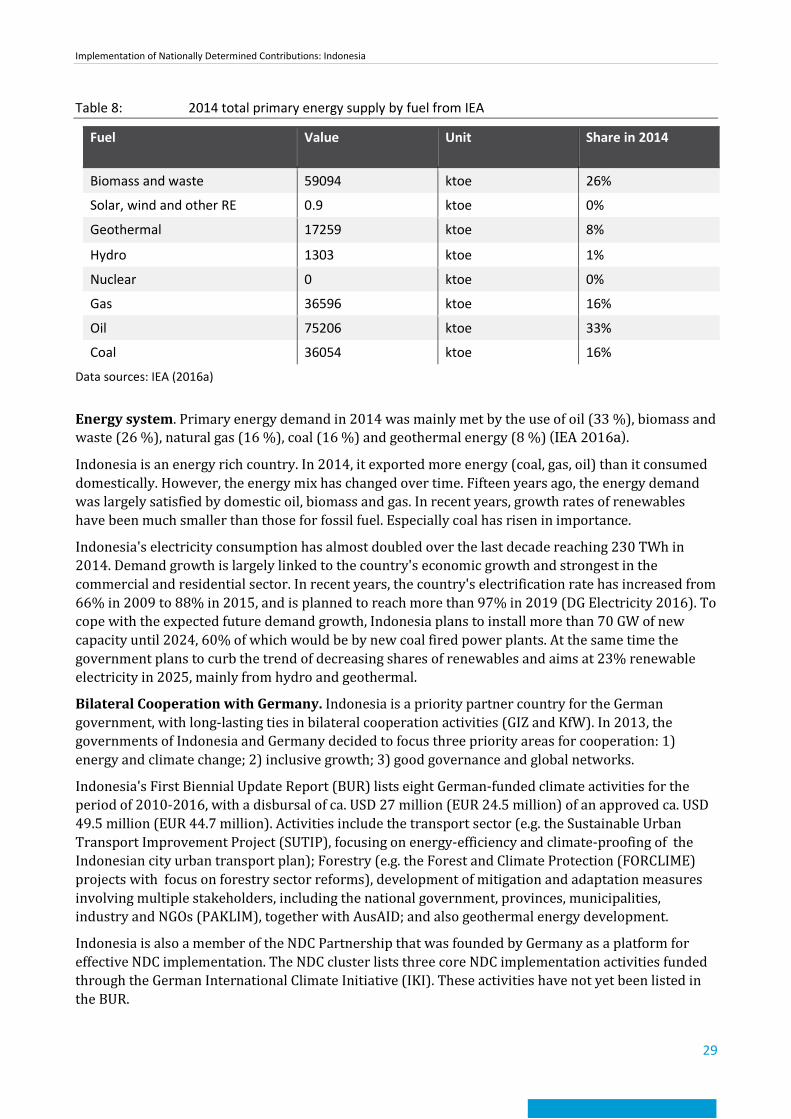
Table 4: 2014 total primary energy supply by fuel from IEA
Fuel Value Unit Share in 2014
Biomass and waste 59094 ktoe 26%
Solar, wind and other RE 0.9 ktoe 0%
Geothermal 17259 ktoe 8%
Hydro 1303 ktoe 1%
Nuclear 0 ktoe 0%
Gas 36596 ktoe 16%
Oil 75206 ktoe 33%
Coal 36054 ktoe 16%
Data sources: IEA (2016a).
Energy system. Primary energy demand in 2014 was mainly met by the use of oil (33 %), biomass and waste (26 %), natural gas (16 %), coal (16 %) and geothermal energy (8 %) (IEA 2016a).
Indonesia is an energy rich country. In 2014, it exported more energy (coal, gas, oil) than it consumed domestically. However, the energy mix has changed over time. Fifteen years ago, the energy demand was largely satisfied by domestic oil, biomass and gas. In recent years, growth rates of renewables have been much smaller than those for fossil fuel. Especially coal has risen in importance.
Indonesia's electricity consumption has almost doubled over the last decade, reaching 230 TWh in 2014. Demand growth is largely linked to the country's economic growth and strongest in the commercial and residential sector. In recent years, the country's electrification rate has increased from 66% in 2009 to 88% in 2015, and is planned to reach more than 97% in 2019 (DG Electricity 2016). To
Implementation of Nationally Determined Contributions: Indonesia
17
cope with the expected future demand growth, Indonesia plans to install more than 70 GW of new capacity until 2024, 60% of which would be by new coal fired power plants. At the same time the government plans to curb the trend of decreasing shares of renewables and aims at 25% renewable electricity in 2015, mainly from hydro and geothermal.
Coal. Indonesia is the fifth largest coal producer in the world, with a production of 484 Mt per year. The export share is almost 85%, which makes Indonesia the biggest coal exporter in the world. With an export value of more than USD 23 billion (The Observatory of Economic Complexity - OEC 2016), coal is responsible for 10% of the country's export volume (palm oil is 9%). Thus, the coal industry is a key economic factor for the whole country, providing jobs and royalties for coal mining regions.
Exports of hard coal have gone to many Asian countries, while brown coal predominantly was exported to China. After steep growth rates over the last decades, coal exports have decreased in 2015. The reduced demand from countries like China, India and Japan falls in line with a change in the national energy strategy, which aims at a cap of coal production at 400 Mt per year. Coal is increasingly to be directed towards domestic use underpinning the plan to massively ramp up coal fired power plants.
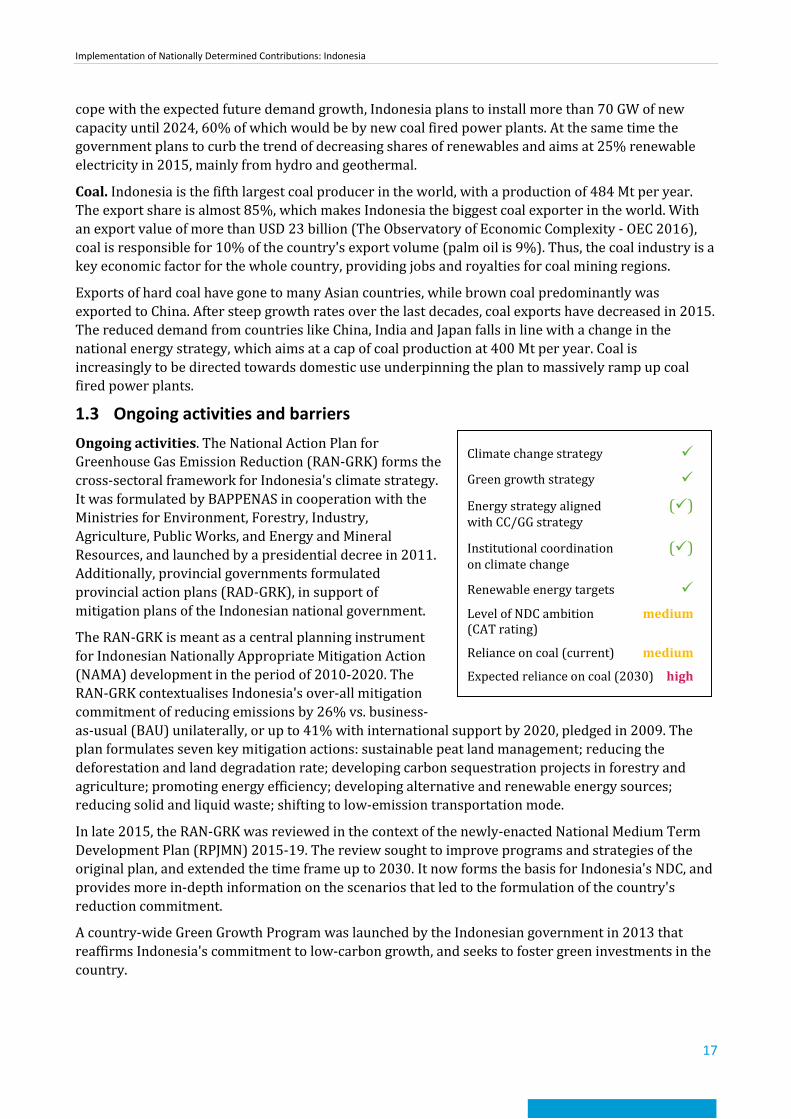
1.3 Ongoing activities and barriers Ongoing activities. The National Action Plan for Greenhouse Gas Emission Reduction (RAN-GRK) forms the cross-sectoral framework for Indonesia's climate strategy. It was formulated by BAPPENAS in cooperation with the Ministries for Environment, Forestry, Industry, Agriculture, Public Works, and Energy and Mineral Resources, and launched by a presidential decree in 2011. Additionally, provincial governments formulated provincial action plans (RAD-GRK), in support of mitigation plans of the Indonesian national government.
The RAN-GRK is meant as a central planning instrument for Indonesian Nationally Appropriate Mitigation Action (NAMA) development in the period of 2010-2020. The RAN-GRK contextualises Indonesia's over-all mitigation commitment of reducing emissions by 26% vs. business-as-usual (BAU) unilaterally, or up to 41% with international support by 2020, pledged in 2009. The plan formulates seven key mitigation actions: sustainable peat land management; reducing the deforestation and land degradation rate; developing carbon sequestration projects in forestry and agriculture; promoting energy efficiency; developing alternative and renewable energy sources; reducing solid and liquid waste; shifting to low-emission transportation mode.
In late 2015, the RAN-GRK was reviewed in the context of the newly-enacted National Medium Term Development Plan (RPJMN) 2015-19. The review sought to improve programs and strategies of the original plan, and extended the time frame up to 2030. It now forms the basis for Indonesia's NDC, and provides more in-depth information on the scenarios that led to the formulation of the country's reduction commitment.
A country-wide Green Growth Program was launched by the Indonesian government in 2013 that reaffirms Indonesia's commitment to low-carbon growth, and seeks to foster green investments in the country.
Climate change strategy
Green growth strategy
Energy strategy aligned () with CC/GG strategy
Institutional coordination () on climate change
Renewable energy targets
Level of NDC ambition medium (CAT rating)
Reliance on coal (current) medium
Expected reliance on coal (2030) high
Implementation of Nationally Determined Contributions: Indonesia
18
In the energy sector, the National Energy Policy sets the country's targets for the future energy mix. It is complimented by the Electricity Supply Business Plan 2016-2025. The Energy Law and the National Energy Conservation Master Plan (RIKEN) regulate energy demand and set energy efficiency targets.
Another large set of activities exists in the forestry sector, as Indonesia has among the highest deforestation and land degradation rates worldwide, and accordingly high emissions in this field. As early as 2010, Norway and Indonesia signed a Letter of Intent for a partnership on Indonesia's REDD+ strategy. Norway has pledged up to USD 1 billion over seven years for verified progress in REDD+ readiness and implementation. One of the most prominent outcomes of this partnership has been a moratorium on new forestry licenses and peat land development, which was issued by the President in 2011. Originally only envisaged for two years, the moratorium was extended twice already, in 2013 and 2015. The moratorium only affects areas mapped as primary forest, and does not affect existing licenses.
Since Indonesia's land use mapping is not harmonised across different entities and political levels, the President has also instated the so-called One Map Initiative, which seeks to develop a clear and current mapping of the country for use by all political institutions that is transparent to all stakeholders. The initiative is part of the partnership with Norway, and was started in 2011 already.
Law 30/2007 Regarding Energy is a comprehensive legislation for Indonesia's future energy system. It includes references to sustainable development, environmental preservation and energy resilience in the country's energy management. This "Energy Law" gives general guidelines, both for demand and supply of energy in Indonesia. The Law aims to promote energy efficiency through the creation of an energy source inventory, promotion of energy conservation, and improvements to energy storage and transmission. The Energy Law is supplemented on the demand side by RIKEN. RIKEN sets a national target to decrease energy intensity by 1% annually until 2025. The plan identified energy efficiency potential of for 15-30% for industry; 10-30% for households, and 25% in commercial buildings
The National Energy Policy (KEN) sets the country's targets for the future energy mix, i.e. the supply side. It is complimented by the Electricity Supply Business Plan 2016-2025 (RUPTL), which sets the targets for extension in generation capacity of 35 GW until 2019, plus 80,5 GW until 2025. It reflects the KEN's goal of a renewable energy share of 23% by 2025, but also retains the target of a 60% share of coal in the generation capacity by 2025 (ICED 2016).
In the transport sector, a NAMA is under implementation. The Sustainable Urban Transport Programme Indonesia (NAMA SUTRI) aims at developing demonstration projects, at first in seven pilot cities, for various urban transport improvements, such as new bus fleets and sustainable urban infrastructure development.
Indonesia has also been active in the development of carbon markets. Domestically, it was envisaged to create a voluntary cap-and-trade system, but it has not yet gone beyond the first design stages.
However, the governments of Japan and Indonesia have signed a cooperation agreement under Japan's bilateral Joint Crediting Mechanism in 2013. Already 108 feasibility studies have been undertaken until the end of 2016. Seven projects have been registered, all of them in the field of energy demand reductions.
Indonesia has also been active in the UNFCCC's Clean Development Mechanism (CDM), under which 152 projects are listed. Among them are several large-scale geothermal projects, with estimated emission reductions of around one million tons of CO2e.
Indonesia has voluntarily pledged USD 300,000 to the Green Climate Fund. The country also installed a national Climate Change Trust Fund in 2010 in order to scale up financing and to attract international finance for green projects.
Implementation of Nationally Determined Contributions: Indonesia
19
Barriers. Due to its high degree of decentralisation, Indonesia faces large institutional barriers to implementation. Irrespective of the specific mitigation action (reducing deforestation, increasing the share of renewables etc.) governance challenges are repeatedly considered as key barriers to implementation in the reviewed literature.
While the national government, and notably the President, is committed to tackling emission reductions as well as deforestation issues, these commitments often are not translated effectively to regional and local levels.
Institutional barriers also exist vertically, on the national level. Indonesia's large number of ministries and responsible authorities sometimes hinder each other in their effectiveness because of overlapping responsibilities and policy fields. Due to a lack of sectorial integration, sectors governed by different ministries face varyingly strong environmental regulations.
Aggravating this are instances of clientelism and vested interests of business and industry actors. Strong economic actors often have the ear of the politicians and administrators on various political levels, and have considerable influence in shaping policies. This has even led to government officials opposing efforts by the private sector to "green" businesses as harmful to Indonesian business, and not in line with government authority.
Another key barrier has been energy subsidies and low energy costs. In the past Indonesia has heavily subsidised the fossil energy sector. In 2012 87% of total subsidies in Indonesia went into energy, amounting to USD 36.2 billion, equivalent to more than 4% of the country’s GDP (IISD 2012). Even though efforts have been undertaken to reduce energy subsidies, they still remain a strong barrier to the introduction of renewable energy. Furthermore, low energy prices make many energy efficiency approaches less profitable.
Bilateral Cooperation with Germany. Indonesia is a priority partner country for the German government, with long-lasting ties in bilateral cooperation activities (GIZ and KfW). In 2013, the governments of Indonesia and Germany decided to focus on three priority areas for cooperation: 1) energy and climate change; 2) inclusive growth; 3) good governance and global networks (GIZ n.d.).
Indonesia's First Biennial Update Report (BUR) lists eight German-funded climate activities for the period of 2010-2016, with a disbursal of ca. USD 27 million (EUR 24.5 million) of an approved ca. USD 49.5 million (EUR 44.7 million). Activities include the transport sector (e.g. the Sustainable Urban Transport Improvement Project (SUTIP), focusing on energy-efficiency and climate-proofing of the Indonesian city urban transport plan); Forestry (e.g. the Forest and Climate Protection (FORCLIME) projects with focus on forestry sector reforms), development of mitigation and adaptation measures involving multiple stakeholders, including the national government, provinces, municipalities, industry and NGOs (PAKLIM), together with AusAID; and also geothermal energy development.
Indonesia is also a member of the NDC Partnership that was founded by Germany as a platform for effective NDC implementation. The NDC cluster lists three core NDC implementation activities funded through the German International Climate Initiative (IKI). These activities have not yet been listed in the BUR.
1.4 NDC and further mitigation potential NDC. Indonesia's Nationally Determined Contribution (NDC) contains an unconditional domestic reduction pledge of 29% versus a business-as-usual (BAU) scenario in 2030, as well as up to 41% below BAU in 2030 conditional to sufficient international support. As early as 2009, Indonesia had already pledged an unconditional reduction of 26% below BAU in 2020. The NDC covers energy, waste, industrial processing and product use (IPPU), agriculture and forestry.
Implementation of Nationally Determined Contributions: Indonesia
20
Figure 3: Historic emissions, BAU projections and pledge according to Indonesia's BUR and NDC
Data sources: historic data (2000 - 2012) taken from first Biennial Update Report, BUR (GoI 2015), 2030 business-as-usual (BAU) data and pledge from Nationally Determined Contribution, NDC (Republic of Indonesia, 2016).
The country's BAU scenario assumes emissions from forest and peat fires to be slightly above the last decade's average (see Figure 3). The largest growth is expected to come from non-LULUCF sectors, especially energy (6.7% annual growth of emissions) and waste (6.3%) (Republic of Indonesia, 2016). Assumed future growth rates are significantly higher than historic (2000 - 2012) growth rates for energy (4.5%) and waste (4%). For the energy sector this growth rate corresponds to a total growth of almost a factor of four between 2010 and 2030.This is largely due to the envisaged increase in coal-fired electricity generation (see above).
Underlying assumptions for the BAU scenario are described in quite some detail in the RAN-GRK re-view of 2015 (BAPPENAS 2015). However, inconsistencies between NDC and RAN-GRK exist, which hinder a rigid assessment of Indonesia's BAU. For the energy sector, the expected growth in emis-sions is massive (almost quadrupling between 2010 and 2030). However, RAN-GRK states 1,444 Mt CO2e in 2030 in contrast to 1,669 Mt CO2e in 2030 assumed in the NDC. This difference falls in line with different assumptions on overall economic growth (being the key driver for emissions in the en-ergy sector): In RAN-GRK the economy is assumed to grow at 5-6%. In contrast the first Indonesian BUR refers to economic growth targets between 6 and 8% annually, which is clearly above the his-toric growth of 4.6% to 6.5% between 2000 and 2012 (GoI 2015). For the energy sector, the expected emission growth according to RAN-GRK is largely due to the envisaged increase in coal-fired electric-ity generation, which links well to the country's energy strategy. However, details on some BAU as-sumptions seem unrealistic e.g. "no additional renewable capacity after 2010" or coal "power plant efficiency remains constant after 2010".
Mitigation potential. Indonesia's mitigation contributions as stipulated in the country's NDC mainly result from emission reductions in forestry (including peat fires) and the energy sector. These two sectors would by far constitute the largest share of emissions under the country's BAU scenario in 2030. Therefore, we focus on these sectors in the assessment of mitigation potentials and actions. In addition, we have included an assessment of energy efficiency improvements in the industrial and
0
500
1000
1500
2000
2500
3000
3500
1990 1995 2000 2005 2010 2015 2020 2025 2030
Gre
enho
use
gas e
mis
sion
s (M
tCO
2e)
Nationally Determined Contribution
NDC Baseline Baseline LULUCF emissions
Unconditional NDC target Conditional NDC target
Implementation of Nationally Determined Contributions: Indonesia
21
transport sectors. While not explicitly mentioned in Indonesia's NDC, they have strong potential to reduce emissions economically.
In the LULUCF sector, the reductions pledged by Indonesia in its NDC can count as quite ambitious - the reduction scenario in the LULUCF sector envisages a reduction from ca. 650 MtCO2e/a in 2010 to a third of that value (217 MtCO2e/a) unconditionally in 2030, and to a tenth, 64 MtCO2e/a, conditional on international support (GoI 2016). However, both historical data and estimates of future emissions in the sector vary widely across sources, so any value for emissions reduction potential is extremely uncertain. Many sources have reported that the largest problem in the LULUCF sector lies not within ambition, but within implementation. Therefore, any activity that strengthens forest governance and compliance with existing rules will likely have a positive effect on the country's level of mitigation.
Among the most promising activities are a moratorium on palm oil concessions that would complement an existing moratorium on new forestry licenses, and predominantly, the development of a unified forestry mapping system ("One Map Initiative") which has been underway for several years. Furthermore, Indonesia could consider revisiting its spatial planning processes with an aim to incorporate existing environment and climate regulation such as its national and regional GHG reduction plans, as well as recent laws and court decisions on land tenure and resource management. While we cannot quantify the potential of these governance measures, we expect them to have a large impact on real-world emission reductions, as they will greatly aid in the implementation of the already ambitious plans for reducing emissions from forestry and peat land fires.
In the energy sector, Indonesia shows a mixed picture: on the one hand strategies and targets to promote renewables and energy efficiency can be considered quite ambitious when compared to past developments. On the other hand, cost calculations show that a 27% emission reduction underneath the BAU scenario, as stipulated in Indonesia's NDC, would bring a slight positive impact on GDP. More ambitious mitigation targets therefore would likely not put a heavy economic burden on the country. Their implementation may nevertheless be challenging.
One of the key drivers for energy emissions is the plan to build up to 40 GW in new coal fired power plants until 2025. This would determine a long-lasting growth in emissions. A broad mix of technological solutions supported with a stringent policy mix is necessary to limit power sector emissions. Indonesia also has a large potential for geothermal energy (28 GW). Even larger are hydro (75 GW), solar or ocean energy potential (IEA 2015) however with larger limitations for short term accessibility or higher costs. Furthermore, Indonesia has a large biomass potential. However, land use conflicts need to be considered here (biofuels for transport, deforestation), and can lead to increased emissions from forest clearing and peatland drainage (see section on LULUCF).
In general, demand growth also needs to be outbalanced by intensified energy efficiency measures, predominantly in the industrial and the transport sectors. These two sectors have in the past taken the largest share in final energy consumption in the country. Both sectors are characterised by signifi-cant inefficiencies, and, in the case of the transport sector, a lack of enforceable regulation.
Implementation of Nationally Determined Contributions: Indonesia
22
2 Part II: Selected fields of action The fields of action were selected after considering historic and projected sectoral emissions development; comprehensive literature on GHG mitigation potentials; identified barriers and emissions reductions; feasibility, costs, and co-benefits. For more information on mitigation potentials in Indonesia, see section 3.6.
2.1 LULUCF governance and monitoring Effective implementation of “One Map Initiative”. As a result of rigorous decentralisation efforts following fall of the Suharto regime and the economic crisis in South-East Asia in the late 1990s, much more power was given to local and regional political levels than in the previous, largely centralised, regime. This has certainly had many positive effects on regional autonomy and democratisation (Ardiansyah et al. 2015).
However, it has also led to a number of regulatory uncertainties, especially regarding land titles, but also in regard to the classification of forested and other land types. A clear and consistent use of geospatial data for mapping the country is crucial to land-use planning and sustainable use of available land, and potentially strongly reducing apparent needs for clearing forested areas if alternative lands are more easily identifiable. At the same time, a unified map can clarify ownership of areas, help alleviate conflicts of interest and lessen problems of corruption (Mulyani and Jepson 2016).
Such an effort has already begun to take place through the Indonesian government's "One Map Policy" that aims at developing a single base map for planning processes in Indonesia, whereas currently different political entities as well as different regions mainly use different maps of varying exactitude and age.
In order to put Indonesia's plans to reduce deforestation rates on a strong footing, putting the One Map Initiative into practice, and ensuring that governmental agencies at all levels use the harmonised maps as their basis for decision-making is expected to be an effective measure. While we cannot quantify the potential of this governance measure, we expect it to have a large impact on real-world emission reductions, as it will greatly aid in the implementation of the already ambitious plans for reducing emissions from forestry and peat land fires.
The development of a unified mapping effort is not an easy task, as it requires reforms of regulations at different political levels, new standards and formats, and not least political support. Progress of implementation has been slow so far, and the country may profit from further political and capacity support in this area (Mulyani and Jepson 2016).
Revising and streamlining the plans for development and climate. The Indonesian Government has developed discrete plans for economic development, GHG reduction, and REDD+, among others. These plans are most often developed by different ministries or political institutions with own agendas and interests, and are consequently often not aligned. As importantly, they are often not aligned with concrete spatial planning for land use. As a consequence, GHG reductions in the LULUCF sector that appear easily implementable at low cost on paper may not materialise in practice, due to incompatible spatial planning, or competing plans and legislation of another focus (Anderson et al. 2016).
In order to maximise GHG reduction opportunities, Indonesia could therefore consider revisiting its spatial planning processes with an aim to incorporate existing environment and climate regulation such as its national and regional GHG reduction plans, as well as recent laws and court decisions on land tenure and resource management. Resources need to be provided to enforce existing laws and regulations on land use and sustainable forestry, and for oil palm plantations to ensure compliance with national as well as international sustainability standards (Di Gregorio et al. 2017).
Implementation of Nationally Determined Contributions: Indonesia
23
This will likely not be an easily implementable process, as such a reform would mean going against many strong vested interests, especially from the palm oil industry in Indonesia, but also against political interests on the various political levels. However, to realise the level of mitigation that is envisioned in the country's NDC, this may be one of the most important challenges to tackle for Indonesia in the short term, and will likely also positively affect other sectors. 2.2 Electricity demand and generation Currently, Indonesia's GHG emissions from energy use are lower than those of the LULUCF sector. However, a massive growth is expected. According to Indonesia's NDC, energy emissions are expected to almost quadruple from 450 MtCO2e in 2010 to more than 1,600 MtCO2e in 2030 in a BAU scenario (GoI 2016). Even in the most optimistic "conditional" scenario, energy emissions are expected to be almost three-fold today's level. With a mid to long-term perspective it is crucial to limit this growth to a minimum.
One key driver for this potential emission growth is Indonesia's plan to massively expand its coal fired power plant capacities. Electricity demand is expected to grow due to high assumptions on economic growth as well as population growth, increasing electrification rates and continuing industrial expansion. The Indonesian Electricity Supply Business Plan 2016-2025 (RUPTL) by the state-owned utility includes a 35 GW capacity extension between 2015 and 2019, and 80 GW new capacity between 2015 and 2025 (climate policy database 2016, PwC 2016a). The estimated share of coal in the 2025 power mix ranges between 50% according to the Draft National Electricity Development Plan (Draft RUKN 2015-34) and 60% according to RUPTL (IEA 2016a, PwC 2016a). Thus, coal emissions would rise from 220 MtCO2 in 2015 to almost 500 MtCO2 in 2030 (IEA 2016b).
To assess potential mitigation strategies in the power sector, it is important to note:
► Indonesia is rich in fossil fuel reserves - oil, gas and especially coal. While the country has become a net importer of oil, it has been the world's largest exporter of thermal coal.
► Coal production has seen a steep increase over the last decade. However, after a peak in 2013, coal production has levelled off to 470 Mt/a in 2015, due to reduced demand from Asian countries like China (IEA 2016c).
► The country's energy strategy prioritises energy security (reducing import dependency) and has thus put out a minimum target for coal (30% of primary energy) as well as a regulation that a minimum share of 24.17% of coal has to be sold to the domestic market (IEA 2015b).
► Electricity generation has doubled in last decade. The share of coal in the power mix has risen during this time up to 56% in 2015, while the share of renewables shrunk to approx. 10% (IEA 2016b).
► The country has put up a target of 23% renewables in the power mix by 2025. This is high compared to current trends in renewables development in the country. On the other hand, Indonesia has a tremendous potential for renewables, including geothermal, hydro and solar. This potential goes significantly beyond existing plans. However, currently strong disincentives exist for the state owned utility PLN to increase the share of renewables.
We see a high risk of a long-term carbon lock-in if Indonesia would really build as many coal-fired power plants as currently planned. This development can obviously not be countered by any single action, but requires an integrated mitigation strategy with complementing actions:
► Reducing demand by increasing energy efficiency: Indonesia's demand projections are most likely on the higher end of probable scenarios. In any case, electricity demand growth could strongly be limited through increased energy efficiency. Efficient lighting, electronics and appliances both for residential and commercial use have a large reduction potential at negative costs (DNPI 2010). Even more importantly, the industrial sector today accounts for almost half of
Implementation of Nationally Determined Contributions: Indonesia
24
Indonesia's energy consumption, and is rated as inefficient by international benchmarks (Tharakan 2015). Growth could be sustained at much lower energy intensity rates via a mix of targeted energy efficiency policies (Ward et al. 2015).
► Ramping up renewables quickly: Indonesia has ambitious renewable targets. The first important step would be to make progress in the implementation of large-scale renewable projects quickly. An increased share of renewables will have a positive economic effect: cost calculations show for example that a 27% emission reduction below the BAU scenario, as stipulated in Indonesia's NDC, would bring a positive impact on GDP (Siagian, Yuwono, Fujimori, Masui 2017). Cost differences between photovoltaic (PV) and fossil alternatives have massively decreased in recent years and can be expected to decrease further. To reliably estimate short to mid-term potentials for PV, studies on today's cost structures for PV (and in comparison new coal fired power plants) in Indonesia would be necessary. If key decision makers in the energy sector gain confidence in the potential renewables offer in Indonesia, the current coal extension plans could be revised substantially. If coal-fired power plants are still built in the coming years, they need to fulfil highest efficiency standards.
► Aligning international finance: The plans for massive capacity expansion in the Indonesian power sector will rely on international finance. International donors and development banks should streamline their finance schemes to maximise mitigation options.
► Mining regions: Coal mining is an important economic factor in Indonesia. Alternative economic development for mining regions can reduce the lobbying power of the coal industry, which has about 1 million employees. It is important to note that coal mining also causes many negative local effects, from deforestation and land degradation to pollution of rivers and agricultural land. Implementation of more stringent environmental standards would on the one hand support the long-term sustainability of mining region. Furthermore, internalising the external costs of coal mining would render energy efficiency and renewable energy more competitive.
Implementation of Nationally Determined Contributions: Indonesia
25
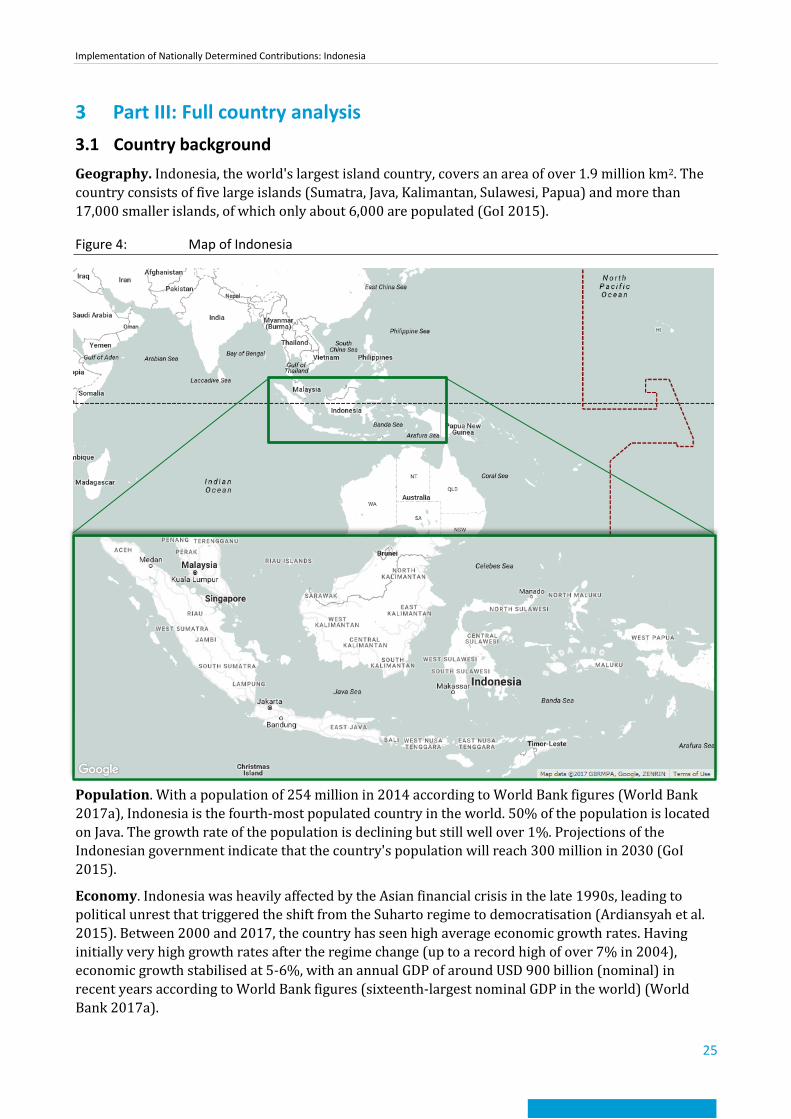
3 Part III: Full country analysis 3.1 Country background Geography. Indonesia, the world's largest island country, covers an area of over 1.9 million km2. The country consists of five large islands (Sumatra, Java, Kalimantan, Sulawesi, Papua) and more than 17,000 smaller islands, of which only about 6,000 are populated (GoI 2015).
Figure 4: Map of Indonesia
Population. With a population of 254 million in 2014 according to World Bank figures (World Bank 2017a), Indonesia is the fourth-most populated country in the world. 50% of the population is located on Java. The growth rate of the population is declining but still well over 1%. Projections of the Indonesian government indicate that the country's population will reach 300 million in 2030 (GoI 2015).
Economy. Indonesia was heavily affected by the Asian financial crisis in the late 1990s, leading to political unrest that triggered the shift from the Suharto regime to democratisation (Ardiansyah et al. 2015). Between 2000 and 2017, the country has seen high average economic growth rates. Having initially very high growth rates after the regime change (up to a record high of over 7% in 2004), economic growth stabilised at 5-6%, with an annual GDP of around USD 900 billion (nominal) in recent years according to World Bank figures (sixteenth-largest nominal GDP in the world) (World Bank 2017a).
Implementation of Nationally Determined Contributions: Indonesia
26
Average nominal GDP per capita is moderately high at about USD 3,500. Indonesia's poverty rate has fallen rapidly from almost 70% in 1998 at the height of the Asian financial crisis, but is still high, with about 10% of the population living on less than USD 1.90 a day (ibid).
Main sectors of Indonesia's economy lie in agriculture (including the palm oil industry), mining (including coal) as well as oil and gas extraction, tourism, textile and electronics industry (GoI 2015).
Table 5: Key socio-economic figures (2014)
Indonesia
Population [million] 254 Urban population [% of total]
5
GDP [current billion USD] 890 Air pollution index (ug/m3) 15
GDP/Cap [current USD/cap] 3500 HDI 0.68
Gini-coefficient 39.5 Corruption index 3.0
Electrification rate 96% Vulnerability 0.4
Data sources: ND-GAIN (2017; UNDP (2015); United Nations (2014); World Bank (2017a); GDP per capita calculated based on World Bank (2017a). HDI: 0 – 1, with 1 being highest. GINI Index 0 – 100, 0 = equal income distribution. Corruption index: CPIA transparency, accountability, and corruption in the public sector rating (1=low to 6=high). Vulnerability: 0-1, (0 low to 1 high), element of ND-GAIN index.
Political system. Indonesia is a constitutional democratic republic, with a directly-elected president as head of state (currently Joko Widodo). The president appoints a council of ministers as the executive. Indonesia has a large and complex administrative set-up with currently 34 ministries, which are organised under four coordinating ministries (Coordinating Ministries for: Political, Legal, and Security Affairs; Economic Affairs; Maritime Affairs and Natural Resources; Human Development) (see Annex 1 for an overview of Indonesia's administrative organisation, as outlined in (Ardiansyah et al. 2015)).
With the installation of its democratic system, Indonesia has made a strong push towards decentralisation, giving regional and local political levels much more economic and political autonomy than under the Suharto regime. In recent years, there has been a trend back towards partial centralisation of political powers. This has created a complex web of governance that is not always clear as to whom decision-making power ultimately falls. Political experts have claimed that Indonesia's governance system is subject to clientelism and vested interests of powerful economic stakeholders such as the palm oil and coal mining industry (Di Gregorio et al. 2017).
Position in the international climate negotiations. Indonesia is part of the G77 (the largest country grouping of developing countries), the Coalition of Rainforest Nations (mainly concerned with furthering REDD+ as a financing mechanism) and the Like Minded Group of countries (which strongly pushes for a continuing strong separation between developed and developing countries, and their respective responsibilities). It is also part of OPEC, being the first OPEC country to have ratified the Kyoto Protocol in 2004 (Reid 2012).
Indonesia has in the past played a mostly constructive, if not highly visible role in the climate negotiations under the UNFCCC. The country has often helped to further consensus-building among developing countries, and also with industrialised countries, e.g. by using its good relationship with Australia. Its most public effort was its role as host country of the highly successful COP13 in Bali in 2007 that resulted in the Bali Roadmap (ibid.). The Roadmap sketched out the way toward a new global climate deal. That process ultimately failed in 2009 in Copenhagen, but is a fundamental building block of the current international climate governance architecture, including the concept of
Implementation of Nationally Determined Contributions: Indonesia
27
NAMAs, and also the bottom-up pledging of national climate targets that are now enshrined in countries' NDCs.
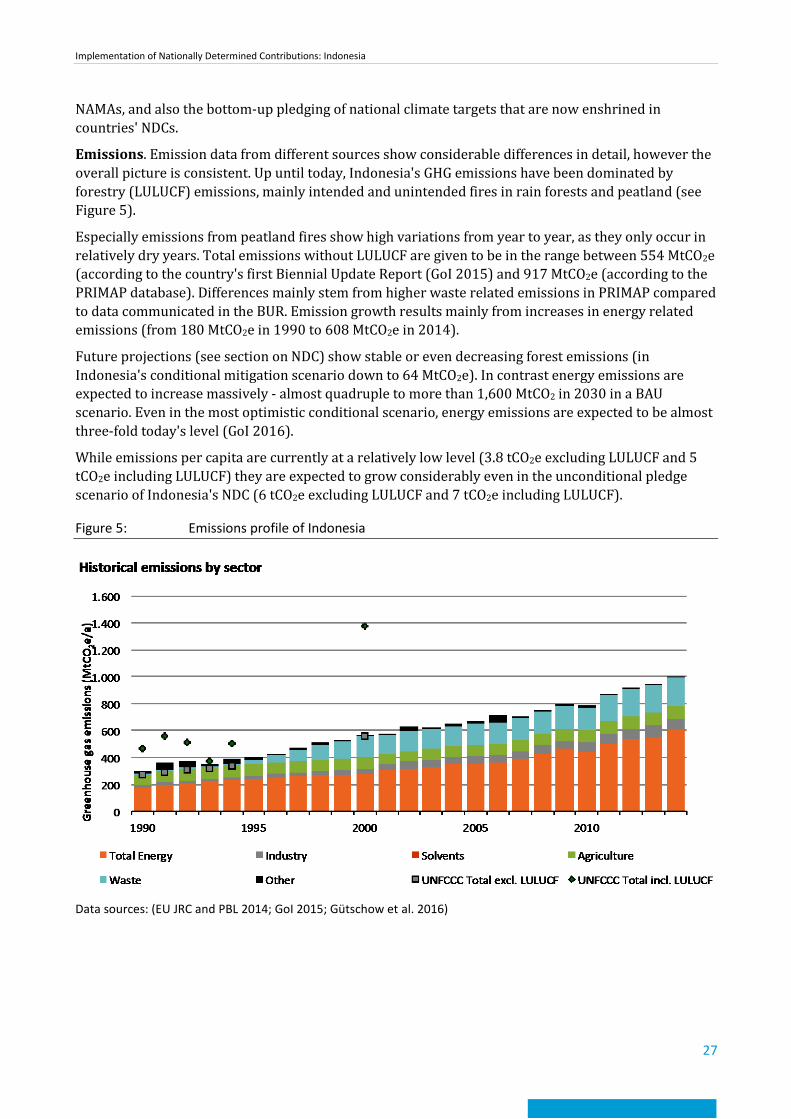
Emissions. Emission data from different sources show considerable differences in detail, however the overall picture is consistent. Up until today, Indonesia's GHG emissions have been dominated by forestry (LULUCF) emissions, mainly intended and unintended fires in rain forests and peatland (see Figure 5).
Especially emissions from peatland fires show high variations from year to year, as they only occur in relatively dry years. Total emissions without LULUCF are given to be in the range between 554 MtCO2e (according to the country's first Biennial Update Report (GoI 2015) and 917 MtCO2e (according to the PRIMAP database). Differences mainly stem from higher waste related emissions in PRIMAP compared to data communicated in the BUR. Emission growth results mainly from increases in energy related emissions (from 180 MtCO2e in 1990 to 608 MtCO2e in 2014).
Future projections (see section on NDC) show stable or even decreasing forest emissions (in Indonesia's conditional mitigation scenario down to 64 MtCO2e). In contrast energy emissions are expected to increase massively - almost quadruple to more than 1,600 MtCO2 in 2030 in a BAU scenario. Even in the most optimistic conditional scenario, energy emissions are expected to be almost three-fold today's level (GoI 2016).
While emissions per capita are currently at a relatively low level (3.8 tCO2e excluding LULUCF and 5 tCO2e including LULUCF) they are expected to grow considerably even in the unconditional pledge scenario of Indonesia's NDC (6 tCO2e excluding LULUCF and 7 tCO2e including LULUCF).
Figure 5: Emissions profile of Indonesia
Data sources: (EU JRC and PBL 2014; GoI 2015; Gütschow et al. 2016)
Implementation of Nationally Determined Contributions: Indonesia
28
Table 6: 2012 emissions data from PRIMAP
Sector Value Unit Share in 2012
Total (excluding LULUCF) 917 MtCO2e 100%
Total energy 538 MtCO2e 59%
Industry 79 MtCO2e 9%
Solvents 1 MtCO2e 0%
Agriculture 93 MtCO2e 10%
Waste 198 MtCO2e 22%
Other 8 MtCO2e 1%
Data sources: PRIMAP database (Gütschow et al. 2016)
Table 7: Emissions data from UNFCCC
Sector Value Unit Year
Total (excluding LULUCF) 759 MtCO2e 2000
LULUCF 695 MtCO2e 2000
Data sources: Indonesia's First biennial Update Report (GoI 2015)
1) The PRIMAP dataset is a time series based on a number of sources. Although national data is prioritized, it must meet certain requirements, and undergoes further processing. Therefore, UNFCCC and PRIMAP data do not always match. See Gütschow et al., 2016 for details. For energy 2011 to 2014 emissions data was taken from BP Statistical Review of World Energy (BP, 2017) due to inconsistencies in the PRIMAP data set.
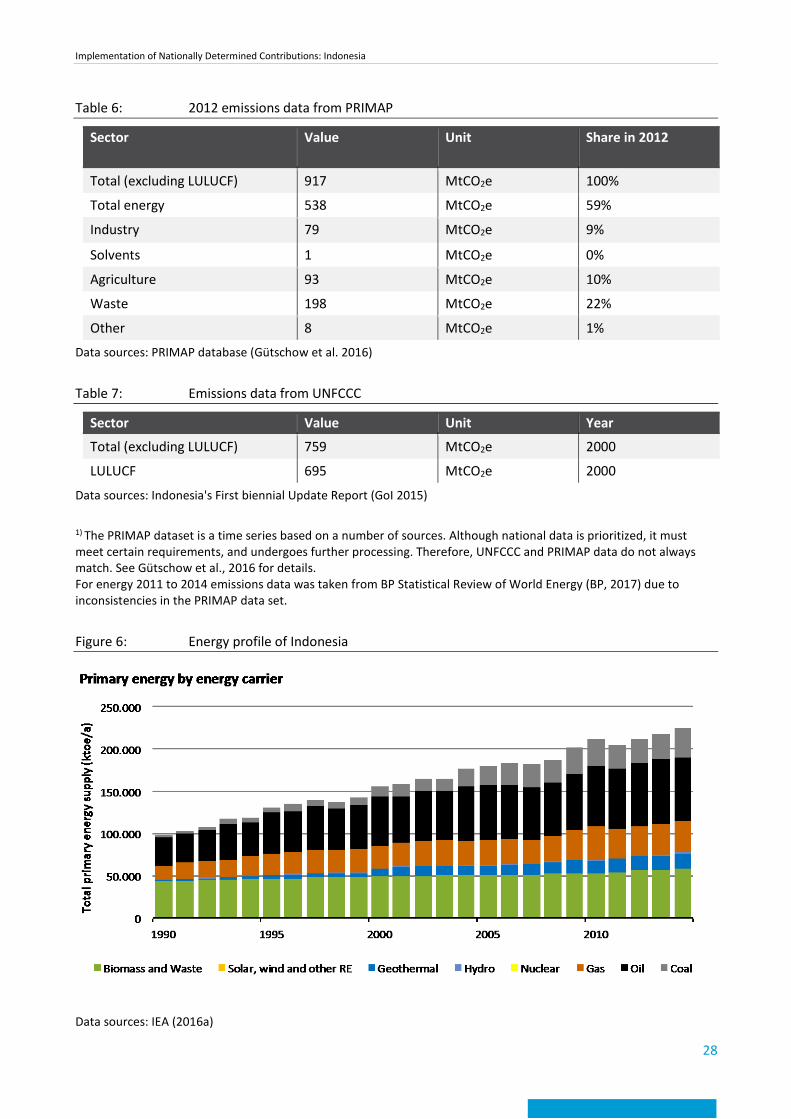
Figure 6: Energy profile of Indonesia
Data sources: IEA (2016a)
Implementation of Nationally Determined Contributions: Indonesia
29
Table 8: 2014 total primary energy supply by fuel from IEA
Fuel Value Unit Share in 2014
Biomass and waste 59094 ktoe 26%
Solar, wind and other RE 0.9 ktoe 0%
Geothermal 17259 ktoe 8%
Hydro 1303 ktoe 1%
Nuclear 0 ktoe 0%
Gas 36596 ktoe 16%
Oil 75206 ktoe 33%
Coal 36054 ktoe 16%
Data sources: IEA (2016a)
Energy system. Primary energy demand in 2014 was mainly met by the use of oil (33 %), biomass and waste (26 %), natural gas (16 %), coal (16 %) and geothermal energy (8 %) (IEA 2016a).
Indonesia is an energy rich country. In 2014, it exported more energy (coal, gas, oil) than it consumed domestically. However, the energy mix has changed over time. Fifteen years ago, the energy demand was largely satisfied by domestic oil, biomass and gas. In recent years, growth rates of renewables have been much smaller than those for fossil fuel. Especially coal has risen in importance.
Indonesia's electricity consumption has almost doubled over the last decade reaching 230 TWh in 2014. Demand growth is largely linked to the country's economic growth and strongest in the commercial and residential sector. In recent years, the country's electrification rate has increased from 66% in 2009 to 88% in 2015, and is planned to reach more than 97% in 2019 (DG Electricity 2016). To cope with the expected future demand growth, Indonesia plans to install more than 70 GW of new capacity until 2024, 60% of which would be by new coal fired power plants. At the same time the government plans to curb the trend of decreasing shares of renewables and aims at 23% renewable electricity in 2025, mainly from hydro and geothermal.
Bilateral Cooperation with Germany. Indonesia is a priority partner country for the German government, with long-lasting ties in bilateral cooperation activities (GIZ and KfW). In 2013, the governments of Indonesia and Germany decided to focus three priority areas for cooperation: 1) energy and climate change; 2) inclusive growth; 3) good governance and global networks.
Indonesia's First Biennial Update Report (BUR) lists eight German-funded climate activities for the period of 2010-2016, with a disbursal of ca. USD 27 million (EUR 24.5 million) of an approved ca. USD 49.5 million (EUR 44.7 million). Activities include the transport sector (e.g. the Sustainable Urban Transport Improvement Project (SUTIP), focusing on energy-efficiency and climate-proofing of the Indonesian city urban transport plan); Forestry (e.g. the Forest and Climate Protection (FORCLIME) projects with focus on forestry sector reforms), development of mitigation and adaptation measures involving multiple stakeholders, including the national government, provinces, municipalities, industry and NGOs (PAKLIM), together with AusAID; and also geothermal energy development.
Indonesia is also a member of the NDC Partnership that was founded by Germany as a platform for effective NDC implementation. The NDC cluster lists three core NDC implementation activities funded through the German International Climate Initiative (IKI). These activities have not yet been listed in the BUR.
Implementation of Nationally Determined Contributions: Indonesia
30
3.2 Institutional set up The way Indonesia addresses climate change on an institutional level is largely dependent on the executive branch of government. Indonesia's recent presidents have strongly shaped the institutional setup concerning climate change. Former president Yudhoyono took a strong personal interest in climate change issues. Consequently, the institutional architecture in this field was designed with a tendency towards centralisation and presidential oversight.
From 2008 to 2015, the National Council on Climate Change (DNPI), an independent body of 17 ministers with working groups on mitigation, adaptation, technology, finance, LULUCF, post-2012 programmes, and science, coordinated Indonesia's climate policies. After 2010, the president's Delivery Unit for Development Monitoring and Oversight (UKP4) took a lead role in the development of the country's REDD+ programme, establishing first a REDD+ taskforce (2010-2013), and afterwards an independent REDD+ Agency, and playing a key role in Indonesia's monitoring activities. UKP4 also had oversight over the performance of all sectoral and state ministries. Both entities were directly headed by the Indonesian president. Under Yudhoyono's administration, all ministries relevant to climate change issues established climate departments (Di Gregorio et al. 2017).
Since 2011, the Ministry of National Development Planning / National Development Planning Agency (BAPPENAS) started to play a key role in the development of Indonesia's medium and long-term development strategies. In 2010, BAPPENAS published the Indonesia Climate Change Sectoral Roadmap (ICCSR) (GoI 2009), elaborating on Indonesia's 2020 mitigation commitments that the president had announced in 2009. The ICCSR formed the basis for Indonesia's National Action Plan for Greenhouse Gas Reduction (RAN-GRK), the country's low emission development strategy (Resosudarmo et al. 2013). The RAN-GRK is not only meant as a national strategy. Indonesia's provinces have to formulate regional climate plans (RAD GRK) as well, overseen by the BAPPEDAs, the regional counterparts to BAPPENAS.
After the presidential election in 2014, the institutional architecture was changed quite radically. In early 2015, new president Joko Widodo through Presidential Regulation 2015/16 merged the ministries of environment and forestry into a single ministry (the Ministry of Environment and Forestry, MoEF), and established a new Directorate General of Climate Change Oversight in the new ministry. The UKP4, the REDD+ Agency, and the DNPI were disbanded, and partly integrated into the new ministry (van Tilburg et al. 2016).
The Ministry of Environment and Forestry is therefore one of the most important ministries in formulating Indonesia's approach to climate change.
BAPPENAS also continues to play a crucial role in Indonesia's institutional architecture concerning climate change, and has assumed a lead role in the formulation of adaptation policies. BAPPENAS has been characterised as one of the more influential government agencies, due to its considerable experience and well-trained personnel. (Resosudarmo et al. 2013).The RAN-GRK continues to be the country's main strategy, and has recently been reviewed under BAPPENAS' lead, with a view to inform Indonesia's NDC, and consequently its leading approach to climate mitigation actions.
Implementation of Nationally Determined Contributions: Indonesia
31
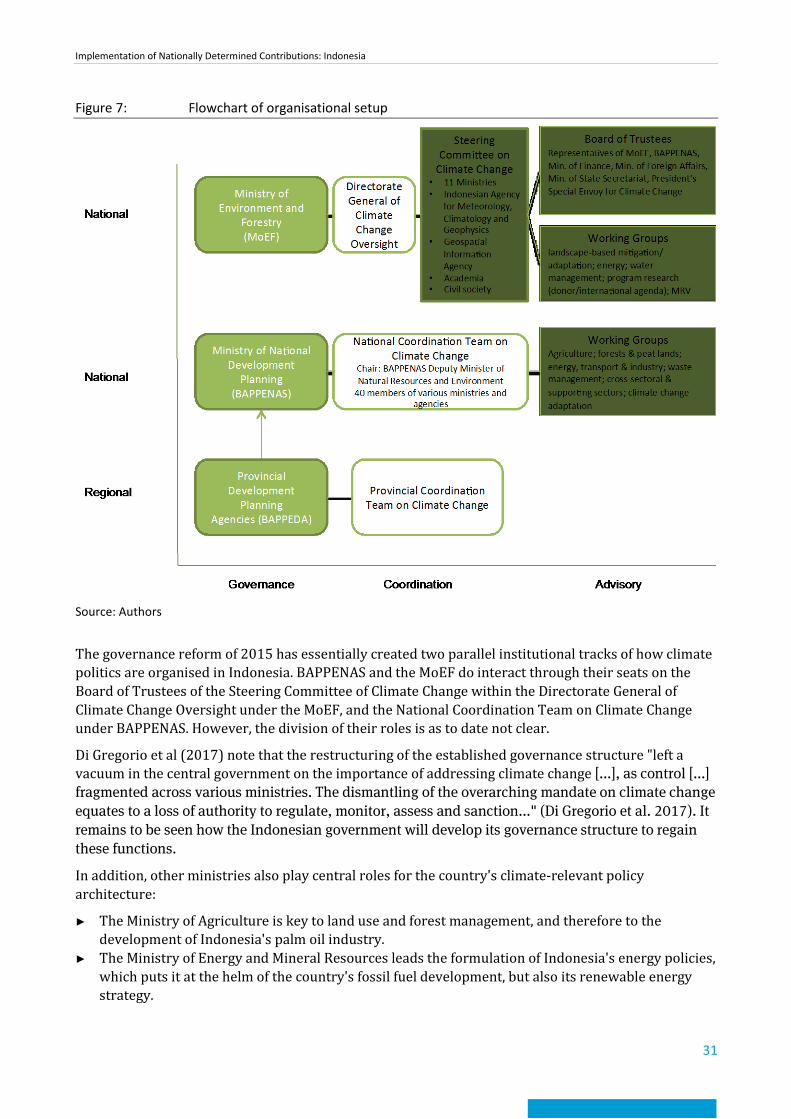
Figure 7: Flowchart of organisational setup
Source: Authors
The governance reform of 2015 has essentially created two parallel institutional tracks of how climate politics are organised in Indonesia. BAPPENAS and the MoEF do interact through their seats on the Board of Trustees of the Steering Committee of Climate Change within the Directorate General of Climate Change Oversight under the MoEF, and the National Coordination Team on Climate Change under BAPPENAS. However, the division of their roles is as to date not clear.
Di Gregorio et al (2017) note that the restructuring of the established governance structure "left a vacuum in the central government on the importance of addressing climate change [...], as control [...] fragmented across various ministries. The dismantling of the overarching mandate on climate change equates to a loss of authority to regulate, monitor, assess and sanction..." (Di Gregorio et al. 2017). It remains to be seen how the Indonesian government will develop its governance structure to regain these functions.
In addition, other ministries also play central roles for the country's climate-relevant policy architecture:
► The Ministry of Agriculture is key to land use and forest management, and therefore to the development of Indonesia's palm oil industry.
► The Ministry of Energy and Mineral Resources leads the formulation of Indonesia's energy policies, which puts it at the helm of the country's fossil fuel development, but also its renewable energy strategy.
Implementation of Nationally Determined Contributions: Indonesia
32
► The Ministry of Transport is responsible for formulating policies in the transport sector. As transport is the third-largest source of greenhouse gases in the country, all policies in this sector are highly influential on climate mitigation.
► Other influential ministries include the Ministry of Industry, the Ministry of Public Works and Housing, and the Ministry of Finance (Ardiansyah et al. 2015).
3.3 MRV of GHG emissions Indonesia submitted its first national communication to the UNFCCC in 1999, and the second one in 2011. The country's third national communication was planned to be submitted in late 2016, however, as to date it is not yet available. Indonesia has submitted its first biennial update report, as well as REDD+ forest emissions reference levels in 2016. These latest submissions use a mix of Tier 1 and 2 of the 2006 IPCC reporting guidelines, and the IPCC Good Practice Guidance for LULUCF (GoI 2015).
Indonesia's National MRV system is still being developed. While the institutional set-up has seen some efforts towards stronger integration, there are still a number of parallel processes, with unclear interconnections. The Indonesian government, together with international donor agencies such as GIZ, JICA, and AusAID, has been building capacities in this field. Consequently, the inventory data provided by Indonesia has been revised with every submission.
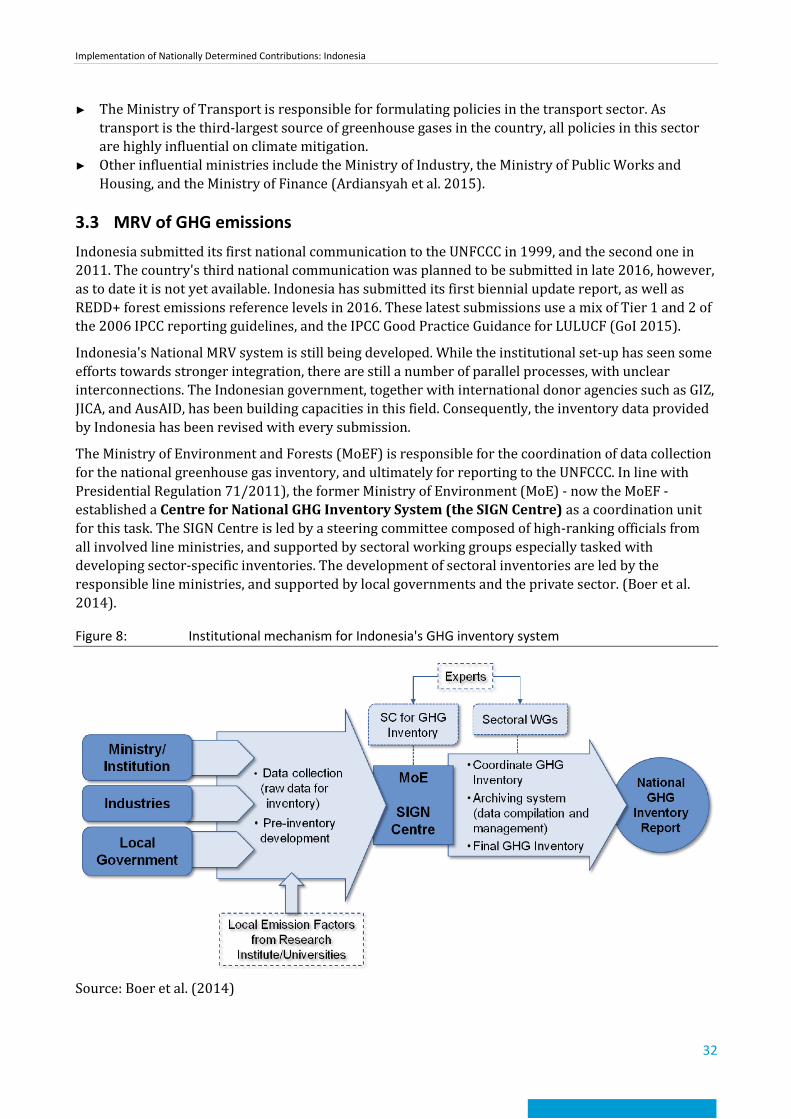
The Ministry of Environment and Forests (MoEF) is responsible for the coordination of data collection for the national greenhouse gas inventory, and ultimately for reporting to the UNFCCC. In line with Presidential Regulation 71/2011), the former Ministry of Environment (MoE) - now the MoEF - established a Centre for National GHG Inventory System (the SIGN Centre) as a coordination unit for this task. The SIGN Centre is led by a steering committee composed of high-ranking officials from all involved line ministries, and supported by sectoral working groups especially tasked with developing sector-specific inventories. The development of sectoral inventories are led by the responsible line ministries, and supported by local governments and the private sector. (Boer et al. 2014).
Figure 8: Institutional mechanism for Indonesia's GHG inventory system
Source: Boer et al. (2014)
Implementation of Nationally Determined Contributions: Indonesia
33
In addition, the MoEF has established a dedicated MRV system for land-based emissions, the Indonesian National Carbon Accounting System (INCAS). INCAS uses Tier 3 level accounting for AFOLU emissions, and is scalable to provincial and district levels. The system is designed to transparently provide users with land-based data through a web interface (www.incas-indonesia.org)
In the context of the National Action Plan for GHG reduction (RAN-GRK) and its associated regional plans (RAD-GRK), the Ministry of National Development Planning (BAPPENAS) has issued guidelines for planning, implementation and monitoring of mitigation actions for line ministries and provincial governments. Within BAPPENAS, the Climate Change National Coordination Team (CCNCT) supports the implementation of RAN-GRK and RAD-GRK through its secretariat (the RAN-GRK Secretariat), which also issues monitoring reports (Boer et al. 2014).
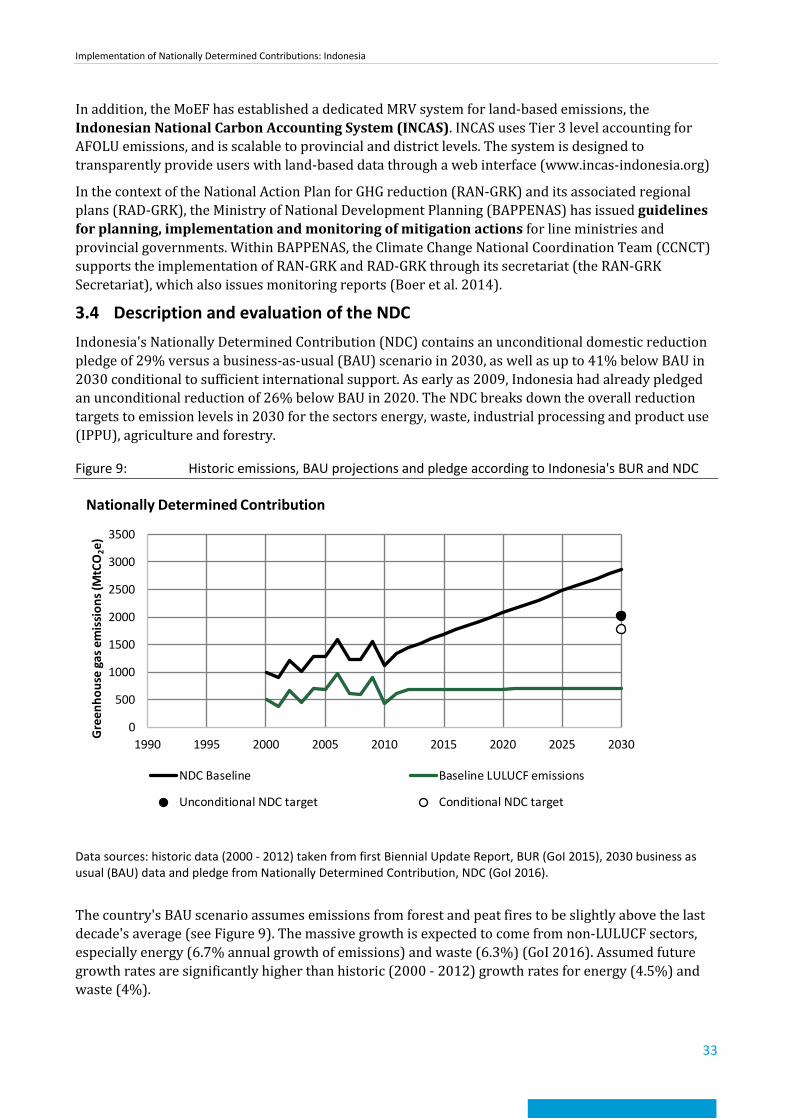
3.4 Description and evaluation of the NDC Indonesia's Nationally Determined Contribution (NDC) contains an unconditional domestic reduction pledge of 29% versus a business-as-usual (BAU) scenario in 2030, as well as up to 41% below BAU in 2030 conditional to sufficient international support. As early as 2009, Indonesia had already pledged an unconditional reduction of 26% below BAU in 2020. The NDC breaks down the overall reduction targets to emission levels in 2030 for the sectors energy, waste, industrial processing and product use (IPPU), agriculture and forestry.
Figure 9: Historic emissions, BAU projections and pledge according to Indonesia's BUR and NDC
Data sources: historic data (2000 - 2012) taken from first Biennial Update Report, BUR (GoI 2015), 2030 business as usual (BAU) data and pledge from Nationally Determined Contribution, NDC (GoI 2016).
The country's BAU scenario assumes emissions from forest and peat fires to be slightly above the last decade's average (see Figure 9). The massive growth is expected to come from non-LULUCF sectors, especially energy (6.7% annual growth of emissions) and waste (6.3%) (GoI 2016). Assumed future growth rates are significantly higher than historic (2000 - 2012) growth rates for energy (4.5%) and waste (4%).
0
500
1000
1500
2000
2500
3000
3500
1990 1995 2000 2005 2010 2015 2020 2025 2030
Gre
enho
use
gas e
mis
sion
s (M
tCO
2e)
Nationally Determined Contribution
NDC Baseline Baseline LULUCF emissions
Unconditional NDC target Conditional NDC target
Implementation of Nationally Determined Contributions: Indonesia
34
It should be noted that Indonesia's BAU has been substantially revised in comparison to previous projections in order to reflect more accurate data of the national GHG inventory system. Whereas Indonesia's second national communication estimated emissions of 2.95 GtCO2e in 2020, the NDC assumes 2.87 GtCO2e in 2030.
Underlying assumptions for the BAU scenario are described in quite some detail in the RAN-GRK review of 2015 (BAPPENAS 2015). However, inconsistencies between NDC and RAN-GRK exist, which hinder a rigid assessment of Indonesia's BAU. For the energy sector, the expected growth in emissions is massive (almost quadrupling between 2010 and 2030). However, RAN-GRK states 1,444 Mt CO2e in 2030 in contrast to 1,669 Mt CO2e in 2030 assumed in the NDC. This difference falls in line with different assumptions on overall economic growth (being the key driver for emissions in the energy sector): In RAN-GRK the economy is assumed to grow at 5-6%. In contrast the first Indonesian BUR refers to economic growth targets between 6 and 8% annually, which is clearly above the historic growth of 4.6% to 6.5% between 2000 and 2012 (GoI 2015). For the energy sector, the expected emission growth according to RAN-GRK is largely due to the envisaged increase in coal-fired electricity generation, which links well to the country's energy strategy. However, details on some BAU assumptions seem unrealistic e.g. "no additional renewable capacity after 2010" or coal "power plant efficiency remains constant after 2010".
In conclusion, two key findings on Indonesia's BAU scenario are important:
► Even though in the past almost half of the countries emission stemmed from forest and peat fires, future emission growth is expected to come from non-LULUCF sectors.
► The BAU seems to be at the higher end of what can realistically be expected.
3.5 Climate change mitigation policies and strategies 3.5.1 National strategies
The National Action Plan for Greenhouse Gas Emission Reduction (RAN-GRK) forms the cross-sectoral framework for Indonesia's climate strategy. It was formulated by BAPPENAS in cooperation with the Ministries for Environment, Forestry, Industry, Agriculture, Public Works, Transportation, and Energy and Mineral Resources, and launched by a presidential decree in 2011. Additionally, provincial governments formulated provincial action plans (RAD-GRK), in support of mitigation plans of the Indonesian national government.
The RAN-GRK is meant as a central planning instrument for Indonesian Nationally Appropriate Mitigation Action (NAMA) development in the period of 2010-2020. The RAN-GRK contextualises Indonesia's over-all mitigation commitment of reducing emissions by 26% vs. BAU unilaterally, or up to 41% with international support by 2020, pledged in 2009. The plan formulates seven key mitigation actions:
► sustainable peat land management; ► reducing the deforestation and land degradation rate; ► developing carbon sequestration projects in forestry and agriculture; ► promoting energy efficiency; ► developing alternative and renewable energy sources; ► reducing solid and liquid waste; ► shifting to low-emission transportation mode.
In late 2015, the RAN-GRK was reviewed in the context of the newly-enacted National Medium Term Development Plan (RPJMN) 2015-19 (BAPPENAS 2015). The review sought to improve programs and strategies of the original plan, and extended the time frame up to 2030. It now forms the basis for
Implementation of Nationally Determined Contributions: Indonesia
35
Indonesia's NDC, and provides more in-depth information on the scenarios that led to the formulation of the country´s reduction commitment.
A country-wide Green Growth Program was launched by the Indonesian government in 2013 that reaffirms Indonesia's commitment to low-carbon growth, and seeks to foster green investments in the country.
In 2012, the president's REDD+ Task Force (now integrated into the MoEF) issued Indonesia's REDD+ National Strategy (LSE and Grantham Research Institute on Climate Change and the Environement 2017). Proposed activities include
► Emission reduction from deforestation, forest and peat land degradation; ► Preservation and accumulation of forest carbon stocks through conservation, sustainable forest
management, and rehabilitation/restoration measures; ► Creation of additional benefits (welfare, biodiversity, ecosystem protection).
The strategy lays out short-, medium- and long-term goals for a sustainable management of natural forests and peat lands:
► In the short term (2012-2014), the strategy aims at improving institutions and governance systems, spatial plans and investment climate;
► The medium term (2012-2020) foresees strengthened implementation of governance systems, institutions etc. developed in the first phase;
► The long-term goal (2012-2030) aims at rendering Indonesia's forests and lands into a net carbon sink by completely implementing forest protection measures.
Since Indonesia's land use mapping is not harmonised across different entities and political levels, the President has also instated the so-called One Map Initiative, which seeks to develop a clear and current mapping of the country for use by all political institutions that is transparent to all stakeholders. The initiative was started in 2011 already.
Law 30/2007 Regarding Energy is a comprehensive legislation for Indonesia's future energy system. It includes references to sustainable development, environmental preservation and energy resilience in the country's energy management. This "Energy Law" gives general guidelines, both for demand and supply of energy in Indonesia. The Law aims to promote energy efficiency through the creation of an energy source inventory, promotion of energy conservation, and improvements to energy storage and transmission. It further stipulates an increase of new and renewable energies in the national energy mix, and demands the creation of incentives for energy providers to implement these (LSE and Grantham Reearch Institute on Climate Change and the Environement 2017).
The Energy Law is supplemented on the demand side by the National Energy Conservation Master Plan (RIKEN) in regulating energy demand and set energy efficiency targets. RIKEN sets a national target to decrease energy intensity by 1% annually until 2025. The RIKEN identified energy efficiency potential of 15-30% for industry; 10-30% for households, and 25% in commercial buildings. In addition, the Ministry of Energy and Mineral Resources issued "Vision 25:25", which includes a plan for an over-all reduction of energy consumption by 15.6% until 2025, but is not legally binding. (LSE and Grantham Reearch Institute on Climate Change and the Environement 2017; Ward et al. 2015).
The National Energy Policy (KEN) sets the country's targets for the future energy mix, i.e. the supply side. It is complimented by the Electricity Supply Business Plan 2016-2025 (RUPTL), which sets the targets for extension in generation capacity of 35 GW until 2019, plus 80.5 GW until 2025. It reflects the KEN's goal of a renewable energy share of 23% by 2025, but also retains the target of a 60% share of coal in the generation capacity by 2025 (ICED 2016).
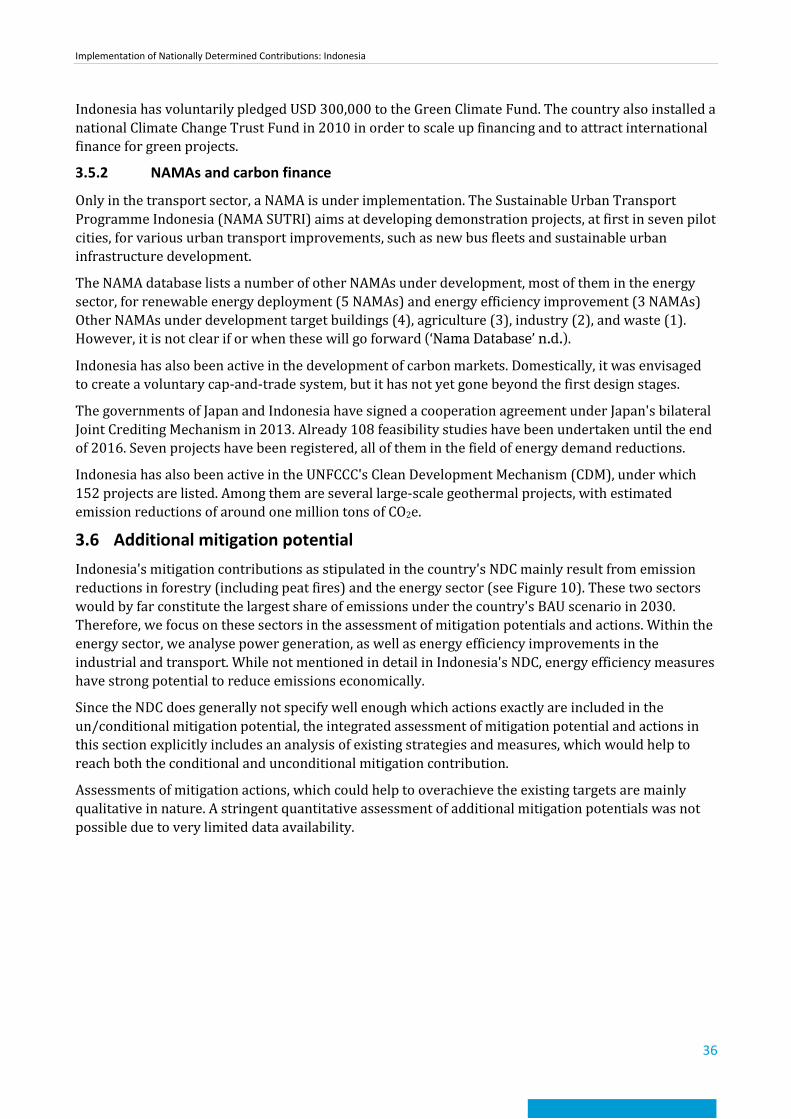
Implementation of Nationally Determined Contributions: Indonesia
36
Indonesia has voluntarily pledged USD 300,000 to the Green Climate Fund. The country also installed a national Climate Change Trust Fund in 2010 in order to scale up financing and to attract international finance for green projects.
3.5.2 NAMAs and carbon finance
Only in the transport sector, a NAMA is under implementation. The Sustainable Urban Transport Programme Indonesia (NAMA SUTRI) aims at developing demonstration projects, at first in seven pilot cities, for various urban transport improvements, such as new bus fleets and sustainable urban infrastructure development.
The NAMA database lists a number of other NAMAs under development, most of them in the energy sector, for renewable energy deployment (5 NAMAs) and energy efficiency improvement (3 NAMAs) Other NAMAs under development target buildings (4), agriculture (3), industry (2), and waste (1). However, it is not clear if or when these will go forward (‘Nama Database’ n.d.).
Indonesia has also been active in the development of carbon markets. Domestically, it was envisaged to create a voluntary cap-and-trade system, but it has not yet gone beyond the first design stages.
The governments of Japan and Indonesia have signed a cooperation agreement under Japan's bilateral Joint Crediting Mechanism in 2013. Already 108 feasibility studies have been undertaken until the end of 2016. Seven projects have been registered, all of them in the field of energy demand reductions.
Indonesia has also been active in the UNFCCC's Clean Development Mechanism (CDM), under which 152 projects are listed. Among them are several large-scale geothermal projects, with estimated emission reductions of around one million tons of CO2e.
3.6 Additional mitigation potential Indonesia's mitigation contributions as stipulated in the country's NDC mainly result from emission reductions in forestry (including peat fires) and the energy sector (see Figure 10). These two sectors would by far constitute the largest share of emissions under the country's BAU scenario in 2030. Therefore, we focus on these sectors in the assessment of mitigation potentials and actions. Within the energy sector, we analyse power generation, as well as energy efficiency improvements in the industrial and transport. While not mentioned in detail in Indonesia's NDC, energy efficiency measures have strong potential to reduce emissions economically.
Since the NDC does generally not specify well enough which actions exactly are included in the un/conditional mitigation potential, the integrated assessment of mitigation potential and actions in this section explicitly includes an analysis of existing strategies and measures, which would help to reach both the conditional and unconditional mitigation contribution.
Assessments of mitigation actions, which could help to overachieve the existing targets are mainly qualitative in nature. A stringent quantitative assessment of additional mitigation potentials was not possible due to very limited data availability.
Implementation of Nationally Determined Contributions: Indonesia
37
Figure 10: 2030 emission scenarios according to NDC by sector
Source: own illustration based on GoI (2016)
3.6.1 LULUCF
Indonesia is home to the third-largest area of tropical rainforest in the world. However, that area is rapidly dwindling, at an annual rate of about 1 million hectares. According to its last Biennial Update Report, land use change and forestry accounted for more than half of Indonesia's emissions between 2000 and 2012 (GoI 2015).
In addition, much of Indonesia's forests grow on peat lands, a major carbon sink, but, when drained, also a large source of GHG emissions, and highly fire-prone up to several metres underground. Since clearing forests for arable land (especially for oil palm plantations) will often be done though burning of forested areas, resulting fires can easily get out of control. In strong "El-Nino"-years, this effect is exacerbated by heat and drought in the area (CIFOR 2015).
A vivid example for this were the forest and peat fires that raged between June and November 2015, burning an area of about 26,000 km2 across multiple islands. Direct damage to the Indonesian economy is estimated at least at 16 billion USD (1.9% of Indonesia's 2015 GDP), but the haze caused by the fire has had severe consequences far beyond the country's borders. Greenhouse gas emissions from the Indonesian forest fires between September and October 2015 (11.3 MtCO2 per day) exceeded daily fossil fuel emissions of the European Union (8.9 MtCO2) (Huijnen et al. 2016).
NDC pledge and planned activities. Given that the high share of emissions from deforestation and land degradation, the forestry sector in Indonesia is a strong contender for emission reductions in the country. This is also reflected in Indonesia's NDC - the conditional reduction scenario in the LULUCF sector envisages a reduction from ca. 650 MtCO2e/a in 2010 to a third of that value (2
17 MtCO2e/a) unconditionally, and a tenth, 64 MtCO2e/a, conditional on international support (GoI 2016).
Implementation of Nationally Determined Contributions: Indonesia
38
While the NDC does not specify a clear breakdown of how the reduction target is to be reached, it does mention a number of measure types that are being implemented or are planned, including effective land use and spatial planning, sustainable forest management incl. social forestry programs, and restoring functions of degraded ecosystems, protection and conservation of remaining forests through reduced deforestation and forest degradation. REDD+ is foreseen to have a large impact on reductions in the forestry sector. The forest clearance moratorium (see below) is mentioned as well (GoI 2016).
Uncertainties. However, both historical data and estimates of future emissions in the sector vary widely across sources, so any value for emissions reduction potential is extremely uncertain. (Hargita and Rüter 2015) report significant variations between Indonesia's national inventory data and statistical data from the Food and Agricultural Organisation of the United Nations. Even within official government publications, figures show a large variance. The review of the RAN-GRK (BAPPENAS 2015), which supposedly strongly fed into the development of the NDC targets, calculated emissions from the land-use sector reach 1,084 MtCO2e/a in the 2030 baseline. Subtracting non-carbon dioxide sources (54 MtCO2e) and emissions from livestock ca. (100 MtCO2e), leaving only emissions from land use change and peat lands, results in baseline emissions of ca. 900 MtCO2e in 2030. In contrast, the NDC assumes 714 MtCO2e for forestry and peat fires as baseline emissions in 2030.
Potential and cost. The cost of reaching (or even surpassing) the potential identified by the Indonesian government in the land use sector is therefore very hard to determine, given the large variation in baseline data. Our research revealed only one study (Hasegawa et al. 2016) that attempts to calculate the equivalent carbon price to reach the GHG reduction as pledged in the NDC, and the land use sector contribution to that goal.
As the RAN-GRK review, the authors estimate baseline emissions from the land use sector of ca. 900 MtCO2e/a in 2030. The model used calculates possible reductions in the LULUCF sector of up to ca. 500 MtCO2e/a in 2030, significantly less than foreseen in Indonesia's NDC.1 In order to reach that reduction, the model calculates abatements costs of about USD 3.2 billion per year in 2030, resulting from, among others, compensations for income losses from deforestation and agriculture, and resettlement due to shifts in agriculture or removal from plantation land. The calculated carbon price spikes in 2020 at up to USD 55/tCO2e, but decreases to USD 5.4/tCO2e in 2030. Annual mitigation potentials reach their maximum before 2025, and do not grow afterwards.
Therefore, at least judging from this single study, Indonesia's GHG reduction plans in the LULUCF sector could be regarded as quite ambitious. However, realising that potential requires that Indonesia successfully implements its existing and planned policies and measures within the sector. Hasegawa et al. (2016) do not analyse individual policies of the Indonesian government, but conclude that "...strong intervention in land use is needed, such as enhancing forest protection and plantation areas" (Hasegawa et al. 2016, p. 9).
Activities to reach potential. As early as 2010, Norway and Indonesia signed a Letter of Intent for a partnership in Indonesia's REDD+ approach. Norway has pledged up to USD 1 billion over seven years for verified progress in REDD+ readiness and implementation. The agreement between the two countries is divided in three main phases - preparation, transformation, and verified emission reductions. The last phase was due to start in 2014, but the MRV system that was to be put in practice in the second phase is not completed yet. The largest part of the pledged sum is foreseen for the final phase, so full disbursement is still delayed. Recently, the Norwegian government has voiced
1 This may be partly due to assumptions made on peat land drainage and fire spread, which in this study are subsumed under
"unplanned deforestation", and, as the authors themselves note, "pose a large uncertainty" (Hasegawa et al. 2016, p.4).
Implementation of Nationally Determined Contributions: Indonesia
39
dissatisfaction with the slow progress of Indonesia's commitments under the bilateral partnership (Jong and Parlina 2016).
One of the most prominent outcomes of the partnership has been a moratorium on new forestry licenses and peat land development, which was issued by the President in 2011. Originally only envisaged for two years, the moratorium was extended twice already, in 2013 and 2015. The MoEF has requested the president to extend the moratorium for a third time(Munthe 2017). In July 2017, Indonesian environment minister suggested to make the moratorium permanent (The Straits Times 2017)
The moratorium only affects areas mapped as primary forest, and does not affect existing licenses. Since Indonesia has a relatively narrow definition of what constitutes primary forests, the effective coverage of the moratorium is limited. However, reports show that even the primary forest cover has been decreasing at high rates in spite of the moratorium, calling into question if the moratorium is in any way effective enough to halt Indonesia's deforestation rates (REDD-Monitor 2013; The Economist 2016; WRI 2014).
In addition to the presidential moratorium on forestry and peat land concessions, president Widodo in April 2016 announced a moratorium on palm oil concessions which would also include an evaluation of all forest permits for areas that have not yet been cleared, have been transferred to new owners, or are not used due to other restrictions (Chain Reaction Research 2017). The moratorium is not yet in effect, but shortly after the president's announcement, the minister of environment and forestry declared to have ended any issuance of new palm oil permits (The Jakarta Post 2016a).
Indonesia's palm oil industry is under increasing pressure to limit the footprint of the plantations, and to certify to buyers that the oil is produced sustainably. On the national level, the Indonesian government has recently strengthened its ISPO standard (Indonesian Sustainable Palm Oil) to better fall in line with "No Deforestation, No Peatland, No Exploitation" policies that a growing number of international buyers are adopting (Chain Reaction Research 2017). The Indonesian Palm Oil Pledge that was issued by the Indonesian Chamber of Commerce and Industry (a private sector organisation), had included a zero deforestation commitment already, but was opposed by both the Coordinating Minister of Economic Affairs and the Director General of Planning at the Ministry of Environment and Forestry (Anderson et al. 2016).
In addition to these activities, (Meijaard 2016) also reports that fire prevention is now much more strongly prioritised at both national and local government levels. If a fire is detected, dedicated teams of army, police, forestry guards, and fire fighters have to respond immediately, and persons near the fire have to be investigated. A potential game changer in achieving compliance is a threat to senior government officials of the police, army and local government that a lack of response to fires in their region will lead to their personal demotion. If this threat is really acted upon, it can be a powerful motivator, and may also cut across personal ties of officials to people or businesses responsible for forest fires.
Options to strengthen governance As a result of rigorous decentralisation efforts following fall of the Suharto regime and the economic crisis in South-East Asia in the late 1990s, much more power was given to local and regional political levels than in the previous, largely centralised regime. This has certainly had many positive effects on regional autonomy and democratisation.
However, it has also led to a number of regulatory uncertainties especially regarding land titles, but also in regard to the classification of forested and other land types. A clear and consistent use of geospatial data for mapping the country is crucial to land-use planning and sustainable use of available land, and potentially strongly reducing apparent needs for clearing forested areas if alternative lands are more easily identifiable. At the same time, a unified map can clarify ownership of areas, help alleviate conflicts of interest and lessen problems of corruption (Mulyani and Jepson 2016).
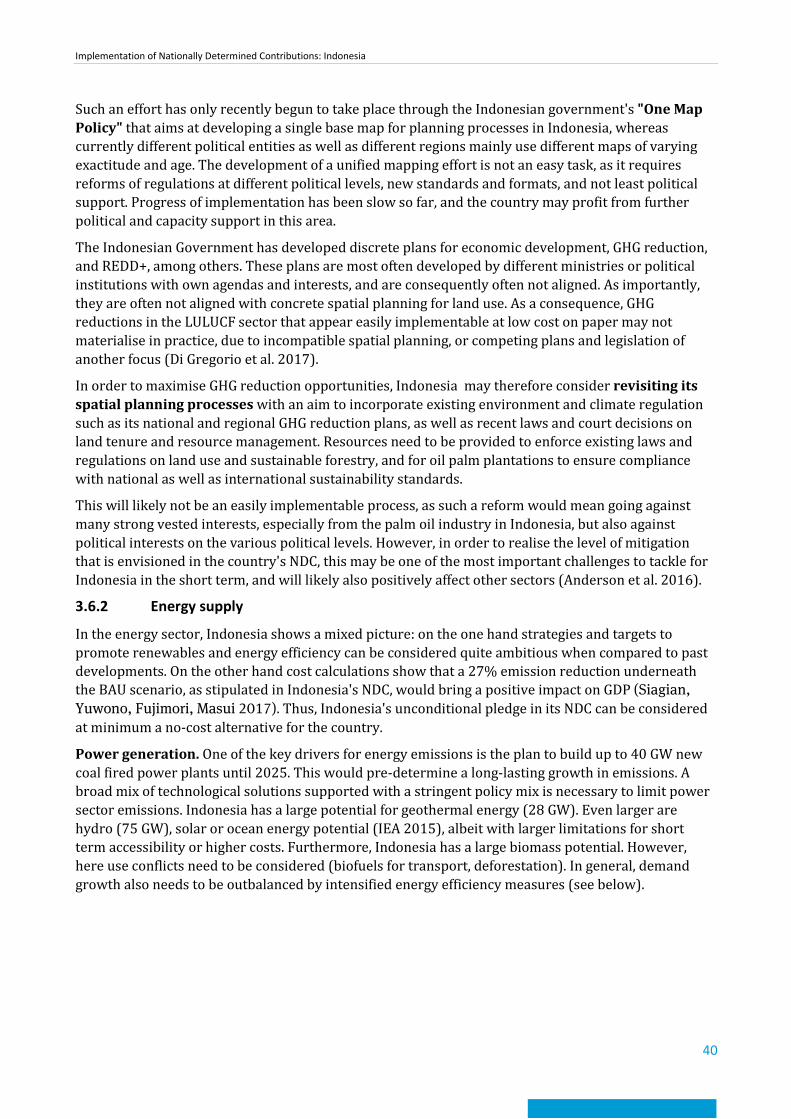
Implementation of Nationally Determined Contributions: Indonesia
40
Such an effort has only recently begun to take place through the Indonesian government's "One Map Policy" that aims at developing a single base map for planning processes in Indonesia, whereas currently different political entities as well as different regions mainly use different maps of varying exactitude and age. The development of a unified mapping effort is not an easy task, as it requires reforms of regulations at different political levels, new standards and formats, and not least political support. Progress of implementation has been slow so far, and the country may profit from further political and capacity support in this area.
The Indonesian Government has developed discrete plans for economic development, GHG reduction, and REDD+, among others. These plans are most often developed by different ministries or political institutions with own agendas and interests, and are consequently often not aligned. As importantly, they are often not aligned with concrete spatial planning for land use. As a consequence, GHG reductions in the LULUCF sector that appear easily implementable at low cost on paper may not materialise in practice, due to incompatible spatial planning, or competing plans and legislation of another focus (Di Gregorio et al. 2017).
In order to maximise GHG reduction opportunities, Indonesia may therefore consider revisiting its spatial planning processes with an aim to incorporate existing environment and climate regulation such as its national and regional GHG reduction plans, as well as recent laws and court decisions on land tenure and resource management. Resources need to be provided to enforce existing laws and regulations on land use and sustainable forestry, and for oil palm plantations to ensure compliance with national as well as international sustainability standards.
This will likely not be an easily implementable process, as such a reform would mean going against many strong vested interests, especially from the palm oil industry in Indonesia, but also against political interests on the various political levels. However, in order to realise the level of mitigation that is envisioned in the country's NDC, this may be one of the most important challenges to tackle for Indonesia in the short term, and will likely also positively affect other sectors (Anderson et al. 2016).
3.6.2 Energy supply
In the energy sector, Indonesia shows a mixed picture: on the one hand strategies and targets to promote renewables and energy efficiency can be considered quite ambitious when compared to past developments. On the other hand cost calculations show that a 27% emission reduction underneath the BAU scenario, as stipulated in Indonesia's NDC, would bring a positive impact on GDP (Siagian, Yuwono, Fujimori, Masui 2017). Thus, Indonesia's unconditional pledge in its NDC can be considered at minimum a no-cost alternative for the country.
Power generation. One of the key drivers for energy emissions is the plan to build up to 40 GW new coal fired power plants until 2025. This would pre-determine a long-lasting growth in emissions. A broad mix of technological solutions supported with a stringent policy mix is necessary to limit power sector emissions. Indonesia has a large potential for geothermal energy (28 GW). Even larger are hydro (75 GW), solar or ocean energy potential (IEA 2015), albeit with larger limitations for short term accessibility or higher costs. Furthermore, Indonesia has a large biomass potential. However, here use conflicts need to be considered (biofuels for transport, deforestation). In general, demand growth also needs to be outbalanced by intensified energy efficiency measures (see below).
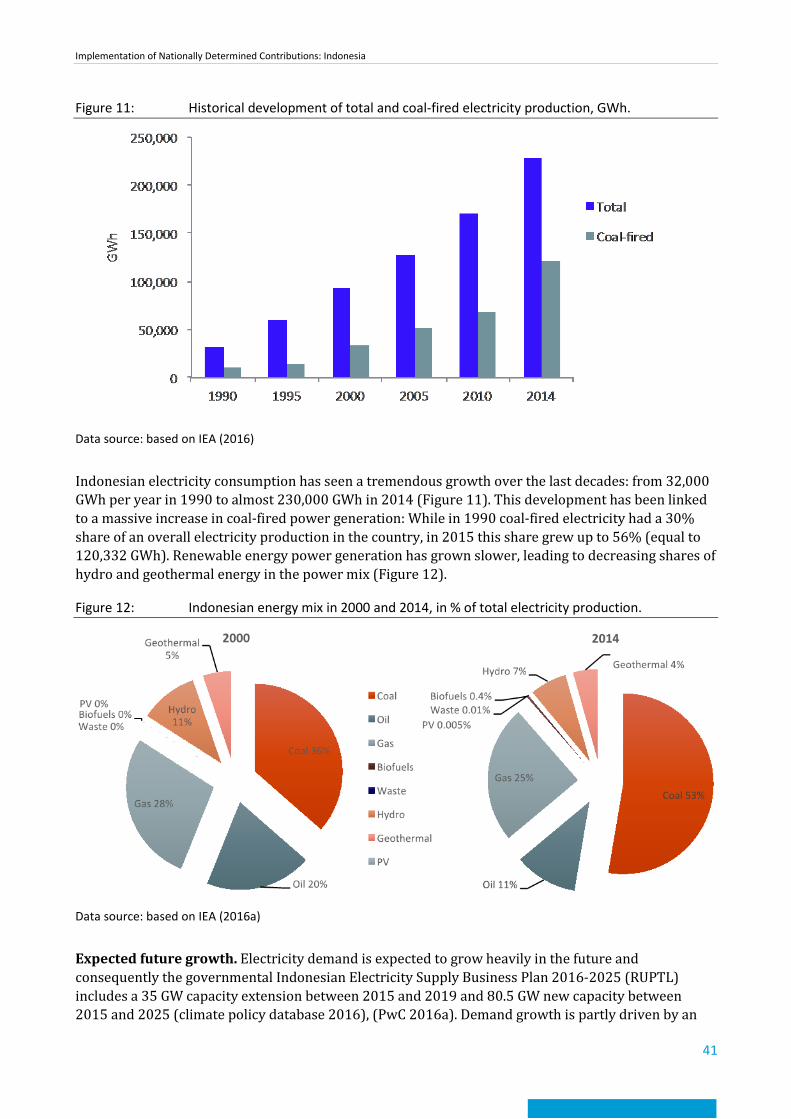
Implementation of Nationally Determined Contributions: Indonesia
41
Figure 11: Historical development of total and coal-fired electricity production, GWh.
Data source: based on IEA (2016)
Indonesian electricity consumption has seen a tremendous growth over the last decades: from 32,000 GWh per year in 1990 to almost 230,000 GWh in 2014 (Figure 11). This development has been linked to a massive increase in coal-fired power generation: While in 1990 coal-fired electricity had a 30% share of an overall electricity production in the country, in 2015 this share grew up to 56% (equal to 120,332 GWh). Renewable energy power generation has grown slower, leading to decreasing shares of hydro and geothermal energy in the power mix (Figure 12).
Figure 12: Indonesian energy mix in 2000 and 2014, in % of total electricity production.
Data source: based on IEA (2016a)
Expected future growth. Electricity demand is expected to grow heavily in the future and consequently the governmental Indonesian Electricity Supply Business Plan 2016-2025 (RUPTL) includes a 35 GW capacity extension between 2015 and 2019 and 80.5 GW new capacity between 2015 and 2025 (climate policy database 2016), (PwC 2016a). Demand growth is partly driven by an
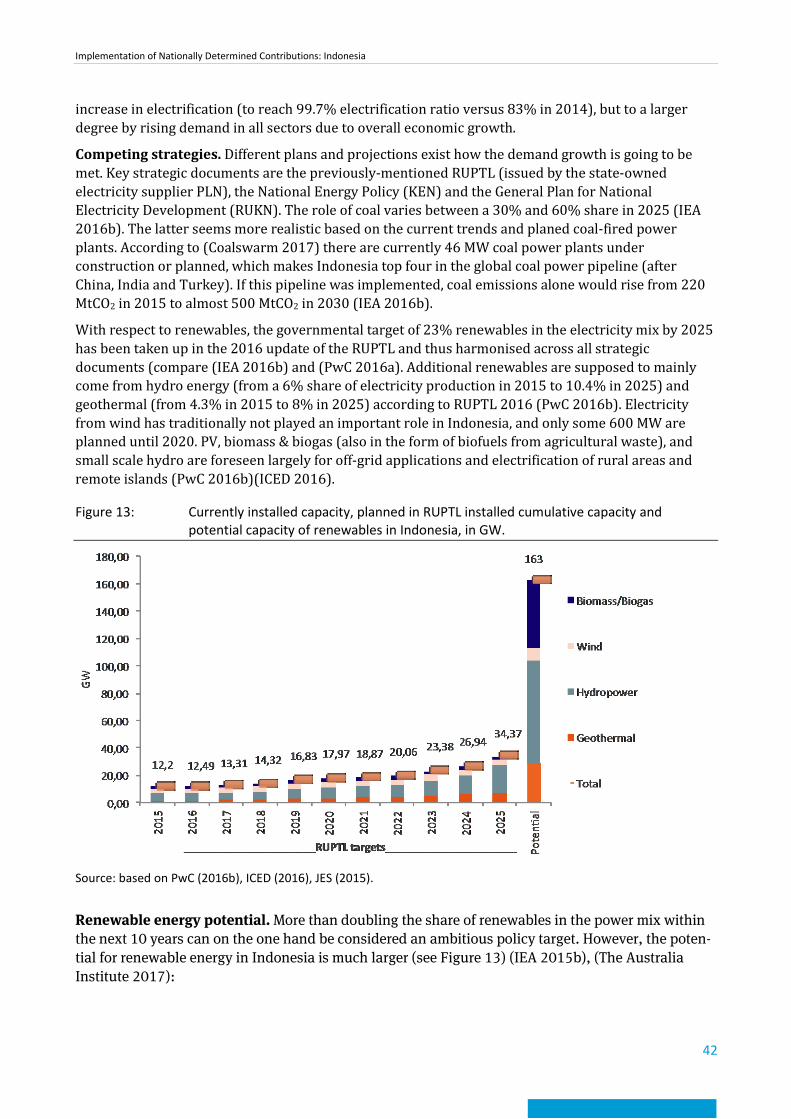
Implementation of Nationally Determined Contributions: Indonesia
42
increase in electrification (to reach 99.7% electrification ratio versus 83% in 2014), but to a larger degree by rising demand in all sectors due to overall economic growth.
Competing strategies. Different plans and projections exist how the demand growth is going to be met. Key strategic documents are the previously-mentioned RUPTL (issued by the state-owned electricity supplier PLN), the National Energy Policy (KEN) and the General Plan for National Electricity Development (RUKN). The role of coal varies between a 30% and 60% share in 2025 (IEA 2016b). The latter seems more realistic based on the current trends and planed coal-fired power plants. According to (Coalswarm 2017) there are currently 46 MW coal power plants under construction or planned, which makes Indonesia top four in the global coal power pipeline (after China, India and Turkey). If this pipeline was implemented, coal emissions alone would rise from 220 MtCO2 in 2015 to almost 500 MtCO2 in 2030 (IEA 2016b).
With respect to renewables, the governmental target of 23% renewables in the electricity mix by 2025 has been taken up in the 2016 update of the RUPTL and thus harmonised across all strategic documents (compare (IEA 2016b) and (PwC 2016a). Additional renewables are supposed to mainly come from hydro energy (from a 6% share of electricity production in 2015 to 10.4% in 2025) and geothermal (from 4.3% in 2015 to 8% in 2025) according to RUPTL 2016 (PwC 2016b). Electricity from wind has traditionally not played an important role in Indonesia, and only some 600 MW are planned until 2020. PV, biomass & biogas (also in the form of biofuels from agricultural waste), and small scale hydro are foreseen largely for off-grid applications and electrification of rural areas and remote islands (PwC 2016b)(ICED 2016).
Figure 13: Currently installed capacity, planned in RUPTL installed cumulative capacity and potential capacity of renewables in Indonesia, in GW.
Source: based on PwC (2016b), ICED (2016), JES (2015).
Renewable energy potential. More than doubling the share of renewables in the power mix within the next 10 years can on the one hand be considered an ambitious policy target. However, the poten-tial for renewable energy in Indonesia is much larger (see Figure 13) (IEA 2015b), (The Australia Institute 2017):
Implementation of Nationally Determined Contributions: Indonesia
43
► Largest potential is hydro energy with 75 GW. However, most hydro potential is located far away from demand centers, e.g. on Papua. The micro hydro potential of >1 GW is very suited for electrification of remote areas.
► Indonesia is the country with the largest geothermal potential globally with a potential of 28 GW, large parts of it are on islands with major populations centers (e.g. Java). However, many geothermal sources are located in environmentally sensitive areas like protected forest which makes access difficult.
► There is a large biomass potential (33 GW), which could both be used for on and off-grid purposes. ► Indonesia as a tropical country has high solar irradiation (4.8 kWh/m2/day - more than factor 4 of
Germany). Thus, the potential is not limited by space but by higher costs for PV compared to fossil alternatives. Therefore no potential in GW for solar is included in Figure 13. Theoretically, Indonesia's electricity demand could fully be provided with solar energy. Cost differences between PV and fossil alternatives have massively decreased in recent years and can be expected to decrease further. To reliably estimate short to mid-term potentials for PV, studies on today's cost structures for PV (and in comparison new coal fired power plants) in Indonesia would be necessary.
► Tidal energy is also supposed to have great potentials for Indonesia, estimated technical potential is between 49 GW (IEA 2015b) and 76.5 GW (PwC 2016a).
3.6.3 Energy efficiency in industry and transport
Energy efficiency in industry and transport are pressing development challenges of Indonesia. Given recent government decisions regarding energy subsidies, indicate a possible future area for climate policy.
Increases in energy consumption in Indonesia are strongly driving the country's plans to expand its energy production (see above). Both the industry and transport sector have strongly increased their energy demands in recent years: The industrial sector's demand rose from 27 toe (tons of oil equivalent) in 2000 to 50 toe in 2013. The transport sector's demand increased even more strongly, from 19 toe in 2000 to 45 toe in 2013. Together, the two sectors accounted for about 80% of Indonesia's final energy consumption (Zed 2015). Lowering the energy intensity of these two sectors would therefore have a large effect on GHG emissions in Indonesia.
Realising energy efficiency gains could directly result in economic gains in the power and industry sector. A national study found that investing in new power plants is roughly 3 times more expensive than investments in energy efficiency technology (Kajian 2015). The ADB reported that the energy intensity of the industrial sector is quite low by international benchmarks, at 565 toe per million GDP as compared to 139 toe on average in OECD countries (Tharakan 2015).
The economic gains of energy efficiency improvements are considerable. ReEX Capital Asia (2012) estimates an overall investment potential of 723 million US$ in five industries, with pay back periods of 1.5 to 3 years. The World Bank's Climate Investment Funds in 2010 identified a market potential of up to USD 5 billion in energy efficiency alone, which could lead to energy savings of 15-30% per year (Climate Investment Funds 2010).
However, by far the largest increase in energy efficiency in recent years stems from households, whereas especially manufacturing, services and transport still show large potential for efficiency gains, as Indonesia lags behind international best practice benchmarks and often also regional comparative benchmarks: Iron and steel production in 2008 had an energy intensity of 650-700 kWh/t, as opposed to 600 kWh/t in India, and only 350-500 kWh/t in Japan. Average fuel efficiency of newly registered vehicles was at 6.5 LGE (litres per gasoline equivalent) per 100 kilometres, whereas Denmark was at 5.2 LGE per 100 kilometres (Ward et al. 2015).
Implementation of Nationally Determined Contributions: Indonesia
44
Energy efficiency targets. Energy efficiency is only mentioned as a general approach in Indonesia's NDC - there are no specific targets to promote efficiency gains in themselves.
However, Indonesia has set itself a number of ambitious targets for improving energy efficiency in its Energy Conservation Master Plan (RIKEN) as early as 2005 (see section 3.5.1). In 2011, an update of the RIKEN was drafted, but still awaits final approval. In that update, the current efficiency targets are further specified. The industrial sector is expected to conserve 17%, the transport sector even 20% in 2025, against a business-as-usual scenario (Zed 2015).
Instruments. Reduction of energy subsidies, combined with technical assistance schemes are currently the main approaches taken by the government to achieve energy efficiency gains. Ministerial regulation No. 31/2014 adjusted energy tariffs to better match production costs. Electricity subsidies are to be phased out: According to ADB (2016) all consumers except for the poorest households should pay production electricity prices by 2018.
Further, MEMR Regulation NO. 14/2012 requires industrial companies consuming more than 6,000 toe to appoint an energy manager, and to conduct energy audits every three years. If they manage to reduce their energy consumption by 2% or more, costs for the energy audit are covered by the state. If audits identify no- or low-cost options for increased energy efficiency, they are to be implemented within one year. Recommendations with medium to large investment cost that are still economically viable are to be implemented within five years. Non-compliance with these provisions can lead to warnings, negative public mention, fines, and ultimately to a reduction of energy supply. However, enforcement is lagging (Ward et al. 2015).
Instruments to improve the efficiency of the transport sector are currently very limited. Fuel-efficient vehicles (more than 20 kilometres per litre of fuel) are freed of import-duty, but gas-powered cars are subject to a 75% luxury tax. The Ministry of Transport and the Ministry of Environment also initiated an 'eco-driving' initiative to raise awareness for fuel-efficient driving, as well as a number of programmes to promote mass transportation, non-motorised transport, energy-efficient technologies and fuel substitution towards gas and biofuels, but all have had limited impact so far (Ward et al. 2015; Zed 2015).
3.7 Barriers to implementation of additional actions 3.7.1 Institutional and political barriers
Due to its high degree of decentralisation, Indonesia faces large institutional barriers to implementation. Irrespective of the specific mitigation action (reducing deforestation, increasing the share of renewables etc.) weaknesses in governance are repeatedly considered as key barriers to implementation.
Legal status of climate policies. While Indonesia has a well-developed legislature on climate change, they rely largely on presidential and ministerial decrees, regulations and other documents of the executive branch of government. Parliamentary-based law is rare to non-existent in this field. This may limit the effectiveness of the laws, and may also lead to "tugs of war" over competencies (Resosudarmo et al. 2013).
Vertical integration. While the national government, and notably the President, is committed to tackling emission reductions as well as deforestation issues, these commitments often are not translated effectively to regional and local levels (Anderson et al. 2016).
Horizontal integration. Indonesia's large number of ministries and responsible authorities sometimes hinder each other in their effectiveness because of overlapping responsibilities and policy fields, while trying to take the lead in climate policy formulation (Resosudarmo et al. 2013). The restructuring of the climate-related agencies and integration into the new MoEF could in theory help
Implementation of Nationally Determined Contributions: Indonesia
45
mitigating this to some degree, but on the other hand the presidential units and agencies had considerable power that has been lost through that process (Di Gregorio et al. 2017). Parallel structures of MoEF and BAPPENAS make hierarchies of decision-making unclear (Di Gregorio et al. 2017; van Tilburg et al. 2016). A lack of horizontal integration and harmonisation across ministries and agencies has also been repeatedly mentioned as a key barrier towards realising the country's full energy efficiency potential (Tharakan 2015; Ward et al. 2015; Zed 2015)
Sectoral integration. Especially concerning deforestation, there is an imbalance between "green" and "brown" industries. While there is increasingly strong legislation as well as self-control of the agri-business (mainly palm oil) sector and the timber industry, not least through international pressures, the mining industry faces much less severe constraints (Roseboom 2016). However, 2006 data indicates that the mining industry holds forest concessions for an area of about 28 million hectares, of which 11 million hectares are located in preservation and conservation forests. Roughly the same area in permits was held by the timber industry in natural forest concessions in 2006 (Forest Watch Indonesia 2013). To compare, the Indonesian palm oil industry holds concession over a total area of 21 million hectares (Chain Reaction Research 2017). If the mining industry does not adhere to similar environmental rules as the timber and palm oil industries, land degradation especially from open-cast mining will become a significant source of emissions.
Lack of standards and regulations for vehicles. The Indonesian government has so far not set clear efficiency standards for all vehicle types, and fuel standards are non-existent. In addition, a lack of consumption-based taxations for vehicles does not send a signal to consumers that high fuel economy is desirable (Ward et al. 2015).
Clientelism. Strong economic actors often have the ear of the politicians and administrators on various political levels, and have considerable influence in shaping policies. This has even led to government officials opposing efforts by the private sector to "green" businesses as harmful to Indonesian business, and not in line with government authority (Anderson et al. 2016).
3.7.2 Financial and economic barriers
State-owned utility monopoly. The national electricity company Perusahaan Listrik Negara (PLN) has the monopoly on transmission, distribution and retail of electricity. PLN is operating at a loss due to low electricity prices (The Australia Institute 2017). Under the current regulatory framework, renewable electricity (e.g. from IPPs or from renewable power plants owned by PLN) would be more expensive than coal and increase PLN's deficit. PLN has a strong bias towards coal, national renewable target has only been introduced in the last update of its Electricity Supply Business Plan (RUPTL) (compare IEA (2016b) and PwC (2016a)).
Remaining energy subsidies – especially energy efficiency targets suffer from high fossil fuel subsidies (Ward et al. 2015). Indonesia has a long tradition of high subsidies on energy. In 2014 energy subsidies peaked at IDR 350,000 billion (ca. USD 26 billion) per year, which equalled 4.5% of Indonesia's GDP (World Bank 2017b). Indonesia has a long history of attempts to reduce energy subsidies and the latest reform has brought down subsidies for fuels from 3% of GDP in 2014 to 1% of GDP in 2015, but for electricity still amount to USD 3.8 billion Euro in 2016 (IISD 2016). Politically, subsidy reforms are a touchy issue as a large majority of the population opposes a fuel subsidy reform (World Bank 2017b). The potential for emission reductions through stringent subsidy reforms have been estimated to be 5 to 7% in the short-term and 9% with a 2030 time horizon (ADB 2015). Recent plans to phase out energy subsidies (except for poor household) by 2018 might mitigate that problem.
Lack of financial incentives. Ward et al. (2015) report a lack of accessible capital for the implementation of energy efficiency improvements. In conjunction with the weak price signal through subsidised energy prices, companies put off investments especially in medium- to high-cost efficiency measures, even if they are potentially cost-effective in the longer term. Project finance, involving third
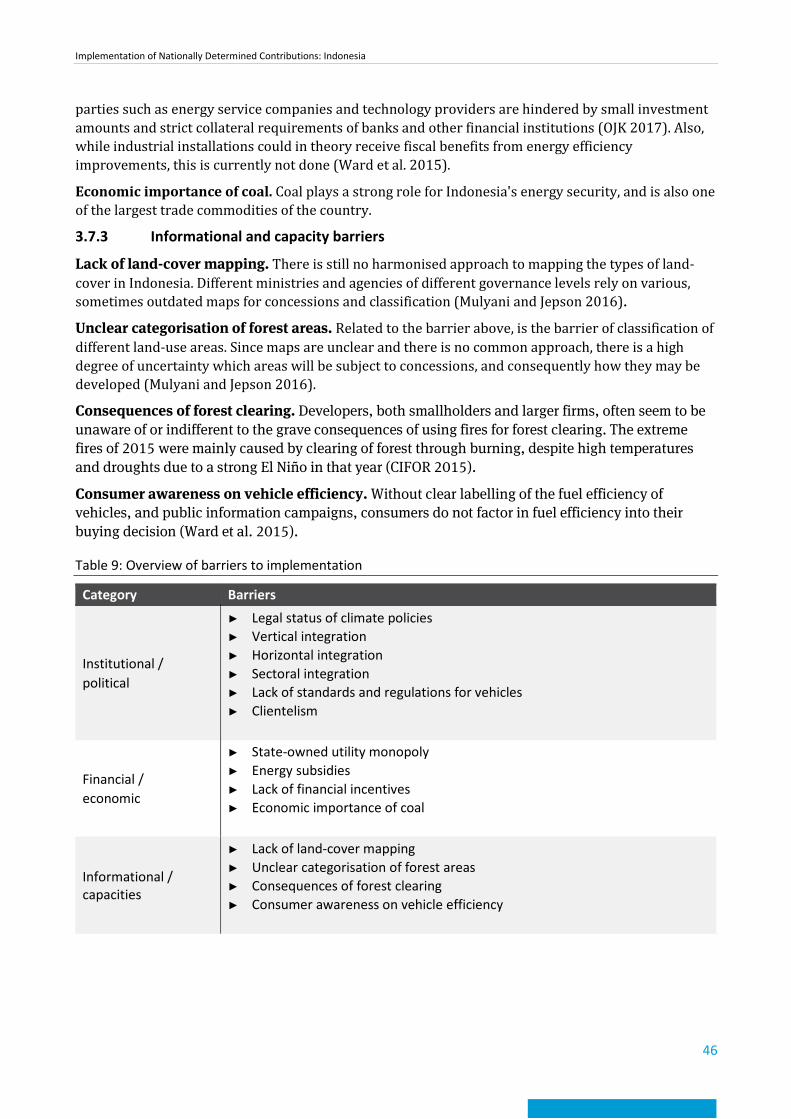
Implementation of Nationally Determined Contributions: Indonesia
46
parties such as energy service companies and technology providers are hindered by small investment amounts and strict collateral requirements of banks and other financial institutions (OJK 2017). Also, while industrial installations could in theory receive fiscal benefits from energy efficiency improvements, this is currently not done (Ward et al. 2015).
Economic importance of coal. Coal plays a strong role for Indonesia's energy security, and is also one of the largest trade commodities of the country.
3.7.3 Informational and capacity barriers
Lack of land-cover mapping. There is still no harmonised approach to mapping the types of land-cover in Indonesia. Different ministries and agencies of different governance levels rely on various, sometimes outdated maps for concessions and classification (Mulyani and Jepson 2016).
Unclear categorisation of forest areas. Related to the barrier above, is the barrier of classification of different land-use areas. Since maps are unclear and there is no common approach, there is a high degree of uncertainty which areas will be subject to concessions, and consequently how they may be developed (Mulyani and Jepson 2016).
Consequences of forest clearing. Developers, both smallholders and larger firms, often seem to be unaware of or indifferent to the grave consequences of using fires for forest clearing. The extreme fires of 2015 were mainly caused by clearing of forest through burning, despite high temperatures and droughts due to a strong El Niño in that year (CIFOR 2015).
Consumer awareness on vehicle efficiency. Without clear labelling of the fuel efficiency of vehicles, and public information campaigns, consumers do not factor in fuel efficiency into their buying decision (Ward et al. 2015).
Table 9: Overview of barriers to implementation
Category Barriers
Institutional / political
► Legal status of climate policies ► Vertical integration ► Horizontal integration ► Sectoral integration ► Lack of standards and regulations for vehicles ► Clientelism
Financial / economic
► State-owned utility monopoly ► Energy subsidies ► Lack of financial incentives ► Economic importance of coal
Informational / capacities
► Lack of land-cover mapping ► Unclear categorisation of forest areas ► Consequences of forest clearing ► Consumer awareness on vehicle efficiency
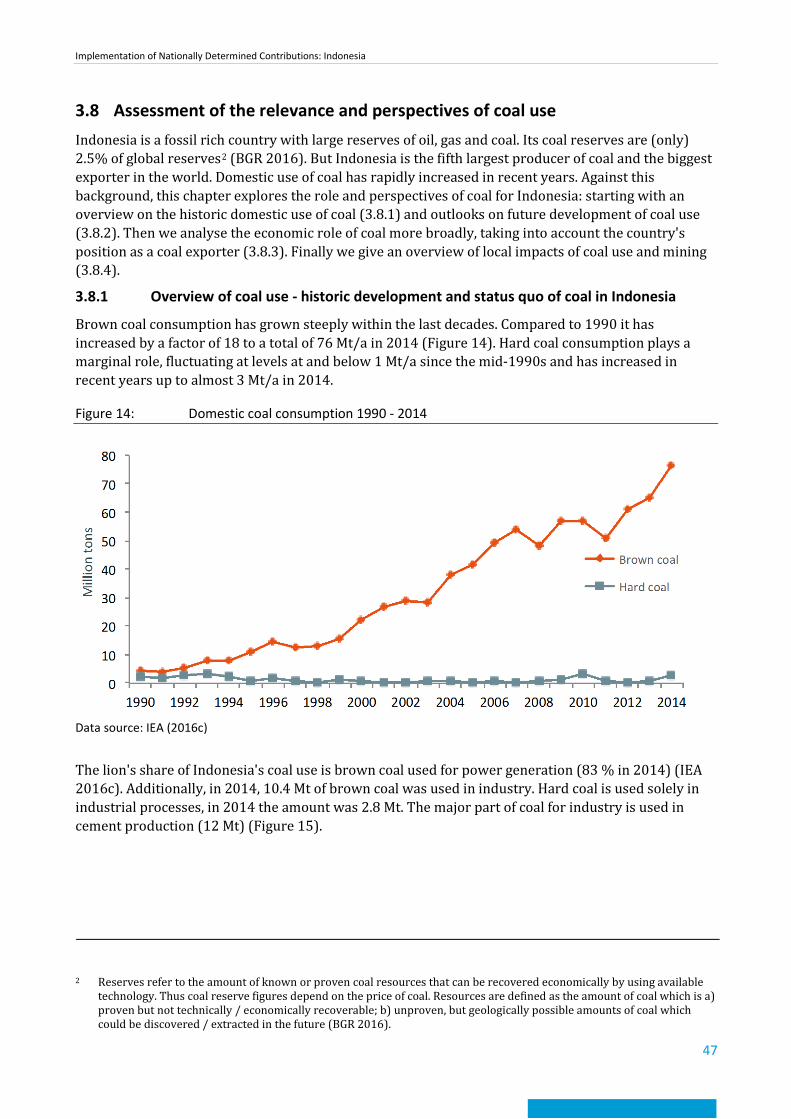
Implementation of Nationally Determined Contributions: Indonesia
47
3.8 Assessment of the relevance and perspectives of coal use Indonesia is a fossil rich country with large reserves of oil, gas and coal. Its coal reserves are (only) 2.5% of global reserves2 (BGR 2016). But Indonesia is the fifth largest producer of coal and the biggest exporter in the world. Domestic use of coal has rapidly increased in recent years. Against this background, this chapter explores the role and perspectives of coal for Indonesia: starting with an overview on the historic domestic use of coal (3.8.1) and outlooks on future development of coal use (3.8.2). Then we analyse the economic role of coal more broadly, taking into account the country's position as a coal exporter (3.8.3). Finally we give an overview of local impacts of coal use and mining (3.8.4).
3.8.1 Overview of coal use - historic development and status quo of coal in Indonesia
Brown coal consumption has grown steeply within the last decades. Compared to 1990 it has increased by a factor of 18 to a total of 76 Mt/a in 2014 (Figure 14). Hard coal consumption plays a marginal role, fluctuating at levels at and below 1 Mt/a since the mid-1990s and has increased in recent years up to almost 3 Mt/a in 2014.
Figure 14: Domestic coal consumption 1990 - 2014
Data source: IEA (2016c)
The lion's share of Indonesia's coal use is brown coal used for power generation (83 % in 2014) (IEA 2016c). Additionally, in 2014, 10.4 Mt of brown coal was used in industry. Hard coal is used solely in industrial processes, in 2014 the amount was 2.8 Mt. The major part of coal for industry is used in cement production (12 Mt) (Figure 15).
2 Reserves refer to the amount of known or proven coal resources that can be recovered economically by using available
technology. Thus coal reserve figures depend on the price of coal. Resources are defined as the amount of coal which is a) proven but not technically / economically recoverable; b) unproven, but geologically possible amounts of coal which could be discovered / extracted in the future (BGR 2016).
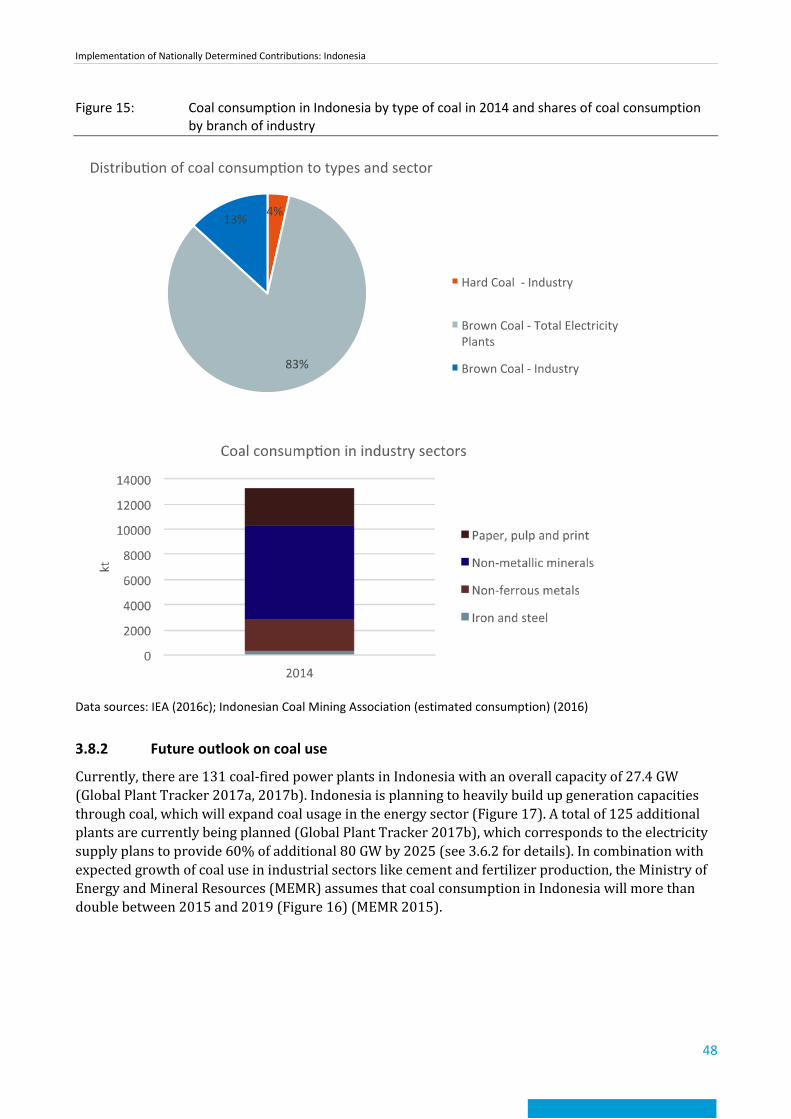
Implementation of Nationally Determined Contributions: Indonesia
48
Figure 15: Coal consumption in Indonesia by type of coal in 2014 and shares of coal consumption by branch of industry
Data sources: IEA (2016c); Indonesian Coal Mining Association (estimated consumption) (2016)
3.8.2 Future outlook on coal use
Currently, there are 131 coal-fired power plants in Indonesia with an overall capacity of 27.4 GW (Global Plant Tracker 2017a, 2017b). Indonesia is planning to heavily build up generation capacities through coal, which will expand coal usage in the energy sector (Figure 17). A total of 125 additional plants are currently being planned (Global Plant Tracker 2017b), which corresponds to the electricity supply plans to provide 60% of additional 80 GW by 2025 (see 3.6.2 for details). In combination with expected growth of coal use in industrial sectors like cement and fertilizer production, the Ministry of Energy and Mineral Resources (MEMR) assumes that coal consumption in Indonesia will more than double between 2015 and 2019 (Figure 16) (MEMR 2015).
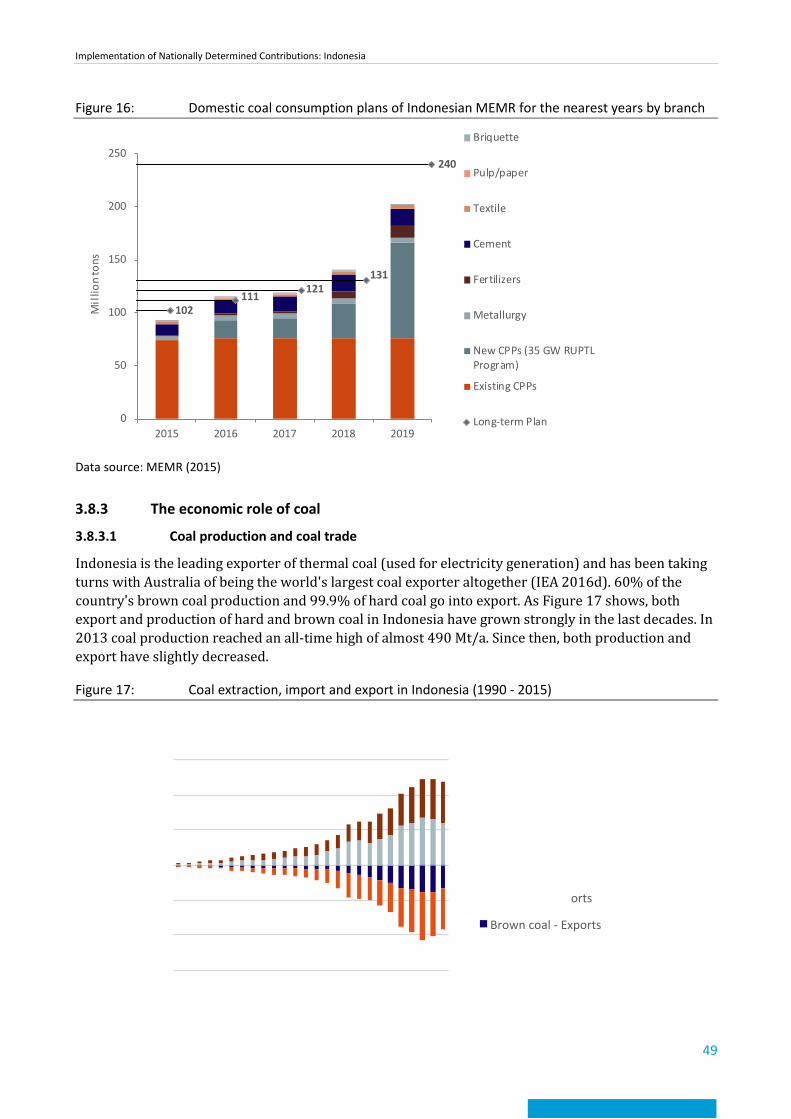
Implementation of Nationally Determined Contributions: Indonesia
49
Figure 16: Domestic coal consumption plans of Indonesian MEMR for the nearest years by branch
Data source: MEMR (2015)
3.8.3 The economic role of coal
3.8.3.1 Coal production and coal trade
Indonesia is the leading exporter of thermal coal (used for electricity generation) and has been taking turns with Australia of being the world's largest coal exporter altogether (IEA 2016d). 60% of the country's brown coal production and 99.9% of hard coal go into export. As Figure 17 shows, both export and production of hard and brown coal in Indonesia have grown strongly in the last decades. In 2013 coal production reached an all-time high of almost 490 Mt/a. Since then, both production and export have slightly decreased.
Figure 17: Coal extraction, import and export in Indonesia (1990 - 2015)
102111
121131
240
0
50
100
150
200
250
2015 2016 2017 2018 2019
Mil
lion
tons
Briquette
Pulp/paper
Textile
Cement
Fertilizers
Metallurgy
New CPPs (35 GW RUPTLProgram)
Existing CPPs
Long-term Plan
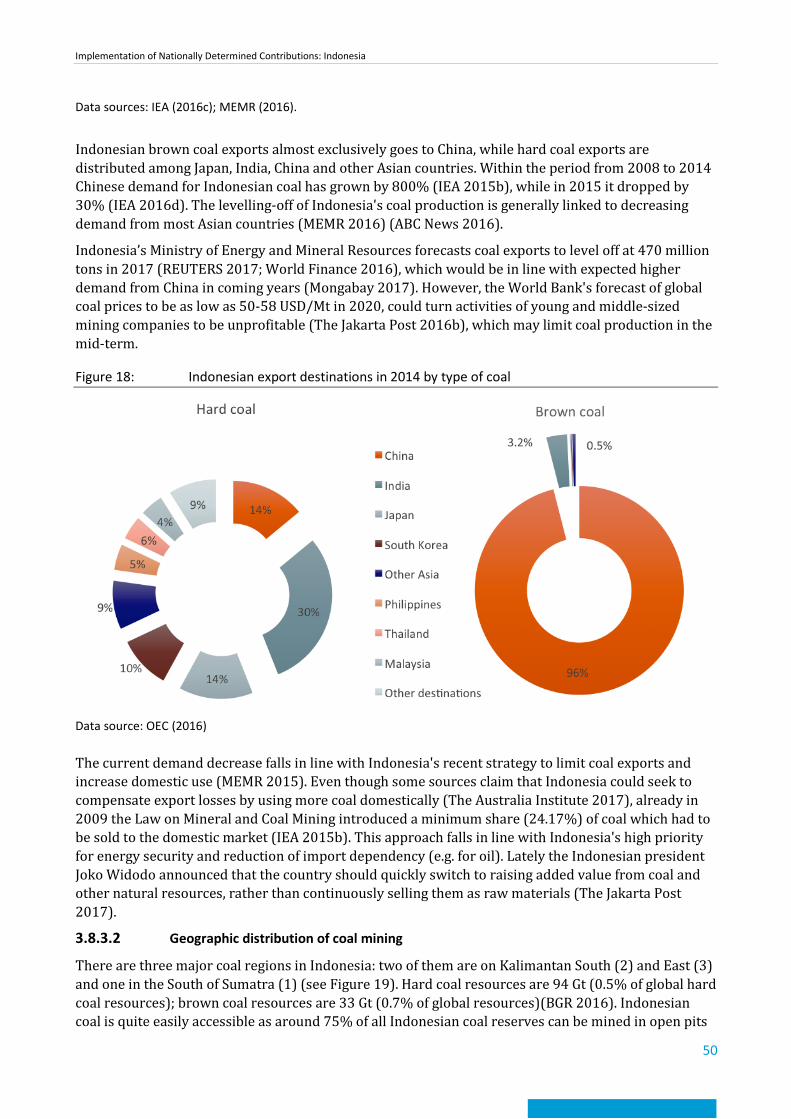
Implementation of Nationally Determined Contributions: Indonesia
50
Data sources: IEA (2016c); MEMR (2016).
Indonesian brown coal exports almost exclusively goes to China, while hard coal exports are distributed among Japan, India, China and other Asian countries. Within the period from 2008 to 2014 Chinese demand for Indonesian coal has grown by 800% (IEA 2015b), while in 2015 it dropped by 30% (IEA 2016d). The levelling-off of Indonesia's coal production is generally linked to decreasing demand from most Asian countries (MEMR 2016) (ABC News 2016).
Indonesia’s Ministry of Energy and Mineral Resources forecasts coal exports to level off at 470 million tons in 2017 (REUTERS 2017; World Finance 2016), which would be in line with expected higher demand from China in coming years (Mongabay 2017). However, the World Bank's forecast of global coal prices to be as low as 50-58 USD/Mt in 2020, could turn activities of young and middle-sized mining companies to be unprofitable (The Jakarta Post 2016b), which may limit coal production in the mid-term.
Figure 18: Indonesian export destinations in 2014 by type of coal
Data source: OEC (2016)
The current demand decrease falls in line with Indonesia's recent strategy to limit coal exports and increase domestic use (MEMR 2015). Even though some sources claim that Indonesia could seek to compensate export losses by using more coal domestically (The Australia Institute 2017), already in 2009 the Law on Mineral and Coal Mining introduced a minimum share (24.17%) of coal which had to be sold to the domestic market (IEA 2015b). This approach falls in line with Indonesia's high priority for energy security and reduction of import dependency (e.g. for oil). Lately the Indonesian president Joko Widodo announced that the country should quickly switch to raising added value from coal and other natural resources, rather than continuously selling them as raw materials (The Jakarta Post 2017).
3.8.3.2 Geographic distribution of coal mining
There are three major coal regions in Indonesia: two of them are on Kalimantan South (2) and East (3) and one in the South of Sumatra (1) (see Figure 19). Hard coal resources are 94 Gt (0.5% of global hard coal resources); brown coal resources are 33 Gt (0.7% of global resources)(BGR 2016). Indonesian coal is quite easily accessible as around 75% of all Indonesian coal reserves can be mined in open pits
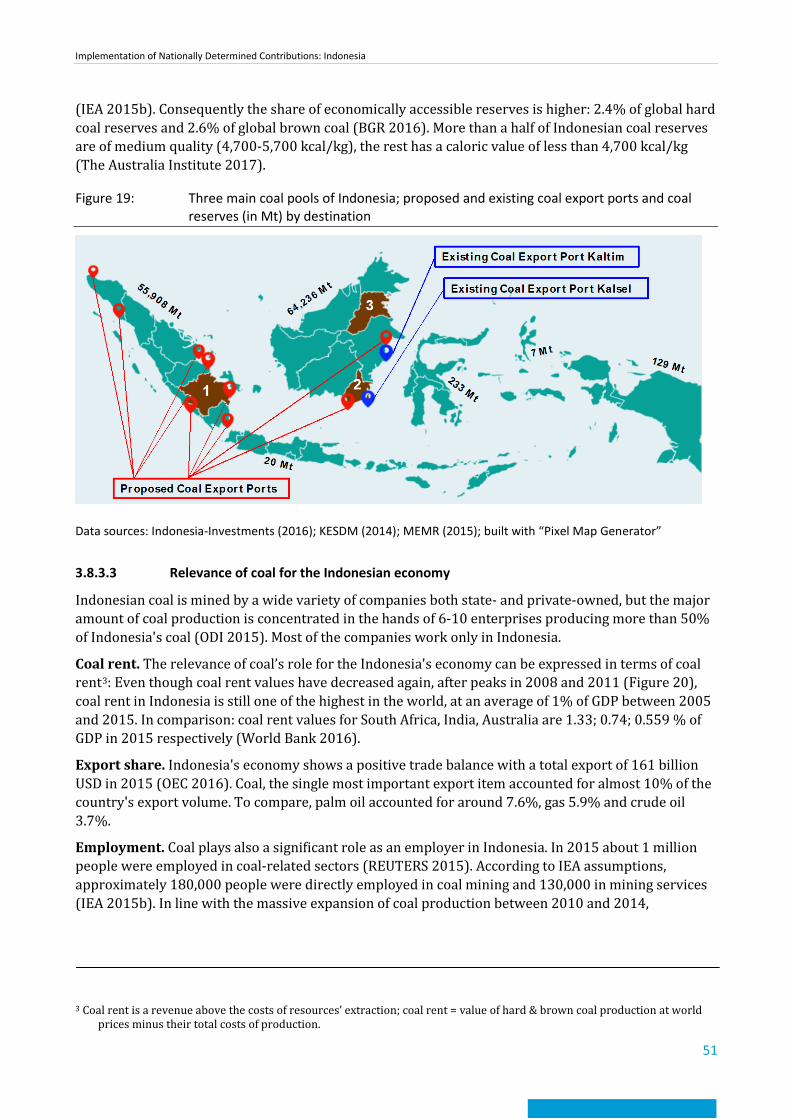
Implementation of Nationally Determined Contributions: Indonesia
51
(IEA 2015b). Consequently the share of economically accessible reserves is higher: 2.4% of global hard coal reserves and 2.6% of global brown coal (BGR 2016). More than a half of Indonesian coal reserves are of medium quality (4,700-5,700 kcal/kg), the rest has a caloric value of less than 4,700 kcal/kg (The Australia Institute 2017).
Figure 19: Three main coal pools of Indonesia; proposed and existing coal export ports and coal reserves (in Mt) by destination
Data sources: Indonesia-Investments (2016); KESDM (2014); MEMR (2015); built with “Pixel Map Generator”
3.8.3.3 Relevance of coal for the Indonesian economy
Indonesian coal is mined by a wide variety of companies both state- and private-owned, but the major amount of coal production is concentrated in the hands of 6-10 enterprises producing more than 50% of Indonesia's coal (ODI 2015). Most of the companies work only in Indonesia.
Coal rent. The relevance of coal’s role for the Indonesia's economy can be expressed in terms of coal rent3: Even though coal rent values have decreased again, after peaks in 2008 and 2011 (Figure 20), coal rent in Indonesia is still one of the highest in the world, at an average of 1% of GDP between 2005 and 2015. In comparison: coal rent values for South Africa, India, Australia are 1.33; 0.74; 0.559 % of GDP in 2015 respectively (World Bank 2016).
Export share. Indonesia's economy shows a positive trade balance with a total export of 161 billion USD in 2015 (OEC 2016). Coal, the single most important export item accounted for almost 10% of the country's export volume. To compare, palm oil accounted for around 7.6%, gas 5.9% and crude oil 3.7%.
Employment. Coal plays also a significant role as an employer in Indonesia. In 2015 about 1 million people were employed in coal-related sectors (REUTERS 2015). According to IEA assumptions, approximately 180,000 people were directly employed in coal mining and 130,000 in mining services (IEA 2015b). In line with the massive expansion of coal production between 2010 and 2014,
3 Coal rent is a revenue above the costs of resources’ extraction; coal rent = value of hard & brown coal production at world
prices minus their total costs of production.
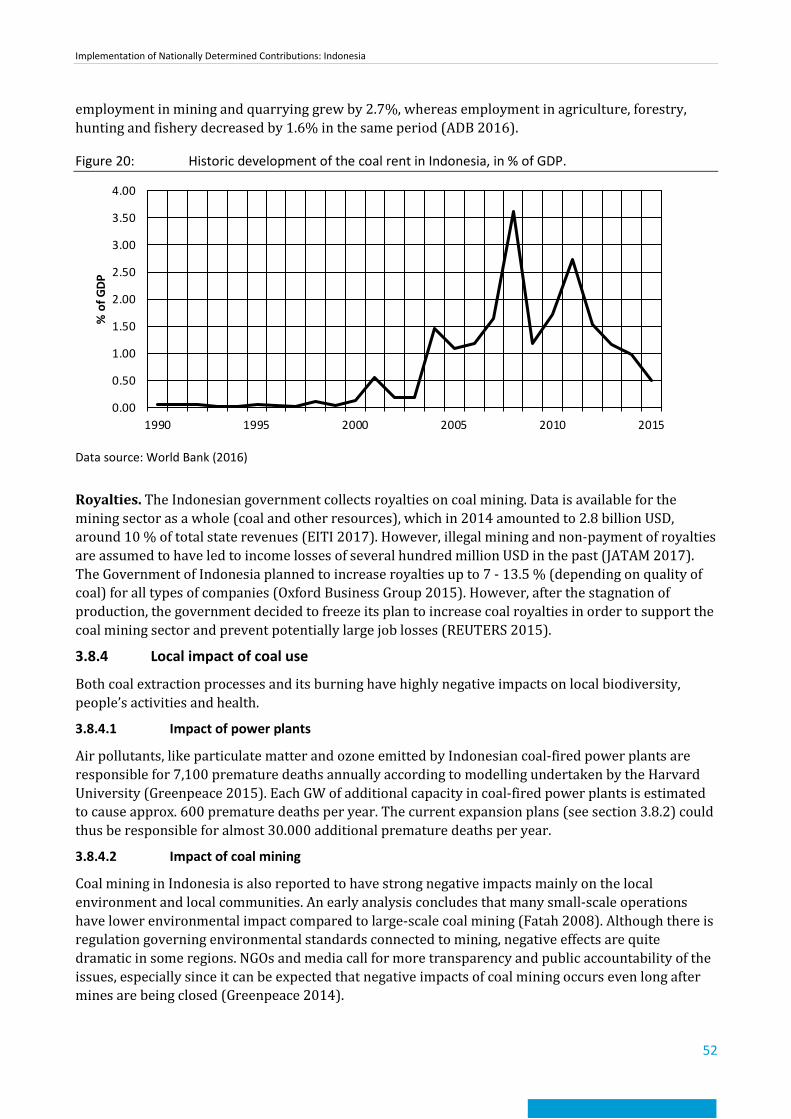
Implementation of Nationally Determined Contributions: Indonesia
52
employment in mining and quarrying grew by 2.7%, whereas employment in agriculture, forestry, hunting and fishery decreased by 1.6% in the same period (ADB 2016).
Figure 20: Historic development of the coal rent in Indonesia, in % of GDP.
Data source: World Bank (2016)
Royalties. The Indonesian government collects royalties on coal mining. Data is available for the mining sector as a whole (coal and other resources), which in 2014 amounted to 2.8 billion USD, around 10 % of total state revenues (EITI 2017). However, illegal mining and non-payment of royalties are assumed to have led to income losses of several hundred million USD in the past (JATAM 2017). The Government of Indonesia planned to increase royalties up to 7 - 13.5 % (depending on quality of coal) for all types of companies (Oxford Business Group 2015). However, after the stagnation of production, the government decided to freeze its plan to increase coal royalties in order to support the coal mining sector and prevent potentially large job losses (REUTERS 2015).
3.8.4 Local impact of coal use
Both coal extraction processes and its burning have highly negative impacts on local biodiversity, people’s activities and health.
3.8.4.1 Impact of power plants
Air pollutants, like particulate matter and ozone emitted by Indonesian coal-fired power plants are responsible for 7,100 premature deaths annually according to modelling undertaken by the Harvard University (Greenpeace 2015). Each GW of additional capacity in coal-fired power plants is estimated to cause approx. 600 premature deaths per year. The current expansion plans (see section 3.8.2) could thus be responsible for almost 30.000 additional premature deaths per year.
3.8.4.2 Impact of coal mining
Coal mining in Indonesia is also reported to have strong negative impacts mainly on the local environment and local communities. An early analysis concludes that many small-scale operations have lower environmental impact compared to large-scale coal mining (Fatah 2008). Although there is regulation governing environmental standards connected to mining, negative effects are quite dramatic in some regions. NGOs and media call for more transparency and public accountability of the issues, especially since it can be expected that negative impacts of coal mining occurs even long after mines are being closed (Greenpeace 2014).
0.00
0.50
1.00
1.50
2.00
2.50
3.00
3.50
4.00
1990 1995 2000 2005 2010 2015
% o
f GDP
Implementation of Nationally Determined Contributions: Indonesia
53
Deforestation and land degradation. Most coal in Indonesia is mined in open pits, which is quite land intensive and leaves land degraded unless major efforts for re-cultivation are undertaken. Based on the total amount of mining concessions issued so far, 8.6 Mha corresponding to 7 to 9% of national forests are under threat to be deforested by coal mining only (Fern 2015).
Especially in East Kalimantan, where most of Indonesia's coal mines are located, negative effects through land degradation are being reported. One example is Samarinda, a regional capital of East Kalimantan, where the water runoff from the deforested slopes around the city increased the intensity and frequency of floods after rainfalls (Mongabay 2014). In the same region mining concessions are in competition with agricultural uses of the respective lands, putting farmers under economic pressure (Yale E360 2015).
River and groundwater pollution: Coal mining is reported to have heavy negative effects through large amounts of acid mine drainage and toxic waste water containing e.g. sulfur, mercury, acid slarida, manganese, sulfuric acid and lead. A study by Greenpeace found that river pollution in South Kalimantan exceeded national environmental standards (Greenpeace 2014). Similar effects of coal mining with respect to river pollution and soil erosion as well as degradation were observed on South Sumatra (Sayoga Gautama 2012). In some cases water pollution from coal mining has directly affected the livelihoods of neighbouring communities by factually destroying rice plantations and killing fish in aquacultures (Mongabay 2014).
Health risks and accidents: Toxic dump water and coal dust increase the risk for numerous diseases: chemical elements and metals in mining pits’ waters can cause skin diseases and skin cancer. Coal dust in mining regions is linked to high rates of respiratory infections (Mongabay 2014). Due to lack of protection in mining pits, individual cases of injuries and deaths have been reported, e.g. in Samarinda, where 22 children have perished since 2011 while swimming and playing in stagnant waters filling mining holes (Inside Indonesia 2016; WRM 2015).
3.8.5 Conclusions on coal mining and use
Indonesia is a coal-rich country and among the most important exporters of coal globally. Mining and export of coal have strongly increased over the last decades, but have levelled off in recent years. It can be expected that the domestic use of coal (mainly for electricity generation) will become more important in coming years. Thus any ambitious mitigation strategy for Indonesia must address coal mining and coal use.
From an economic perspective, coal mining is a key source of income for Indonesia, contributing 10% of the country's export share, providing several hundred thousand jobs and supplying the government directly with income through royalties. On the other hand, coal use has been subsidised in the past. And both mining and coal use cause heavy local environmental and health burdens to the Indonesian society.
To support national and international mitigation efforts, we see two key strategies relating to coal in Indonesia:
► If the plans for to-be-build coal fired power plants were to be implemented, Indonesia would face a massive carbon lock-in for coming decades. Thus a national mitigation strategy should include a quick increase in energy efficiency and use or renewables for electricity generation in order to minimise the number of coal-fired power plants, which need to be built in order to satisfy the country's electricity demand.
► Indonesia's economy largely depends on coal mining. Assuming that global demand for coal would decrease (e.g. through efforts to decrease coal use and imports in countries like China and India) Indonesia would suffer economically. Thus, it would be important to diversify the country's economic base and move away from the strong focus of coal exports, e.g. through an expansion of
Implementation of Nationally Determined Contributions: Indonesia
54
Indonesia's sustainable forestry products. Generally this is in line with the country's strategy to not only sell raw materials, but rather products with higher added value. However, if the coal mined was just used locally (instead of exported) this would not provide any climate benefit. Thus this strategy must go hand-in-hand with a decarbonisation of Indonesia's energy sector. In this case however, it is important to note that it would not only be mining companies who would suffer from reduced coal export and use. Also the regions in which coal mining happens today do benefit economically - and in the long-term could heavily lobby against reduced coal mining. Against this background we consider it advisable to support the current coal mining regions to diversify their economic base, possibly in combination with raising the awareness of negative local impacts and the true costs of coal mining and use.
Implementation of Nationally Determined Contributions: Indonesia
55
4 References ABC News (2016): Coal Price Spike Caused by Reduction in Chinese Coal Output Says Specialist. ABC News. http://www.abc.net.au/news/2016-08-24/coal-price-spike-on-back-of-reduced-chinese-mining/7776904. Last access: 03 March 2017.
ADB (2015): Fossil fuel subsidies in Indonesia. Trends, impacts, and reforms. Asian Development Bank. http://public.eblib.com/choice/publicfullrecord.aspx?p=4453815. Last access: 05 May 2017.
ADB (2016): Analysis of Trends and Challenges in the Indonesian Labor Market. ADB - Asian Development Bank. https://www.adb.org/sites/default/files/publication/182935/ino-paper-16-2016.pdf
Anderson, Z. R.; Kusters, K.; McCarthy, J.; Obidzinski, K. (2016): Green Growth Rhetoric versus reality: Insights from Indonesia. Global Environmental Change 3830–40.
Ardiansyah, F.; Marthen, A. A.; Amalia, N. (2015): Forest and land-use governance in a decentralized Indonesia: A legal and policy review. Center for International Forestry Research (CIFOR). doi: 10.17528/cifor/005695.
BAPPENAS (2015): Developing Indonesian Climate Mitigation Policy 2020-2030 - Through RAN-GRK Review. Jakarta: Ministry of National Development Planning. http://www.paklim.org/index.php/component/k2/item/247-developing-indonesian-climate-mitigation-policy-2020-2030-through-ran-grk-review.html
BGR (2016): Energiestudie-Reserven, Ressourcen und Verfügbarkeit von Energierohstoffen. Hannover: Bundesanstalt für Geowissenschaften und Rohstoffe (BGR). https://www.bgr.bund.de/DE/Themen/Energie/Downloads/Energiestudie_2016.pdf?__blob=publicationFile&v=3. Last access: 22 May 2017.
Boer, R.; Gumilang, R.; Martens, J.-W.; Neeff, T.; Munzinger, P.; Katriana, T. (2014): Background Report for Institutional Arrangements for MRV in Indonesia. Jakarta: GIZ - Gesellschaft für internationale Zusammenarbeit.
BP (2017): Statistical Review of World Energy | Energy economics | BP Global. bp.com. http://www.bp.com/en/global/corporate/energy-economics/statistical-review-of-world-energy.html. Last access: 08 May 2017.
Chain Reaction Research (2017): Indonesia’s Palm O il Landbank Expansion Limited by Proposed Moratorium and NDPE Policies. Washingt D.C. https://chainreactionresearch.files.wordpress.com/2017/02/indonesia_s-palm-oil-landbank-expansion-limited-by-proposed-moratorium-and-ndpe-policies-170213.pdf
CIFOR (2015): Fact File. Clearing the smoke: The causes and consequences of Indonesia’s fires. Forests News. http://blog.cifor.org/37016/clearing-the-smoke-the-causes-and-consequences-of-indonesias-fires?fnl=en. Last access: 05 May 2017.
Climate Investment Funds (2010): Clean Technology Fund Investment Plan for Indonesia. Washington D.C.: World Bank. https://www.climateinvestmentfunds.org/sites/default/files/CTF_Indonesia_investment_plan_041210.pdf. Last access: 08 June 2017.
climate policy database (2016): Electricity Supply Business Plan (RUPTL) (2016-2025) - Policy database. http://climatepolicydatabase.org/index.php?title=Electricity_Supply_Business_Plan_(RUPTL)_(2016-2025). Last access: 04 May 2017.
Coalswarm (2017): Boom and Bust 2017 - Tracking the Global Coal Plant Pipeline. Coalswarm, Sierra Club, Greenpeace. http://endcoal.org/wp-content/uploads/2017/03/BoomBust2017-English-Final.pdf. Last access: 24 March 2017.
Di Gregorio, M.; Nurrochmat, D. R.; Paavola, J.; Sari, I. M.; Fatorelli, L.; Pramova, E.; et al. (2017): Climate policy integration in the land use sector: Mitigation, adaptation and sustainable development linkages. Environmental Science & Policy 6735–43. doi: 10.1016/j.envsci.2016.11.004.
DNPI (2010): Indonesia’s greenhouse gas abatement cost curve. National Council on Climate Change Indonesia- dewan nasional perubahan iklim (DNPI). http://www.mmechanisms.org/document/country/IDN/Indonesia_ghg_cost_curve_english.pdf. Last access: 05 May 2017.
EITI (2017): Indonesia | Extractive Industries Transparency Initiative. https://eiti.org/indonesia. Last access: 17 May 2017.
Implementation of Nationally Determined Contributions: Indonesia
56
EU JRC; PBL (2014): Emission Database for Global Atmospheric Research (EDGAR), release version 4.2. European Commission Joint Research Centre (JRC), PBL Netherlands Environmental Assessment Agency.
Fatah, L. (2008): The Impacts of Coal Mining on the Economy and Environment of South Kalimantan Province, Indonesia. Asean Economic Bulletin 25(1)85–98. doi: 10.1355/AE25-1H.
Forest Watch Indonesia (2013): Taking Stock of Indonesian Forest Conditions and Forest Stakeholder Performance. http://fwi.or.id/english/publikasi/taking-stock-of-indonesian-forest-conditions-and-forest-stakeholder-performance/
GIZ (n.d.).: Indonesia. Home>Worldwide>Asia>Indonesia. https://www.giz.de/en/worldwide/352.html
Global Plant Tracker (2017a): Jan-2017-Proposed-by-country-MW.pdf. End Coal - Global Coal Plant Tracker. http://endcoal.org/wp-content/uploads/2017/03/Jan-2017-Proposed-by-country-MW.pdf. Last access: 07 March 2017.
Global Plant Tracker (2017b): Jan-2017-Proposed-by-country-units.pdf. End Coal - Global Coal Plant Tracker. http://endcoal.org/wp-content/uploads/2017/03/Jan-2017-Proposed-by-country-units.pdf. Last access: 07 March 2017.
GoI (2009): Indonesia Climate Change Sectoral Roadmap ICCSR. Jakarta: BAPPENAS. http://www.adaptation-undp.org/sites/default/files/downloads/indonesia_climate_change_sectoral_roadmap_iccsr.pdf. Last access: 14 April 2017.
GoI (2015): Indonesia First Biennial Update Report (BUR). Jakarta: Government of Indonesia. http://unfccc.int/essential_background/library/items/3599.php?rec=j&priref=7834#beg. Last access: 08 May 2017.
GoI (2016): First Nationally Determined Contribution. Republic of Indonesia. Jakarta. http://www4.unfccc.int/ndcregistry/PublishedDocuments/Indonesia%20First/First%20NDC%20Indonesia_submitted%20to%20UNFCCC%20Set_November%20%202016.pdf. Last access: 15 March 2017.
Greenpeace (2014): Coal Mines Polluting South Kalimantan’s Water. Greenpeace Southeast Asia. http://www.greenpeace.org/seasia/id/PageFiles/645408/FULL%20REPORT%20Coal%20Mining%20Polluting%20South%20Kalimantan%20Water_Lowres.pdf. Last access: 02 January 2017.
Greenpeace (2015): Human Cost of Coal Power - How coal-fired power plants threaten the health of Indonesians. Jakarta: Greenpeace Indonesia. http://www.greenpeace.org/seasia/id/PageFiles/695938/full-report-human-cost-of-coal-power.pdf. Last access: 17 May 2017.
Gütschow, J.; Jeffery, M. L.; Gieseke, R.; Gebel, R.; Stevens, D.; Krapp, M.; Rocha, M. (2016): The PRIMAP-hist national historical emissions time series. Earth System Science Data 8(2)571–603. doi: 10.5194/essd-8-571-2016.
Hargita, Y.; Rüter, S. (2015): Analysis of the land use sector in INDCs of relevant Non-Annex I parties. No. 50. Thünen Working Paper. Braunschweig: Thünen-Institut.
Hasegawa, T.; Fujimori, S.; Boer, R.; Immanuel, G.; Masui, T. (2016): Land-Based Mitigation Strategies under the Mid-Term Carbon Reduction Targets in Indonesia. Sustainability 8(12)1283. doi: 10.3390/su8121283.
Huijnen, V.; Wooster, M. J.; Kaiser, J. W.; Gaveau, D. L. A.; Flemming, J.; Parrington, M.; et al. (2016): Fire carbon emissions over maritime southeast Asia in 2015 largest since 1997. Scientific Reports 6(1). doi: 10.1038/srep26886.
ICED (2016): Renewable energy Featured in PLN’s 10-Year Electricity Supply Business Plan (RUPTL) 2016-2025. Indonesian Clean Energy Development. http://www.iced.or.id/2016/07/renewable-energy-featured-in-plns-10-year-electricity-supply-business-plan-ruptl-2016-2025/. Last access: 02 February 2017.
IEA (2015a): Energy Policies Beyond IEA Countries: Indonesia 2015. Paris: OECD - Organization for Economic Cooperation & Development. http://dx.doi.org/10.1787/9789264065277-en. Last access: 07 March 2017.
IEA (2015b): Energy Policies Beyond IEA Countries: Indonesia 2015. Paris: OECD - Organization for Economic Cooperation & Development. http://dx.doi.org/10.1787/9789264065277-en. Last access: 07 March 2017.
IEA (2016a): Energy Balances. 2016 edition. Paris, France: International Energy Agency.
IEA (2016b): Reducing emissions from fossil-fired generation - Indonesia, Malaysia and Viet Nam. Paris: International Energy Agency. https://www.iea.org/publications/insights/insightpublications/ReducingEmissionsfromFossilFiredGeneration.pdf. Last access: 21 April 2017.
IEA (2016c): Countries statistics. IEA (International Energy Agency). https://www.iea.org/countries/. Last access: 10 January 2017.
Implementation of Nationally Determined Contributions: Indonesia
57
IEA (2016d): Coal Information 2016. OECD Publishing. http://lib.myilibrary.com?id=960383. Last access: 02 January 2017.
IISD (2012): A Citizens’ Guide to Energy Subsidies in Indonesia; 2012 Update. Winnipeg: iisd - International Institute for Sustainable Development. https://www.iisd.org/gsi/sites/default/files/indonesia_czguide_eng_update_2012.pdf. Last access: 03 February 2017.
IISD (2016): Indonesia’s Financially Sustainable Electricity Sector. GSI Report. iisd - International Institute for Sustainable Development; GSI - Global Subsidies Initiative. http://www.iisd.org/sites/default/files/publications/indonesia-financially-sustainable-electricity-sector.pdf. Last access: 03 February 2017.
Indonesia-Investments (2016): Coal Mining in Indonesia. Indonesia InvestmentsIndonesian|Coal Industry. http://www.indonesia-investments.com/business/commodities/coal/item236? Last access: 01 February 2017.
Indonesian Coal Mining Association (2016): Indonesia Coal Industry Update 2016. JOGMEC Coal Investment Seminar, Tokyo. http://www.jogmec.go.jp/content/300272505.pdf. Last access: 24 February 2017.
Inside Indonesia (2016): Samarinda’s deadly mining pits. Inside Indonesia.org. http://www.insideindonesia.org/samarinda-s-deadly-mining-pits. Last access: 01 February 2017.
JATAM (2017): Coal miners owe the Indonesian government hundreds of millions of dollars | JATAM. https://www.jatam.org/2017/05/12/coal-miners-owe-the-indonesian-government-hundreds-of-millions-of-dollars/. Last access: 17 May 2017.
JES (2015): Securing Indonesia’s Energy Future. Journal of energy security. http://ensec.org/index.php?option=com_content&view=article&id=577:securing-indonesias-energy-future-&catid=126:kr&Itemid=395. Last access: 02 February 2017.
Jong, N.; Parlina, I. (2016): Norway slams slow REDD+ project progress. The Jakarta Post. http://www.thejakartapost.com/news/2016/02/04/norway-slams-slow-redd-project-progress.html
Kajian, L. H. (2015): Opsi Kebijakan Fiskal untuk Sektor Energi. Dalam Mendukung Pembangunan Berkelanjutan di Indonesia. Ministry of Finance Indonesia.
LSE, G. R. I. on C. C. and the E.; Grantham Reearch Institute on Climate Change and the Environement (2017): The Global Climate Legislation Study - Countries - Indonesia. Another key barrier have been energy subsidies and low energy costs. Last access: 24 April 2017.
Meijaard, E. (2016): No more fires in Indonesia? mongabay.com. https://news.mongabay.com/2016/06/no-more-fires-in-indonesia/
MEMR (2014): Handbook of Energy & Economic Statistics of Indonesia. Indonesia: Ministry of Energy and Mineral Resources - Republic of Indonesia. http://esdm.go.id/assets/admin/file/pub/HEESI_2014.pdf. Last access: 23 February 2017.
MEMR (2015): Indonesian Coal Mining Policy. Clean Coal Day in Japan 2015 - International Symposium; speech from the MEMR (Ministry of Energy and Mineral Resources of Indonesia), Japan. http://www.jcoal.or.jp/coaldb/shiryo/material/upload/1-7speech%201%20Mr.%20Bambang%20Gatot.pdf. Last access: 23 February 2017.
MEMR (2016): 2016 Handbook of Energy & Economic Statistics of Indonesia - Final Edition. Jakarta: MEMR - Ministry of Energy and Mineral Resources Republic of Indonesia. http://esdm.go.id/assets/admin/file/pub/HEESI_2016_Edisi_Final.pdf. Last access: 17 March 2017.
Mongabay (2014): Coal mine has heavy impact in Indonesian Borneo. Mongabay News. https://news.mongabay.com/2014/09/coal-mine-has-heavy-impact-in-indonesian-borneo/. Last access: 01 February 2017.
Mongabay (2017): Indonesia’s Last Stand for a Coal Industry in Peril. Bongabay:Indonesian coal. https://news.mongabay.com/2017/02/indonesias-last-stand-for-a-coal-industry-in-peril/. Last access: 02 March 2017.
Mulyani, M.; Jepson, P. (2016): Does the ‘One Map Initiative’ Represent a New Path for Forest Mapping in Indonesia? Assessing the Contribution of the REDD+ Initiative in Effecting Forest Governance Reform. Forests 8(1)14. doi: 10.3390/f8010014.
Munthe, C. (2017): Indonesia ministry seeks to extend forest moratorium by two years. Reuters. http://www.reuters.com/article/us-indonesia-environment-plantings-idUSKBN18618R
Implementation of Nationally Determined Contributions: Indonesia
58
Nama Database (n.d.).: . http://www.nama-database.org
ND-GAIN (2017): Notre Dame Global Adaptation Index.
ODI (2015): G20 Subsidies to Oil, Gas and Coal production: Indonesia. ODI - Overseas Development Institute; Oilchange - Oil Change International; IISD - International Institute for Sustainable Development. https://www.odi.org/sites/odi.org.uk/files/odi-assets/publications-opinion-files/9963.pdf. Last access: 03 February 2017.
OEC (2016): Indonesia: exports and imports. The Observatory of Economic Complexity - OEC, international trade data. database, . http://atlas.media.mit.edu/en/profile/country/idn/. Last access: 23 February 2017.
OJK (2017): Tinjauan Penerapan Skema Project Finance Untuk Pembiayaan Infrastruktur Hijau Fi Indonesia. Jakarta: Otoritas Jasa Keuangan.
Oxford Business Group (2015): Telling times for Indonesia’s coal industry | Indonesia 2015 |. Oxford Business Group. http://www.oxfordbusinessgroup.com/news/telling-times-indonesia%E2%80%99s-coal-industry. Last access: 23 February 2017.
PwC (2016a): Release of long-awaited 2016 - 2025 RUPTL – a positive sign for IPP investors. Indonesia Energy, Utilities & Mining newsFlash (59). https://www.pwc.com/id/en/publications/assets/eumpublications/newsflash/2016/PwC%20Indonesia-eum-newsflash-2016-59.pdf. Last access: 02 February 2017.
PwC (2016b): Power in Indonesia - Investment and Taxation Guide. 4th edition. Pricewaterhouse Coopers International Limited (PwC) Indonesia. http://www.pwc.com/id/en/energy-utilities-mining/assets/power/power-guide-2016.pdf. Last access: 02 February 2017.
REDD-Monitor (2013): Indonesia’s Rate of Deforestation has doubled under the Moratorium. The REDD Monitor org. http://www.redd-monitor.org/2013/12/11/indonesias-rate-of-deforestation-has-doubled-under-the-moratorium/. Last access: 14 February 2017.
ReEX Capital Asia (2012): South East Asia Energy Efficiency Market Report 2011. Singapore.
Reid, A. (2012): Indonesia rising: the repositioning of Asia’s third giant. Institute of Southeast Asian Studies.
Resosudarmo, B. P.; Ardiansyah, F.; Napitupulu, L. (2013): The Dynamics of Climate Change Governance in Indonesia. Climate governance in the developing world. Cambridge: Polity.
REUTERS (2015): Indonesia 2016 coal exports to slump as low prices hurt miners -industry | Reuters. Information Agency REUTERS. http://www.reuters.com/article/indonesia-coal-idUST9N0NH05D20151030. Last access: 23 February 2017.
REUTERS (2017): Chaos at Indonesian ports disrupts coal shipping. Thomson Reuters Foundation News. http://news.trust.org/item/20170208081735-jrcrr/. Last access: 08 March 2017.
Roseboom, H. (2016): Deforestation: Loggers Not to Blame. Indonesia Expats. http://indonesiaexpat.biz/other/conservation-other/deforestation-loggers-not-to-blame/. Last access: 18 May 2017.
Sayoga Gautama, R. (2012): Acid Water Problem in Bukit Asam Coal Mine, South Sumatra, Indonesia. Department of Mining Engineering, Institut Teknologi Bandung. https://www.imwa.info/docs/imwa_1994/IMWA1994_Gautama_533.pdf
Siagian, U.; Yuwono, B.; Fujimori, S.; Masui, T. (2017): Low-Carbon Energy Development in Indonesia in Alignment with Intended Nationally Determined Contribution (INDC) by 2030. Energies 10(1)52. doi: 10.3390/en10010052.
Tharakan, P. (2015): Summary of Indonesia’s Energy Sector Assessment. ADB Papers on Indonesia. Asian Development Bank. https://www.adb.org/sites/default/files/publication/178039/ino-paper-09-2015.pdf. Last access: 12 June 2017.
The Australia Institute (2017): An Own Coal? Energy Policy in Indonesia. Canberra, Australia. http://www.tai.org.au/sites/defualt/files/P285%20An%20own%20coal%20Indonesian%20energy%20policy%20Feb%202017%20FINAL.pdf. Last access: 23 March 2017.
The Economist (2016): For peat’s sake: Despite tough talk, Indonesia’s government is struggling to stem deforestation. The Economist. http://www.economist.com/news/asia/21710844-weather-helping-little-despite-tough-talk-indonesias-government-struggling-stem. Last access: 18 May 2017.
Implementation of Nationally Determined Contributions: Indonesia
59
The Jakarta Post (2016a): Entire process for new palm oil permit issuance ends: Minister. The Jakarta Post. http://www.thejakartapost.com/news/2016/05/01/entire-process-for-new-palm-oil-permit-issuance-ends-minister.html. Last access: 18 May 2017.
The Jakarta Post (2016b): Analysis: Sulawesi: An island of opportunity amid economic slowdown - Business. The Jakarta Post News. Online Newspaper, . http://www.thejakartapost.com/news/2016/03/23/analysis-sulawesi-an-island-opportunity-amid-economic-slowdown.html. Last access: 08 March 2017.
The Jakarta Post (2017): Era of selling natural resources has ended: Jokowi. The Jakarta Post News. Online Newspaper, . http://www.thejakartapost.com/news/2017/03/23/era-of-selling-natural-resources-has-ended-jokowi.html. Last access: 23 March 2017.
The Straits Times (2017): Indonesia’s environment minister wants permanent ban on licences to use forest land. The Straits Times. http://www.straitstimes.com/asia/se-asia/indonesia-environment-minister-wants-permanent-ban-on-licences-to-use-forest-land?utm_source=People+and+Forests+E-News&utm_campaign=14414661ff-People_and_Forests_E_News_July17&utm_medium=email&utm_term=0_45977cdcf4-14414661ff-399258605. Last access: 07 August 2017.
van Tilburg, X.; Villaveces-Izquierdo, S.; Indriani, G. (2016): Energy security as positive force for green growth in Indonesia? Den Haag: The Clingendael Institute. https://www.clingendael.nl/sites/default/files/Energy%20security_green_growth_Indonesia.pdf. Last access: 16 May 2017.
UNDP (2015): Human Development Reports: Human Development Index. Human Development Index.
United Nations (2014): World Urbanisation Prospects. doi: 978-92-1-151517-6.
Ward, J.; Marijs, C.; Tumiawa, F.; Salim, E. (2015): A Coherent Fiscal Policy Framework for Promoting Renewable Energies and Energy Efficiency in Indonesia. Vivid Economics and Ministry of Finance Indonesia. http://fiskal.depkeu.go.id/pkppim/en/public/2000/studies/download/RE%20%26%20EE%20(Bahasa%20Inggris).pdf. Last access: 05 May 2017.
World Bank (2016): World Bank Database, Coal rents (% of GDP). World Bank Database. http://data.worldbank.org/indicator/NY.GDP.COAL.RT.ZS?name_desc=false. Last access: 01 June 2017.
World Bank (2017a): World Development Indicators. The World Bank Group.
World Bank (2017b): The political economy of energy subsidy reform. World Bank. http://elibrary.worldbank.org/doi/book/10.1596/978-1-4648-1007-7. Last access: 05 May 2017.
World Finance (2016): The truth about Indonesia’s relationship with King Coal. World Finance - the Voice of the Market. http://www.worldfinance.com/markets/the-truth-about-indonesias-relationship-with-king-coal. Last access: 02 March 2017.
WRI (2014): New Study Shows Indonesia Losing Primary Forest at Unprecedented Rates. World Resources Institute. http://www.wri.org/blog/2014/06/new-study-shows-indonesia-losing-primary-forest-unprecedented-rates. Last access: 03 February 2017.
WRM (2015): Mining activity kills Indonesia’s peasants and fisher people | WRM in English. WRM-World Rainforest Movement. http://wrm.org.uy/articles-from-the-wrm-bulletin/section1/mining-activity-kills-indonesias-peasants-and-fisher-people/. Last access: 24 February 2017.
Yale E360 (2015): Indonesian Coal Mining Boom Is Leaving Trail of Destruction. Yale Environment 360 - Yale School of Forestry & Environmental Studies. http://e360.yale.edu/features/indonesian_coal_mining_boom_is_leaving_trail_of_destruction. Last access: 01 February 2017.
Zed, F. (2015): Indonesia. Energy Efficiency and Conservation. Status, Gaps and Opportunities. Global Workshop to Accelerate Energy Eficiency, Copenhagen.
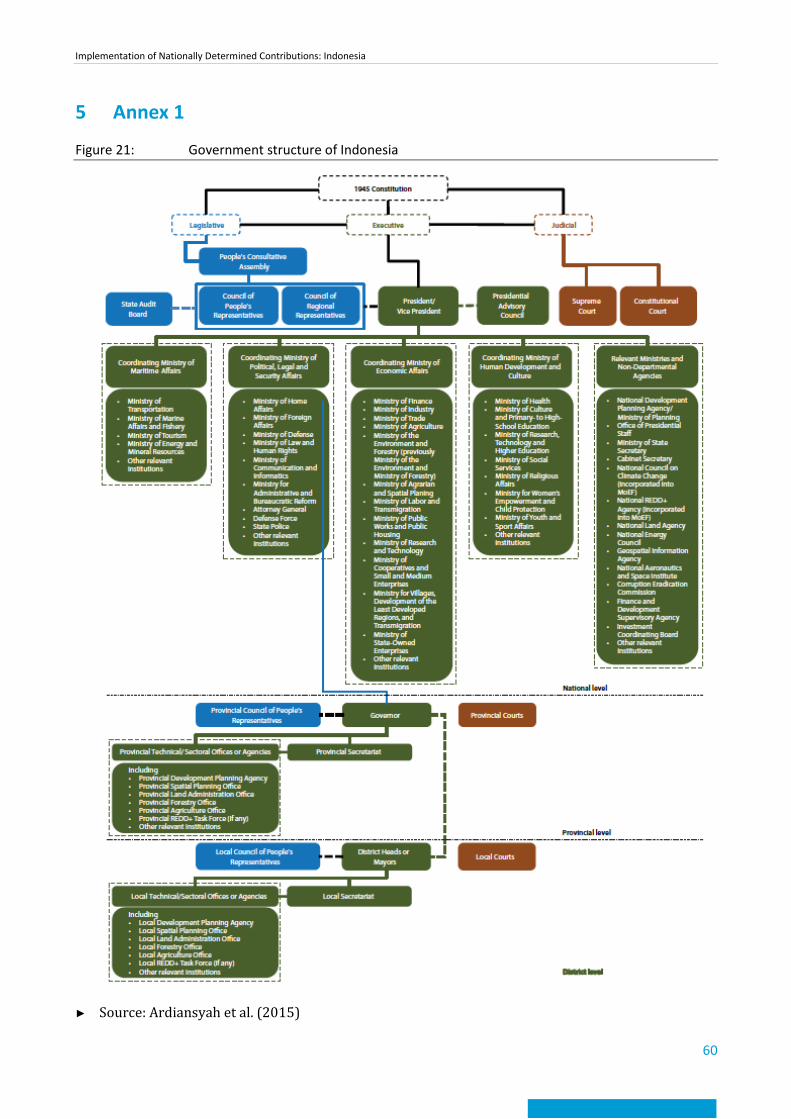
Implementation of Nationally Determined Contributions: Indonesia
60
5 Annex 1
Figure 21: Government structure of Indonesia
► Source: Ardiansyah et al. (2015)