Embed Size (px)
Citation preview

1 | 5
CTCN/SSFA/AIT/DTIE18-EN039/PCA/P1-33EUL-000116/SB-000900.0.35/USD68384
Deliverable 4: Workshop Report on
“Implementation of Nationally Determined Contributions
in Timor-Leste”
10-12 October 2018
Timor Plaza, Dili
Timor-Leste
This document has been produced with the financial assistance of the European Union. The views expressed herein can in no way be taken to reflect the official opinion of the European Union.

2 | 5
1. Background
The training workshop was carried out under the Climate Technology Centre and
Network (CTCN) initiative as an Incubator Programme for Timor-Leste. Through
the Incubator Programme, the CTCN offers support for Least Developed Countries
to implement the climate change actions included in their Nationally Determined
Contributions (NDCs). The programme offers a first step, through the development
of technology roadmaps, to deploy technologies that will enable countries reach
their adaptation and low carbon development targets.
CTCN consortium partner, the Asian Institute of Technology (AIT), conducted this
training workshop. The workshop sought to build capacities of Timor-Leste in
identifying two prioritized climate technologies (one each for mitigation and
adaptation), which would form the basis for the CTCN request for assistance.
2. Training Workshop Objectives and Structure
2.1 Objectives The broad objective of this training workshop was to support Timor-Leste in
achieving some of its NDC adaptation and mitigation targets through the
deployment of climate technologies.
The expected results and outcomes of the training workshop were to:
1. Identify at least two prioritized climate technologies (one each for mitigation
and adaptation) for wide-scale application in Timor-Leste.
2. Draft a CTCN request for assistance vis-à-vis Green Climate Fund
Readiness Proposal
2.2 Modality of the programme The training programme featured four types of sessions
1. Presentation
2. Group discussions
3. Group exercises
The agenda for the programme can be found in Annex A
2.3 Resource persons for the programme Three resource persons were engaged for the workshop:
1. Prof. Mukand S. Babel, Adaptation Expert, AIT, Thailand
2. Dr. Abdul Salam, Mitigation Expert, AIT, Thailand
3. Ms. Ranju Chapagain, Facilitator, AIT, Thailand
3 | 5
2.4 Participants
There were twenty two participants representing different ministries and
organizations in Timor-Leste. The participant list can be found in Annex B
3. Training Programme Sessions
Opening Session: 10 October 2018 Opening and welcome remarks were made by Mr. Luis Belo (National Directorate
for Climate Change, NDE Timor-Leste). Prof Mukand Babel, on behalf of CTCN,
briefly described the need for climate change adaptation and mitigation at a global
scale and how CTCN has been supporting countries to combat climate change. He
also talked about AIT’s involvement in CTCN activities over the past few years. Prof.
He presented the programme objectives, expected outcomes, and took the
participants through the agenda for the three days.
Session 1: NDC mitigation targets and initiatives taken to meet the targets
In this session, Dr. Abdul Salam introduced the participants to climate change
impacts in Timor-Leste. He revisited the NDCs of Timor-Leste and the mitigation
commitments made by the country. There was an active discussion on some of the
initiatives taken by Timor-Leste to meet these commitments, thus far.
Session 2: NDC adaptation targets and adaptation measures to build resilience to
climate change
In this session, Prof. Babel talked about the projected climate change scenarios for
Timor-Leste and highlighted its vulnerability to climate change. He summarized the
adaptation commitments made by Timor-Leste through its NDC. He also presented
a compendium of key adaptation projects envisaged in the NDCs and had a
discussion with the participants about the status of these projects.
Session 3: Ranking climate technologies to prioritize specific technology actions for
NDC implementation
Dr. Abdul Salam taught the participants how to identify and prioritize technologies
in this session. He went through the entire spectrum of activities― process
mapping, flow-charts, multi-criteria analysis, impact pathways―of different
technologies that are needed to arrive at the final product.
Session 4: Presentation on selected adaptation technology
In this session, Prof. Babel presented six different adaptation technologies based
on Timor Leste’s national priorities (which were identified from Timor-Leste’s NDCs
and National Adaptation Programme of Action). These are:
1. Flood risk mapping

4 | 5
2. Centralized database for water management
3. Rainwater harvesting
4. Ecosystem based adaptation
5. Managing mangrove plantations for coastal ecosystem protection
6. Physical infrastructure (sea walls, jetty etc.) to protect against sea level rise.
He provided a comprehensive description of the technologies; their benefits; their
relevance for Timor-Leste; financial implications for implementing each of the
technologies; potential barriers in implementation; and examples of countries that
had successfully implemented these technologies for climate change adaptation.
The participants were also shown some relevant videos related to the technologies.
Annex C has the brief descriptions of the adaptation technologies presented to the
stakeholders.
Session 5: Presentation on selected mitigation technology
In this session, Dr. Salam gave presentation of six different mitigation technologies,
which were identified from Timor-Leste’s NDCs. These are:
1. Biogas
2. Biomass thermal conversion
3. Landfill gas recovery
4. Wind energy
5. Solar PV system
6. Improved cook stoves
Similar to the previous session, he provided a comprehensive description of the
technologies; their benefits; their relevance for Timor-Leste; financial implications
for implementing each of the technologies; potential barriers in implementation; and
examples of countries that had successfully implemented these technologies for
climate change adaptation. The participants were also shown some relevant videos
related to the technologies.
Annex C has the brief descriptions of the adaptation technologies presented to the
stakeholders.
Session 6: Prioritizing the climate technologies
The participants were divided into four groups and were asked to discuss and come
forward with two adaptation and two mitigation technologies that they thought were
most important for Timor-Leste. After two rounds of discussions, participants
selected improved cook stoves, solar PV system and landfill gas recovery as the
prioritized mitigation technologies. Similarly, for adaptation they chose rainwater
harvesting, centralized database for water management, flood risk mapping and
managing mangrove plantations. For prioritizing one adaptation and one mitigation
technology, each of the participants were asked to rank the selected technologies.

5 | 5
The ranking of the technologies revealed that most of the participants considered
as improved cook stoves and rainwater harvesting as priority technology for climate
mitigation and adaptation respectively.
Session 7: Developing CTCN request (to comply with GCF readiness proposal)
In this session, Prof. Babel went through the CTCN request template, explaining
each element of the template and clarifying queries on those. After this, the
participants were divided into two groups, one each for adaptation and mitigation.
The groups were then invited to start filling in the various elements of the CTCN
request template.
Session 8: Developing CTCN request (with the support of AIT experts)
In this session, the two groups of participants continued to work on the CTCN
request template with the support and guidance from AIT experts.
The preparation of the draft CTCN request proceeded at a slow pace because of
two main reasons. First, most of the participants were even not aware about the
NDCs and NAPAs. Hence, it took a while for them to develop a contextual
understanding of the request. Second, all presentations and comments from the
trainers had to be interpreted into the local language.
4. Way Forward
On the final day of the workshop, it was agreed that draft of the CTCN TA request
for the selected adaptation and mitigation technologies will be sent to AIT Experts
by 19th October, 2018 so that they would review and guide them further on
necessary improvement.

Annex A: Programme Agenda

Date : 10-12th October 2018
Venue : Timor Plaza
Day 1: Wednesday, 10th October 2018
08:30 – 09:00 Registration
09:00 – 09:30
Opening Session
Master of Ceremonies/Facilitator: Ms. Ranju Chapagain (AIT) 1. Welcome address by National Designated Entity, Timor-Leste 2. Opening remarks by Asian Institute of Technology (AIT) 3. Introduction to Objectives and Expected Outputs (AIT) 4. Introduction of Participants
Time Topic Presenter
09:30 – 10:30
Introduction on the Nationally Determined Contribution Mitigation Targets and Identify Climate Mitigation Technologies
Dr. P. Abdul Salam Associate Professor, Department of Energy Environment and Climate Change, AIT, Thailand
10:30 – 11:00 Coffee Break
11:00 – 12:00
Introduction on the Nationally Determined Contribution Adaptation Targets and Identify Adaptation Measures to Build Resilience to Climate Change
Prof. M. S. Babel Professor, Civil and Infrastructure Engineering and Chair, Climate Change Asia @AIT. AIT, Thailand
12:00 – 12:30 Discussion / Questions and Answers
12:30 – 13:30 Lunch Break
13:30 – 15:00
Methodology for ranking of the Identified Climate Technologies and Measures to Prioritise Specific Technology Actions for NDC Implementation
Prof. M. S. Babel Dr. P. Abdul Salam, and Ms. Ranju Chapagain
15:00 – 15:30 Coffee Break
15:30 – 16:50
Presentation on selected technology (including video)
Mitigation (Dr. P. Abdul Salam) Adaptation (Prof. M.S. Babel)
Biogas Biomass thermal conversion Landfill gas recovery Wind Energy Solar PV system Improved Cookstoves (ICSs)
Flood risk mapping
Centralized database for
water management
Rainwater harvesting
Ecosystem based
adaptation
Managing mangrove
plantations for protect
coastal ecosystems from
impacts of sea level rise.
Physical infrastructure (sea
walls, jetty etc.) in
vulnerable areas to sea
level rise.
16:50 – 17:00 Wrap-up for Day-1
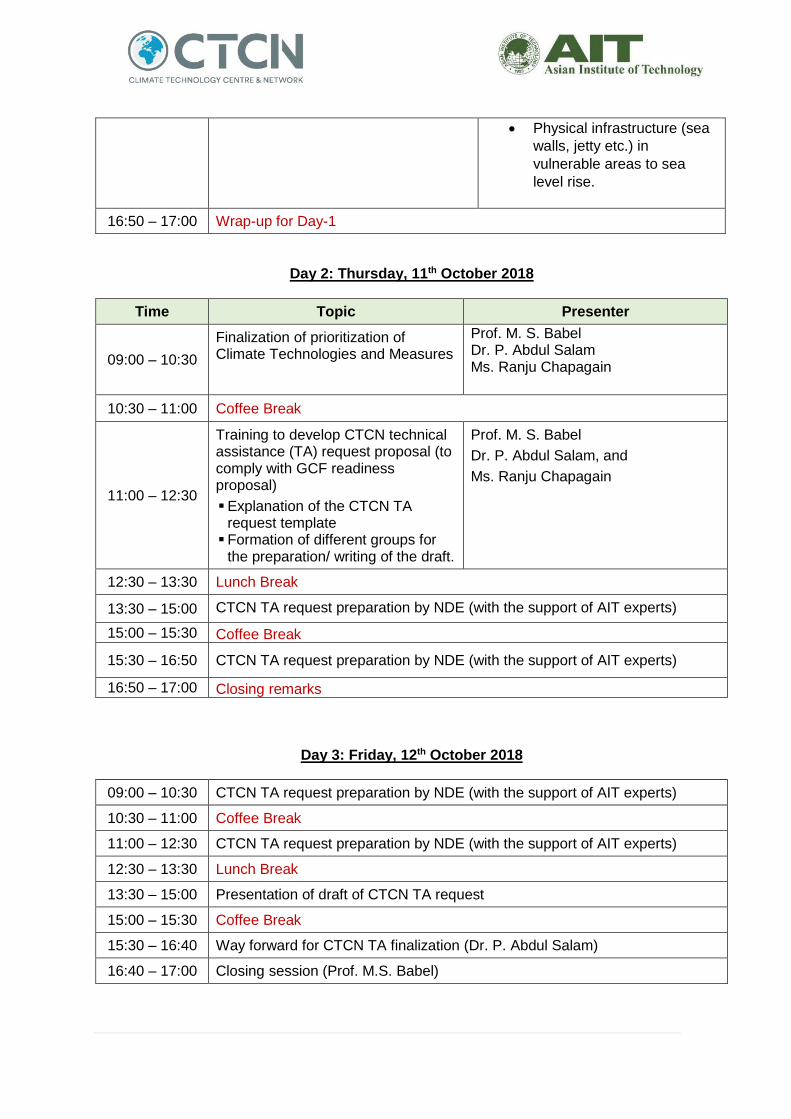
Day 2: Thursday, 11th October 2018
Time Topic Presenter
09:00 – 10:30
Finalization of prioritization of Climate Technologies and Measures
Prof. M. S. Babel Dr. P. Abdul Salam Ms. Ranju Chapagain
10:30 – 11:00 Coffee Break
11:00 – 12:30
Training to develop CTCN technical assistance (TA) request proposal (to comply with GCF readiness proposal)
Explanation of the CTCN TA request template
Formation of different groups for the preparation/ writing of the draft.
Prof. M. S. Babel
Dr. P. Abdul Salam, and
Ms. Ranju Chapagain
12:30 – 13:30 Lunch Break
13:30 – 15:00 CTCN TA request preparation by NDE (with the support of AIT experts)
15:00 – 15:30 Coffee Break
15:30 – 16:50 CTCN TA request preparation by NDE (with the support of AIT experts)
16:50 – 17:00 Closing remarks
Day 3: Friday, 12th October 2018
09:00 – 10:30 CTCN TA request preparation by NDE (with the support of AIT experts)
10:30 – 11:00 Coffee Break
11:00 – 12:30 CTCN TA request preparation by NDE (with the support of AIT experts)
12:30 – 13:30 Lunch Break
13:30 – 15:00 Presentation of draft of CTCN TA request
15:00 – 15:30 Coffee Break
15:30 – 16:40 Way forward for CTCN TA finalization (Dr. P. Abdul Salam)
16:40 – 17:00 Closing session (Prof. M.S. Babel)

Annex B: Participant List


Annex C: Adaptation Technologies

26-10-2018
1
Adaptation Technology 1: Flood
Risk Mapping
Flood Risk and Climate Change
Flood occurrence more in Asian countriesAverage annual precipitation expected to increase in most Asian countries
Flood Risk and Climate Change
Multi model median return period (years) in 2080s for 20th century 100 year flood. Once every 100 year flood may turn to once every 10-50 years (dark blue)
Flood risk in any system takes into account• The external factors that have a bearing on
floods
• The system’s ability to withstand floods
• Anticipated impacts of the floods
Flood Risk
Risk is a combination of probability and consequences.

26-10-2018
2
Flood hazard • State of the flood situation for a selected return period
• Physical and statistical aspects of the actual flooding
• Hazard maps - Spatial information on flood extent, flood depth, flood duration, and flood flow velocities
Flood vulnerability• Exposure of people and assets to floods
• Susceptibility of the elements at risk to suffer from flood damage
Flood risk = Flood hazard x Flood vulnerability
Since risk results from the interaction of hazard and vulnerability, a certain risk level can be reduced by decreasing Hazard, e.g. by an increase in water retention capacity of the catchment, Vulnerability, e.g. by the reduction of the assets in the flood plain (reduction of damage
potential), or by the installation of a flood warning system (reduction of susceptibility).
Flood risk assessment
Flood risk as interaction of hazard (exceedance probability and intensity) and vulnerability (exposure and susceptibility)
Hydrometeorological parameters (Runoff)
Identification of flood events (Duration of event, peak flows)
Probabilistic analysis (for various duration of events)
Probabilistic event flow input
Hydraulic inundation model (flood depth and extent)
GIS input (DEM, cross sections, Flood defences, river network)
Flood level (Calibration/validation)
Flood Hazard (Maps by probabilistic events)
Flood water level (Observed)
Methodology for generating Flood Hazard maps
Flood Vulnerability Index (FVI) = Exposure x Susceptibility
Resilience
Methodology for generating Flood Vulnerability maps
Factors Exposure Susceptibility Resilience
Social Population density (PD)Disabled people (% disable)Cultural heritage (CH)Population Growth (PG)
Child mortality (CM) Warning system (WS)Evacuation on roads (ER)Emergency services (ES)Shelters (S)Past experience (PE)Awareness and Preparedness (A/P
Economic Closeness to river (CR)Industries (IND)River Discharge (RD)Rainfall(Rainfall)Evaporation rate (EV)
Unemployment (UM)Urban growth (UG)Human Development Index (HDI)
Amount of Investment (Aminv)Flood insurance (FI)Dam Storage Capacity (D-SC)

26-10-2018
3
Factors Exposure Susceptibility Resilience
Environmental
Land use (LU)Contact with river (CR)Topography (T)Evaporation rate (EV)
Storage over yearly runoff (SC/Vyear)
Physical Rainfall (Rainfall) Dikes – Levees (D-L)
Methodology for generating Flood Vulnerability maps Example of Flood maps for SamdrupjhonkarMunicipality, Dungsamchhu Basin in Bhutan
Basic tool for Flood Management Plan
Structural measuresPrioritization of locations for construction of protection measures such as dikes,
dams, flood gates, pumping stations etc.
Cost benefit analysis of infrastructure
Prioritization of measures for natural flood risk management – Green infrastructure (river and flood plain restoration)
Applications of Flood risk maps
Non-structural measures Planning measures
• Spatial planning and control of development (avoidance)• Asset system management (defenses, flood storage areas, managing the pathways of
rivers, estuaries and coasts)• Evacuation plans• Recovery (insurance, local authorities, re-construction)
Preventive and preparatory measures• Flood forecasting and early warning and alert systems• Flood incident management and response (flood warning, actions of emergency
services, healthcare providers and flood risk management authorities, public, community support organizations)
• Monitoring of flood protection infrastructure• Input for real time monitoring and analysis of flood events• Awareness and capacity building
Applications of Flood risk maps

26-10-2018
4
• Natural and Human induced Disasters
• Water availability, Accessibility and Quality
• Freshwater ecosystems
• Agriculture, Agroforestry and Food Security
• Human settlement and Infrastructure
Applicable to the following sectors in NAPA
Adaptation Technology 2: Centralized Database For Water Management
A single database for comprehensive, authoritative and consistent data& information of water resources in a standardized framework forplanning, development and management of water resources.
The centralized database allows effective storage, management andretrieval of data
Centralized database for water management

26-10-2018
5
• Multiple institutions dealing with water management, most of them collecting same data• Meteorological data collected by Water Resources Dept., Agriculture Dept.,
Meteorology Dept. etc.
• Water quality data by Health Dept, Environment Dept. etc.
• Waste of time and resources
• Stored in different formats
• Compartmentalized management of water resources
Why a Centralized database?
• Basic monitoring system to generate information related to the variability of available water resources as well as water demand development and water use
• Provides tools and methodologies focusing on: data quality management, development and use of different models, review of data availability and quality
• Provide easier and faster access and sharing of consistent and authentic water resources data all water resources departments, organizations, professionals and other stake holders for IWRM
• Increases knowledge on environmental conditions in the basin
Centralized database
Role of Centralized database
Centralized Database
High quality water
information
Data supplied by different
organizations
Data supplied by
different organizations
Quality check and
standardize data
Organize data within
the geofabric
Analyze, interpret
and integrate
data
Data
Reports
Forecasts
Key Components
Key components include a distributed network of HydroServers sharing data that have been cataloged at HIS Central and which are retrievable through desktop (CUAHSI HydroDesktop)

26-10-2018
6
• Different software using same data can share information
• Most recent data (changes to the system) is available to all
• Multiple users able to access and modify data at the same time
• Reducing the cost of gathering data
• Unified data format
Centralized Database - Advantages
• Database volume may be too large to hold all the data
• Higher demand for hardware and database software
• Substantial maintenance – database administration, hardware and software programmes, internet connection
• Huge database updating work – manpower, time
Centralized Database - Limitations
Smart Water Operations Center, Thailand Water Resources Information System (WRIS, India)
Key elementsi. Data input/entry/
collection systemii. Data storage, analysis, and
transformation into ‘user friendly’ information
iii. Interactive system for geo-visualization and temporal analysis and Information dissemination system in public domain as downloads and further processing tools

26-10-2018
7
India - WRIS
Adaptation Technology 3: RAINWATER HARVESTING
• Rain water harvesting is a technique of collection and storage of rainwater into natural reservoirs or tanks, or the infiltration of surface water into subsurface aquifers, before it is lost as surface runoff.
• Rainwater harvesting can be undertaken through a variety of ways:
• capturing run-off from roof tops
• capturing run-off from local catchments
• capturing seasonal floodwater fromlocal streams
• conserving water through watershedmanagement
What is rain water harvesting?
Rainwater harvesting systems and uses

26-10-2018
8
Rainwater harvesting is a simple but effective
technology for climate change adaptation. It
can serve the following functions:
• Provide water to people and livestock
• Provide water for food and cash crops
• Increase groundwater recharge
• Reduce storm water discharges, urbanfloods and overloading of sewagetreatment plants
• Reduce saltwater intrusion in coastal areas
How does rainwater harvesting help?
Source: unknown
Equipment needed for rainwater harvesting
Filters
Plastic sheets are very effective catchment surfaces Source: ENPHO n.y.
Roof catchment systems
Equipment needed for rainwater harvesting
Ground & rock catchment systemsGround & rock catchment systems consist of:
• a collection surface,
• a storage tank, and
• guttering or channels
Ground catchment system (Source: UNEP IETC, 1998).
Rock catchment (Source: UNEP IETC, 1998)
• Both NDCs and NAPA have proposed creating and enhancing waterharvesting model, water distribution system and management systemat all levels to avoid water shortages due to climate change for thewater sector
• European Union has supported the construction of five rainwaterharvesting tanks to the communities of Luro in Lautem municipality,Timor-Leste. The tanks, made of ferro-cement can hold 10,000 liters ofrain and spring water and provides water to 15-20 householdmembers for group-managed horticulture activities.
• Seven more tanks are due for construction in seven other aldeias(sub-villages).
Relevance of rainwater harvesting for Timor-Leste

26-10-2018
9
• Depends on the type of catchment, conveyance and storage tank materialsused but in general the costs of rainwater harvesting systems is considered tobe low.
• In Burundi, a four-year project to install pilot rainwater harvesting units andtrain local technicians in their use totaled $100,000 (UNFCC, 2008)
• In Bhutan, a three-year rainwater harvesting project aimed at safeguardingfarmers from water shortages during dry periods and irregularities in themonsoon rainfall had a total budget of $850,000 (UNFCC, 2008)
• The provision of the storage tank is the most costly element, and usuallyrepresents about 90 per cent of the total cost (WaterAid)
• A review of 311 case studies on watershed programmes in India, withrainwater harvesting and rainwater management as important components,found that the mean cost-benefit ratio of such watershed programmes wasrelatively high at 1:2.14 (Joshi et al. 2005).
Financial requirements and costs
• Can be a stable source of water supply for households andcommunities, reducing the pressure on public water supply systems.
• Access to a convenient supply of stored rainwater can decrease traveltime to remote water sources, increase agricultural productivity andreduce depletion of groundwater resources.
• Can help increase the water allocation for agriculture. Increasing theavailability of irrigation water during the dry season and even duringshort dry spells has been shown to yield large increases in agriculturalproduction.
Benefits of scaling up rainwater harvesting
Examples of countries supporting rainwater harvesting as a sustainable development tool
The Under Water for the Future initiative, the Australiangovernment launched the National Rainwater and Greywater Initiative, which offered generous rebates to people who installed new rainwater harvesting systems or greywater systems. Up to $500 was available for households that installed rainwater collection systems, and up to $10,000 was available for surf life clubs that undertook a large water saving project or installed a rainwater harvesting system.
A great example of the German government’s support towards rainwater harvesting practices is in the construction of the “Postdamer Platz” in Berlin. The permit granted by the council was subjected to meeting very strict stormwatermanagement regulations, which ensured that the construction of this project did not overload the combined sewerage system. The new complex was required to discharge no more than 1% rainwater to sewerage. To comply with the regulation, all 19 buildings were constructed using green roofs and the collected roof-runoff is used for toilet flushing and irrigation. An artificial lake was also constructed to provide a means to retain water and allow it to evaporate. Rooftop runoff is collected in three cisterns of 2550 cube meters of capacity, which corresponds to 12% of the annual precipitation
Following a drought in 1995, the provincial government of Gansu (China), commissioned a rainwater harvesting and reuse project called “121-Project”. This project’s name makes reference to its goal: every family should have at least two rainwater collection cisterns for every one acre of agricultural land. Within a year of the project’s implementation, 1.31 million people had benefited from access to water for domestic use

26-10-2018
10
Adaptation Technology 4: ECOSYSTEM BASED ADAPTATION
Ecosystem-based Adaptation (EbA) is a nature-based solution that harnesses biodiversity and ecosystem services to reduce vulnerability and build resilience to climate change.
What is Ecosystem-based Adaptation (EbA)?
Ecosystem-based Adaptation (EbA) involves the conservation, sustainable management and restoration of ecosystems, which can help people adapt to the impacts of climate change
(Locatelli 2011)
How does EbA help?• It helps move away from hard engineering
measures and rely more on natural solutions.
• It not only delivers climate change adaptation benefits, but also contributes to biodiversity conservation and to enhancing local economies.
• In many cases nature based solutions provide more economic benefits than engineering solutions in the long run, especially when co-benefits are considered
• It leads to a situation where humankind respecting nature.
Photo: Ecosystem-based Adaptation conceptualised in the Driving Forces-Pressures-State-Impacts-Responses (DPSIR) framework.Source: IUCN
Water Management Ecosystem-based Adaptation measures
Retention and Detention Ponds
Surface Watershed, Groundwater Basin, and the Plain in DiliSource: Pinto & Shrestha, 2016
Sedimentation PondsSource: McAndrew et al., 2016
EbA measures for water: Basins and ponds, Elimination of riverbank protection, Floodplain restoration and management, Wetland restoration and management, retention ponds, Rehabilitation and restoration of river, using green spaces, ecological river restoration, etc.

26-10-2018
11
Water management issue (Primary service to be
provided)
Green Infrastructure solution
LocationCorresponding
Grey Infrastructure solution (at the
primary service level)W
ate
rshed
Flo
odpla
in
Urb
an
Coasta
l
Water supply regulation (including drought mitigation)
Re/afforestation and forest conservation
Dams andgroundwater pumping
Water distribution
systems
Reconnecting rivers to floodplains
Wetlands restoration/conservation
Constructing wetlands
Water harvesting*
Green spaces (bio-retention and infiltration)
Permeable pavements*
* Consists of “grey” elements 41
Water Management EbA measures
Water management issue (Primary service to be
provided)
Green Infrastructure solution
Location
Corresponding Grey Infrastructure
solution (at the
primary service level)W
ate
rshed
Flo
odpla
in
Urb
an
Coasta
l
Waterqualityregulation
Waterpurification
Re/afforestation and forest conservation
Water treatment plant
Riparian buffers
Reconnecting rivers to floodplains
Wetlands restoration/conservation
Constructing wetlands
Green spaces (bio-retention and infiltration)
Permeable pavements*
* Consists of “grey” elements 42
Water Management EbA measures
Water management issue (Primary service
to be provided)Green Infrastructure solution
Location Corresponding Grey Infrastructure solution (at the primary service
level)
Wa
ters
he
d
Flo
od
pla
in
Urb
an
Co
asta
l
Waterqualityregulation
Erosioncontrol
Re/afforestation and forest conservation
Reinforcement of slopes
Riparian buffers
Reconnecting rivers to floodplains
Biologicalcontrol
Re/afforestation and forest conservation
Water treatment plant
Riparian buffers
Reconnecting rivers to floodplains
Wetlands restoration/conservation
Constructing wetlands43
Water Management EbA measures
Water management issue (Primary service to be
provided)Green Infrastructure solution
Location Corresponding Grey
Infrastructure
solution (at the primary service
level)Wate
rshed
Flo
odpla
in
Urb
an
Coasta
l
Water qualityregulation
Watertemperaturecontrol
Re/afforestation and forest conservation
Dams
Riparian buffers
Reconnecting rivers to floodplains
Wetlands restoration/conservation
Constructing wetlands
Green spaces (shading of water ways)
44
Water Management EbA measures

26-10-2018
12
Water management issue (Primary service
to be provided)Green Infrastructure solution
Location Corresponding Grey
Infrastructure
solution (at the primary service
level)Wate
rshed
Flo
odpla
in
Urb
an
Coasta
l
Moderation
of extremeevents
(floods)
Riverine flood control
Re/afforestation and forest conservation
Dams and levees
Riparian buffers
Reconnecting rivers to floodplains
Wetlands restoration/conservation
Constructing wetlands
Establishing flood bypasses45
Water Management EbA measures
Water management issue (Primary service
to be provided)Green Infrastructure solution
Location Corresponding Grey
Infrastructure
solution (at the primary service
level)Wate
rshed
Flo
odpla
in
Urb
an
Coasta
l
Moderation
of extremeevents
(floods)
Urbanstorm waterrunoff
Green roofs
Urban storm water infrastructure
Green spaces (bio-retention and infiltration)
Water harvesting*
Permeable pavements*
Coastal flood(storm)
control
Protecting/restoring mangroves,coastal marshes and dunes
Sea walls
Protecting/restoring reefs (coral/oyster)
* Consists of “grey” elements 46
Water Management EbA measures
• NAPA proposes building climate consideration and environmentfriendly infrastructure to protect water resources in order to providesafe water supply during climate change extreme event periods(Floods, droughts etc.)
• Ecosystem-Based Climate Adaptation has already been applied inTimor-Leste under the Coral Triangle Support Partnership
Relevance of EbA for Timor-Leste Benefits of scaling up EbA
26-10-2018
13
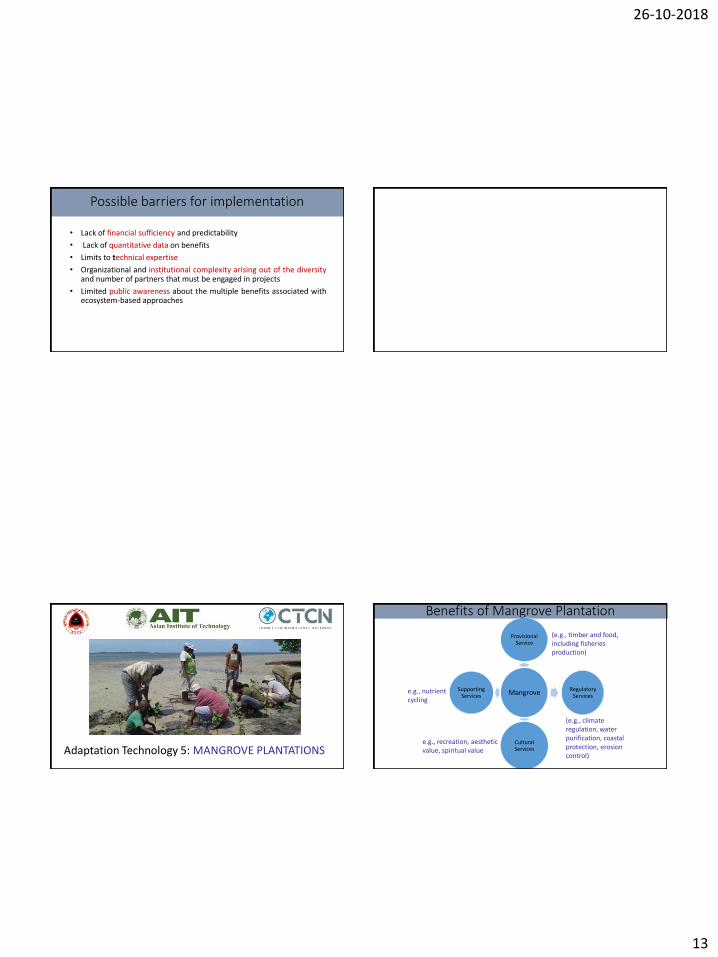
• Lack of financial sufficiency and predictability
• Lack of quantitative data on benefits
• Limits to technical expertise
• Organizational and institutional complexity arising out of the diversityand number of partners that must be engaged in projects
• Limited public awareness about the multiple benefits associated withecosystem-based approaches
Possible barriers for implementation
Adaptation Technology 5: MANGROVE PLANTATIONS
Benefits of Mangrove Plantation
Mangrove
Provisional Service
Regulatory Services
Cultural Services
Supporting Services
(e.g., timber and food, including fisheries production)
(e.g., climate regulation, water purification, coastal protection, erosion control)
e.g., recreation, aesthetic value, spiritual value
e.g., nutrient cycling
26-10-2018
14
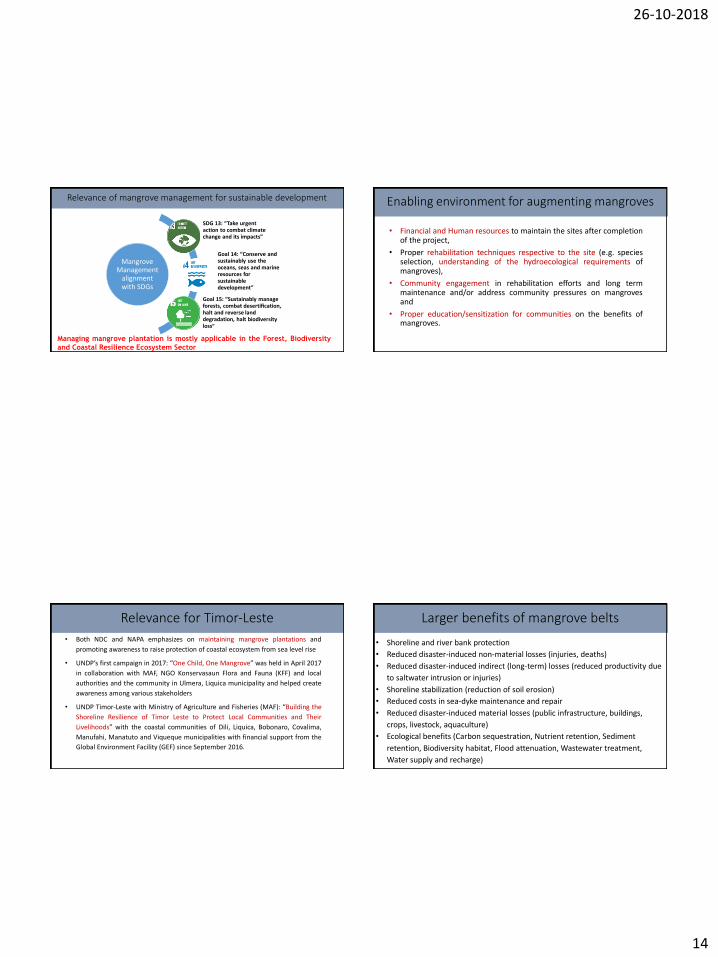
Relevance of mangrove management for sustainable development
Managing mangrove plantation is mostly applicable in the Forest, Biodiversity
and Coastal Resilience Ecosystem Sector
Mangrove Management
alignment with SDGs
SDG 13: “Take urgent action to combat climate change and its impacts”
Goal 14: “Conserve and sustainably use the oceans, seas and marine resources for sustainable development”
Goal 15: “Sustainably manage forests, combat desertification, halt and reverse land degradation, halt biodiversity loss”
Enabling environment for augmenting mangroves
• Financial and Human resources to maintain the sites after completionof the project,
• Proper rehabilitation techniques respective to the site (e.g. speciesselection, understanding of the hydroecological requirements ofmangroves),
• Community engagement in rehabilitation efforts and long termmaintenance and/or address community pressures on mangrovesand
• Proper education/sensitization for communities on the benefits ofmangroves.
• Both NDC and NAPA emphasizes on maintaining mangrove plantations and
promoting awareness to raise protection of coastal ecosystem from sea level rise
• UNDP’s first campaign in 2017: “One Child, One Mangrove” was held in April 2017
in collaboration with MAF, NGO Konservasaun Flora and Fauna (KFF) and local
authorities and the community in Ulmera, Liquica municipality and helped create
awareness among various stakeholders
• UNDP Timor-Leste with Ministry of Agriculture and Fisheries (MAF): “Building the
Shoreline Resilience of Timor Leste to Protect Local Communities and Their
Livelihoods” with the coastal communities of Dili, Liquica, Bobonaro, Covalima,
Manufahi, Manatuto and Viqueque municipalities with financial support from the
Global Environment Facility (GEF) since September 2016.
Relevance for Timor-Leste Larger benefits of mangrove belts
• Shoreline and river bank protection
• Reduced disaster-induced non-material losses (injuries, deaths)
• Reduced disaster-induced indirect (long-term) losses (reduced productivity due
to saltwater intrusion or injuries)
• Shoreline stabilization (reduction of soil erosion)
• Reduced costs in sea-dyke maintenance and repair
• Reduced disaster-induced material losses (public infrastructure, buildings,
crops, livestock, aquaculture)
• Ecological benefits (Carbon sequestration, Nutrient retention, Sediment
retention, Biodiversity habitat, Flood attenuation, Wastewater treatment,
Water supply and recharge)

26-10-2018
15
• Maintenance of mangroves areas has been a challenge for MAF, with related
public resource allocations remaining too low to undertake enforcement at the
national to municipal level.
• There are at least seven identified mangrove species in Timor-Leste, and habitat
requirements are specific for each. Effective rehabilitation is complex as it requires
an approach tailored to the location, both from a technical and social perspective.
• Previous rehabilitation efforts have largely failed due to
a) lack of financial and human resources
b) incorrect rehabilitation techniques respective to the site
c) failure to adequately engage communities in rehabilitation efforts
d) ineffective or inadequate education/sensitization for communities on the
benefits of mangroves.
Barriers for implementation Example from VietnamUSD 8.88 million (for 17 years)
creation of 9,462ha of forest (8,961 of them mangroves) in 166 communes and the
protection of approximately 100km of dyke lines.
Direct beneficiaries: 350,000 beneficiaries
Indirect beneficiaries: 2 million
Comparing damage to dykes caused by similar typhoon: Reduction by USD 80,000 to USD 295,000
Total savings due to avoided risks in the communities: approximately USD 15 million
Example from Managing Mangrove Plantation in Vietnam
Cost
Investment to Creation:
Beneficiaries
Comparison before and after intervention
Savings
Adaptation Technology 6: PHYSICAL INFRASTRUCTURE (E.G. SEAWALLS)

26-10-2018
16
• Built parallel to the shore to prevent erosion of the shoreline, while providing protection from wave action
• Though, main function of sea walls is to reduce erosion, they also serve in coastal flood defenses.
• Physical infrastructure such as sea wall makes a defining boundary between sea and land.
• The physical infrastructure, also referred as revetments, may have different forms (vertical or sloping) and constructed from a wide variety of materials.
• Seawalls may be of different types such as steel sheet pile walls, monolithic concrete barriers, rubble mound structures, brick or block walls or gabions
Physical Infrastructure (e.g. Sea walls) Benefits of sea walls
• Besides acting as a boundary,seawalls also provide coastal floodprotection against extreme waterlevels.
• When seawalls are considered from climate change adaptation pointof view, another benefit of seawalls is that with increase in sea levelrise, it is possible to gradually increase the structure height andupdate them.
Equipment required for constructing sea walls
• No single material is perfect for every seawall.
• Various factors such as - Location & Accessibility, Size of the Seawall, weather condition, marine condition and budget will determine the material required for seawall construction.
• Some common materials used are:
1) Metal
2) Concrete
3) Vinyl and Composites
• One-third of land in Timor-Leste is at high risk of erosion and approximatelyhalf of the land are at risk of infertility and degradation (NDCs).
• The sea level rise (SLR) in Timor-Leste is estimated to be 5.5 mm/year and ifthis rate is linearly consistent in future as well, the sea level is projected torise by 50mm at end of this century.
• Climate resilient infrastructure such as seawall, is also a priority adaptationmeasure proposed in the NDC and NAPA of Timor-Leste.
• The main advantage of constructing a seawall in the coastal areas of Timor-Leste will be that it will provide high degree of protection against erosionand coastal erosion.
• Seawall, maintained and designed appropriately, will also fix the linebetween the sea and land to ensure no further erosion will occur.
Relevance of Technology for Timor-Leste

26-10-2018
17
Financial implications of sea walls
• Seawall construction has high construction and implementation cost.
• Unit cost of constructing 1 km of vertical seawall is in the range of US$0.4 Million to 27.5 Million (Linham et al.2010) .
• Variation in costs between projects is a result of numerous factors, such as: design height, construction materials, availability of technical experts, etc.
• Maintenance costs are another significant and ongoing expense when a hard defense is selected. These costs are ongoing for the life of the structure.
Barriers for implementation
• Expensive: The design of an effective seawall requires good quality, long-term environmental data such as wave heights and extreme sea levels. This is frequently unavailable in developing countries and can be costly to collect.
• In locations of high energy waves, additional cost must be expended on protective measures such as rip-rap to protect the structure’s toe.
• The availability of experience, materials, labour and specialisedmachinery for the construction of seawalls may also pose a barrier to the implementation of this technology.
Examples of sea wall implementation

Annex D: Mitigation Technologies

26-10-2018
1
1
Anaerobic Digestion (AD) for Biogas and Bio-fertilizer Production
Dr. P. Abdul Salam, PhDDepartment of Energy, Environment and Climate Change
Asian Institute of Technology (AIT), [email protected]
Incubator Training Workshop for Implementation of Nationally Determined Contributions in Timor-Leste
10- 12th October 20182
Presentation Outline
Anaerobic digestion (AD) technology
Scope of biogas generation in Timor-Leste
Types of Biogas plants
Biogas for rural development
Q & A
3
A Typical Biogas System in Rural Households
Source: Milićević et al. (2012) 4
Anaerobic Digestion (AD) for Biogas Production
AD is the process of bacterial breakdown of organic fraction of biomass in absence of air during which a gaseous fuel which is termed as biogas is generated.
The raw material goes for AD is know as “substrate”.
The process involves bringing certain bacteria (micro-organisms) in contact with suitable biomass inside a reactor in the absence of oxygen.
Energy value of biogas: 21 MJ/m3
Typical Composition of Biogas
Methane (CH4) 50-75 %
Carbon Dioxide (CO2) 25-50 %
Hydrogen (H) 5 -10 %
Nitrogen (N2) 1 -2 %
Hydrogen sulphide (H2S) Traces
GHG savings potential: 4 tCO2eq/year for
standard biogas plant of 2m3
replacing unsustainable wood use

26-10-2018
2
5
Possible Feedstocks for Biogas Production through AD
Agricultural origino Livestock manureo Agricultural residues (e. g., rice straw, wheat straw etc.)o Aquatic plants (e.g. algae and water hyacinth etc.)o Energy crops (e. g., Napier grass, elephant grass etc.)
Municipal origino Sewage sludgeo Municipal solid waste (landfilling option)o Food residuals (e. g., cooked food, rotten vegetables &
fruits etc.)
Industrial origino Wastewatero Industrial sludge & by-productso Slaughterhouse wasteo Spent beverageso Bio-solids
6
Benefits for the society/farmers/environment
o Improves clean energy access
o Reduces dependency on imported fossil fuels & household energy expenditures
o Can earn carbon credits as an additional income source
o Creates green job opportunities & improve livelihoods
o Reduces waste disposal problems
o Digestate is an excellent fertilizer, reduces cost of crop production & increases crop yield.
o Reduced odors, flies & improves veterinary safety
o Low-cost, easy construction, operation & maintenance, & long lifespan.
o Production of a gaseous fuel for cooking reduces fuelwood consumption which has the potential to combat against deforestation & soil depletion, & mitigate GHG emissions.
Benefits of Biogas Production
7
Biogas Potential in Timor-Leste
Potential feedstockso Agricultural residues: about 63% people are involved in crop
productiono Livestock manure: about 23% households possess beef cattle
Initiatives taken by the government: About 30 biogas projects were launched in 2010 aiming to
o Enhance rural electrificationo Reduce dependency on imported fuel o Drive local economy
A biogas system of 84m3
capacity is installed in the Beco suco, Suai sub-district.
Source: http://timor-leste.gov.tl/?p=3862&lang=en 8
Types of Biogas Plants
The choice of a particular design depends on the technical, climatic, geographical and economic factors of a particular location.
The size of the digester depends on the availability of feedstock/substrates and the quantity of gas to be produced.
There are many different designs of biogas plant available. They vary from very simple designs to large sophisticated systems equipped with automatic heating and stirring mechanism.
Some digesters operate on a “batch” basis, which means they are filled once, & then produce gas until all the feedstock has been used up.
The availability of substrates is the main factor for continuous flow anaerobic digestion.

26-10-2018
3
9
Example: Floating Drum Digester (Indian design)
10
Example: Advantages of Floating Drum Digester
Advantages of floating drum gas holder-type:
Release of gas is at almost constant pressure. This pressure can be changed by putting weights on the over.
Construction of digester and fabrication of gas holder relatively easy.
Locating of defect in the gas holder and repairing are easy.
In areas having a high water table, horizontal plants could be installed.
Easy to control scum formation (the moving cover can be rotated to break up surface scum). And also steel drum usually contains stirrer bars.
11
Example: Disadvantages of Floating Drum Digester
Disadvantages of floating drum gas holder-type:
Investment cost is high. Steel gas holder needs to be replaced
after 5 -8 years due to corrosion.
Floating gas holder made of mild steel alone accounts for
some 40% of the total plant cost and accordingly these plants
are much more expansive than fixed dome type.
Effect of low temperature during winter is more.
It is suitable for processing of dung and night-soil slurry.
Other organic materials will clog the inlet pipe.
12
Example: Fixed Dome Digester (Chinese design)
26-10-2018
4
13
Example: Advantages of Fixed Dome Digester
Capital investment in the corresponding size of biogas unit is
low. Steel gas holder is not required
As there is no moving part, the maintenance cost is minimized
Life span of the unit is comparatively more.
As the unit is underground structure, the space above the
plant can be used for other purposes
Effect of low temperatures is less.
It can be easily adapted/modified for use of the materials
along with dung slurry.
14
Example: Disadvantages of Fixed Dome Digester
Gas released at a variable pressure which may cause slight
reduction in the efficiency of gas appliances. A gas pressure
regulator is needed for using the gas in a diesel engine.
Construction of the dome portion of the unit is a skilled job
and requires thorough training of masons.
Locating the defects in the domes and repairing them are
difficult.
Construction of the plant is difficult in high water-table areas.
Difficult to clean, as access is through a small opening in the
slurry outlet or in the roof of the dome.
15
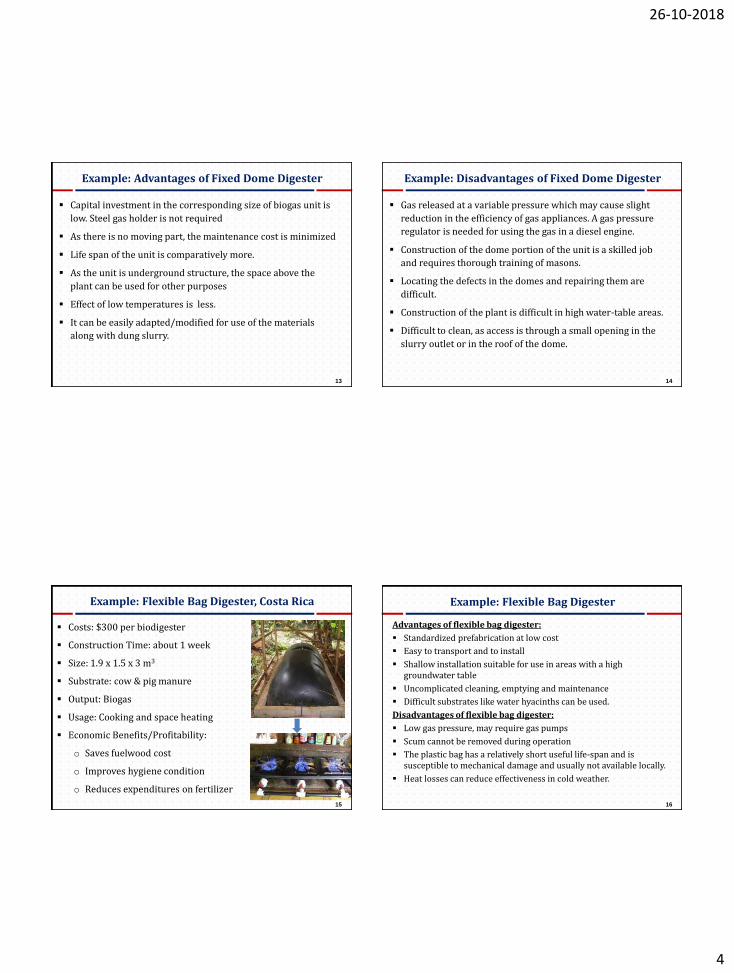
Example: Flexible Bag Digester, Costa Rica
Costs: $300 per biodigester
Construction Time: about 1 week
Size: 1.9 x 1.5 x 3 m3
Substrate: cow & pig manure
Output: Biogas
Usage: Cooking and space heating
Economic Benefits/Profitability:
o Saves fuelwood cost
o Improves hygiene condition
o Reduces expenditures on fertilizer
16
Example: Flexible Bag Digester
Advantages of flexible bag digester:
Standardized prefabrication at low cost
Easy to transport and to install
Shallow installation suitable for use in areas with a high groundwater table
Uncomplicated cleaning, emptying and maintenance
Difficult substrates like water hyacinths can be used.
Disadvantages of flexible bag digester:
Low gas pressure, may require gas pumps
Scum cannot be removed during operation
The plastic bag has a relatively short useful life-span and is susceptible to mechanical damage and usually not available locally.
Heat losses can reduce effectiveness in cold weather.
26-10-2018
5
17
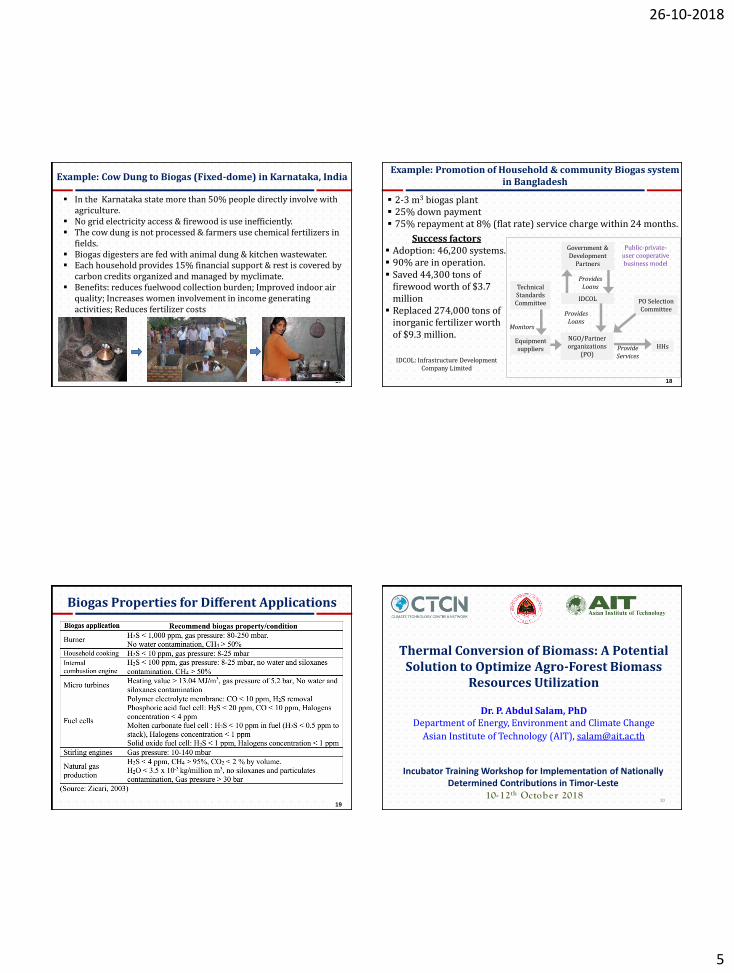
Example: Cow Dung to Biogas (Fixed-dome) in Karnataka, India
In the Karnataka state more than 50% people directly involve with agriculture.
No grid electricity access & firewood is use inefficiently. The cow dung is not processed & farmers use chemical fertilizers in
fields. Biogas digesters are fed with animal dung & kitchen wastewater. Each household provides 15% financial support & rest is covered by
carbon credits organized and managed by myclimate. Benefits: reduces fuelwood collection burden; Improved indoor air
quality; Increases women involvement in income generating activities; Reduces fertilizer costs
18
Example: Promotion of Household & community Biogas system in Bangladesh
2-3 m3 biogas plant 25% down payment 75% repayment at 8% (flat rate) service charge within 24 months.
Success factors Adoption: 46,200 systems. 90% are in operation. Saved 44,300 tons of
firewood worth of $3.7 million
Replaced 274,000 tons of inorganic fertilizer worth of $9.3 million.
Government &Development
Partners
IDCOL
Technical StandardsCommittee
Monitors
Equipment suppliers
NGO/Partner organizations
(PO)
PO SelectionCommittee
HHsProvide Services
ProvidesLoans
ProvidesLoans
Public-private-user cooperative business model
IDCOL: Infrastructure Development Company Limited
19
Biogas Properties for Different Applications
20
Thermal Conversion of Biomass: A Potential Solution to Optimize Agro-Forest Biomass
Resources Utilization
Dr. P. Abdul Salam, PhDDepartment of Energy, Environment and Climate Change
Asian Institute of Technology (AIT), [email protected]
Incubator Training Workshop for Implementation of Nationally Determined Contributions in Timor-Leste
10- 12th October 2018

26-10-2018
6
21
Presentation Outline
Biomass thermal energy conversion technology
Scope of biomass resource utilization in Timor-Leste
Biomass combustion
Biomass gasification
Biomass pyrolysis
Q & A
22
Thermal Energy Conversion Technologies
Combustion
o Direct burning of biomass resources for heat & electricity generation
Gasification
o It is a process of converting solid biomass resources into gaseous products which is known as syngas or producer gas or product gas.
o The produced gas is combusted for heat & electricity generation.
Pyrolysis
o It is the process of heating biomass resources at different temperature & different heating rate in absence of oxygen for the production of charcoal, bio-oil and combustible gas.
23
Pathways of Biomass Thermal Energy Conversion
24
Scope of Biomass Thermal Conversion in Timor-Leste
Over 63% of total population are engaged in crop production such as rice, coffee, mango, guava, peanut, maize, and other rainfed crops and vegetables.
Residues of these crops, plants and vegetables can be used for thermal conversion to produce energy
For thermal conversion of biomass, choosing an appropriate technology will be the main challenge.
Therefore, extensive research needs to be conducted to identify different agro-forest resources, assess potential availability, and compositional analysis to identify and promote suitable thermal biomass conversion technology

26-10-2018
7
25
Biomass Combustion
Domestic biomass Combustion
In stoves for cooking & space heating
Industrial/Commercial biomass combustion
Traditional/rural industrial systems
Modern industrial systems
New developments
o Pressurized combustion
o Whole tree energy system
o Co-firing
o Condensate heat recovery system
Industrial/commercial applications
Heat applications
Electricity generation
Cogeneration26
Traditional/rural biomass Combustion
In the developing countries, significant amounts of biomass, mostly in the form of fuelwood are consumed annually in a variety of traditional/rural industries.
These include:
1. Agro-processing industries, e.g. cocoa, coconut products, rice parboiling, rubber sheet drying, spice processing, sugar, tea leaf processing, tobacco leaf curing etc.,
2. Food processing industries, e.g. bakeries, dairy products, distilleries, fish smoking etc.,
3. Forest products industries, e.g. extraction/ distillation, paper making, timber drying etc.,
4. Metal working industries, e.g. black smithy, foundries etc.,
5. Mineral based industries, e.g. brick making, lime burning, potteries etc.,
6. Textile based industries etc. .
27
Biomass Combustion System
Biomass combustion
Biomass feedstock
Air/OxygenHeat, CO2, CO, H2O, H2, O2, NOx, SOx,
PM, PAH & Ash Combustion
agent Combustion chamber
Final products, Reduce red colored element is the target
Classification of biomass combustion system
Type Small scale Medium scale Large scale Co-firing
Capacity range <100kWth 100 kWth to 10 MWth > 10 MWth ~ 100 MWth
Applications of biomass combustion product
Steam generation
CHP generation
Process heating & Cooling
District heating
Drying
Type of fuels used
Briquettes & pellets
Agricultural field & processed residue
Refuse-derived fuel (RDF) or solid recovered fuel / specified recovered
fuel (SRF)28
Example of Biomass Co-generation
Owner/Developer : Phu Khieo Bio-Energy Co., Ltd.
Major Shareholders : United Farmers & Industry Co., Ltd.; Others
Location : Phu Khieo, Chaiyapum, Thailand
Total Capacity : 41 MW cogeneration
Fuel : Bagasse, cane leaves, wood bark and rice husk
Major Off-takers : EGAT (SPP, 21 years, firm contract) United Farmer & industry Co., Ltd. (steam + power)
Major Equipment : Boilers - 2x120 tph, 68 bar, 510oC (Alstom) Turbine - 41 MW extraction-condensing
(Alstom)
Emission reduction : around 85,000 ton CO2eq./year
Incentives : BOI privileges
Financing : Project finance

26-10-2018
8
29
Example of Biomass Co-generation
30
What is Gasification?
• Conversion of solid fuels into combustible gas mixture
called producer gas or syngas (CO + H2 + CH4)
• In syngas there are small amount of some light
hydrocarbons like ethane and propane, and heavier
hydrocarbons like tars.
• There are also presence of inert gas (N2) and other
undesirable gases like H2S and HCl.
• Involves partial combustion of biomass
31
Composition of Syngas
Particulars Rice Husk Woody Biomass
CO 15-20% 15-20%
H2 10-15% 15-20%
CH4 Upto 4% Upto 3%
N2 45-55% 45-50%
CO2 8-12% 8-12%
Gas C.V. (kcal/Nm3) Above 1050 Above 1100
Gas generated in
Nm3/kg of biomass
2 2.5
32
Application of Gasification
Power generation
• Co-combustion in a coal and natural gas power plant without further modification of the burners
• Irrigation Pumping
• Village Electrification
• Captive Power (Industries)
• Grid-fed Power from Energy Plantations on Wastelands
• Simultaneous Charcoal and Power Production
• Production of electric energy in a fuel cell
Thermal application
• Hot Air Generators
• Dryers
• Boilers
• Thermic Fluid Heaters
• Ovens
• Furnaces & Kilns
26-10-2018
9
33
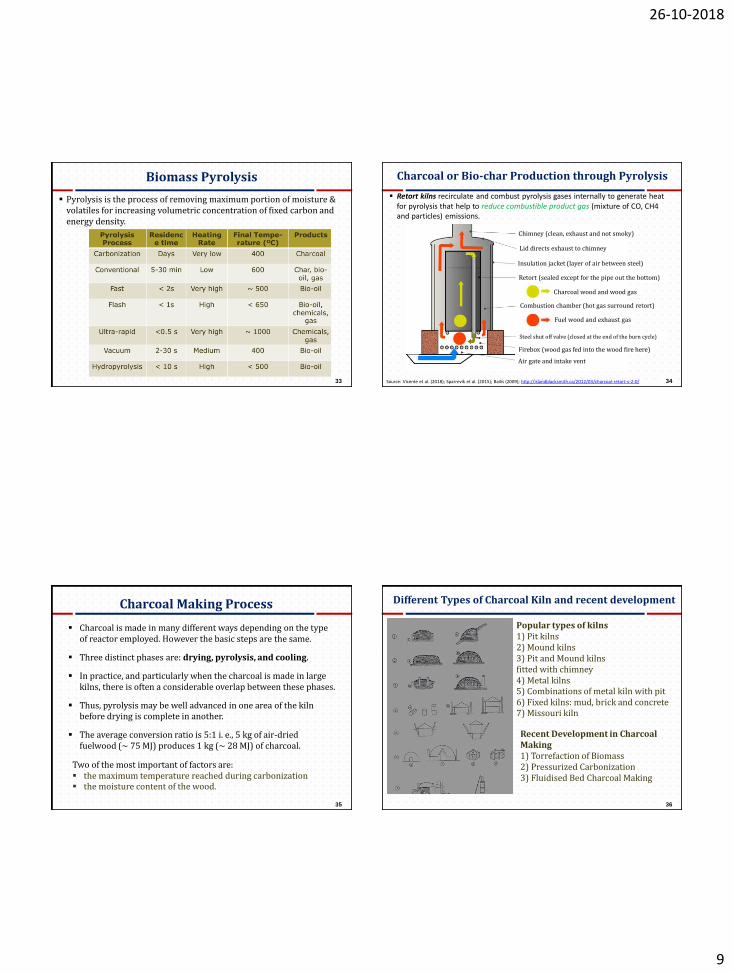
Biomass Pyrolysis
Pyrolysis is the process of removing maximum portion of moisture & volatiles for increasing volumetric concentration of fixed carbon and energy density.
34
Charcoal or Bio-char Production through Pyrolysis
Retort kilns recirculate and combust pyrolysis gases internally to generate heat for pyrolysis that help to reduce combustible product gas (mixture of CO, CH4 and particles) emissions.
Source: Vicente et al. (2018); Sparrevik et al. (2015); Bailis (2009); http://islandblacksmith.ca/2012/03/charcoal-retort-v-2-0/
Chimney (clean, exhaust and not smoky)
Lid directs exhaust to chimney
Retort (sealed except for the pipe out the bottom)
Charcoal wood and wood gas
Combustion chamber (hot gas surround retort)
Steel shut off valve (closed at the end of the burn cycle)
Firebox (wood gas fed into the wood fire here)
Air gate and intake vent
Fuel wood and exhaust gas
Insulation jacket (layer of air between steel)
35
Charcoal Making Process
Charcoal is made in many different ways depending on the type of reactor employed. However the basic steps are the same.
Three distinct phases are: drying, pyrolysis, and cooling.
In practice, and particularly when the charcoal is made in large kilns, there is often a considerable overlap between these phases.
Thus, pyrolysis may be well advanced in one area of the kiln before drying is complete in another.
The average conversion ratio is 5:1 i. e., 5 kg of air-dried fuelwood (~ 75 MJ) produces 1 kg (~ 28 MJ) of charcoal.
Two of the most important of factors are: the maximum temperature reached during carbonization the moisture content of the wood.
36
Different Types of Charcoal Kiln and recent development
Popular types of kilns1) Pit kilns2) Mound kilns3) Pit and Mound kilnsfitted with chimney4) Metal kilns5) Combinations of metal kiln with pit6) Fixed kilns: mud, brick and concrete7) Missouri kiln
Recent Development in Charcoal Making 1) Torrefaction of Biomass2) Pressurized Carbonization3) Fluidised Bed Charcoal Making
26-10-2018
10
37
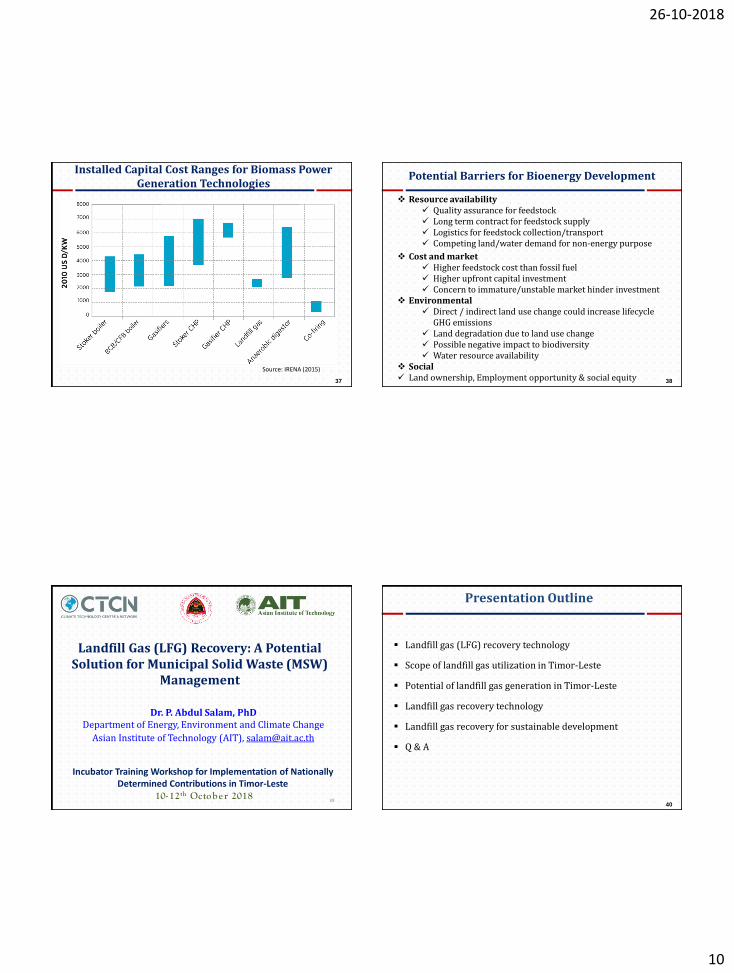
Installed Capital Cost Ranges for Biomass Power Generation Technologies
Source: IRENA (2015)
38
Potential Barriers for Bioenergy Development
Resource availability Quality assurance for feedstock Long term contract for feedstock supply Logistics for feedstock collection/transport Competing land/water demand for non-energy purpose
Cost and market Higher feedstock cost than fossil fuel Higher upfront capital investment Concern to immature/unstable market hinder investment
Environmental Direct / indirect land use change could increase lifecycle
GHG emissions Land degradation due to land use change Possible negative impact to biodiversity Water resource availability
Social Land ownership, Employment opportunity & social equity
39
Landfill Gas (LFG) Recovery: A Potential Solution for Municipal Solid Waste (MSW)
Management
Dr. P. Abdul Salam, PhDDepartment of Energy, Environment and Climate Change
Asian Institute of Technology (AIT), [email protected]
Incubator Training Workshop for Implementation of Nationally Determined Contributions in Timor-Leste
10- 12th October 201840
Presentation Outline
Landfill gas (LFG) recovery technology
Scope of landfill gas utilization in Timor-Leste
Potential of landfill gas generation in Timor-Leste
Landfill gas recovery technology
Landfill gas recovery for sustainable development
Q & A

26-10-2018
11
41
Landfill Gas Recovery Technology
LFGTE: Landfill gas to energy; GW: Gas well 42
Landfill Gas Recovery: A Potential Source of Energy
43
Landfill Gas (LFG): A Potential Source of Energy
Landfill gas is created during the anaerobic decomposition of organic substances in municipal solid waste (MSW).
CH4: 35-55%; CO2: 50-35%; N2: 5-25%; O2: 0-6%
Global MSW generation is 2.01 billion tonnes in 2016 & expected to increases to 3.40 billion tonnes in 2050.
Organic waste accounts about 45-68% of MSW.
Calorific value of LFG: 12.6-19.8 MJ/Nm3
44
Scope of LFG Technology in Timor-Leste
The Dili district in Timor-Leste generates about 180-250 tons of MSW in a day which contains a high portion of organic wastes.
1 tonnes of MSW generate 1.7-2.5 m3 of collectable methane
The quality & quantity of MSW is not classified properly
The government can take initiatives to improve MSW collection facilities, introduce legislations & impose ban on open/ improper waste dumping.
There is a need to conduct research on:
o Identification of waste types & composition
o Locate potential landfill sites which are in active & assess landfill gas generation potential for the selection of suitable landfill gas recovery technology.

26-10-2018
12
45
Landfill Gas (LFG) Utilization
1. Installation of flaring system in landfill site if gas production is not enough for electricity generation.o Methane is converted directly to carbon dioxide, resulting
in large GHG impact reduction.
2. Biogas upgradation for compressed biogas production which can be used in households, industries , vehicles & other commercial purposes. o Carbon di-oxide & sulphide contents are removed to
increase methane concentration for achieving similar properties of natural gas or LPG.
3. Direct onsite usage for electricity generationo LFG is collected & directly combusted in gas engines or
turbines or boilers just after cleaning.46
Landfill Gas (LFG) Utilization
3. Electricity Generation
• More than 70% of LFG energy projects generate electricity through combustion of LFG in internal combustion engines.
• Other uses include:
o Gas turbines
o Microturbines
o Boiler/steam turbine applications
o Combined cycle applications
o Fuel Cells
• Cogeneration
o Heat and Electricity
4. Alternative Fuels
• Vehicle Fuels
o Compressed Natural Gas and Liquified Natural Gas
o In 2007 about 12,000 vehicles & in 2010 about 70,000 worldwide.
• Methanol
o Removal of CO2 and vapor.
• Fertilizer production
Ammonia & Urea
47
Advantages and Challenges for LFG Recovery
Environmental/Economic Benefits
o Prevents direct release of methane into environment which has 28-36 times higher global warming potential than CO2.
o Revenues for power and heat production when fed into the public grid.
o Provide revenue for landfills.
o Reduce energy costs for users of LFG energy.
o Carbon credits for reduction of methane releases or special renewable energy tariffs
o Creating job opportunities which will directly improve socio-economic standards & livelihoods
Major challenges
o Lack of proper waste collection system
o higher initial investment
o To be economically viable, landfill must be located near transmission lines or direct-use facility.
48
Changes in Typical LFG Composition after Waste Placement
LFG is produced at a stable rate in Phase IV, typically for about 20 years.

26-10-2018
13
49
Example 1: Landfill Gas Recovery Plant - Brazil
BrazilMarca
Landfill
CariacicaBrazil
50
Example 2: Landfill Gas Recovery Plant – El Salavador
NejapaLandfill
Nejapa
El Salvador
51
Example 3: Thailand’s Kamphaeng Saen East & West LFGE Projects
LFGE: Landfill gas to electricity generation.
The projects involve the production of clean energy from the use of landfill gas (“LFG”) emitted from the Bangkok’s largest landfill, which is also one of the largest landfills in Asia.
Approximately 50 – 60% of LFG is methane
Electricity generation 16.0 MW capacity, 8.0MW of each unit.
52
Example 4: Latvia’s Getlini Landfill Gas Project
Landfill receives wastes: 300-400k tons per year
Total investment: US $25.21 million
Installed electricity generation capacity: five units each has power capacity of 1.05MW & heat capacity of 1.23 MW.
Getlini Landfill Power Production and CO2 Emissions Reductions.
26-10-2018
14
53
Environmental Hazards due to LFG
Landfilling is more serious than open dumping. As height of waste layer increases anaerobic condition.
Emission factors (tCO2e/tonne MSW): Landfilling without flaring: 1.365; Landfilling with flaring: 0.577
Landfills are the 2nd largest human source of methaneo Represent 23 % of all methane producedo Methane absorbs 20 times more infrared radiation than CO2
LFG releases CO2 & uncontrolled CH4 creates explosion risks.
Increases health risk, degrades air quality, contaminates ground & river water, reduces soil fertility & occupies land
Landfill gas also contains
o Volatile organic compounds (VOC) that contributes to ozone formation
o Hazardous air pollutants (HAP) that affects human health when exposed 54
Wind Energy
Dr. P. Abdul Salam, PhDDepartment of Energy, Environment and Climate Change
Asian Institute of Technology (AIT), [email protected]
Incubator Training Workshop for Implementation of Nationally Determined Contributions in Timor-Leste
10- 12th October 2018
55
Presentation Outline
Wind energy
Wind energy in Timor-Leste
Wind energy technologies
Current status
Q & A
56
Wind Energy (Wind Power)
Wind is the motion of air which is a gift to us from nature.
Wind (air) moves from low pressure region to higher pressure region at a velocity (v, m/sec.) because of uneven heating of the Earth’s surface by the sun.
Air flow with a
velocity of ‘v’
(m/sec) &
density of ‘ρ’
(kg/m3) Blade swept area
Source: Schaffarczyk (2014)

26-10-2018
15
57
Output of Wind Energy
The output power from wind farm is proportional to:
The density of air (It is lower at higher mountainous regions; but avg. density in cold climates may be up to 10% higher than in tropical regions).
The area (rotor blade swept area) through which the wind is passing
The cube of wind velocity (Power increases a factor of 8 if wind velocity increases to double from its original).
Capacity factor (CF) of wind turbine varies between 20-40%, generally 35%
CF varies according to location, turbine design and type of wind farm.
Decrease in capacity factor increases production cost.
Lower CF increases the number of wind turbine required to be installed to get the similar output instead of nuclear and coal-fired power plant.
58
Wind Turbine Description
Major Components
o Rotor ( 2 or 3 blades)o Gearboxo Towero Foundationo Controlso Generator
Types
Horizontal axis
o Most common
Vertical axis
o Less common
59
Wind Turbine Description
Wind turbine technology has reached a mature status during the past 15 years as a result of international commercial competition, mass production and research and development.
Modern wind energy systems operate automatically.
When the wind speed is high enough to overcome friction in the wind turbine drivetrain, the controls allow the rotor to rotate, thus producing a very small amount of power. This cut-in wind speed is usually a gentle breeze of about 4 m/s.
Power output increases rapidly as the wind speed rises. When output reaches the maximum power the machinery was designed for, the wind turbine controls govern the output to the rated power.
The wind speed at which rated power is reached is called the rated wind speed of the turbine, and is usually a strong wind of about 15 m/s.
Eventually, if the wind speed increases further, the control system shuts the wind turbine down to prevent damage to the machinery. This cut-out wind speed is usually around 25 m/s
60
Wind Energy - Status
Source: REN21, 2018

26-10-2018
16
61
Potential Availability of Wind Energy in Timor-Leste
Timor-Leste is located by the Timor Sea and its geographic condition provides an excellent opportunity to harvest wind energy.
Wind energy potential: 81 MW
A pre-assessment has found that mountainous areas east of Maliana, and southwest and east of Venilale and Quelicai, Bobonaro and Lariguto are potential sites for the installation of onshore wind farms.
The Government aimed to install wind power capacity of 42.6MW by 2017.
Source: Virgilio F. Guterres, General Director of Electricity, ASIAN PACIFIC ENERGY FORUM Bangkok, December 17-19, 2013.
62
Classification of Wind Farms
According to the axis of operation:
Vertical axis wind turbine
Horizontal axis wind turbine
Location of installation: offshore & onshore
No. of blades: generally three blades
Wind speed, height of the turbine & rotor blade swept area
offshoreOnshore
63
Advantages of Wind Power
Environmental
o Saves water (2,000liters/MWh of electricity) & water pollution
o No fuel consumption & GHG emission
o Creates opportunity to earn carbon credits
o Saves 600g CO2 emission per kWh of electricity production.
Resource diversity & conservation
o Domestic energy source
o Inexhaustible supply
o Small, dispersed design reduces supply risk
Installation cost of is competitive to the conventional fossil fuel based power plants.
Economic development
o Increases tax revenue & creates green job opportunities & contributes to socio-economic development.
64
Technological Development of Wind Energy
Advancement in wind turbine technology is significant whereturbine capacity has increased from 50kW to 9.5MW by 2016.
Source: German Energy Agency

26-10-2018
17
65
Sizes and Applications of Wind Farms
65
Small (10 kW)• Homes
• Farms• Remote Application
Intermediate
(10-250 kW)• Village Power
• Hybrid Systems
• Distributed Power
Large (660 kW to >2MW)
• Central Station Wind Farms
• Distributed Power
• Community Wind
66
Offshore Wind Energy Harvesting
More preference should be given on floating technology which hasthe potential to overcome the issues such as noise, not-in-my-backwards attitude, blockage of shipping lanes and visual impact.
At present single pile structure, gravity structure and multi-pilestructure foundations are available.
Source: Shen (2012); IRENA (2012, Volume 1, Issue 5/5)
Offshore Wind Farm in the North Sea near Germany
67
Wind Power Offshore Global Capacity by Region, 2007-2017
Source: REN21 (2018) 68
Advantages & Limitations of Offshore Wind Farms
Offshore wind farms are the future for the production of reliable electricity production because:
Very large wind farms can be installed of higher capacity and reduces pressure on dry land.
Wind farm sites have high average wind speed and low turbulence.
Suitable to install taller and larger rotors with higher swept area that eventually increases electricity production.
Offshore wind technology has the potential to produce twice much electricity compared to onshore wind farm but requires:
High initial investment
Complex/challenging foundation structure compared to onshore
Materials need additional corrosion protection
rotor blades should sustain the harsh marine environment and impact of large waves.
Source: IEA (2010); Shen (2012); IRENA (2012, Volume 1, Issue 5/5)

26-10-2018
18
69
Investment Scenario Based on Wind Technology
Technology Typical characteristics Capital cost (USD/kW)Typical energy cost (US
cents/kWh)
OnshoreTurbine size: 1.5 - 3.5 MWCapacity factor: 20-50%
India: 925 – 1,470China: 660 – 1,290United States: 2,300 -10,000United Kingdom: 5,873
Global: 4 -16Asia, Eurasia & North America:
6 -7Central & South America: 5 - 10
Onshore small-scale
Turbine size: ≤100 kWAverage:Global: 0.85 kWChina: 0.5 kWUnited States: 1.4 kWUnited Kingdom: 4.7 kW
United States: 2,300 -10,000United Kingdom: 5,870China:1900
United States: 15 -20
Household wind
turbine
Turbine size: 0.1 -3 kW (off-grid & residential)1.1 - 2.5 MW (industrial & institutional)
1kW turbine: 10,0005kW turbine: 5,000250kW turbine: 2,500 -3,500
15 - 35+
OffshoreTurbine size: 1.5 - 7.5 MWCapacity factor: 35 -45%
Global: 4,500 -5,500OECD: 2,250 – 6,250
Global: 15 - 23
Source: REN21 (2015) 70
Global Average Installation Cost of Onshore Wind Projects, 1983-2017
Source: IRENA (2018)
Total installation cost of wind farms reduced by 70% & costs fell from USD 4,880 to USD 1,477/kW capacity
Capacity factor increased to about 29% in 2017
71
Global Average Installation Cost of Offshore Wind Projects, 2000-2018
Source: IRENA (2018)
Installation cost increased by 4% & costs up from USD 4,430 to USD 4,487/kW capacity during 2010-2016
Capacity factor increased to about 40%
72
Global Average Levelised Cost of Electricity of Onshore Wind Power, 1983-2017
Source: IRENA (2018)
Decreased by 85%, from USD 0.40/kWh in 1983 to USD 0.06/kWhFor offshore wind also decreased from USD 0.17 to USD 0.14/kWh

26-10-2018
19
73
Solar Photovoltaic (PV) Systems for Increasing Rural Electricity Access and Improve
Livelihoods
Dr. P. Abdul Salam, PhDDepartment of Energy, Environment and Climate Change
Asian Institute of Technology (AIT), [email protected]
Incubator Training Workshop for Implementation of Nationally Determined Contributions in Timor-Leste
10- 12th October 2018 74
Presentation Outline
Global overview of solar energy
Solar energy in Timor-Leste
Possible solar applications
Current status and examples
Q & A
75
Solar Energy in the World
Solar energy available around the worldThe tropical region receives maximum amount of solar radiation
Source: https://upload.wikimedia.org/wikipedia/commons/9/9d/SolarGIS-Solar-map-World-map-en.png 76
Availability of Solar Energy
The availability of solar energy depends on the following conditions:
Position of the sun (sun path diagram)
The position of the location of interest (where on the earth’s surface)
The time of the day (morning or afternoon)
Orientation of the collector (direction facing)

26-10-2018
20
77
Potential Availability of Solar Energy in Timor-Leste
0
2
4
6
8
10
12
0
50
100
150
200
250
300
350
Su
nsh
ine
ho
urs
So
lar
Ra
dia
tio
n &
To
tal
Su
nsh
ine
Ho
urs
Total Sunshine Hours
Sunshine Hours per day
Monthly Standard Solar Radiation (kWh/m2/day)
Annual average solar radiation is 6.22 kWh/m2/day
From March to December, monthly total sunshine hours are more than 220 hours.
78
Possible Solar Applications in Timor-Leste
Technology Applications
Solar Photovoltaic(Electricity generation)
i. Solar water pumping and irrigationii. Solar Home Systems (SHS)iii. Street lighting
Solar Thermal(Heat generation)
i. Desalination/Distillationii. Solar Water Heatersiii. Solar Dryers
79
Solar Electricity
Cells combined to create module, which are connected to create arrays.
When modules are connected in series, the voltage increases
When modules are connected in parallel, the current increases
Usually module are either 12V or 24V.
When sun shines on the solar cell, the photons (energy packets) are absorbed by the semiconductor to realize electrons. The flow of these electrons then generate electricity.
80
Solar PV Global Capacity and Annual Additions
Source: REN21, 2018 Exponential Growth

26-10-2018
21
81
Solar Array Mounting systems
Roof-mounted Ground-mounted
Pole-mounted Floating System
82
Solar PV Module Price Trends 2010-2017
Source: IRENA, 2018
83
Advantages and Disadvantages of Solar Energy
Advantages
o Locally Available
o No fuel consumption
o Low running costs (simple dusting and cleaning)
o Long life of panels (25years)
o Modular in nature
o No emissions during operations
Disadvantages
o Available for limited time
o Fluctuations on hourly basics (clouds)
o Fluctuations throughout the year
o Cost of Technology
o Large capturing area is required to harvest solar energy.84
Examples of Off-grid Applications: Solar Home System
Solar Home Systems (SHS) are stand-alone PV systems that offer a cost-effective mode of supplying electricity to remote off-grid households.
SHS usually operate at a rated voltage of 12 V direct current (DC) and provide power for low power DC appliances such as lights, radios and small TVs for about three to five hours a day.
• Components of a Solar Home System
– Solar PV Panel
– Battery
• Deep Discharge
– Solar/Change Controller
– Appliances (small)
• Lights
• Television
• BatterySource: http://www.solar.anterbox.com/solar-home-lighting.html
26-10-2018
22
85
Example: Off-grid Solar Water Pumping System
Solar Panel
Pump
Water Storage
86
Advantages of Solar Pumping
Reduces energy cost for cultivation
No noise, fumes or fuelling
Scalable – additional panels can be added to increase output
Flexible – solar power can be integrated with mains electricity supply if desired
Low maintenance.
Aside from tracking systems, traditional solar generators have no moving parts and are generally very reliable.
Protection from rising energy costs. Sunshine is free so generating energy on farm reduces exposure to rising electricity and diesel prices
87
Example: Solar Irrigation Projects in Bangladesh
• Funded by the government & multiple development partners i.e. the World Bank, ADB, IDB, KfW, GIZ, GEF, GPOBA, USAID, DFID, JICA and SNV.
• Target: 50,000 by 2025 & 1,500 by 2017;
• Achievement: Approved 241 by 2015; Installed 108; Under installation 133; In pipeline 250
Present Irrigation Scenario
SourceNo. of pumps
(million)Area coverage
(million ha)
Electricity 0.27 1.7
Diesel 1.34 3.4
Energy consumption
1, 500 MW1 ml tons diesel/yr worth USD 900 m
Subsidy - $ 280 million
Business models:
1.Free of service: 17 organizations install solar pumps & earns by selling water to the farmers.
2. Ownership model: Farmers owns the system & pay the installment to purchase equipment.
Source: IDCOL Solar Irrigation Projects (2015)88
Example: ‘Solar Market Garden’ by SELF
• Solar Electric Light Fund (SELF)initiated a Solar Market Garden inBenin which combines solar-powered pumps with dripirrigation system.
• Currently, there are 11 half-hectareSolar Market Gardens, with 30-40women working in each.
• Key Specificationso Area – 0.5 hectareo Reservoir – 21 m3
o Solar array – approx. 1 kW
• Costs: US $20,000
• Payback period for crop productionis 2-3 years.
http://unfccc.int/secretariat/momentum_for_change/items/9264.php
DRIP IRRIGATIONDrip irrigation delivers water (and fertilizer) directly to the roots of plants, thereby improving soil moisture conditions.

26-10-2018
23
89
Example: Operation of ‘Solar Market Garden’ by SELF
90
Example: Benefits of ‘Solar Market Garden’ by SELF
91
Example: Solar Home System - Bangladesh
Infrastructure Development Company Limited (IDCOL), a financialinstitution started solar energy program in 2003.
• Currently, more than 3.8 million SHSs of capacity range 10-134 Wpwith a total capacity of 150 MW have been disseminated in rural andisolated areas in Bangladesh
• Most of the users choose to install 50Wp PV micro-utility andestimated about 45% of total number of installations
92
Example: Benefits and barriers in Dissemination of Solar Home System in Bangladesh
Benefits of Solar Home System in Bangladesh
o Employment opportunityo Improvement of quality of life of rural peopleo Improvement of environment sustainabilityo Reduction in distribution and transmission cost of electricityo Creation of facilities for social activities
Key barriers for SHS and removal option

26-10-2018
24
93
Solar Street Lighting
Advantages
High efficiency
Low voltage operation
Long operating life
Improves human life standard
Reduces accident possibilities
LED Performance Over Time, Light Source Efficiency Trends
Source: http://www.onsemi.com/pub_link/Collateral/TND346-D.PDF
94
Example: Solar Street Lighting in Fugar City, Nigeria
Project location: Fugar is a city in Nigeria
Project deliverables:
o 210 street lights of 120W capacity each
o Mounting height: 6 meters; Distance between each pole: 25 meters
o Average lumens: 35 LUX; Illuminatedarea: 25 ×10 m2
o Total electricity demand:302.4kWh/day (12hr operation)
o Energy required for each lampincluding losses: 1,872Wh/day
o No. of 160W panels required: 2
o No. of battery required: seriesconnected two 12V batteries
o Charge controller: 20A/24V
95
Solar Drying in Rural Farms
Modern solar driers are still very simple, but also more
effective and hygienic. The basic components of a solar dryer
are an enclosure or shed, screened drying racks or trays, and a
solar collector.
96
Solar Energy for Cooking Purposes
Solar Water Heating
Solar Cookers
26
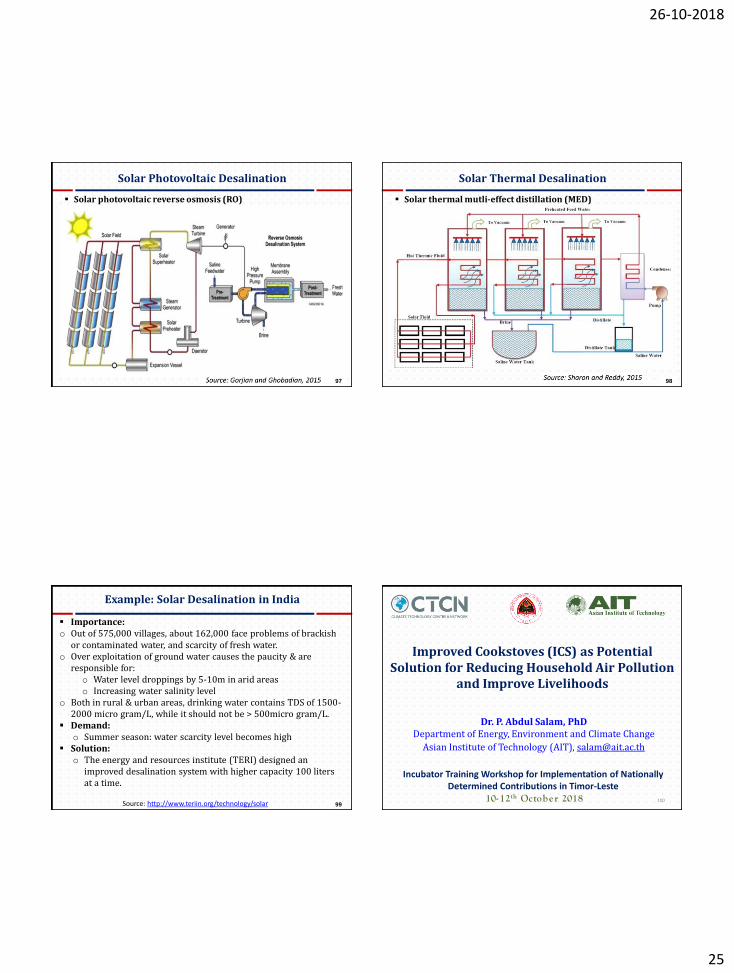
26-10-2018
25
97
Solar Photovoltaic Desalination
Solar photovoltaic reverse osmosis (RO)
98
Solar Thermal Desalination
Solar thermal mutli-effect distillation (MED)
99
Example: Solar Desalination in India
Importance:o Out of 575,000 villages, about 162,000 face problems of brackish
or contaminated water, and scarcity of fresh water.o Over exploitation of ground water causes the paucity & are
responsible for:o Water level droppings by 5-10m in arid areaso Increasing water salinity level
o Both in rural & urban areas, drinking water contains TDS of 1500-2000 micro gram/L, while it should not be > 500micro gram/L.
Demand:o Summer season: water scarcity level becomes high
Solution:o The energy and resources institute (TERI) designed an
improved desalination system with higher capacity 100 liters at a time.
Source: http://www.teriin.org/technology/solar100
Improved Cookstoves (ICS) as Potential Solution for Reducing Household Air Pollution
and Improve Livelihoods
Dr. P. Abdul Salam, PhDDepartment of Energy, Environment and Climate Change
Asian Institute of Technology (AIT), [email protected]
Incubator Training Workshop for Implementation of Nationally Determined Contributions in Timor-Leste
10- 12th October 2018

26-10-2018
26
101
Presentation Outline
Improved cookstoves (ICS)
Scope of ICS in Timor-Leste
Issues with improved cookstove
Classification of cookstoves
Examples of improved cookstoves
Strategical approach to accelerate ICS dissemination
Q & A
102
Necessity to Focus on Cookstoves
About 2.7 billion people depends on traditional biomass fuel for cooking & in 2030 it will remain at 2.8 billion (IEA, 2010).
Household air pollution is the No.1 environmental risk factor for the burden of disease in the developing countries (GACC, 2015).
3-stone Cookstove Improved cookstove (baseline or Traditional stove) (Envirofit)
Source: Colvin and Vergnano (2011)
103
Scope of Improved Cookstoves in Timor-Leste
About 90% household depend on firewood.
About 91% households in Dili, the capital city, & 100% in some regions use open fire cookstoves
Potential to use bio-briquettes produced from agro-wastes (rice, coffee husks), waste paper, and wood dust were used as cooking fuel in ICSs
There were negative responses regarding the adoption of ICSs such as:
o Cooked food is not tasty
o Cooking for larger numbers of people requires larger cooking pots, that do not fit with the small ICS
o Starting the fire in an ICS is little difficult & took more time & comparatively heavier
Some achievable benefits identified are:
o less money was spent on fuel
o less fuel collection time
o creation of job opportunities104
Issues with Cookstoves
Inefficient
o Traditional biomass cookstoves are only 5-15% efficient
o Increases fuel consumption & GHG emission level
Indoor air pollution & health risk
o Causes premature death of 4.3 million people (1 life in every 8 sec) worldwide (WHO, 2014 and GACC, 2015)
o Sixth leading health risk factor for low-income countries in South & East Asia & Africa (WHO, 2009)
Gender and development
o Women and girls spend about 20hrs per week to collect fuelwood
o Fuelwood collection time varies: In India - 1hr/day & Sub-Saharan Africa - 0.33-4hrs/day
o Lack of personal security (especially people living in refugeecamps)

26-10-2018
27
105
Issues with Cookstoves (Cont’d)
Forest protection
o 40% population in developing countries depend on fuelwood
o In Sub-Saharan Africa-69%; China-27%; Timor-Leste-90%
o Unsustainable harvest will cause fuelwood scarcity & increased atmospheric CO2 concentration due to the depletion of natural carbon storage.
Climate change (environmental & health impact)
o The use of solid fuels for cooking & charcoal production emitabout 0.5-1.2Gt of CO2 in developing countries
o Causes transboundary air pollution as 25% of world BlackCarbon (BC) is emitted from the cookstoves due to the use ofsolid fuel inefficiently.
Human behavioral factor in adaptation of improved cookstovescauses uncertainty in the development process, as they stillcontinue their traditional practice of cooking.
106
Advantages of Improved Cookstove (ICS)
Clean fuel burning & less smoke formation
Higher thermal efficiency & lower specific fuel consumption
Reduces energy costs for households
Improves indoor air quality & users’ health condition
Reduces risk of women during fuel collection
Saves time & creates green job opportunities
Reduces the pressure on fuelwood
Global GHG reduction potential of 1.0 Gt CO2 per year (Lee et al., 2013)
Opens income source for poor community
o Production of charcoal creates job opportunity of 275 per TJ whereas electricity production offers only 80-100 per TJ
o Involvement of low-income community into the distribution channel of ICS
107
Types of Cookstove
Generally cookstoves are classified into three major types based on their combustion chamber.
1. Open cooking fire
o Known as “Traditional stove” or “Baseline stove” or “3-stone stove” or “tri-pod stove”
o These are considered as less efficient stoves and performance of improved cookstoves are analyzed compared to the performance of open cooking fire stoves
2. Cookstoves with enclosed combustion chamber (with or without having pot skirt)o Known as improved cookstoves commonly used and highly adapted in
LDCs (Rocket stove, VITA stove, gasifier stove etc.)o Stoves are complex in design and operation with high controllability
3. Cookstove with enclosed combustion chamber with chimneyo These stoves are also under ICS which serves both cooking demand as
well as used for space heatingo These stoves are usually placed inside living room.
108
Classification of Cookstoves
Respective to Description
Operation1. Pyrolyser stove & Gasifier stove2. Direct combustion stove (Open cooking fire, shielded
cooking fire & enclosed fire with chimney)
Air supply Natural draft & Forced draft
Exhaust flow With chimney & Without chimney
Portability1. Fixed (Made of clay, bricks or mud)2. Portable (Made of ceramic or metal )
Constructionmaterial
1. Metallic (Metal sheet, cast iron or aluminum)2. Non-metal (Clay, cement, brick or ceramic)
Fuel typeBiogas, Biomass-briquettes & pellets, Charcoal, Coal, Crop residue, Dung, Electricity, Ethanol/Alcohol, Fuelwood, loosebiomass, natural gas or kerosene, Solar cooker
Stove functionMono-function stove (Fish smoking, baking, milk simmering)Multi-function stove (water & space heating, cooking food)
No. of Pots Single-pot, double-pot (2-pot) or three-pot (3-pot)
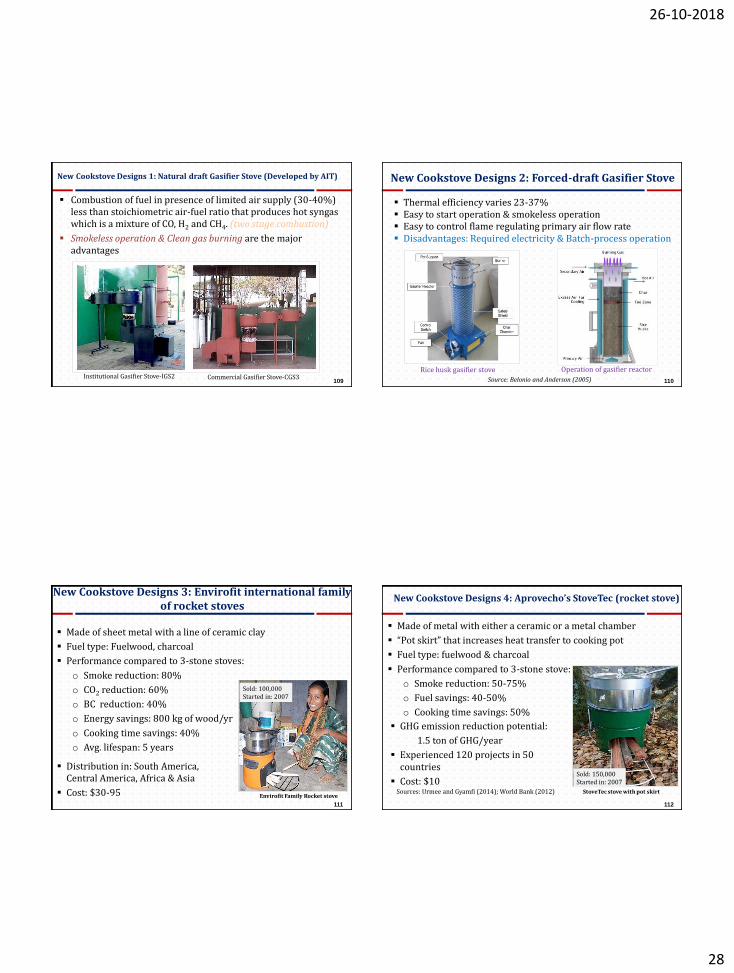
26-10-2018
28
109
New Cookstove Designs 1: Natural draft Gasifier Stove (Developed by AIT)
Institutional Gasifier Stove-IGS2 Commercial Gasifier Stove-CGS3
Combustion of fuel in presence of limited air supply (30-40%) less than stoichiometric air-fuel ratio that produces hot syngas which is a mixture of CO, H2 and CH4. (two stage combustion)
Smokeless operation & Clean gas burning are the major advantages
110
New Cookstove Designs 2: Forced-draft Gasifier Stove
Rice husk gasifier stove Operation of gasifier reactor
Thermal efficiency varies 23-37% Easy to start operation & smokeless operation Easy to control flame regulating primary air flow rate Disadvantages: Required electricity & Batch-process operation
Source: Belonio and Anderson (2005)
111
New Cookstove Designs 3: Envirofit international family of rocket stoves
Made of sheet metal with a line of ceramic clay
Fuel type: Fuelwood, charcoal
Performance compared to 3-stone stoves:
o Smoke reduction: 80%
o CO2 reduction: 60%
o BC reduction: 40%
o Energy savings: 800 kg of wood/yr
o Cooking time savings: 40%
o Avg. lifespan: 5 years
Distribution in: South America, Central America, Africa & Asia
Cost: $30-95 Envirofit Family Rocket stove
Sold: 100,000Started in: 2007
112
New Cookstove Designs 4: Aprovecho’s StoveTec (rocket stove)
Made of metal with either a ceramic or a metal chamber
“Pot skirt” that increases heat transfer to cooking pot
Fuel type: fuelwood & charcoal
Performance compared to 3-stone stove:
o Smoke reduction: 50-75%
o Fuel savings: 40-50%
o Cooking time savings: 50%
GHG emission reduction potential:
1.5 ton of GHG/year
Experienced 120 projects in 50 countries
Cost: $10Sold: 150,000Started in: 2007
StoveTec stove with pot skirtSources: Urmee and Gyamfi (2014); World Bank (2012)
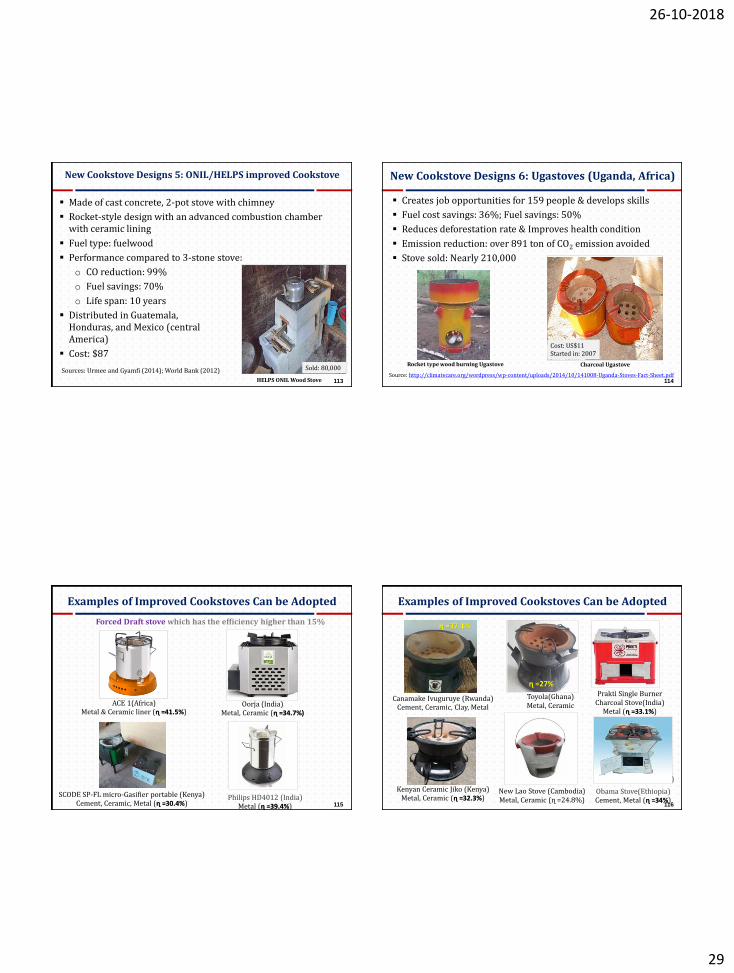
26-10-2018
29
113
New Cookstove Designs 5: ONIL/HELPS improved Cookstove
Made of cast concrete, 2-pot stove with chimney
Rocket-style design with an advanced combustion chamber with ceramic lining
Fuel type: fuelwood
Performance compared to 3-stone stove:
o CO reduction: 99%
o Fuel savings: 70%
o Life span: 10 years
Distributed in Guatemala, Honduras, and Mexico (central America)
Cost: $87
Sources: Urmee and Gyamfi (2014); World Bank (2012)
HELPS ONIL Wood Stove
Sold: 80,000
114
New Cookstove Designs 6: Ugastoves (Uganda, Africa)
Creates job opportunities for 159 people & develops skills
Fuel cost savings: 36%; Fuel savings: 50%
Reduces deforestation rate & Improves health condition
Emission reduction: over 891 ton of CO2 emission avoided
Stove sold: Nearly 210,000
Source: http://climatecare.org/wordpress/wp-content/uploads/2014/10/141008-Uganda-Stoves-Fact-Sheet.pdf
Cost: US$11Started in: 2007
Charcoal UgastoveRocket type wood burning Ugastove
115
Examples of Improved Cookstoves Can be Adopted
Forced Draft stove which has the efficiency higher than 15%
SCODE SP-FL micro-Gasifier portable (Kenya)Cement, Ceramic, Metal (ɳ =30.4%)
ACE 1(Africa)Metal & Ceramic liner (ɳ =41.5%)
Philips HD4012 (India)Metal (ɳ =39.4%)
Oorja (India)Metal, Ceramic (ɳ =34.7%)
116
Examples of Improved Cookstoves Can be Adopted
Obama Stove(Ethiopia)
Prakti Single Burner Charcoal Stove(India)
Metal (ɳ =33.1%)
Canamake Ivuguruye (Rwanda)Cement, Ceramic, Clay, Metal
ɳ =37.1%
Toyola(Ghana)Metal, Ceramic
ɳ =27%
Kenyan Ceramic Jiko (Kenya)Metal, Ceramic (ɳ =32.3%)
New Lao Stove (Cambodia)Metal, Ceramic (ɳ =24.8%)
Obama Stove(Ethiopia)Cement, Metal (ɳ =34%)

26-10-2018
30
117
Example: Impact of ICS Dissemination Program
Ghana, Efficient Cook Stoves –Project that has been designed as a Gold Standard verified emission reductions (VER) project disseminated over110,000 stoves created the benefits:
Social
o Reduces fuel cost and improves living condition
o Improves cooks health condition & reduces medical expenses
Economic
o Created green job employment and build capacity throughout the supply chain
o Improving Ghana’s technological self-reliance
Environmental
o Reducing pressure on forest reserve and aiding biodiversity
o Revenues from carbon finance are helping to build the technical and business capacity for stove manufacturing and promotion
Source: http://www.coeck.be/wp-content/uploads/2012/03/Ghana-Efficient-Cook-Stoves-PIN.pdf 118
Strategical Approaches for the Dissemination of ICS
Incorporating traditional stove artisans & targeted community people in the design & development program of ICS
Drawing consumer attraction through the introduction of innovative financial models
Spreading information such as the importance of ICS in socio-economic development
Support the existing supply chain to promote & distribute ICS
Raw material
supplier,
Cookstove
Assembler/
Manufacturer
ICS promoters
Mobile
Vendors
Retailers
End User
(Urban & Rural)
119
Lessons Learned from Different ICS Program
No program can achieve its goals unless people adopt it & continue to use it in the long term
Some causes of failure are:o Poor implementation strategies,o Inappropriate technologies,o Lack of community participation, ando Lack of training and knowledge share
Need to emphasize on the factors such as:o Stove designs should meet end-user requirementso Needs to ensure the participation of users in design & testingo Stoves should have the proven efficiency & safety features before
disseminating to households.o Durability is an important factor for program success.o The stoves should be marketed to the households.o Cookstove should be able to reduce indoor air pollution o Less difference between cookstove performance assessed from lab
test & field test results