Embed Size (px)
Citation preview

32/2018 CLIMATE CHANGE
Implementation of Nationally Determined Contributions Georgia Country Report


CLIMATE CHANGE 32/2018
Environmental Research of the Federal Ministry for the Environment, Nature Conservation and Nuclear Safety
Project No. (FKZ) 3716 4111 80
Implementation of Nationally Determined Contributions Georgia Country Report
by
Swithin Lui International data and graphs: Lisa Luna and Hanna Fekete NewClimate Institute, Cologne
In cooperation with:
Country specific support and review: Melano Tkabladze Tbilisi, Georgia
On behalf of the German Environment Agency

Imprint
Publisher: Umweltbundesamt Wörlitzer Platz 1 06844 Dessau-Roßlau Tel: +49 340-2103-0 Fax: +49 340-2103-2285 [email protected] Internet: www.umweltbundesamt.de
/umweltbundesamt.de /umweltbundesamt
Study performed by: NewClimate Institute Am Hof 20 – 26 50667 Cologne Study completed in: November 2018 Edited by: Section I 2.1 Climate Protection Juliane Berger Publication as pdf: http://www.umweltbundesamt.de/publikationen ISSN 1862-4359 Dessau-Roßlau, November 2018 The responsibility for the content of this publication lies with the author(s).
UBA Climate Change Implementation of Nationally Determined Contributions - Georgia Country Report
5
Introduction to the project
This country report is part of the “Implementation of Nationally Determined Contributions” (NDCs) project (FKZ 3716 4111 80), which considers NDC implementation in 10 countries: Colombia, Ethiopia, Georgia, In-donesia, Iran, Kenya, Marshall Islands, Morocco, Peru, and Viet Nam. This project places a special emphasis on identifying potential barriers to NDC implementation and mitigation potentials which could go beyond the current NDCs.
The country reports analyze the NDCs in terms of their robustness and coherence with other national or sectoral plans and targets and put them into the context of additional mitigation potentials and other na-tional circumstances. For countries where coal plays a critical role in consumption or national production, the analysis covers further details on this sector, including the economic relevance and local impacts of coal production or consumption. The content is based on available literature from research and public sector information on policies and institutions.
To be able to analyze the content in more detail, the authors focus the research on a number of relevant fields of action. The fields of action were selected based on historic and projected sectoral emissions devel-opment, comprehensive literature on GHG mitigation potentials, identified barriers and emissions reduc-tions as well as feasibility, costs, and co-benefits.
The project was suggested and is financed by the Federal Ministry for the Environment, Nature Conserva-tion and Nuclear Safety, supervised by the German Environment Agency and carried out by independent think tanks - NewClimate Institute and Wuppertal Institute. The country reports are a continuation of simi-lar previous efforts (project numbers 3713 41 102, 3711 41 120, 360 16 022, 364 01 003 and 363 01 128) and aim to inform policy makers and the interested public about the implementation of NDCs in individual countries. The choice of countries is based on developing countries with which Germany works closely on climate change topics.
The country reports are scientific in nature, and all suggestions are derived by the authors from careful analysis, having in mind the individual backgrounds of countries. They aim to increase knowledge about im-plementation of mitigation potentials to meet the globally agreed goal of staying within a temperature in-crease of 1.5°C or well below 2°C above preindustrial levels, without intending to prescribe specific policies.
UBA Climate Change Implementation of Nationally Determined Contributions - Georgia Country Report
6
Overview
Overview ........................................................................................................................................................... 6
List of figures .................................................................................................................................................... 7
List of tables ...................................................................................................................................................... 8 List of abbreviations ......................................................................................................................................... 9
1 Part I: Summary .................................................................................................................................... 11
1.1 Country background ....................................................................................................................... 11 1.2 Emission trends .............................................................................................................................. 11
1.3 NDC and ongoing activities ............................................................................................................ 13
1.4 Mitigation potential ....................................................................................................................... 14 2 Part II: Full country analysis .................................................................................................................. 15
2.1 Country background ....................................................................................................................... 15
2.2 Institutional setup .......................................................................................................................... 21 2.3 Description and Evaluation of the NDC .......................................................................................... 22
2.4 MRV of GHG Emissions ................................................................................................................... 24
2.5 Major climate change mitigation policies and strategies .............................................................. 25 2.6 Additional mitigation potential ...................................................................................................... 27
2.6.1 Modernizing light-duty vehicle fleet and modal shift to public transport .............................. 29
2.6.2 Implementing energy efficiency opportunities across high-emitting industry sub-sectors ...................................................................................................................................... 34
2.6.3 Increase rates of methane capture and utilization from landfills and wastewater facilities .................................................................................................................................... 38
3 Conclusion............................................................................................................................................. 41
4 References ............................................................................................................................................ 43
UBA Climate Change Implementation of Nationally Determined Contributions - Georgia Country Report
7
List of figures
Figure 1 Georgia’s emission profile (excl. LULUCF) .......................................... 12
Figure 2 Georgia’s historical energy profile ...................................................... 12
Figure 3 Georgia’s projected BAU emissions and NDC target .......................... 13 Figure 4 Map of Georgia ................................................................................... 15
Figure 5 Georgia’s emission profile (excl. LULUCF) .......................................... 18
Figure 6 Trends for decarbonization indicators relative to 2014 levels ........... 19 Figure 7 Georgia’s historical energy profile ...................................................... 20
Figure 8 Institutional flowchart ........................................................................ 22
Figure 9 Georgia’s projected emissions and NDC target .................................. 23 Figure 10 Description of Domestic MRV ............................................................. 25
Figure 11 Potential emissions mitigation by sector from BAU pathway ............ 28
Figure 12 Selected fields of mitigation action .................................................... 29 Figure 13 Percentage contribution of high-emitting sub-sectors to total industry
energy-use .......................................................................................... 35

UBA Climate Change Implementation of Nationally Determined Contributions - Georgia Country Report
8
List of tables
Table 1 Key socio-economic figures ................................................................ 16
Table 2 2013 emissions data from Georgia’s GHGs National Inventory Report ................................................................................................. 18
Table 3 Key emissions, energy and environmental data ................................. 19
Table 4 Georgia: 2014 TPES by fuel type ......................................................... 20
Table 5 Energy consumption in transport sector by end-use and fuel type in Georgia ............................................................................................... 30
Table 6 Expected energy and GHG savings in 2030 from cross-sectoral technology upgrades .......................................................................... 37
UBA Climate Change Implementation of Nationally Determined Contributions - Georgia Country Report
9
List of abbreviations
BAT Best available technologies
BAU Business as usual
BUR Biennial Update Reports
CCD Climate Change Division (Georgia’s Ministry of Environment Protection and Agriculture)
CDM Clean Development Mechanism
CNG Compressed natural gas
EIEC Environmental Information and Education Centre
EU-EED European Union Energy Efficiency Directive
EU-AA European Union Association Agreement
EV Electric vehicle
FBT Food, beverage and tobacco (industry)
GCoM Global Covenant of Mayors
GDP Gross domestic product
GHG Greenhouse gas
GIZ Deutsche Gesellschaft für Internationale Zusammenarbeit GmbH
GoG Government of Georgia
GWP Global warming potential
IEA International Energy Agency
(I)NDC (Intended) Nationally Determined Contributions
LDV Light duty vehicle
LEDS Low Emissions Development Strategy
LFG Landfill gas
LULUCF Land use, land use change and forestry
MoE Ministry of Energy
MoENRP Ministry of Environment and Natural Resource Protection
MoEPA Ministry of Environment Protection and Agriculture
MoESD Ministry of Economy and Sustainable Development
MoIA Ministry of Internal Affairs
MoRDI Ministry of Rural Development and Infrastructure
MRV Monitoring, reporting and verification
NAMA Nationally Appropriate Mitigation Action
NC National Communications (to the UNFCCC)
NEEAP National Energy Efficiency Action Plan
OECD Organization for Economic Cooperation and Development
UBA Climate Change Implementation of Nationally Determined Contributions - Georgia Country Report
10
Pkm Passenger-kilometres
SDG Sustainable Development Goals
SEAP Sustainable Energy Action Plan
SME Small and medium enterprises
SUMP Sustainable Urban Mobility Plans
SWMCG Solid Waste Management Company of Georgia
TPES Total Primary Energy Supply
TWh Terawatt-hours
UN United Nations
UNDP United Nations Development Programme
UNEP United Nations Environment Programme
UNFCCC United Nations Framework Convention on Climate Change
UBA Climate Change Implementation of Nationally Determined Contributions - Georgia Country Report
11
1 Part I: Summary 1.1 Country background Geography. Georgia is located in the South Caucasus region where Europe meets southwest Asia, with a total land area of 69,700 km2 and 1,460 km2 of international borders. The country is situated in a mountainous region in the middle of the Black Sea, Russia, Azerbaijan, Armenia and Turkey. Contain-ing the Greater and Lesser Caucasus mountain ranges and 25,000 rivers nationally, Georgia has high capacity for hydropower generation.
Population. Georgia’s population is currently around 3.72 million and has been in a state of steady de-cline since the early 1990s. However, trends in recent years suggest the population has bottomed out and will increase in the medium-term.
Economy. Georgia’s economy has been making steady gains in the last decade, with average annual GDP growth rates of 5%. GDP growth is expected to maintain momentum in the upcoming years. Re-cent economic gains since late 2017 is attributed to 21.6% gains in the construction sector, 11.5% gains in communications, and 8.7% in hotels and restaurants.
Government and politics. Georgia is a semi-presidential republic with the President as the head of state. The President appoints the Prime Minister, who serves as the head of government and heads the Cabinet of Ministers. The President and the Cabinet ministries form the executive branch of power in Georgia, charged with conducting domestic and foreign policy. The Georgian Parliament is the su-preme legislative authority and checks government activity according to the Constitution.
After Georgia declared independence from the Soviet Union in 1991, the country experienced a period of instability that included economic collapse and secessionist movements in the South Ossetia and Abkhazia regions.
Institutions. The Government of Georgia (GoG) experienced a streamlining in 2018, condensing to 11 ministries (one of which is a state ministry) from previously 14. The new Ministry of Environment Protection and Agriculture (MoEPA) houses the Environment and Climate Change Department and Cli-mate Change Division (CCD), which coordinates preparation for the major climate-related Georgian outputs to the United Nations Framework Convention for Climate Change (UNFCCC), including Na-tional Communications (NC), Nationally Determined Contributions (NDC) and Biennial Update Reports (BUR), and will also coordinate the development of Georgia’s Climate Action Plan 2021-2030 alongside external stakeholders.
1.2 Emission trends Emissions. After the breakup of the Soviet economic system, Georgian emissions fell sharply from 47.2 MtCO2e in 1990 to 8.8 MtCO2e in 1995, before slowly rising again to 15.75 MtCO2e in 20131 (-67% change from 1990 to 2013), the most recent official GHG inventory year (IEA, 2016c; MoENRP, 2016). Emissions declined originally due to the scarcity of energy and raw materials, previously supplied by the Soviet Union, before rising again in correlation with a rebounding economy. In Georgia, the indus-try sector is responsible for the largest share of total emissions with 34% while the transport, build-ings, and agriculture sectors also contribute heavily to GHG emissions (Figure 1). The LULUCF sector continues to be a net carbon sink (MoENRP, 2016).
Energy system. Georgia’s total primary energy supply (TPES) in 2014 was dominated by fossil fuel sources, primarily from natural gas and oil products (66%). Hydropower contributed 16% of TPES in the form of electricity, while biomass (mainly fuelwood), coal and renewables (solar, wind, geother-mal) together contributed ~18% (Figure 2). Energy demand has been growing since the mid-1990s
1 Emission values published in the report were calculated using a summation of IPCC methodologies from IPCC 1996, IPCC GPG, IPCC GPG-LULUCF, and IPCC 2006.

UBA Climate Change Implementation of Nationally Determined Contributions - Georgia Country Report
12
and projections expect this trend to continue increasing (+72% in 2030 from 2012 levels) due to rising GDP and larger household and commercial energy intensities (IEA, 2015). In 2014, Georgia’s power plants generated 10.4 TWh of electricity, satisfying an estimated 22% of the country’s overall energy consumption. Of this 10.4 TWh, hydropower plants produced approximately 80% of the electricity.
Figure 1 Georgia’s emission profile (excl. LULUCF)
Data source: (Gütschow et al., 2017)
Figure 2 Georgia’s historical energy profile
Data sources: (IEA, 2016d)
UBA Climate Change Implementation of Nationally Determined Contributions - Georgia Country Report
13
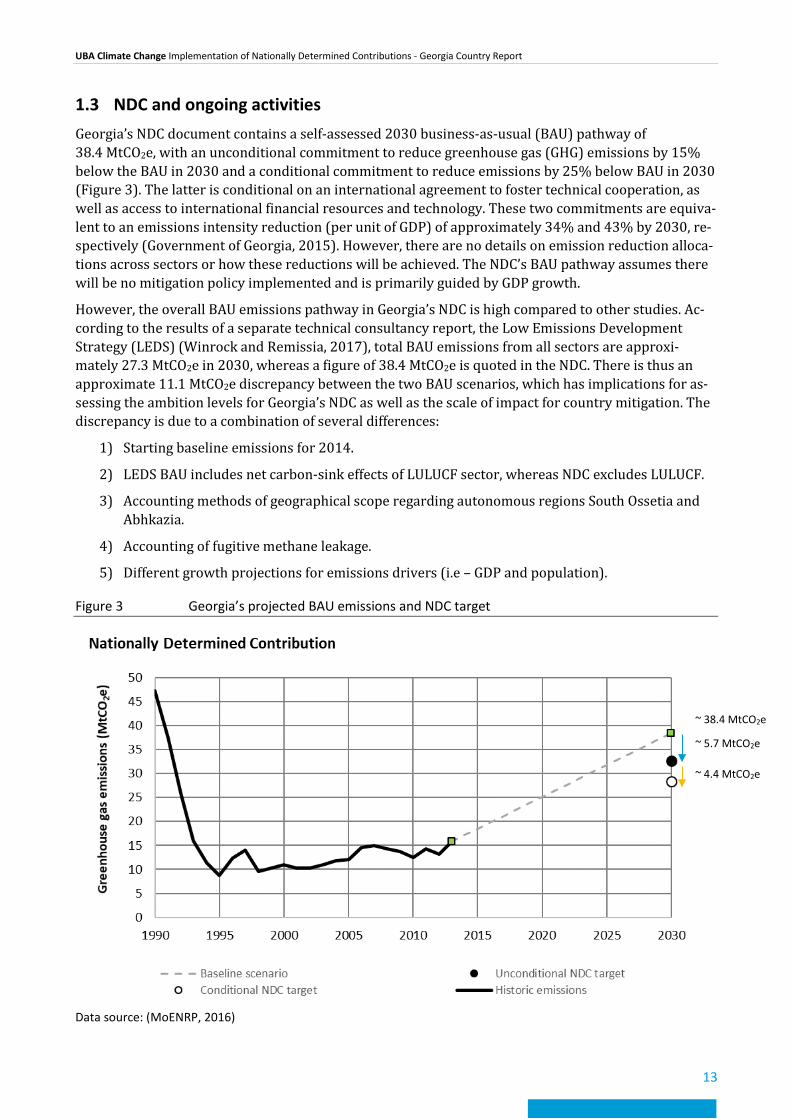
1.3 NDC and ongoing activities Georgia’s NDC document contains a self-assessed 2030 business-as-usual (BAU) pathway of 38.4 MtCO2e, with an unconditional commitment to reduce greenhouse gas (GHG) emissions by 15% below the BAU in 2030 and a conditional commitment to reduce emissions by 25% below BAU in 2030 (Figure 3). The latter is conditional on an international agreement to foster technical cooperation, as well as access to international financial resources and technology. These two commitments are equiva-lent to an emissions intensity reduction (per unit of GDP) of approximately 34% and 43% by 2030, re-spectively (Government of Georgia, 2015). However, there are no details on emission reduction alloca-tions across sectors or how these reductions will be achieved. The NDC’s BAU pathway assumes there will be no mitigation policy implemented and is primarily guided by GDP growth.
However, the overall BAU emissions pathway in Georgia’s NDC is high compared to other studies. Ac-cording to the results of a separate technical consultancy report, the Low Emissions Development Strategy (LEDS) (Winrock and Remissia, 2017), total BAU emissions from all sectors are approxi-mately 27.3 MtCO2e in 2030, whereas a figure of 38.4 MtCO2e is quoted in the NDC. There is thus an approximate 11.1 MtCO2e discrepancy between the two BAU scenarios, which has implications for as-sessing the ambition levels for Georgia’s NDC as well as the scale of impact for country mitigation. The discrepancy is due to a combination of several differences:
1) Starting baseline emissions for 2014.
2) LEDS BAU includes net carbon-sink effects of LULUCF sector, whereas NDC excludes LULUCF.
3) Accounting methods of geographical scope regarding autonomous regions South Ossetia and Abhkazia.
4) Accounting of fugitive methane leakage.
5) Different growth projections for emissions drivers (i.e – GDP and population).
Figure 3 Georgia’s projected BAU emissions and NDC target
Data source: (MoENRP, 2016)
~ 38.4 MtCO2e
~ 5.7 MtCO2e
~ 4.4 MtCO2e
UBA Climate Change Implementation of Nationally Determined Contributions - Georgia Country Report
14
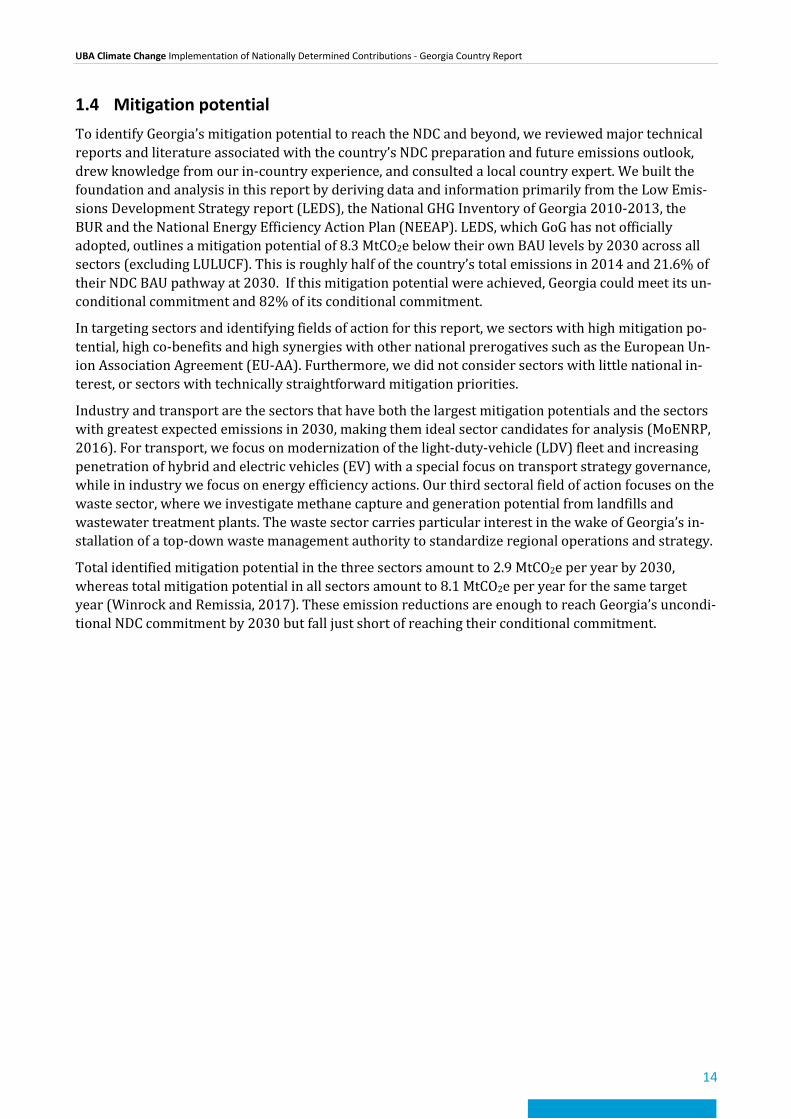
1.4 Mitigation potential To identify Georgia’s mitigation potential to reach the NDC and beyond, we reviewed major technical reports and literature associated with the country’s NDC preparation and future emissions outlook, drew knowledge from our in-country experience, and consulted a local country expert. We built the foundation and analysis in this report by deriving data and information primarily from the Low Emis-sions Development Strategy report (LEDS), the National GHG Inventory of Georgia 2010-2013, the BUR and the National Energy Efficiency Action Plan (NEEAP). LEDS, which GoG has not officially adopted, outlines a mitigation potential of 8.3 MtCO2e below their own BAU levels by 2030 across all sectors (excluding LULUCF). This is roughly half of the country’s total emissions in 2014 and 21.6% of their NDC BAU pathway at 2030. If this mitigation potential were achieved, Georgia could meet its un-conditional commitment and 82% of its conditional commitment.
In targeting sectors and identifying fields of action for this report, we sectors with high mitigation po-tential, high co-benefits and high synergies with other national prerogatives such as the European Un-ion Association Agreement (EU-AA). Furthermore, we did not consider sectors with little national in-terest, or sectors with technically straightforward mitigation priorities.
Industry and transport are the sectors that have both the largest mitigation potentials and the sectors with greatest expected emissions in 2030, making them ideal sector candidates for analysis (MoENRP, 2016). For transport, we focus on modernization of the light-duty-vehicle (LDV) fleet and increasing penetration of hybrid and electric vehicles (EV) with a special focus on transport strategy governance, while in industry we focus on energy efficiency actions. Our third sectoral field of action focuses on the waste sector, where we investigate methane capture and generation potential from landfills and wastewater treatment plants. The waste sector carries particular interest in the wake of Georgia’s in-stallation of a top-down waste management authority to standardize regional operations and strategy.
Total identified mitigation potential in the three sectors amount to 2.9 MtCO2e per year by 2030, whereas total mitigation potential in all sectors amount to 8.1 MtCO2e per year for the same target year (Winrock and Remissia, 2017). These emission reductions are enough to reach Georgia’s uncondi-tional NDC commitment by 2030 but fall just short of reaching their conditional commitment.

UBA Climate Change Implementation of Nationally Determined Contributions - Georgia Country Report
15
2 Part II: Full country analysis 2.1 Country background
Figure 4 Map of Georgia
Source: Google Maps
Geography. The country of Georgia is located in the South Caucasus region where Europe meets south-west Asia, with a total land area of 69,700 km2 and a land boundary of 1,460 km2. Georgia is situated between the Black Sea to the west, Russia to the north, Azerbaijan to the east, and Armenia and Turkey to the south. The country is in a mountainous region, with the Greater Caucasus mountain range in the north running parallel to the Russian border and the Lesser Caucasus in the south running parallel to the Turkish and Armenian border. Coupling these topographical barriers with a historically outdated regional transportation system has created a natural divide that has previously isolated cultural and regional exchange. Due to the abundance of mountainous terrain, Georgia also possesses over 25,000 rivers and rich hydropower potential (EBRD, 2016). The Black Sea and mountain ranges creates natural variations in climate and topography zones across the country, creating heterogeneous and idiosyn-cratic considerations for social and environmental policy.
Population. Georgia’s population is currently approximately 3.72 million and has been in a state of steady decline since 1990. However, trends in recent years suggest the population has stabilised and will increase in the medium-term. The country has also seen a strong urbanisation trend in the last decade, with 57% of the population living in urban areas in 2017, compared to 52.5% in 2007 (GEOSTAT, 2017). The percentage of people in the working age population is slightly above the global average, with 67% of Georgians aged between 15 and 64 years (OECD, 2018). Four out of every five people in the country are ethnically Georgian, while a significant portion of the remaining population consist of Azeris, Armenians, and Russians.
Economy. Georgia’s economy has been making steady gains in the last decade, with average annual GDP growth rates of 5% due to large booms in the services, manufacturing, and construction sectors (Ministry of Foreign Affairs, 2016). After a slight dip during 2015-2016, GDP growth rebounded to 4.8% in 2017 and early 2018 and is expected to maintain momentum in the upcoming years. This re-bound was due to 21.6% gains in construction, 11.5% gains in communication, and 8.7% in hotels and restaurants (Asian Development Bank, 2017). Exports also rose by 30% in 2017, and are likely to grow

UBA Climate Change Implementation of Nationally Determined Contributions - Georgia Country Report
16
substantially after Georgia agreed to a Free Trade Agreement with China in January 2018, allowing 93.9% of Georgian products to be sent to China tariff free (World Bank, 2017a; Morrison, 2018).
The largest sector contributors to Georgia’s GDP are services (31.2%), trade (16.6%) and industry (16.5%). The agriculture sector employs over half the Georgian population although its contribution to national GDP has been declining, from 25% in 1999 to 8% in 2012. However, trends in recent years suggest the importance of agriculture for national GDP may be increasing again.
The rate of poverty has also been declining drastically, with 20% of the population living below the national poverty line in 2015 compared to 35% in 2006. Although economic indicators have improved, there have been minimum gains in private sector job creation and unemployment reduction, which threaten further progress in reducing the poverty rate (Asian Development Bank, 2017).
Table 1 Key socio-economic figures
Indicator Georgia % change since 1990
World Germany Year
Population [million] 3.72 -22.5% 7442 82.7 2016
GDP [2016 bil-lion USD] 14.4 +85.5% 75,641,577 3,467 2016
GDP/Cap [2016 USD/cap] 3,866 +139% 10093 41,313 2016
HDI [0 – 1] 0.769 +12%3 n.a 0.92 2015
Electrification rate [%] 100% +3% 84.6% 100% 2014
GINI index [0 – 100] 38.5 +3.8%4 n.a n.a 2015
Corruption in-dex [0 – 100] 57 - - 81 2016
Urbanization [% of total] 54% -2% 55% 76% 2017
Data sources: (UNDP, 2016a; World Bank, 2016a, 2016b)
Government and politics. Georgia is a semi-presidential republic with the President (Giorgi Margvelashvili, as of 2013) as the head of state. The President appoints the Prime Minister (Mamuka Bakhtadze as of 2018), who serves as the head of government and heads the Cabinet of Ministers. The Cabinet consists of 11 ministers (one state minister), who represent their respective ministries. To-gether, the President and the Cabinet ministries form the executive branch of power in Georgia, charged with conducting domestic and foreign policy. The Georgian Parliament is the supreme legislative au-thority and checks government activity according to rights defined in the Constitution. Draft laws can be initiated by government bodies or expert working groups5 and are eventually subject to a majority vote of all executive branch members before approval from Parliament (Organization for Security and Co-operation in Europe, 2015).
After Georgia declared independence from the Soviet Union in 1991, the country experienced a period
2 Excludes populations of South Ossetia and Abkhazia. 3 Percentage change since 2000 levels due to unavailable data. 4 Percentage change since 1996 levels due to unavailable data. 5 For a full list, please see Article 8 of the Rules of Procedure of the Government.
UBA Climate Change Implementation of Nationally Determined Contributions - Georgia Country Report
17
of instability that included civil conflicts and secessionist movements in South Ossetia and Abkhazia. The two de facto independent states have origins deriving from Soviet politics and are supported by Russia, who has strong military presences in the regions and has also granted residents Russian pass-ports, pensions, and citizenship. The vast international community6 considers the two states to be Geor-gian territory under Russian occupation and the issue has since been a source of tension in Georgian-Russian relations (Cornell, 2001).
Position in international climate negotiations. Georgia, a small country classified as an 'economy in transition’ by the United Nations (UN), ratified the UNFCCC and the Kyoto Protocol in the 1990s, ac-ceded to the Copenhagen Accord as a developing country in 2010, submitted their first quantified inter-national climate commitment with their (I)NDC, and ratified the Paris Agreement in 2017. Georgia also signed an Association Agreement with the European Union (EU-AA) in 2014, agreeing to strategically plan and develop measures on mitigating climate change and pursue climate-related directives with ac-tions such as increasing energy efficiency across sectors and developing larger capacities for renewable energy (European Commission, 2014).
Bilateral cooperation with Germany. GIZ has been working in Georgia since 1992, focusing on three key areas: i) sustainable economic development; ii) democracy, civil society and public administration; and iii) environmental policy, conservation and sustainable use of natural resources. GIZ in Tbilisi also focuses on the same areas for regional programmes in Armenia and Azerbaijan to support network learning effects between the countries. Current programmes specifically target improvements in cli-mate reporting, private sector development and vocational training, biodiversity management and strengthening development effects from migration (in the origin country) (GIZ, 2018). GIZ also works to implement the Capacity Development for Climate Policy project in Georgia (as well as other countries in eastern Europe and central Asia). In Georgia, this project works with stakeholders to produce the na-tional Climate Action Plan 2021-2030 and inform Georgia’s 2nd NDC update and implementation.
In addition, Germany supported Georgia in the preparation of their original INDC, particularly by providing advisory services in mitigation for the forestry and transport sectors (Wucke, 2015). The German government also works with Georgia in developing their monitoring, reporting and verification (MRV) framework and has previously provided funding for a Nationally Appropriate Mitigation Action (NAMA) developing a low-carbon buildings sector (UNDP, 2016b).
Emissions. According to Georgia’s NDC, the country represents approximately 0.03% of global GHG emissions (Government of Georgia, 2015). After the breakup of the Soviet economic system, Georgian emissions fell sharply from 47.2 MtCO2e in 1990 to 8.8 MtCO2e in 1995, before slowly rising again to 15.75 MtCO2e in 20137 (-67% change from 1990 to 2013) (IEA, 2016c; MoENRP, 2016). While there are emission projections available (Gütschow et al., 2017), we primarily use 2013 as a reference year since it is the most recent official GHG inventory data from Georgia. Emissions declined sharply due to the cessation of Georgian industrial activity, which previously depended heavily on Soviet supplies of en-ergy and raw materials (Figure 5). Emissions began increasing again after 1995 with rising economic growth before the economic recession, 2008 Russo-Georgian conflict, and development of hydropower capacity caused another emissions decline in 2009-2010. Levels increased again in 2011 due to eco-nomic stimulus, increased demand for electricity, variability in annual hydro resources, and an uptick in coal use by industry (MoENRP, 2016). However, Georgia’s economy is now more diversified and less emissions-intensive, with the services sector accounting for ~66% of the national GDP (Central Intelligence Agency, 2017).
In Georgia, the industry sector is responsible for the largest share of total emissions with 34% while the transport, buildings, and agriculture sectors also contribute heavily to GHG emissions. The LULUCF sec-tor continues to be a net carbon sink, fluctuating between absorptions of -0.9 and -7.1 MtCO2e per year from 1992-2013 (Table 2).
6 Exceptions include Russia, Nicaragua, Venezuela and Nauru. 7 Emission values published in the report were calculated using a summation of IPCC methodologies from IPCC 1996, IPCC
GPG, IPCC GPG-LULUCF, and IPCC 2006.
UBA Climate Change Implementation of Nationally Determined Contributions - Georgia Country Report
18
Figure 5 Georgia’s emission profile (excl. LULUCF)
Data source: (Gütschow et al., 2017)
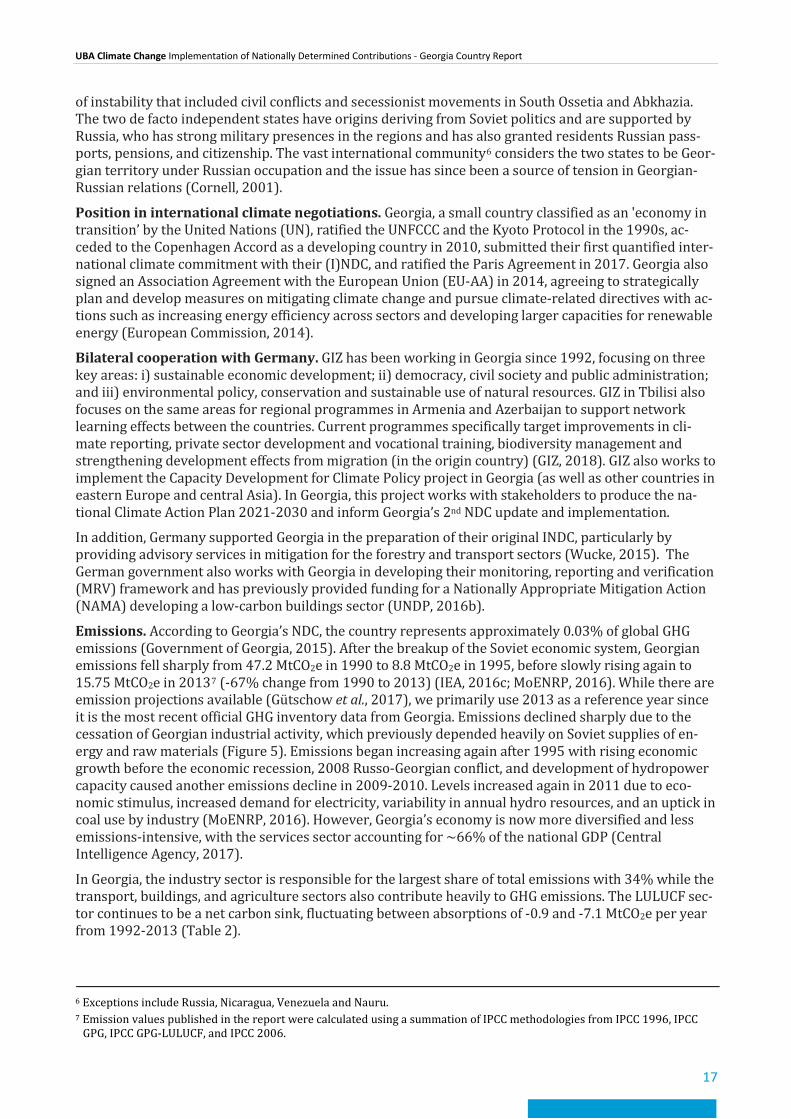
Table 2 2013 emissions data from Georgia’s GHGs National Inventory Report
Sector Value (2013) Unit Share in 2013
Total (excl. LULUCF) 15.75 MtCO2e 100%
Electricity and centralised heat 0.95 MtCO2e 6%
Transport (excl. electricity) 3.1 MtCO2e 20%
Buildings (excl. electricity) 2.4 MtCO2e 15%
Industry (excl. electricity) 5.31 MtCO2e 34%
Agriculture (excl. electricity) 2.73 MtCO2e 17%
Waste 1.27 MtCO2e 8%
LULUCF -4.12 MtCO2e
Total emissions (including LULUCF) 11.63 MtCO2e
Data source: (MoENRP, 2016).
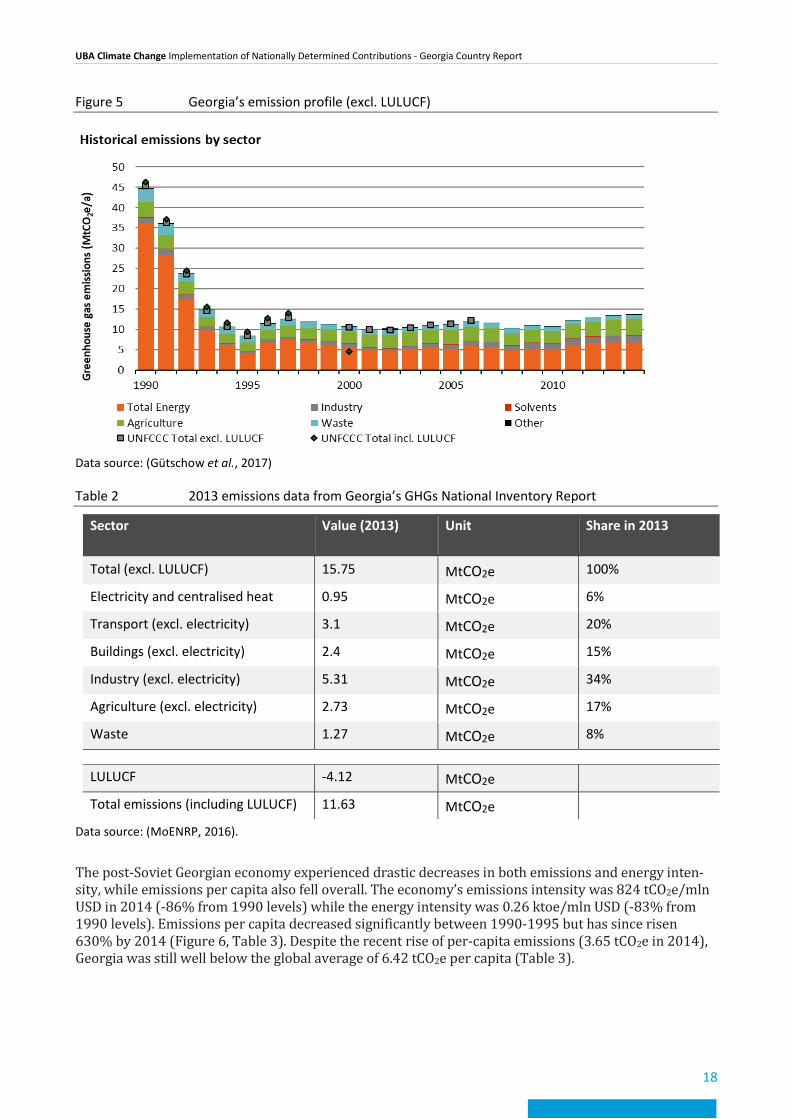
The post-Soviet Georgian economy experienced drastic decreases in both emissions and energy inten-sity, while emissions per capita also fell overall. The economy’s emissions intensity was 824 tCO2e/mln USD in 2014 (-86% from 1990 levels) while the energy intensity was 0.26 ktoe/mln USD (-83% from 1990 levels). Emissions per capita decreased significantly between 1990-1995 but has since risen 630% by 2014 (Figure 6, Table 3). Despite the recent rise of per-capita emissions (3.65 tCO2e in 2014), Georgia was still well below the global average of 6.42 tCO2e per capita (Table 3).
UBA Climate Change Implementation of Nationally Determined Contributions - Georgia Country Report
19
Figure 6 Trends for decarbonization indicators relative to 2014 levels
Data sources: (IEA, 2016c; Gütschow et al., 2017; World Bank, 2017b)
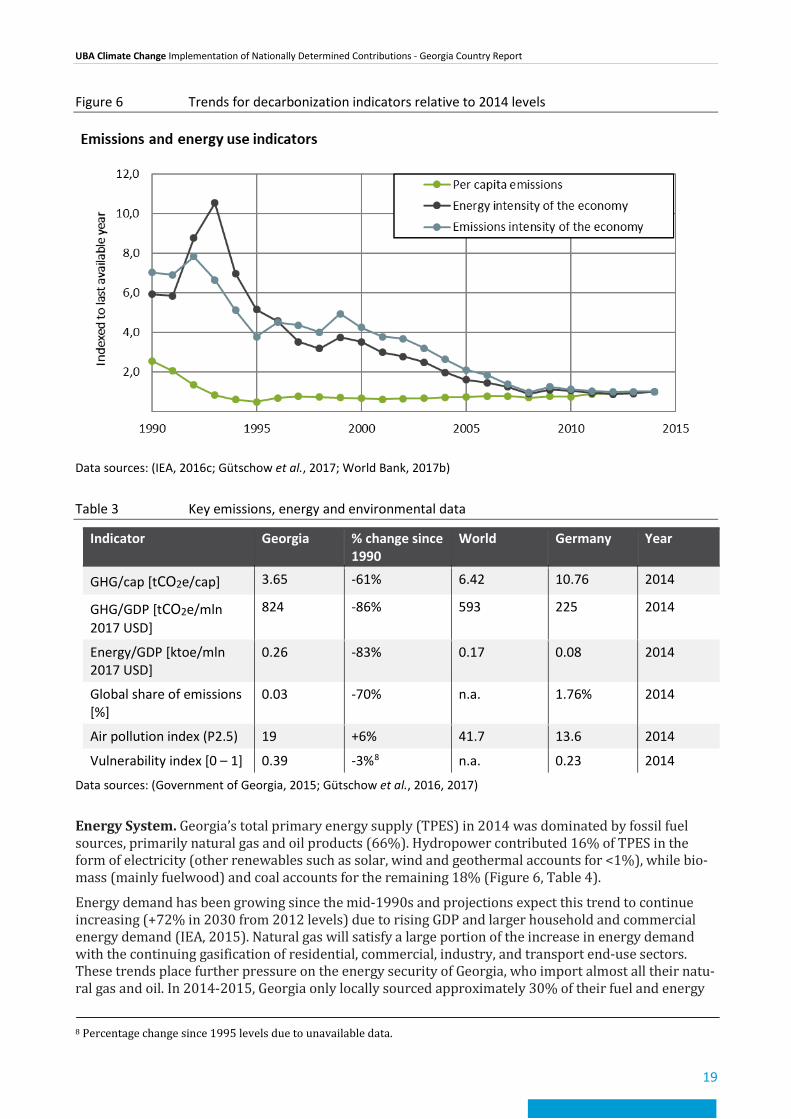
Table 3 Key emissions, energy and environmental data
Indicator Georgia % change since 1990
World Germany Year
GHG/cap [tCO2e/cap] 3.65 -61% 6.42 10.76 2014
GHG/GDP [tCO2e/mln 2017 USD]
824 -86% 593 225 2014
Energy/GDP [ktoe/mln 2017 USD]
0.26 -83% 0.17 0.08 2014
Global share of emissions [%]
0.03 -70% n.a. 1.76% 2014
Air pollution index (P2.5) 19 +6% 41.7 13.6 2014
Vulnerability index [0 – 1] 0.39 -3%8 n.a. 0.23 2014
Data sources: (Government of Georgia, 2015; Gütschow et al., 2016, 2017)
Energy System. Georgia’s total primary energy supply (TPES) in 2014 was dominated by fossil fuel sources, primarily natural gas and oil products (66%). Hydropower contributed 16% of TPES in the form of electricity (other renewables such as solar, wind and geothermal accounts for <1%), while bio-mass (mainly fuelwood) and coal accounts for the remaining 18% (Figure 6, Table 4).
Energy demand has been growing since the mid-1990s and projections expect this trend to continue increasing (+72% in 2030 from 2012 levels) due to rising GDP and larger household and commercial energy demand (IEA, 2015). Natural gas will satisfy a large portion of the increase in energy demand with the continuing gasification of residential, commercial, industry, and transport end-use sectors. These trends place further pressure on the energy security of Georgia, who import almost all their natu-ral gas and oil. In 2014-2015, Georgia only locally sourced approximately 30% of their fuel and energy
8 Percentage change since 1995 levels due to unavailable data.

UBA Climate Change Implementation of Nationally Determined Contributions - Georgia Country Report
20
needs and imported the rest from Russia, Azerbaijan and Armenia (Chomakhidze, 2016). With growing energy demands, Georgia also expects to see the share of imported energy increase overall (MoENRP, 2015).
In 2013 Georgia’s power plants generated approximately 10 TWh of electricity, with hydropower plants producing 80% of the electricity and thermal power stations produced the rest. This electricity genera-tion resulted in 0.95 MtCO2e of emissions (~6%), which fluctuates annually depending on the availabil-ity of hydropower resources. Renewables are further expected to grow to supply 23% of the nation’s energy by 2030 through additional hydro and wind developments. (MoENRP, 2015; NEEAP Expert Team, 2017; Winrock and Remissia, 2017).
Table 4 Georgia: 2014 TPES by fuel type
Fuel Value Unit Share in 2014
Biomass and waste 465 ktoe 11%
Solar, wind and other RE 1.8 ktoe <1%
Geothermal 15 ktoe <1%
Hydro 717 ktoe 16%
Gas 1,833 ktoe 42%
Oil 1,046 ktoe 24%
Coal 291 ktoe 7%
Data sources: (IEA, 2016c)
Figure 7 Georgia’s historical energy profile
Data sources: (IEA, 2016c)
UBA Climate Change Implementation of Nationally Determined Contributions - Georgia Country Report
21
2.2 Institutional setup Until the first quarter of 2018, the GoG contained 14 ministries, with the Ministry of Environment and Natural Resources Protection (MoENRP) as the primary institution responsible for implementing UN-FCCC and Kyoto targets as well as overall climate change legislation, policy and strategy through the coordination with key line ministries and entities. The Prime Minister of Georgia announced a govern-mental reshuffling at the end of 2017 aiming to improve government performance and efficiency. The reshuffling came into effect in June 2018, with the GoG condensing to 11 ministries. MoENRP has now merged with the Ministry of Agriculture to become the Ministry of Environment Protection and Agri-culture (MoEPA), which absorbs MoENRP’s previous climate-related responsibilities.
The new MoEPA consists of structural subdivisions, territorial authorities, state sub-agencies, and public state-directed legal entities. The Environment and Climate Change Department within MoEPA houses the Climate Change Division (CCD), who handles coordinating national-level climate mitigation and adaptation measures, directives from multilateral environmental agreements and developing the climate change chapter in National Environmental Action Plans (NEAP). The CCD continues coordina-tion for the preparation of major climate-related Georgian outputs to the UNFCCC, including NCs, NDCs and BURs, and the development of Georgia’s Climate Action Plan 2021-2030 along external stakehold-ers. MoEPA has also retained the Environmental Info and Education Center (EIEC), a public state-di-rected legal entity. Among other responsibilities, the EIEC coordinates with the CCD for the develop-ment of national GHG inventories. EIEC also collects and manages data and information from line min-istries, industries and other organizations (i.e. NGOs, research institutes) regarding GHG inventories and mitigation activities. The National Environmental Agency (NEA), another state-directed legal en-tity, disseminates warnings of expected natural disasters or cases of extreme environmental pollution and works with the CCD to implement long-term adaptation measures.
Other ministries contributing to climate-related projects are as follows (Figure 8):
• Ministry of Economy and Sustainable Development (MoESD): Georgia expanded MoESD’s working portfolio in the government reshuffling by assimilating the roles and responsibilities of the Ministry of Energy and MoESD. Subsequently, MoESD’s enhanced mandate covers eco-nomic policy planning and implementation; preparation of the Sustainable Development Strat-egy; development of the transport and logistic sectors; elaboration of policies, strategies and programmes in the energy sector; design and implementation of action plans for renewable energy development and energy efficiency measures; and coordination of the climate change and sustainable energy development topics in energy sector.
• Ministry of Labor, Health and Social Affairs (MoLHSA): MLHSA develops and manages state policies on health care, social health care, labor care and the medical and pharmacy sectors. The LEPL National Center for Disease Control and Public Health in MLHSA is working on the development of National Environment and Health Action Plan for 2018-2022, which considers climate change impacts on health and vulnerability.
• Ministry of Regional Development and Infrastructure (MoRDI): The goal of MoRDI is to imple-ment infrastructure projects with long-term benefits for local populations. MoRDI is also re-sponsible for the national waste management system and may take on responsibilities in transport sector strategy in the future.
• Ministry of Internal Affairs (MoIA): MoIA oversees policy and law enforcement in Georgia, which includes monitoring the adherence to law. In January 2018, the Prime Minister created the Emergency Management Service. It is expected that this unit will implement the recently adopted National Disaster Risk reduction strategy for Georgia 2017 -2020, which incorporates considerations for environmental degradation, climate change and natural disasters (MoIA, 2017).

UBA Climate Change Implementation of Nationally Determined Contributions - Georgia Country Report
22
• Ministry of Finance (MoF): MoF prepares the annual fiscal budget to reflect the main priorities of economic development of the country. MoEPA reports to the MoF regarding the financial re-sources coming from international donors for climate change-related projects. In addition, MoEPA requires MoF approval for any financial loans.
The Parliament Committee of Environmental Protection and Natural Resources is another key com-municating entity that handles drafting laws on various environmental sectors and reviewing legal documents initiated by government. The committee provides coordination between the cabinet of ministries and the Parliament of Georgia, which would help further develop the adequate legal instru-ments for implementing climate strategies and policies.
Figure 8 Institutional flowchart
Source: Authors’ and country expert’s elaboration
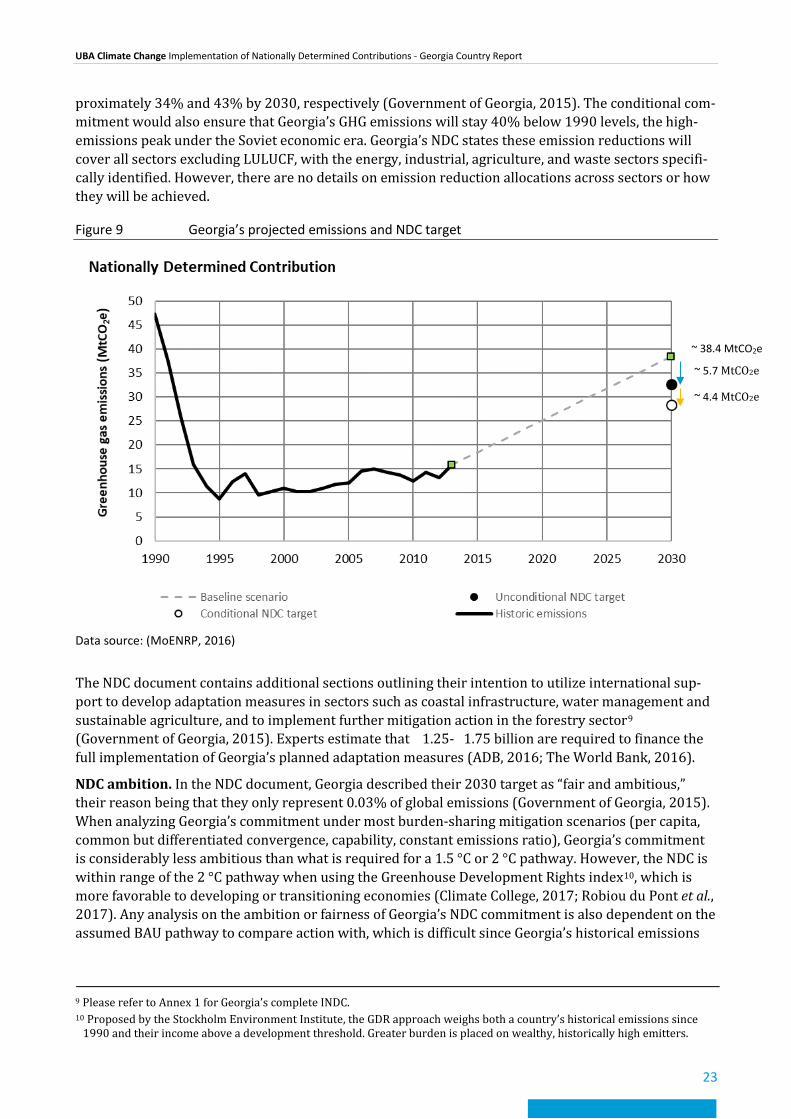
2.3 Description and Evaluation of the NDC NDC commitment. In their 1st NDC, Georgia presents their business-as-usual (BAU) pathway and makes an unconditional commitment to reduce GHG emissions by 15% below the pathway in 2030. The country also makes a conditional commitment to reduce emissions by 25% below BAU in 2030 (Government of Georgia, 2015, Figure 9). The latter is conditional on an international agreement to foster technical cooperation, as well as access to international financial resources and technology. These two commitments are equivalent to an emissions intensity reduction (per unit of GDP) of ap-
UBA Climate Change Implementation of Nationally Determined Contributions - Georgia Country Report
23
proximately 34% and 43% by 2030, respectively (Government of Georgia, 2015). The conditional com-mitment would also ensure that Georgia’s GHG emissions will stay 40% below 1990 levels, the high-emissions peak under the Soviet economic era. Georgia’s NDC states these emission reductions will cover all sectors excluding LULUCF, with the energy, industrial, agriculture, and waste sectors specifi-cally identified. However, there are no details on emission reduction allocations across sectors or how they will be achieved.
Figure 9 Georgia’s projected emissions and NDC target
Data source: (MoENRP, 2016)
The NDC document contains additional sections outlining their intention to utilize international sup-port to develop adaptation measures in sectors such as coastal infrastructure, water management and sustainable agriculture, and to implement further mitigation action in the forestry sector9 (Government of Georgia, 2015). Experts estimate that €1.25-€1.75 billion are required to finance the full implementation of Georgia’s planned adaptation measures (ADB, 2016; The World Bank, 2016).
NDC ambition. In the NDC document, Georgia described their 2030 target as “fair and ambitious,” their reason being that they only represent 0.03% of global emissions (Government of Georgia, 2015). When analyzing Georgia’s commitment under most burden-sharing mitigation scenarios (per capita, common but differentiated convergence, capability, constant emissions ratio), Georgia’s commitment is considerably less ambitious than what is required for a 1.5 °C or 2 °C pathway. However, the NDC is within range of the 2 °C pathway when using the Greenhouse Development Rights index10, which is more favorable to developing or transitioning economies (Climate College, 2017; Robiou du Pont et al., 2017). Any analysis on the ambition or fairness of Georgia’s NDC commitment is also dependent on the assumed BAU pathway to compare action with, which is difficult since Georgia’s historical emissions
9 Please refer to Annex 1 for Georgia’s complete INDC. 10 Proposed by the Stockholm Environment Institute, the GDR approach weighs both a country’s historical emissions since
1990 and their income above a development threshold. Greater burden is placed on wealthy, historically high emitters.
~ 38.4 MtCO2e
~ 5.7 MtCO2e
~ 4.4 MtCO2e

UBA Climate Change Implementation of Nationally Determined Contributions - Georgia Country Report
24
are not a useful indicator for assessing future trends (due to the frequency of external shocks from So-viet Union independence, ethnic/civil conflicts, global financial crisis).
Prior to the 2015 Paris Agreement, Georgia’s MoENRP worked with the support of the European Union (EU), the GIZ and other Georgian ministries to prepare the country’s NDC. The constructed NDC BAU pathway (38.4 MtCO2e in 2030) assumes there will be no mitigation policy implemented and is largely based on the preliminary results from LEDS. However, it is possible that Georgia’s NDC BAU pathway is at the high end.
The LEDS constructed BAU assumes 5.6% GDP growth annually whereas the NDC BAU assumes a larger growth rate for high-emitting sectors from 2018-2030, hence driving up the emissions baseline. While Georgia has experienced economic gains in many sectors over the last decade, other economic forecasts suggest Georgia’s growth may not be sustainable (World Bank, 2018a). If this is true, the NDC BAU could be overestimated. However, the LEDS BAU also assumes population growth to be 0% where even slight growth rates of 0.5% per year would increase BAU emissions by 2.7% in 2030 (Winrock and Remissia, 2017). While Georgia’s annual population growth rate was -2.5% in 1996 and -1.3% in 2014, the trend has stabilized since 2015 (World Bank, 2018b). If reversing population trends start increasing with overall GDP growth and rising income, the BAU emissions pathway may also be under-estimated. According to this model, total BAU emissions from all sectors accumulate to approximately 27.3 MtCO2e in 2030, rather than 38.4 MtCO2e as quoted in Georgia’s NDC. There is thus an approxi-mate 11.1 MtCO2e discrepancy between the two BAU’s, which influences the ambition levels for Geor-gia’s NDC as well as the scale of impact in country mitigation actions.
2.4 MRV of GHG Emissions Georgia’s previous measurement, reporting, and verification (MRV) efforts have consisted of elaborat-ing three National Communications and one Biennial Update Report (BUR) to the UNFCCC, along with their respective national inventories of GHG emissions. The country has also built upon MRV efforts with past experiences from MRV development in Clean Development Mechanism (CDM), National Ap-propriate Mitigation Actions (NAMA), and Covenant of Mayors (CoM) projects. MRV systems should seek to track progress of current emissions mitigation and development targets, inform future policy-making with data-based evidence, and provide an accurate and transparent country outlook for stake-holder decision-making at the domestic and international level (Winrock and Remissia, 2017).
While MoENRP has been responsible for finalizing all methodologies, guidelines, inventory templates, and standardized protocols for overall MRV processes in the past, MoEPA has now absorbed all MRV responsibilities. MoENRP had developed the national MRV structure with three main pillars: (i) MRV for the national GHG inventory; (ii) MRV for mitigation programmes and projects; and (iii) MRV for any external support received (Figure 10). The national GHG inventory is developed based on the data received from relevant state authorities, the National Statistics Office of Georgia (GeoStat) and the pri-vate sector (industry).
LEDS consultants also proposed a structural framework to further develop the MRV system for Geor-gia. Originally due to launch in summer 2018, this timeline is indefinitely postponed as the GoG is cur-rently revising LEDS for future implementation (Ministry of Environment and Natural Resources Protection of Georgia, 2016; Winrock and Remissia, 2017).
The proposed framework for MRV institutional arrangement and process is as follows:
1. Individual entities (i.e. municipalities, government institutions, private companies, NGOs) measure mitigation data before licensed third-party verification.
2. Entities send verified reports to the National Statistics Office of Georgia (Geostat) and the Envi-ronment Information and Education Center (EIEC), who further validate and analyze data, and draft monitoring reports (i.e. LEDS, Biennial Reports, National Communications).

UBA Climate Change Implementation of Nationally Determined Contributions - Georgia Country Report
25
3. MoEPA and the CCU to provide quality control and elaborate final monitoring reports for exter-nal dissemination.
For future steps, the involved organizations have identified a few key areas to improve and maintain the MRV system:
- Capacity: Since there are few MRV experts in Georgia, there is a need for qualified staff and in-ternational training for GHG inventories, mitigation analysis and process implementation.
- Legal: There is a need to issue a law or decree defining MRV processes and operational re-sponsibilities to improve political buy-in and coordination between stakeholders.
- Financial: The MRV system currently will need to be financed with international support due to limited government budget allocations. Keeping the system robust in the future would re-quire government funding to cover at least half the costs.
(GIZ, 2016; MoENRP, 2016; Winrock and Remissia, 2017)
Figure 10 Description of Domestic MRV
Source: Kakhaber Mdivani, MoEPA
NIRAS, an international consultancy, developed the ‘Draft Papers for Institutional Setup of Reporting Systems: Georgia’ consisting of a SWOT analysis of the existing MRV system in Georgia. Presented at the MRV Set-up Workshop in Tbilisi in September 2017, the analysis covers the technical, institutional and legal aspects of the system within the country. In summary, the document summarizes the neces-sity for an enlarged inter-ministerial and inter-institutional model for climate change activities, the strengthened capacity of the CCD and GeoStat and clearly defined roles and mandates to ensure fluid inter-sectoral coordination among entities involved in the MRV system in Georgia (Zarzo, Vardosanidze and Janashia, 2017).
2.5 Major climate change mitigation policies and strategies National strategies. GoG introduced the first piece of climate legislation in 1996 by adopting the Law of Georgia on Environmental Protection. The law highlights the importance of implementing cli-mate change mitigation and adaptation measures and seeks to implement standards related to GHG emissions. Although, there is explicit mention of these climate-related objectives in the law, the docu-ment does not provide any appropriate execution mechanisms.
UBA Climate Change Implementation of Nationally Determined Contributions - Georgia Country Report
26
Georgia has actively begun to prepare an integrated strategy on climate change recently. While previ-ous national environmental policies and institutions have mostly set up to tackle sustainable develop-ment issues on energy, agriculture and natural resource topics, the resulting Paris Agreement NDC and the EU-Georgia Association Agreement (EU-AA) have spurred Georgian action for climate strategy.
In the leadup to Georgia’s INDC submission, external technical consultants produced the LEDS report to outline emission mitigation potentials and pathways across all major sectors in Georgia. The EU-AA, seeking to deepen political ties and cooperation between the EU and Georgia in many fields, has sev-eral directives affecting climate targets (i.e. energy efficiency, transport, education, industry) and has led to accession to the Energy Community Treaty for an integrated European energy market. Another major result from the EU-AA is the development of Georgia’s first National Energy Efficiency Action Plan (NEEAP), which was developed by the Ministry of Energy (now MoESD) and external stakehold-ers to identify pathways in reducing Georgian dependence on energy imports, while also enhancing energy security through energy efficiency projects (NEEAP Expert Team, 2017).
Many significant climate-affecting policies in Georgia also target the issue of energy due to high priori-ties to achieve co-benefits in reducing energy import dependence. Early trend-setting policies, such as Georgia’s Law on Electricity and Natural Gas (adopted 1999, amended 2013) and Main Directions of Georgia’s State Energy Policy (2007) pushed Georgia onto a track of growing hydro, renewable, and natural gas development and sent strong policy signals by nationally prioritizing low-carbon fuel sources (Legislative Herald of Georgia, 1999; Ministry of Energy, 2007). Georgia 2020, a 2014-adopted government strategy focusing on long-run economic growth, has continued prioritizing action in renewable energy and energy efficiency as do subsequent reports such as LEDS and NEEAP (Government of Georgia, 2014).
Climate change adaptation is also a high-priority topic in Georgia. Many adopted national environmen-tal strategies, such as the National Environmental Action Programme (NEAP), National Adaptation Plan (agriculture) and the National Forestry Concept, thus focus mostly on climate vulnerability and impacts and are not considered mitigation strategies.
Still, other major climate strategies are under development. A Climate Action Plan (2021-2030) is currently in the process of development and will define the regulations, strategies, methods and ac-tions between different sectors to identify synergistic pathways to reach national climate targets (OECD, 2016). The document will inform Georgia’s 2020 NDC update and additionally detail plans for mitigation finance and monitoring as well as coordinate institutional responsibility for project imple-mentation (Day, 2018).
In collaboration with GIZ, MoESD are in the process of elaborating a Green Economy Strategy 2030 to continue the work of the Green Economy Action Plan (2017-2022). These strategies aim to green existing industries, encourage foreign direct investment in clean technologies, and employ other poli-cies to enable a structural shift towards a low-carbon economy while boosting income and employ-ment (OECD, 2017).
A National Renewable Energy Action Plan (NREAP) for the Renewable Energy Directive 2009/28/EC is also still in the works. Georgia’s NREAP will include national and sectoral targets for renewable shares in energy consumption, energy efficiency and clean-tech measures, and strategies in removing barriers for further renewable adoption (European Commission, 2009). However, progress has been slow since Georgia has no overarching legislation on renewables, which would drive the com-prehensive research and evaluations needed to develop the NREAP (Gachechiladze, 2016).
Municipal strategies. The most important driver of municipal mitigation action in Georgia is the Cov-enant of Mayors, (now Global Covenant of Mayors, GCoM) and their resulting Sustainable Energy Action Plans (SEAP). Twenty-three signatory municipalities in Georgia have currently signed onto GCoM, with priorities to reduce emissions, utilize a greater share of renewables and promote energy efficiency within territorial jurisdictions. As of 2017, 10 SEAPs from Georgian cities have resulted from

UBA Climate Change Implementation of Nationally Determined Contributions - Georgia Country Report
27
the GCoM initiative, defining concrete emission reduction targets of 20% for 2020 and to develop fur-ther strategies beyond.
Most notably, the capital city of Georgia has also developed two separate climate mitigation strategies. The Tbilisi Sustainable Urban Transport Strategy targets efficiencies in various transport modes, city livability and economic development, while the Green City Action Plan 2017-2030 prioritizes tasks for achieving a long-term vision of city greening (Jean-Manuel Giely, 2015; Tbilisi City Hall, 2017).
Georgia has also been preparing the implementation of four Nationally Appropriate Mitigation Ac-tions (NAMAs) involving sustainable forest management, low carbon energy-efficient buildings, sus-tainable development in rural areas and increasing hydro capacity, as well as an additional feasibility study in the urban transport sector. While the NAMAs were planned to start in 2015, only the “Adap-tive Sustainable Forest Management in Borjomi-Bakuriani Forest District” project has currently reached the implementation stage (UNFCCC, 2018). Identified barriers to NAMA implementation in-clude: knowledge constraints, inadequate data collection and data quality, inadequate integration of NAMAs into legislation and a young democratic government (Mdivani and Hoppe, 2016).
2.6 Additional mitigation potential To identify Georgia’s mitigation potential to reach the NDC and beyond, we reviewed major technical reports and literature associated with the country’s NDC preparation and future emissions outlook, drew knowledge from our in-country experience, and consulted local country experts. We built the foundation and analysis in this report by deriving data and information primarily from LEDS, the GHGs National Inventory of Georgia 2010-2013, BUR and NEEAP. LEDS outlines a mitigation potential of 8.1 MtCO2e per year across all sectors (excluding LULUCF) in 2030, assuming financing and political requirements are met. This is roughly half of the country’s total emissions in 2014 and 22% of their BAU pathway in 2030.
If referencing the NDC BAU (Figure 9), the LEDS-identified mitigation potential would overachieve Georgia’s unconditional commitment. Although the NDC BAU is largely based on preliminary data and modeling from the LEDS/MARKAL-Georgia model created by Remissia (a Georgian NGO focusing on sustainable development issues) there is a 11 MtCO2e discrepancy in 2030 between the LEDS and NDC BAUs. For comparison, if applying the NDC reduction targets to the LEDS BAU pathway, the identified mitigation potential could overshoot both the unconditional (4.1 MtCO2e) and conditional targets (6.8 MtCO2e) of 15% and 25% below the NDC BAU (Figure 11).
While GoG officially submitted the INDC in September 2015, Remissia (and international consultants) only produced the final draft of LEDS in September 2017. GoG thus only had access to preliminary LEDS data at the point of INDC submission but did not have access to the LEDS BAU, which Remissia developed after INDC submission. Furthermore, the two entities conducted the technical evaluations on emissions potential and abatement methods separately with different teams and methodologies.
We believe most of the discrepancy between the two constructed BAU pathways can be explained by a combination of several differences:
1) LEDS BAU includes net carbon-sink effects of LULUCF sector, whereas NDC excludes LU-LUCF.
2) Starting baseline emissions for 2014 differ slightly (on the order of 1 MtCO2e).
3) Accounting methods for geographical scope regarding the inclusion and accuracy of data from the autonomous regions South Ossetia and Abhkazia.
4) Accounting of fugitive methane leakage.
5) Different growth projections for emissions drivers (i.e – GDP and population).
UBA Climate Change Implementation of Nationally Determined Contributions - Georgia Country Report
28
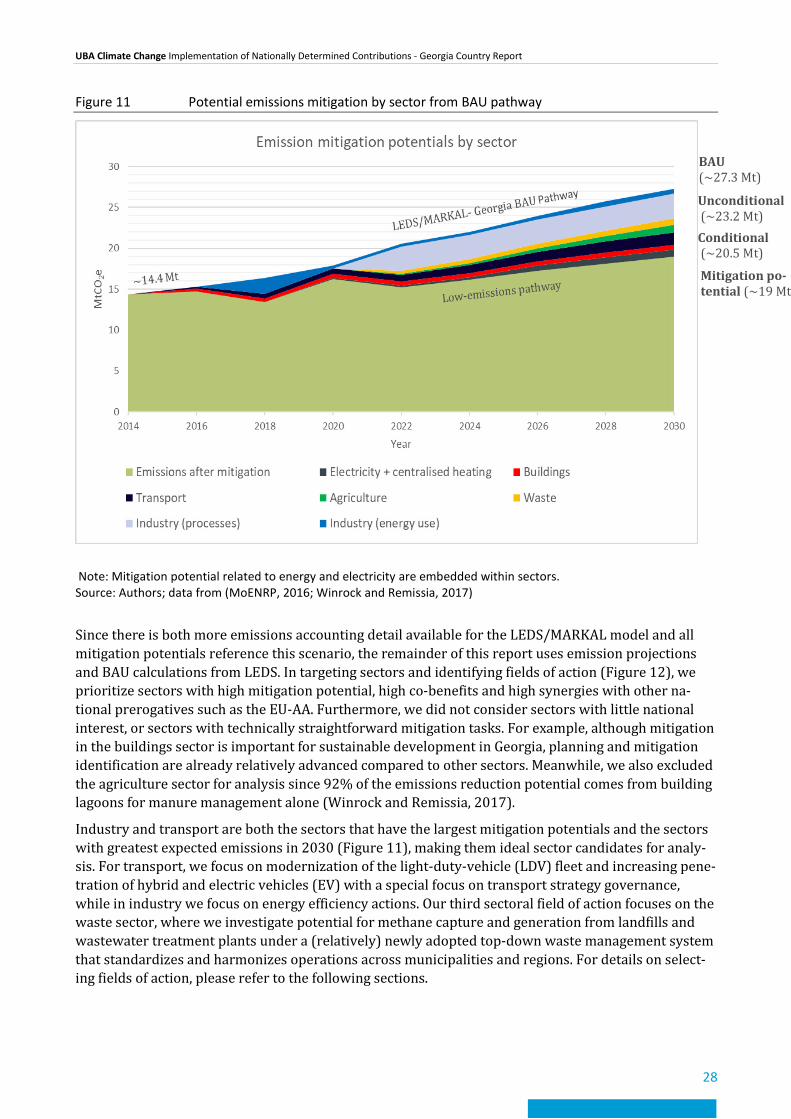
Figure 11 Potential emissions mitigation by sector from BAU pathway
Note: Mitigation potential related to energy and electricity are embedded within sectors. Source: Authors; data from (MoENRP, 2016; Winrock and Remissia, 2017)
Since there is both more emissions accounting detail available for the LEDS/MARKAL model and all mitigation potentials reference this scenario, the remainder of this report uses emission projections and BAU calculations from LEDS. In targeting sectors and identifying fields of action (Figure 12), we prioritize sectors with high mitigation potential, high co-benefits and high synergies with other na-tional prerogatives such as the EU-AA. Furthermore, we did not consider sectors with little national interest, or sectors with technically straightforward mitigation tasks. For example, although mitigation in the buildings sector is important for sustainable development in Georgia, planning and mitigation identification are already relatively advanced compared to other sectors. Meanwhile, we also excluded the agriculture sector for analysis since 92% of the emissions reduction potential comes from building lagoons for manure management alone (Winrock and Remissia, 2017).
Industry and transport are both the sectors that have the largest mitigation potentials and the sectors with greatest expected emissions in 2030 (Figure 11), making them ideal sector candidates for analy-sis. For transport, we focus on modernization of the light-duty-vehicle (LDV) fleet and increasing pene-tration of hybrid and electric vehicles (EV) with a special focus on transport strategy governance, while in industry we focus on energy efficiency actions. Our third sectoral field of action focuses on the waste sector, where we investigate potential for methane capture and generation from landfills and wastewater treatment plants under a (relatively) newly adopted top-down waste management system that standardizes and harmonizes operations across municipalities and regions. For details on select-ing fields of action, please refer to the following sections.
Unconditional (~23.2 Mt) Conditional (~20.5 Mt)
BAU (~27.3 Mt)
Mitigation po-tential (~19 Mt)

UBA Climate Change Implementation of Nationally Determined Contributions - Georgia Country Report
29
Figure 12 Selected fields of mitigation action
Notes: All sectors’ mitigation potentials include electricity consumption. Total emission values also exclude LULUCF, which were a net carbon sink of -4,134 ktCO2e. Source: Authors; data from (MoENRP, 2016; Winrock and Remissia, 2017)
2.6.1 Modernizing light-duty vehicle fleet and modal shift to public transport
2.6.1.1 Overview
Georgia’s transport sector is rapidly growing. Total transport sector emissions accounted for 23% of the country’s overall emissions in 2014 and has tripled since 2000. The country’s increase in transport emissions has been due to increases in car fleet size and energy use per capita, which have accompa-nied overall economic development and rising population incomes. Both energy consumption and GHG emissions in the sector are further projected to increase by 106% and 94% respectively by 2030 from 2013 levels respectively (Winrock and Remissia, 2017) .
Passenger transport activity accounts for most of Georgia’s transport sector’s energy consumption and emissions, with 28.16 billion passenger-kilometers (pkm) recorded in 2015 (7600 km per capita). Per capita values for pkm in Georgia are roughly half of those for EU countries and 30% less than those for Russia (ICCT, 2012). Passenger transport was responsible for approximately 63% of transport emis-sions in 2015 and its share is expected to increase in the medium term. The most energy and emis-sions-intensive form of passenger transport is the use of private light-duty vehicles (LDV), which cur-rently makes up 70% of overall passenger transport activity in 2015 and is projected to increase to 80% by 2030. Other forms of passenger transport include buses (15%), minibuses (13%), rail and metro (4%) and domestic aviation (2%) (Day et al., 2018).
While Georgia is highly dependent on private LDVs as a mode of transport, the fleet is outdated. Cur-rently, approximately 90% of the Georgian LDV fleet is over 10 years old and suffer from poor fuel effi-ciency standards and low safety ratings. Even among vehicles less than a decade old, most are second-hand vehicles from the EU or Russia and have similar issues. While the average emissions intensity for

UBA Climate Change Implementation of Nationally Determined Contributions - Georgia Country Report
30
Georgian private LDVs was 198.6 gCO2e/km in 2016, new LDVs in Europe had an intensity of 118.1 gCO2e/km with goals of reaching 95 gCO2e/km efficiency by 2021 (European Commission, 2018). Several EU countries are also planning to phase out conventional motor vehicles completely in line with a Paris-compatible pathway (IEA, 2016b). Currently, there is limited penetration of electric-ity and other fuel technologies in the transport sector in Georgia. Electricity only accounted for 1.7% of transport energy use in 2014 and virtually all of it was consumed by rail applications, which keep freight emissions low. Since the electricity grid has a low emissions intensity (depending on hydro availability), there is high decarbonization potential in electrifying the transport sector. While electric vehicle (EV) and hybrid vehicle penetration has grown by a factor of 10 between 2015-2017 (total of 328 EVs and 9,870 hybrids registered by 2017), their share of transport sector energy use is still negli-gible (Georgia Today, 2017). Conventional fuel sources such as diesel, gasoline, and natural gas sup-plied 91.8% of transport sector energy in 2014 (Table 5), with the share of compressed natural gas (CNG) expected to grow.
Table 5 Energy consumption in transport sector by end-use and fuel type in Georgia
Transport type Fuel type Energy consumption in 2014 (GWh)
% share in 2014
Road Diesel 5,991.9 38.8%
Road Gasoline 4,651.8 30.1%
Road Natural gas 3,429.1 22.2%11
Rail Electricity 266.8 1.7%
Rail Diesel 124.7 0.8%12
Aviation Kerosene jet fuel 973.4 6.3%13
Domestic navigation Diesel 8.2 0.1%
Total 15,445.8 100%
Source: Based on (GeoStat, 2014; NEEAP Expert Team, 2017)
The inefficient and pollution-intensive LDV fleet has serious implications for local ambient air pollu-tion and societal health. Georgia is listed as having the most dangerous levels of air pollution in the world, with almost 300 air pollution-related deaths per 100,000 people in 2012 (IEA, 2016a). As a comparison, that is double the mortality rates attributed to air pollution in India. While these figures include all forms of air pollution, a significant portion of Georgia’s urban air pollution results from the transport sector. In Tbilisi for example, Georgia’s capital, road transport accounts for 80% of the local air pollution (Karchkhadze, 2017). Modernizing the LDV fleet and creating a modal shift to greater shares for public transport will thus have high co-benefits in reducing pollution-induced externalities along with other co-benefits from Georgia’s Sustainable Development Goals (SDGs).
Policy. While there are many devolved entities and actors assigned policy responsibilities in the sec-tor, there is currently no overarching transport sector directive in Georgia nor a single institution charged with overall strategy. However, municipal actors have been active in developing green transport policy. The municipal-level Sustainable Energy Action Plans (SEAP), resulting from the Global Covenant of Mayors (GCoM), are the only official strategy documents outlining measures to op-timize the transport sector (Day et al., 2018). Municipality authorities have already begun implement-ing and planning 10 SEAPs, focusing on a few key targets:
11 Includes liquefied petroleum gases (0.2%). 12 Includes fuel oil-low sulphur (<0.1%). 13 Includes international aviation (6.2%) and domestic aviation (0.1%).
UBA Climate Change Implementation of Nationally Determined Contributions - Georgia Country Report
31
- Receiving and utilizing large public investments to electrify and modernize the public vehi-cle fleet in five major cities while increasing fleet size.
- Increasing walking, cycling, and moped transport in cities through developing infrastruc-ture (pedestrian bridges/crossings, cycling lanes) and behavior-nudging campaigns.
- Implementing restrictive measures on passenger LDVs such as stringent parking policies, to reduce LDV fleet volume (Government of Tbilisi City, 2011).
Other influential municipal-level strategies include the development of Sustainable Urban Mobility Plans (SUMP) for the city of Batumi, which aims to reduce pollution, energy consumption and GHG emissions from the transport sector (among others) and the Green City Action Plan for Tbilisi, which aims to modernize the public transport system and expand non-motorised transport.
At the national level, the 2016 Tax Law Amendment reduced excise taxes on hybrid vehicles by 60% and removing them for EVs altogether. Meanwhile, duties on other vehicles either remained un-changed or increased significantly (i.e. cars older than nine years).
In addition, several international technical support programmes are also in place to help sustainable transition. These include the Sustainable Low Emissions Transport Development, Green Cities and Ca-pacity Development for Climate Policy (CDCP) (Sims et al., 2014; NewClimate Institute, 2016; BPI, 2017).
2.6.1.2 Mitigation potential
While sector decarbonization studies in Georgia are not plentiful, there are several independent stud-ies with specific focus on potential mitigation measures in the transport sector. This report focuses on revamping the LDV fleet and improving the public transport sector due to the importance of passenger transport in overall emissions.
LDV fleet. While financial instruments are limiting new purchases of inefficient vehicles, the existing fleet remains outdated. LEDS proposes the conduction of vehicle tests for road-worthiness in line with EU-AA directives, since maintained vehicles are up to 7% more fuel efficient than vehicles in bad con-dition (UNEP, 2011). For example, low-quality fuels in the market frequently damage catalytic convert-ers of old vehicles, which are not adequately maintained or fixed. This leads to higher emissions per vehicle (Georgian Journal, 2016). Other EU-AA directives such as implementing speed limits, optimis-ing vehicle size dimensions and providing training for eco-driving, can result in overall estimated emissions reductions of 0.21 MtCO2e per year in 2030 (Winrock and Remissia, 2017).
However, there is capacity to further increase ambition here. Vehicle maintenance tests are currently only implemented for commercial and government vehicles but remain voluntary for passenger cars, which are responsible for most of urban transport emissions and overall traffic congestion. Imple-menting ownership taxes and acquisition taxes on old vehicles depending on their fuel economy (as opposed to the current tax on vehicle age and engine size) could yield greater efficiency and impact in improving LDV fuel standards. Implementing a labeling system for vehicles illustrating fuel economy ratings, such as the successful Fuel Economy Label programme14 implemented in the United Kingdom, may be a low-cost strategy to nudge LDV-consumer behavior in Georgia. Further implementing import bans on second-hand LDVs (tax incentives reducing imports are already implemented), as well as emission quality and fuel quality standards to the level of EU LDV fleets would increase mitigation im-pacts in the transport sector. These strategies are estimated to potentially help improve Georgia’s LDV fuel economy (gCO2e/km) by 26% over five years (Cuenot et al., 2014). However, reducing consumer burden would be a first-order concern for decision-makers since these policies are socially expensive.
14 The UK Fuel Economy Label contains information on the following: CO2e emissions of vehicle (g/km), vehicle fuel efficiency (litres per 100km), annual vehicle taxes depending on fuel emission intensity, vehicle and engine details and annual vehicle fuel costs.
UBA Climate Change Implementation of Nationally Determined Contributions - Georgia Country Report
32
Another important step in reducing emissions in passenger transport is to increase the penetrability of vehicles running on alternative fuels. While the imports of such vehicles are growing in Georgia, hy-brid penetration could increase even further if excise taxes were removed completely as in the case of EVs. For EVs, there were a total of 328 electric cars imported to Georgia by August 2017 with planned infrastructure development of 100 charging stations country-wide by the end of the year (Tbilisi City Hall, 2016; Georgia Today, 2017). While charging infrastructure development and the lack of excise taxes are paramount to EV adoption, studies have shown that additional financial incentives (i.e. regis-tration tax benefits, ownership tax benefits, company tax benefits, VAT benefits) are also needed to push widespread adoption (European Commission, 2012; Sierzchula et al., 2014). LEDS cites that in-creasing hybrid/EV penetration could reduce net annual emissions by 0.07 MtCO2e in 2030, with the assumptions that hybrids and EVs would take up 5% and 1% of the Georgian passenger fleet in 2030 (Winrock and Remissia, 2017). However, this anticipated growth can be considered conservative. Modeled aggregation projections for the EU estimate that the average market share of EVs in new ve-hicles sold to be 20% in 2030 for member states, while countries such as Norway, with natural EV adoption barriers in low population densities and long travel distances, grew the market share of elec-tric cars from zero to almost 30% in 10 years between 2006 and 2016 (Hagemann et al., forthcoming; IEA, 2017). While the national circumstances between Georgia and Norway are clearly different, the example illustrates the potential for rapid EV adoption in countries with small populations, good in-vestment and the right policy incentives. Meanwhile, a 1.5 °C compatible Paris Agreement pathway would require 100% of vehicles sold in 2035 to be zero-emissions (Climate Action Tracker, 2016).
Together, these actions for the LDV fleet represent an emissions reduction potential of 0.28 MtCO2e in 2030, which is 4% of overall transport sector emissions in 2030 (Winrock and Remissia, 2017). How-ever, the mitigation potential is likely to be underestimated, even accounting for slower pathways in decarbonizing the Georgian LDV fleet.
Public transport. Improving the quality and reliability of the passenger transport system is important in reducing emissions and volume of road transport. As of 2018, there has been no in-depth economic or technical studies for urban public road transport, non-motorized transport, or passenger railway in Georgia. Developing information systems to monitor passenger turnover statistics, intercity and in-tracity routes and the profitability of various transport modes are essential in developing a public transport system that is financially and operationally sustainable. With these assessments, sector stakeholders can optimize decisions in service enhancement and infrastructure investment. A more efficient public transport system is estimated to increase the passenger turnover for buses/minibuses and passenger rail by 10% and 9% respectively by 2030 due to higher public transport capacity and efficiency (Winrock International, 2016). Including other planned SEAP public transport measures, Georgia could achieve net emissions savings of 0.42 MtCO2e per year by 203015. In addition, regulation of the unsupervised taxi fleet expects to eventually take 50% of taxis out of operation. Although the impact will be offset by passengers shifting to other modes of transport, the policy expects to reduce emissions by 0.11 MtCO2e in 2030 since taxis cover five times more distance than private cars on aver-age (Winrock and Remissia, 2017).
These mitigation actions for LDVs and public transport combined would result in 0.81 MtCO2e of emis-sions reduction in 2030, which represents a 12% decrease from the projected transport sector emis-sions in 2030 (Winrock and Remissia, 2017). Factoring in other mitigation areas in the transport sec-tor, such as increasing freight railway turnover, overall sector emissions could be reduced by a total of 22.4% from BAU in 2030 (Winrock and Remissia, 2017). As mentioned before, this figure is likely to be underestimated.
15 This emissions calculation also includes the mitigation expected from the development of the Baku-Tbilisi-Kars Rail Line and a new metro station at Tbilisi University, which have already been implemented.
UBA Climate Change Implementation of Nationally Determined Contributions - Georgia Country Report
33
2.6.1.3 Barriers to implementation
Lack of institutional coordination. Policy concerning the transport sector are mostly fragmented among different levels of actors, with no national strategy nor institution charged with drafting one. While a devolution of responsibilities in strategy, planning and regulation could increase autonomy and efficiency, the absence of an overarching framework also inhibits synergy between planning objec-tives and provides little incentive for policymaking actors (ADB, 2014). Specifically, municipal govern-ments have taken a leading role in incorporating CO2 emissions reductions in transport sector but have no national policy guidance to align long-term plans to. For example, many municipalities have no incentives to update urban transport infrastructure, such as carrier stations and car service centers, because there are no regulations or laws requiring inspections or rest stops for heavy-duty vehicles. Furthermore, coordinating the financing of municipal projects is often a difficult political process since most international financial and technical assistance is provided to the national level, not municipali-ties. These are sources of great inefficiency since municipality jurisdictions are responsible for the highest share of transport sector emissions and have also been the most proactive in emissions mitiga-tion to date.
The effort to coordinate devolved transport actors would build upon recent efforts made during the development of Batumi’s SUMP, when the United Nations Development Programme (UNDP) gathered diverse transport stakeholders to propose a national transport strategy. The formation of a separate unit coordinating between national-level climate strategists (i.e. MoEPA or CCD), and various transport sector stakeholders (i.e. municipalities, other ministries, urban planners, private investors and entrepreneurs) can help align national long-term targets (i.e. NDCs, SDGs) with sector pathways, while allowing for the two-way knowledge transfer of policy impacts and sector support needs (Day et al., 2018). Stakeholders have so far initially explored the possibility of establishing a Sustainable Urban Transport (SUT) unit within MoESD or MoRDI, or involving multiple ministries and agencies. This unit would work with municipalities, local governments, NGOs and private sector representatives in achieving sustainable transport policies (UNDP, 2017).
Finance and infrastructure. Redeveloping the transport sector in Georgia will require substantive investments and require system-wide financing. In modernizing the LDV fleet, many potential mitiga-tion actions (i.e. road vehicle tests, taxing and replacing old vehicles) have labor-intensive regulatory costs. Since many of these measures do not specifically fall into the category of energy efficiency, it re-mains to be seen whether overseas development assistance can provide support, or if these measures are prioritized in the national budget. The high price and risk associated with alternate vehicles slows down the adoption of both hybrids and EVs for importers and consumers, and the lack of infrastruc-ture and expertise on the ground lowers technological confidence. Developing financial mechanisms to provide insurance and loan schemes for hybrid/EV importers are important to alleviate entrepreneur-ial risk, while investment is also needed to correct market scarcities for technical specialists and spare parts (to avoid inefficiency and long waiting times in maintenance and repair). Infrastructure develop-ment projects are particularly vital for widespread EV adoption, as there is currently a shortage in Georgia for service centers, public charging stations, quick chargers on main highways, designated EV parking areas and technological solutions for charging at home (Winrock and Remissia, 2017; E-Space, 2018).
The fuel transition from diesel to gas or electricity for public urban buses/minibuses is also con-strained by inadequate infrastructure (i.e. bus stops, municipal depots), a lack of technical expertise and a lack of technological capacity. The absence of comprehensive economic studies in the sector hin-ders the smart targeted financial investments needed to optimize public transport service quality and reliability while developing the system to a financially sustainable threshold. Georgia’s lack of interna-tional railway transit routes, typically an important source of revenue for state-owned rail systems, also represents a foregone resource that could support inner and intra-city rail. While the monumental regional Baku-I-Kars Rail Line came online in 2017, costing Georgia approximately 775 million USD,
UBA Climate Change Implementation of Nationally Determined Contributions - Georgia Country Report
34
international transit routes are still underdeveloped due to defective infrastructure and topographical challenges (Shahbazov, 2017; Winrock International, 2017). Given the enormous costs associated with developing railway infrastructure, finance and strategic planning are paramount to developing the passenger rail sector on a city and national scale.
2.6.2 Implementing energy efficiency opportunities across high-emitting industry sub-sectors
2.6.2.1 Overview
Georgian industry collapsed in the aftermath of the Soviet Union’s dissolution, where the country re-ceived inadequate and unreliable supplies of raw materials and energy resources. The country’s indus-trial sector has since rebounded and now accounts for 16.9% of Georgia’s GDP, second only to trade, and 18.7% of Georgia’s final energy consumption (Winrock and Remissia, 2017). In 2015, 6,684 indus-trial enterprises16 were registered in Georgia, with 83% consisting of small enterprises and the re-maining split relatively evenly between large and medium enterprises17.
Energy and emission metrics in the industrial sector can be broadly divided into two divisions – indus-trial ‘energy-use’ and industrial ‘processes’. Whereas the energy-use division includes direct combus-tion of fuels and emissions generated from fuel combustion to power facilities, emissions from indus-trial processes come from the specific production of materials and goods, e.g. CO2 emissions that arise from the chemical reaction during cement production.
Together, industry (energy use and processes) is the largest emitting sector now and in the foreseea-ble future for Georgia, accounting for ~4 MtCO2e in 2014 with a projected rise to 7.8 MtCO2e by 2030, both of which represent roughly 28% of overall emissions in their respective years (Winrock and Remissia, 2017). Emissions and energy consumption from industrial energy-use was 1.64 MtCO2e in 2014, which was considerably lower than the 2.31 MtCO2e used in industrial processes. However, this report focuses on mitigation potential in the energy-use division for several reasons:
• Faster emissions growth rate: the projected BAU trend in energy-use emissions rises faster than for processes. The two divisions are expected to be virtually even by 2030 and energy-use emissions are expected to surpass processes thereafter as the former is directly correlated to GDP growth.
• Low-cost abatement opportunities: many energy efficiency projects within industry typi-cally represent ‘low-hanging fruit’ with zero or negative cost emissions abatement. Energy effi-ciency is also more attractive politically and financially since they come with identifiable pay-back periods on short timescales.
• Close linkages: energy efficiency improvements and fuel-switching projects in the energy-use sector will also have emissions-reducing spillover effects in production processes.
• Co-benefits: energy efficiency and fuel-switching projects contribute to improving energy in-dependence and decreasing air pollution for Georgia, while cost-efficiency gains boost indus-trial productivity, which in turn can benefit unemployment, income and GDP.
While the Georgian industry sector contains many subsectors, four specific sub-sectors cover 89% of industrial energy consumption and 98% of industrial GHG emissions (Figure 13). This report mainly focuses on mitigation potential in these high-emitting industry sub-sectors while also considering other economically important sub-sectors including construction, mining, machinery and wood.
In the Non-Metallic Mineral Products sub-sector, the main energy-use emissions source comes from coal consumption to produce clinker for cement. For the Iron and Steel sector, the main energy-use
16 Excluding construction sector. 17 Large enterprises employed more than 100 persons and had an annual average turnover of 1.5 million GEL, while small
enterprises employed less than 20 persons and had an annual average turnover of 0.5 million GEL or less.
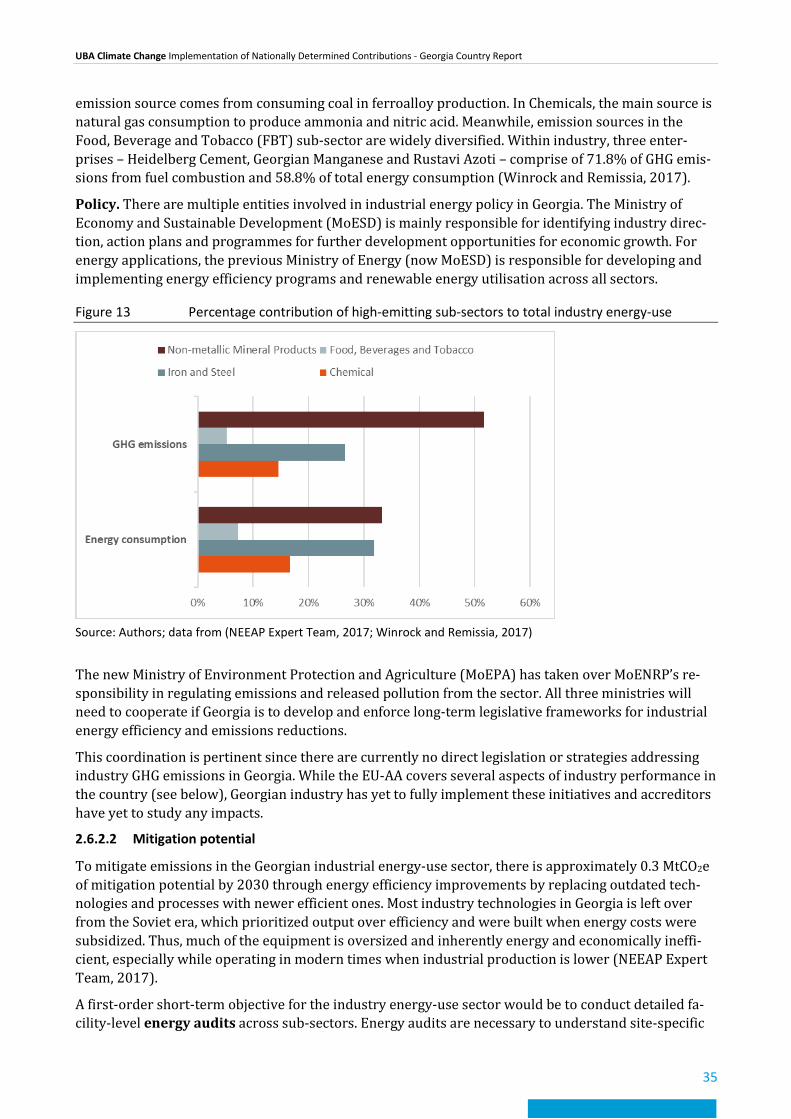
UBA Climate Change Implementation of Nationally Determined Contributions - Georgia Country Report
35
emission source comes from consuming coal in ferroalloy production. In Chemicals, the main source is natural gas consumption to produce ammonia and nitric acid. Meanwhile, emission sources in the Food, Beverage and Tobacco (FBT) sub-sector are widely diversified. Within industry, three enter-prises – Heidelberg Cement, Georgian Manganese and Rustavi Azoti – comprise of 71.8% of GHG emis-sions from fuel combustion and 58.8% of total energy consumption (Winrock and Remissia, 2017).
Policy. There are multiple entities involved in industrial energy policy in Georgia. The Ministry of Economy and Sustainable Development (MoESD) is mainly responsible for identifying industry direc-tion, action plans and programmes for further development opportunities for economic growth. For energy applications, the previous Ministry of Energy (now MoESD) is responsible for developing and implementing energy efficiency programs and renewable energy utilisation across all sectors.
Figure 13 Percentage contribution of high-emitting sub-sectors to total industry energy-use
Source: Authors; data from (NEEAP Expert Team, 2017; Winrock and Remissia, 2017)
The new Ministry of Environment Protection and Agriculture (MoEPA) has taken over MoENRP’s re-sponsibility in regulating emissions and released pollution from the sector. All three ministries will need to cooperate if Georgia is to develop and enforce long-term legislative frameworks for industrial energy efficiency and emissions reductions.
This coordination is pertinent since there are currently no direct legislation or strategies addressing industry GHG emissions in Georgia. While the EU-AA covers several aspects of industry performance in the country (see below), Georgian industry has yet to fully implement these initiatives and accreditors have yet to study any impacts.
2.6.2.2 Mitigation potential
To mitigate emissions in the Georgian industrial energy-use sector, there is approximately 0.3 MtCO2e of mitigation potential by 2030 through energy efficiency improvements by replacing outdated tech-nologies and processes with newer efficient ones. Most industry technologies in Georgia is left over from the Soviet era, which prioritized output over efficiency and were built when energy costs were subsidized. Thus, much of the equipment is oversized and inherently energy and economically ineffi-cient, especially while operating in modern times when industrial production is lower (NEEAP Expert Team, 2017).
A first-order short-term objective for the industry energy-use sector would be to conduct detailed fa-cility-level energy audits across sub-sectors. Energy audits are necessary to understand site-specific
UBA Climate Change Implementation of Nationally Determined Contributions - Georgia Country Report
36
energy consumption patterns and identify opportunities for Best Available Techniques (BAT) inte-gration for industrial energy technology, management and control, as well as for the elimination of poor practices. Under the EU Energy Efficiency Directive (EU EED), audits are mandatory for large en-terprises in member states. Georgia could follow suit given that a large percentage of industry emis-sions come from the activity of three large enterprises. There is thus a potential for high-impact and systemic change if audits can identify and lead to implementation of cost and energy-saving methods. NEEAP estimates that improved energy auditing can help save 432 GWh in 2025 through ‘bounded ra-tionality’ effects and energy management changes, even without accounting for the presumed techno-logical improvements that follow.
There are case-study examples where EU EED-driven directives have led to good practices in countries such as Croatia and Slovakia18, which are countries similar to Georgia in terms of socioeconomic and energy-use indicators (albeit more developed). Even before EU EED, Croatia experienced average neg-ative annual growth rates of -1.6% in total industry energy consumption from 2000-2013 while Slo-vakia reduced their energy intensity in the manufacturing industry by 8.7% per year between 2001 and 2010 due to energy efficiency improvements. Both countries have since placed mandatory energy audits for enterprises (Odyssee-Mure, 2018). Slovakia has also begun implementing BAT measures de-rived from energy audits, which produced estimated energy savings of ~1 PJ from 2011-2013 alone and accounted for 43% of their entire planned industrial energy savings (Slovakia 3rd NEEAP, 2014). Croatia has also implemented additional BAT recommendations that are suitable for Georgia, including combined heat power projects at facilities and energy-efficient motors at the facility level. Croatia has also implemented sector-wide emission fees, which may play a part in Georgia’s long term decarboni-zation plans.
In terms of technical improvements, previous surveys of Georgian industry sub-sectors identified many cross-sectoral energy efficiency improvement opportunities (NEEAP Expert Team, 2017; Winrock and Remissia, 2017). Replacing old, inefficient and over-sized technologies are a primary con-cern applicable to all sub-sectors. The most important technologies with cross-sectoral impact needing upgrades include boilers and steam/hot water distribution systems, motors, refrigeration units and lighting.
Georgian industry surveys suggest that upgrading of boilers and steam/hot water systems in facili-ties, most of which are over 20 years old, would incur virtually no economic costs (NEEAP Expert Team, 2017). Steam and hot water generation typically accounts for 80-90% of fossil fuel consumption in the FBT, chemicals, and paper industries. The steam/hot water distribution systems in facilities are also outdated, with low thermal insulation and frequent leakages. Generic energy savings for improved boilers and distributions systems are estimated to be 25% and 20% respectively, while payback peri-ods are typically three years for boilers and one for distribution (NEEAP Expert Team, 2017). Motors used to operate facility processes (i.e. conveyors, compressors, pumps) consume up to 60% of electric-ity for many sub-sectors, are inefficient, oversized and have typically not been managed efficiently in their end-use. Energy efficiency upgrades for refrigeration systems can reduce the energy used on refrigeration by 30% in the FBT and chemicals sub-sectors, while low-efficiency lighting is pervasive in Georgian industry and accounts for approximately 10% of electricity consumption. As most facilities use inefficient models such as incandescent filament or High Intensity Discharge lighting with poor en-ergy practices, long-term no-cost energy savings of up to 90% could be possible through replacement with T5 or LED lights and implementing energy management BATs. Upgrades to these four technolo-gies alone can reduce industry energy-use emissions by 0.286 MtCO2e in 2030, which is approxi-mately 40% of identified mitigation potential in the sector (NEEAP Expert Team, 2017; Winrock and Remissia, 2017; Table 6).
18 Countries such as Austria, Czech Republic, Finland, Germany, Netherlands, and Sweden are also good examples of EED suc-cess. (European Commission, 2015)

UBA Climate Change Implementation of Nationally Determined Contributions - Georgia Country Report
37
Of the four highest-polluting sub-sectors, the reduction of coal use in clinker production for cement has the highest potential for mitigation action. Two large Heidelberg cement plants, Kaspi and Rustavi, currently use the wet-kiln process (1.26-62 MWh brown coal/tonne of clinker) to produce clinker in-stead of a more energy efficient dry method (0.92 MWh/tonne). This conversion can reduce coal
Table 6 Expected energy and GHG savings in 2030 from cross-sectoral technology upgrades
Technology type to be upgraded Final cumulative energy savings in 2030 (GWh)
GHG savings expected in 2030 (MtCO2e)
Boilers and steam/hot water distribu-tions
341.2 0.075
Motors 254.2 0.089
Refrigeration systems 24.1 0.008
Lighting 325.8 0.114
Total 945.3 0.286
Source: based on (NEEAP Expert Team, 2017)
intensity in the fuel mix by 50% in both plants, which are expected to continue increasing annual pro-duction into the future. This coal intensity reduction can save 4.3 PJ of coal combustion and 0.41 MtCO2e of emissions in 2030 (Winrock and Remissia, 2017). A further significant mitigation is possible in the Georgian iron and steel sector, where coke intensity per ton of ferroalloys produced is over 30% higher than international norms. An initial goal to reduce coke intensity by 20%, for in-stance, would yield an additional 0.14 MtCO2e in emissions reduction (NEEAP Expert Team, 2017).
2.6.2.3 Barriers to implementation
Lack of incentives. Enterprises (not only in Georgia) typically do not autonomously implement en-ergy-saving projects unless the policy environment coerces them to invest upfront capital costs (for example, if the payback period is one to two years). This is the case in Georgia, where both emissions regulation and financing opportunities are not optimal for driving energy efficiency technologies.
Given that industrial energy-use is projected to rise with GDP, it is vital to start developing more ambi-tious sector-wide regulatory instruments to spur low-emissions growth in the long-run. Typical indus-try-emission regulatory policy options include: 1) a mandatory emissions cap for industry sub-sectors or enterprises, 2) a permit trading system allowing mitigating firms to sell excess ‘emission allow-ances’ to high-polluting firms with higher mitigation costs, or 3) a directive taxing energy consumption or emissions on enterprises. A combination or hybrid of such instruments is also possible depending whether priorities lie in achieving absolute emissions reductions or achieving economic efficiency in those reductions (Weitzman, 1975). These instruments are examples of policy that cause enterprises to unilaterally seek least-cost pathways to lower emissions and adopt energy efficient technologies, albeit at different cost and effectiveness levels.
If Georgian industry is to further reduce emissions and embrace clean development in the future, poli-cymakers will need to have the full cooperation and engagement of industry stakeholders to ensure that mechanisms will have a positive long-term effect for the Georgian economy while preventing car-bon leakage and capital flight at the same time.
Another significant constraint on implementing energy efficiency projects in industry is a scarcity of financial investment. From 2017 to 2030, upper estimates for gross investment needs in energy effi-ciency projects range between USD 8.3-10.6 billion. However, Georgia’s economy has been insufficient to produce adequate internal resources for investment and domestic financial institutions are also un-able to help support. There are also limited opportunities for private enterprises (especially SMEs) to
UBA Climate Change Implementation of Nationally Determined Contributions - Georgia Country Report
38
borrow for energy efficiency investments at a low cost due to the high collateral requirement for com-mercial banks (approximately 220% of loan value). Commercial bank loans for energy projects pri-marily target hydropower, which absorbs most energy-related climate finance in Georgia. While the abovementioned implementation of strong emission regulations policy would send signals for private investors to get involved in energy efficiency, it is also important to create favorable conditions for long-term loans at low interest rates (OECD, 2017).
Lack of technical expertise. There is currently a scarcity of energy-efficiency expertise in Georgia. Surveys suggest that Georgian enterprises are driven primarily by productivity with little knowledge or awareness of energy techniques and that this trend is amplified in SMEs. Like in other Georgian sec-tors, policymakers need to implement programmes to enhance the capacity building of technical ex-pertise in energy efficiency. The implementation of increasingly stringent energy policy measures and technical energy audits will naturally raise demand for training and education in energy management and certification schemes (NEEAP Expert Team, 2017). To capture the full potential of energy effi-ciency technology applications, MoESD need to ensure supply can satisfy this demand to raise overall technical expertise on industrial energy optimization. Building expertise capacity in this field can en-hance cross-sectoral multiplier effects for energy and emissions-saving in the future.
2.6.3 Increase rates of methane capture and utilization from landfills and wastewater facilities
2.6.3.1 Overview
Waste management in Georgia has been historically inefficient. To improve the national waste man-agement system, the GoG created the Solid Waste Management Company of Georgia (SWMCG), which is 100% state-owned within MoRDI. This new national management system is expected to increase GHG emissions inventories due to more robust accounting of waste emissions, in part helped by better collection and management of waste, as well as greater methane emissions from regional landfills. SWMCG’s plans to condense municipal waste into regional landfills (increasing mass and pressure) will lead to greater anaerobic conditions for waste decomposition and thus, increased generation of methane gas, which has 28 times the global warming potential (GWP) of CO2 over 100 years19. Thus, we choose to analyse the waste sector, looking at the mitigation potential of methane capture and utili-sation, both due to the national waste management changes and the expected increase in methane generation.
The Georgian waste sector emitted almost 1.3 MtCO2e in 2013, which represents the lowest sector share of overall country emissions at approximately 7%. Of these emissions, 93% came from methane gas release and the remainder from nitrous oxide (Winrock and Remissia, 2017). Although Georgia’s waste sector GHG inventory includes solid waste disposal, wastewater treatment and discharge, bio treatment of solid waste, and incineration/open burning, only the first two categories are significant sources of emissions (there is also currently no bio treatment of solid waste in Georgia). Solid waste disposal accounts for almost three-quarters of waste sector emissions while wastewater accounts for the remaining quarter. While the waste sector does not take a large share of national emissions, emis-sions increased by 22% from 2000-2014 and are projected for further growth through 2030 (1.5-1.720 MtCO2e) due to a rising GDP and population. Both GDP and population are typical drivers for increas-ing solid waste emissions but also individually drive increases in industrial and domestic wastewater emissions respectively (Winrock and Remissia, 2017).
In 2015, only four of 56 nationwide landfills followed international standards. Waste collection ser-vices were only accessible in big cities and rural processes were unstandardized and ineffective. There
19 GWP value from (IPCC, 2014) 20 The upper emissions range incorporates assumptions of increasing rates of solid waste collection and wastewater dis-
charge through 2030.
UBA Climate Change Implementation of Nationally Determined Contributions - Georgia Country Report
39
was also no division for special waste types and hazardous waste was dumped in open solid waste landfills. Waste management taxes were inadequate, and officials were also unable to collect tax avoid-ance penalties (MATSNE, 2016). SWMCG took ownership of 54 municipal landfills starting from 2013, with the intention of regulating the waste sector nationwide (with exceptions to Adjara and Tbilisi21). Guided by the European Waste Directive starting in 2019, SWMCG’s priorities involves the rehabilita-tion and closing of old landfills, constructing new regional landfills and increasing rates of waste sepa-ration and recycling. To date, SWMCG have rehabilitated 30 landfills and closed 21. The company’s goal is to eventually construct 8-10 regional landfills to serve 68 municipalities and 65% of the county’s population. The first regional landfill (Imereti and Racha Lechkhumi/Kvemo Svaneti) is due for completion in 2019, serving 16 municipalities and 700,000 people. In this new national manage-ment system, municipalities are charged with waste collection and delivering it to regional transfer stations. SWMCG will then collect waste from these transfer stations and dispose of them in the large regional landfills (SWMCG, 2018).
Policy. Georgia’s Waste Management Code, established in 2015, provided a general framework for further elaboration on the National Waste Management Strategy 2016-2030 and National Waste Management Action Plan 2016-2020, which GoG adopted in 2016. These waste sector policy strate-gies primarily prioritize harmonization with EU-AA waste management frameworks. This involves SWMCG’s continuous efforts to revamp or close existing landfills in compliance with international standards while developing a more efficient national waste management system. An additional policy objective is to develop comprehensive cost-studies of waste collection and waste management plans at the municipal level and introduce separate collection systems for municipal waste starting 2019. A sig-nificant input in the law is the explicit intent to install a ‘polluters pay’ principle, where large waste producers would absorb direct burden for their own waste collection, separation and processing.
The SWMCG is also coordinating with municipalities in the preparation of a Municipal and Waste Management Action Plan, which aims to serve as a guideline for Georgian municipalities in develop-ing operational standards for collecting and processing household waste according to international practice standards (USAID, 2015).
However, neither the Waste Management Code nor previous solid waste management laws require any methane reduction from landfills (MATSNE, 2016). Previously, countries with methane capture regulations in their country legislation were ineligible for Clean Development Mechanism (CDM) pro-jects. While this may have been a barrier to methane regulations in the past, this should no longer be a factor since the programme terminates in 2020.
2.6.3.2 Mitigation potential
Methane capture and utilization is typically one of the most cost-effective methods of GHG emissions reduction for the energy sector and is an attractive option for developing regions with expanding pop-ulations and methane-conducive waste management systems (IEA, 2009). Methane technologies are typically implemented to capture landfill gas (LFG) from landfills (40-60% methane (CH4)) and me-thane-rich biogas from wastewater products. After capture, the cheapest and most common mitigation action is to flare the gas, which lowers the GWP of emissions by converting methane to carbon dioxide. However, waste facilities can also utilize methane gas to either generate power for direct facility con-sumption or to feed into local distribution systems as electricity or natural gas. High-grade gas can also be used as CNG for an alternative vehicle fuel.
Gas capture and utilization is more advantageous (albeit more expensive) than flaring since the cap-tured gas offsets the need to extract energy resources elsewhere. This can have two benefits as the
21 The Adjara Autonomous Region have decided to operate their own waste management system, although intermunicipal cooperation with MoRDI are possible. The Tbilisi municipality will manage their own regional landfill, which will serve the largest share of Georgian citizens (SWMCG, 2016).

UBA Climate Change Implementation of Nationally Determined Contributions - Georgia Country Report
40
technology both captures the gas (preventing emissions into the atmosphere) and uses it for energy consumption (which offsets the need to produce the energy elsewhere, possibly through fossil fuel combustion or burning wood/biomass). In addition to the emission and energy benefits, methane cap-ture could have positive benefits in reducing air pollution and improving local safety (by reducing fugi-tive methane). Furthermore, once the technology is implemented, the utilized gas becomes a ‘free’ source of continuous energy which could improve economic growth and energy security.
Independent studies in Georgia have explored developing capture and flare projects for major existing municipal landfills (Tbilisi, Adjara, Rustavi, Kutaisi, Tlavi and Borjomi), along with new regional land-fills and the Adlia and Gardabani wastewater treatment plants. Assuming 80% capture and flare at these sites (the remainder is either unusable or leaked) these actions would reduce waste emissions by 0.36 MtCO2e (0.017 MtCH4)22(Winrock and Remissia, 2017). However, utilisation projects would yield additional mitigation potential with especially high impacts when implemented for regional solid waste systems. While implementing in regional landfills would bring greater cost-efficiency (more waste) and capture more LFG, studies on the Adlia wastewater treatment plant found that just 50% of the methane captured from the facility would be sufficient to satisfy the facility’s 1.3 GWh electricity demands (Winrock and Remissia, 2017), suggesting a negative-cost scenario for wastewater plants.
While there are numerous successful case studies for LFG capture and use projects, these projects are site-specific, and results can only be taken as an approximated figure to infer orders of magnitude. The closed Mariupol Landfill in Ukraine, which serves a population with similar GDP/capita (a proxy for waste generation) to Georgia as well as an overall population similar to what a regional landfill would serve in Georgia, results in emissions reductions of 0.04-0.075 MtCO2e annually and expects to gener-ate 1.25 MW of electricity23 (Global Methane Initiative, 2012). Assuming the average grid emission fac-tor of 0.115 tCO2 per MWh across nine new regional Georgia landfills, additional electricity generation offsets would be in the region of 500 tCO2e reduced. While this mitigation potential is not substantial, it may still be a useful long-term technical measure since the project only requires upfront capital costs and possesses increasing marginal returns over time (with greater expected waste accumula-tion). This is only a second-best outcome, however, as the accumulation of waste should not be consid-ered an incentive for sustainable development.
2.6.3.3 Barriers to implementation
Law and regulation. The major barrier to methane capture and utilisation in the waste sector is the absence of any legal decrees or national environmental regulation/policy signals. Without an outlined framework for managing methane emissions, the implementation of methane capture and utilization technologies faces many barriers in financing, technical expertise and actor motivation. In a rapidly growing waste sector such as Georgia’s, there is typically little attention or prioritization paid to the economic benefits and emissions/pollution reduction potential in gas capture and utilisation. This is evident from the absence of any mention for methane emissions in the Waste Management Code nor in SWMCG’s main objectives (IEA, 2009; MATSNE, 2015).
Georgian actors (SWMCG, MoRDI, municipalities) have little expertise in implementing and managing modern waste technologies and have depended mostly on foreign technology and case-by-case foreign consulting expertise in the past. This erodes Georgia’s ability to retain the domestic knowledge needed for system-wide implementation and maintenance in methane gas management at landfills and wastewater plants. The scarcity in domestic experts would naturally improve with increased demand, but the appropriate policy tools must be in place to enable the process.
22 Does not include capture and flare estimates for the Gardabani wastewater treatment plant. 23 See report for other examples of successful landfill gas capture projects for flaring, electricity generation and gas distribu-
tion.
UBA Climate Change Implementation of Nationally Determined Contributions - Georgia Country Report
41
Currently, there are also no economic or profitability studies for utilizing landfill gas in Georgia, mak-ing it difficult for financial investment. With a previously disaggregated and mismanaged waste sys-tem, there is higher risk and uncertainty in estimating LFG potential from the waste sector, inhibiting the push needed for the technology. External investors and private sector entities can play a role in boosting finance for these methane capture and utilisation projects but may refrain unless the technol-ogy is shown to be profitable in Georgia. However, this is difficult since the economic feasibility of the technology is different according to each site. While ascertaining cost-effectiveness for wastewater treatment plants is more straightforward, Georgia’s regional and municipal landfill sites differ in both environmental and technological conditions for the generation and capture of LFG and the connecting to regional electric grids and natural gas pipelines.
An additional problem is that Georgia’s new waste management system is yet to be fully operational. Thus, it will likely take many years after the development of the regional landfills for accurate applica-tion of feasibility and cost-effectiveness studies and even longer for realization of payback mecha-nisms. However, cost estimations for setting up methane gas capture and flaring technologies in Geor-gia’s landfills and wastewater plants are relatively cheap at approximately €13 million, while imple-menting further distribution technologies for gas utilisation could cost an additional €8 million (Winrock and Remissia, 2017).
3 Conclusion Georgia has actively begun increasing their commitment towards climate change mitigation and build-ing capacity in environmental institutions recently, although there is still much room for further im-provement. While Georgia is clearly showing initiative in the field through establishment of their legis-lative trends and institutional framework, the preparation stage for establishing solid roadmaps to-wards meeting their NDC target is young.
Georgia’s current policies scenario is underdeveloped and it is expected that GoG’s main references for achieving their NDC target will emerge in the upcoming years (LEDS revision, Climate Action Plan). Previous results from assessing Georgia’s mitigation potential shows there is an emissions reduction potential of at least 8.1 MtCO2e across the sectors by 2030. This would allow Georgia to meet their con-ditional NDC commitment but not their unconditional commitment.
In the transport sector, modernizing the LDV fleet to improve the emissions-intensity of passenger transport and increasing the penetration of low-emission vehicles are a high priority. This approach can also be combined with reducing LDV activity in general through an improvement of the service and quality of the urban public transport sector to encourage a modal shift to public transit. These ob-jectives have the potential to reduce emissions on the order of ~0.82MtCO2e by 2030, although this figure is likely underestimated. The reduction of LDV activity and shift to public transport will also have co-benefits in decreasing air pollution, which is important since Georgia has one of the most dan-gerous rates of urban air pollution in the world.
The Georgian industry sector also carries potential to decarbonize by setting up a robust energy audit and BAT system to assess cost-effective energy efficiency projects. This system can both modernize the industry and set up the foundation for green growth into the future. For example, these audits would aid the objective to replace polluting, inefficient, and over-sized technologies, which have been left over from the Soviet industrial era and are outdated. While these energy efficiency measures are on relatively small order of ~0.84 MtCO2e, they are considered low-hanging fruit for the industry sector, which will be the highest emitting sector by 2030.
The waste sector has recently moved towards a model of congregating waste to large regional landfills, giving rise to the potential for methane capture and utilization projects. Identified mitigation in this area suggests potential of reducing 2030 emissions by ~0.4 MtCO2e, although feasibility depends greatly on environmental and economic factors.
UBA Climate Change Implementation of Nationally Determined Contributions - Georgia Country Report
42
Common themes inhibiting mitigation action in Georgia include an insufficient supply of legislative regulations on emissions, domestic expertise and technology, financing opportunities and infrastruc-ture. A coordinated effort between parties and actors of all scales are needed to accelerate Georgia’s next phase in climate action to achieve their NDC commitments.
UBA Climate Change Implementation of Nationally Determined Contributions - Georgia Country Report
43
4 References ADB (2014) Georgia Transport Sector Assessment, Strategy, and Road Map.
ADB (2016) Assessing the Intended Nationally Determined Contributions of ADB Developing Members. Available at: https://www.adb.org/publications/assessing-indc-adb-developing-members [accessed on 11 January 2017].
Asian Development Bank (2017) Georgia: Economy. Available at: https://www.adb.org/countries/georgia/economy (Accessed: 19 February 2018).
BPI (2017) A Number of Hybrid Vehicles Increasing in Georgia. Available at: http://bpi.ge/index.php/a-number-of-hybrid-vehicles-increasing-in-georgia/?lang=en (Accessed: 3 January 2018).
Central Intelligence Agency (2017) The World Factbook. Available at: https://www.cia.gov/library/publications/the-world-factbook/geos/print_co.html (Accessed: 10 April 2018).
Chomakhidze, D. (2016) ‘Energy balance of Georgia’, Annals of Agrarian Science, 14, pp. 196–200. Available at: https://ac.els-cdn.com/S1512188716300537/1-s2.0-S1512188716300537-main.pdf?_tid=450a6c28-4cf3-4330-8a72-2e5c93b2d03c&acdnat=1524563056_bb5c9d9ac1cdddbbc00df0100ac3c742.
Climate Action Tracker (2016) Climate Action Tracker Data Portal. Available at: http://climateactiontracker.org/decarbonization/intro.
Climate College (2017) Georgia NDC Factsheet. Available at: http://climatecollege.unimelb.edu.au/files/site1/factsheets/Georgia_INDCFactsheet_UoM-PRIMAP_GWPAR4.pdf.
Cornell, S. E. (2001) Small Nations and Great Powers: A study of ethnopolitical conflict in the Caucasus. London and New York: RoutledgeCurzon. Available at: https://is.muni.cz/el/1423/podzim2012/MVZ208/um/35586974/Small_Nations_and_Great_Powers__A_Study_of_Ethnopolitical_Conflict_in_the_Caucasus__.pdf.
Cuenot, F. et al. (2014) ‘White Paper On Options for Improving Automotive Fuel Economy in Georgia’. Available at: https://www.globalfueleconomy.org/media/461042/eastern-europe_final_fe_white-paper_georgia_140217.pdf.
Day, T. (2018) Georgia’s Climate Action Plan and the transport sector. Available at: https://www.connective-cities.net/fileStorage/Veranstaltungen/Dialgoveranstaltung_Tbilis_Georgien/Dokumente/14_-_Georgias_Climate_Action_Plan.pdf (Accessed: 22 March 2018).
Day, T. et al. (2018) Planning for climate action in the transport sector in Georgia.
E-Space (2018) ‘E-Space’, in.
EBRD (2016) Reforestation delivers world’s first carbon-neutral hydropower project in Georgia. Available at: http://www.ebrd.com/cs/Satellite?c=Content&cid=1395254136278&d=Mobile&pagename=EBRD%2FContent%2FContentLayout (Accessed: 23 March 2018).
European Commission (2009) ‘Directive 2009/28/EC of the European Parliament and of the Council’. Available at: http://eur-lex.europa.eu/legal-content/EN/TXT/PDF/?uri=CELEX:32009L0028&from=EN.
European Commission (2012) Obligation schemes and alternative measures. Available at: https://ec.europa.eu/energy/en/topics/energy-efficiency-directive/obligation-schemes-and-alternative-measures (Accessed: 3 April 2017).
European Commission (2014) Association Agenda between the European Union and Georgia. Available at: https://eeas.europa.eu/sites/eeas/files/associationagenda_2014_en.pdf.
UBA Climate Change Implementation of Nationally Determined Contributions - Georgia Country Report
44
European Commission (2015) ‘Good practice in energy efficiency’. Available at: https://ec.europa.eu/energy/sites/ener/files/documents/good_practice_in_ee_-web.pdf.
European Commission (2018) Reducing CO2 emissions from passenger cars. Available at: https://ec.europa.eu/clima/policies/transport/vehicles/cars_en (Accessed: 2 March 2018).
Gachechiladze, Z. (2016) ‘Assessment of the Challenges and Opportunities for Renewable Energy Directive Transposition’. Available at: https://think-asia.org/bitstream/handle/11540/6943/Renewable_Energy_Directive.pdf?sequence=1.
Georgia Today (2017) Number of Hybrid & Electric Cars Up in Georgia. Available at: http://georgiatoday.ge/news/7377/Number-of-Hybrid-%26-Electric-Cars-Up-in-Georgia (Accessed: 3 January 2018).
Georgian Journal (2016) Georgia No. 1 among the countries that have deadliest air pollution. Available at: https://www.georgianjournal.ge/society/32635-georgia-no-1-among-the-countries-that-have-deadliest-air-pollution.html (Accessed: 5 March 2018).
GeoStat (2014) Energy Balance of Georgia. Tbilisi. Available at: http://www.geostat.ge/cms/site_images/_files/english/Energy/ENERGY BALANCE_ENG.pdf.
GEOSTAT (2017) National Statistics Office of Georgia. Available at: http://www.geostat.ge/index.php?action=page&p_id=152&lang=eng (Accessed: 16 February 2018).
GIZ (2016) Overview of international initiatives, programmes and projects supporting MRV and transparency in developing countries. Available at: http://www.carbon-mechanisms.de/fileadmin/media/dokumente/sonstige_downloads/CTI-Workshop_20160624/Rocio_Lichte_GIZ_MRV_initiatives_overview.pdf (Accessed: 27 February 2018).
GIZ (2018) GIZ: Georgia. Available at: https://www.giz.de/en/worldwide/359.html (Accessed: 20 February 2018).
Global Methane Initiative (2012) International Best Practices Guide for Landfill Gas Energy Projects - Appendix A: Case Studies. Available at: https://www.globalmethane.org/documents/toolsres_lfg_IBPGAppendixA.pdf.
Government of Georgia (2014) Social-economic Development Strategy of Georgia ‘Georgia 2020’. Available at: https://www.adb.org/sites/default/files/linked-documents/cps-geo-2014-2018-sd-01.pdf.
Government of Georgia (2015) Intended nationally determined contribution (INDC) of Georgia. Available at: http://www4.unfccc.int/submissions/INDC/Published Documents/Georgia/1/INDC_of_Georgia.pdf.
Government of Tbilisi City (2011) Sustainable Energy Action Plan for Tbilisi 2011-2020. Available at: http://www.economicforum.ge/upload/filess/seap_final_municipality.pdf.
Gütschow, J. et al. (2016) ‘The PRIMAP-hist national historical emissions time series’, Earth System Science Data, 8(2), pp. 571–603. doi: 10.5194/essd-8-571-2016.
Gütschow, J. et al. (2017) ‘The PRIMAP-hist national historical emissions time series (1850-2014) (v1.1, updated February 2017)’. GFZ Data Services. doi: https://doi.org/10.5880/PIK.2017.001.
Hagemann, M. et al. (no date) Tools for estimating policy impacts in the CTI tool.
ICCT (2012) Global Transportation Roadmap Model Version 1.0. Available at: http://www.theicct.org/global-transportation-roadmap-model.
IEA (2009) Energy sector methane recovery and use- the importance of policy. Paris. Available at: https://www.iea.org/publications/freepublications/publication/methane_brochure.pdf.
IEA (2015) Eastern Europe, Caucasus and Central Asia. Paris, France. Available at: https://www.iea.org/publications/freepublications/publication/IDR_EasternEuropeCaucasus_2015.pdf.
UBA Climate Change Implementation of Nationally Determined Contributions - Georgia Country Report
45
IEA (2016a) ‘Energy and Air Pollution’, World Energy Outlook - Special Report, p. 266. doi: 10.1021/ac00256a010.
IEA (2016b) Global EV Outlook 2016 Electric Vehicles Initiative. Available at: https://www.iea.org/publications/freepublications/publication/Global_EV_Outlook_2016.pdf.
IEA (2016c) World Energy Balances (2016 edition). Paris, France: International Energy Agency. Available at: http://wds.iea.org/wds/pdf/WORLDBAL_Documentation.pdf.
IEA (2016d) World Energy Outlook 2016. Paris, France: International Energy Agency.
IEA (2017) Global EV Outlook 2017: Two million and counting, IEA Publications. Paris, France: International Energy Agency. doi: 10.1787/9789264278882-en.
IPCC (2014) ‘AR5 Climate Change 2014 Synthesis Report’. Available at: https://www.ipcc.ch/pdf/assessment-report/ar5/syr/SYR_AR5_FINAL_full.pdf.
Jean-Manuel Giely (2015) Tbilisi Sustainable Urban Transport Strategy. Available at: http://mdf.org.ge/storage/assets/file/documents 2016/murtazi/Strategic Paper Report PDF Geo(18_03_2016)/Strategic Paper Report final ENG.pdf.
Karchkhadze, K. (2017) ‘Promotion of biodeisel in Georgia’. Ilia State University. Available at: Karchkhadze, Kakha.
Legislative Herald of Georgia (1999) Law of Georgia on Electricity and Natural Gas. Georgia. Available at: https://matsne.gov.ge/en/document/download/31744/32/en/pdf.
MATSNE (2015) Law of Georgia - Waste Management Code. Georgia. Available at: https://matsne.gov.ge/en/document/download/2676416/1/en/pdf.
MATSNE (2016) On Approval of National Strategy for Waste Management 2016-2030 and National Action Plan 2016-2020. Georgia. Available at: https://matsne.gov.ge/ka/document/view/3242506.
Mdivani, K. and Hoppe, T. (2016) ‘Experience with LEDS and NAMA Low Carbon Strategies: The Case of Georgia’, Sustainability.
Ministry of Energy (2007) Main Directions of the State Policy in Energy Sector of Georgia. Available at: http://www.energy.gov.ge/ministry.php?id_pages=12&lang=eng.
Ministry of Environment and Natural Resources Protection of Georgia (2016) First Biennial Update Report on Climate Change. Tbilisi. Available at: https://unfccc.int/files/national_reports/non-annex_i_parties/biennial_update_reports/application/pdf/first_bur_-_georgia.pdf.
Ministry of Foreign Affairs (2016) Georgia Economic Outlook. Available at: http://www.mfa.gov.ge/BlankSite/media/Files/PM_2016_Apr.pdf (Accessed: 19 February 2018).
MoENRP (2015) ‘Georgia’s Third National Communications to the UNFCCC’.
MoENRP (2016) GHGs National Inventory Report: Georgia 2010-2013. Tbilisi. Available at: https://unfccc.int/files/national_reports/non-annex_i_parties/biennial_update_reports/application/pdf/ghg_national_inventory_report___georgia.pdf.
MoIA (2017) ‘National Disaster Risk Reduction Strategy of Georgia’. Available at: https://www.preventionweb.net/files/54533_drrstrategy2017annex1eng.pdf.
Morrison, T. (2018) ‘Georgia-China Free Trade Deal Comes into Effect’, Georgia Today, 8 January. Available at: http://georgiatoday.ge/news/8704/Georgia-China-Free-Trade-Deal-Comes-into-Effect.
NEEAP Expert Team (2017) Georgia NEEAP Report: assistance with drafting the first National Energy Efficiency Action Plan (Phase 1) Draft.
NewClimate Institute (2016) Climate Policy Database. Available at: http://www.climatepolicydatabase.org.
Odyssee-Mure (2018) Odyssee-Mure Database. Available at: http://www.odyssee-mure.eu/ (Accessed:
UBA Climate Change Implementation of Nationally Determined Contributions - Georgia Country Report
46
9 April 2018).
OECD (2016) Financing Climate Action in Georgia. Available at: https://www1.oecd.org/environment/outreach/Georgia_Financing_Climate_Action.Nov2016.pdf.
OECD (2017) Mobilising finance for climate action in Georgia. Available at: http://www.oecd.org/officialdocuments/publicdisplaydocumentpdf/?cote=env/epoc/eap/(2017)4&doclanguage=en.
OECD (2018) ‘OECD data: working age population’. Available at: https://data.oecd.org/pop/working-age-population.htm.
Organization for Security and Co-operation in Europe (2015) Assessment of the Legislative Process in Georgia. Available at: http://www.osce.org/odihr/138761?download=true (Accessed: 19 February 2018).
Robiou du Pont, Y. et al. (2017) ‘Equitable mitigation to achieve the Paris Agreement goals’, Nature Clim. Change. Nature Publishing Group, 7(1), pp. 38–43. Available at: http://dx.doi.org/10.1038/nclimate3186.
Shahbazov, F. (2017) ‘Baku-Tbilisi-Kars Railway to Become Central Asia’s Gateway to Europe’, The Central Asia-Caucasus Analyst, 7 December. Available at: https://www.cacianalyst.org/publications/analytical-articles/item/13486-baku-tbilisi-kars-railway-to-become-central-asias-gateway-to-europe.html (Accessed: 5 March 2018).
Sierzchula, W. et al. (2014) ‘The influence of financial incentives and other socio-economic factors on electric vehicle adoption’, Energy Policy. Elsevier, 68, pp. 183–194. doi: 10.1016/j.enpol.2014.01.043.
Sims, R. et al. (2014) IPCC Fifth Assessment Report (AR5) - Chapter 8: Transport.
Slovakia 3rd NEEAP (2014) ‘Slovakia 3rd Energy Efficiency Action Plan 2014-2016 with an Outlook up to 2020’. Available at: https://ec.europa.eu/energy/sites/ener/files/documents/NEEAP_EN_ENER-2014-01001-00-00-EN-TRA-00.pdf.
SWMCG (2016) QUESTIONS AND ANSWERS ABOUT WASTE AND WASTE MANAGEMENT. Available at: http://www.ecoinfo.ro/Solid_New/en/wp-content/uploads/2015/07/Communication_Package_Journalists_EN.pdf.
SWMCG (2018) Solid Waste Management Company of Georgia. Available at: http://waste.gov.ge/ka/?lang=en (Accessed: 6 April 2018).
Tbilisi City Hall (2016) Two new electric vehicles charging stations opened in Tbilisi. Available at: http://www.tbilisi.gov.ge/news/3086?lang=en (Accessed: 5 March 2018).
Tbilisi City Hall (2017) Green City Action Plan Tbilisi 2017-2030. Available at: http://www.tbilisi.gov.ge/page/green-city?lang=en.
The World Bank (2016) Intended Nationally Determined Contributions (INDCs).
UNDP (2016a) Human Development Report 2016: Georgia.
UNDP (2016b) Third National Communication to the UNFCCC, United Nations Development Programme. Available at: http://unfccc.int/ /library/items/3599.php?rec=j&priref=7835#beg.
UNDP (2017) Support to the Development of National Strategy and Policy Framework on Sustainable Low-Carbon Urban Transport in Georgia.
UNEP (2011) Technologies for Climate Change Mitigation - Transport Sector. Available at: http://www.unepdtu.org/PUBLICATIONS/TNA-Guidebook-Series.
UNFCCC (2018) Country profile of Georgia. Available at: http://www.nama-database.org/index.php/Georgia (Accessed: 22 March 2018).
USAID (2015) ‘Municipal Waste Management Plan Development Guideline’. Available at: http://environment.cenn.org/app/uploads/2016/08/MWTR-program_SWMP-Guideline_ENG_20150401.pdf.
UBA Climate Change Implementation of Nationally Determined Contributions - Georgia Country Report
47
Weitzman, M. L. (1975) ‘Prices vs. Quantities’, Review of Economic Studies, ?, pp. 477–491. Available at: https://dspace.mit.edu/bitstream/handle/1721.1/64122/pricesvsquantiti00weit.pdf?sequence=1.
Winrock and Remmisia (2017) ‘Georgia Low Emission Development Strategy Draft Report’. USAID.
Winrock International (2016) MARKAL-Georgia LEDS BAU Scenario Report.
Winrock International (2017) Georgia’s Low Emission Development Strategy. Tbilisi.
World Bank (2016a) World Bank Data: Country Profile - Georgia. Available at: http://databank.worldbank.org/data/Views/Reports/ReportWidgetCustom.aspx?Report_Name=CountryProfile&Id=b450fd57&tbar=y&dd=y&inf=n&zm=n&country=GEO (Accessed: 19 February 2018).
World Bank (2016b) ‘World Bank data’. Available at: http://data.worldbank.org/.
World Bank (2017a) Georgia Overview. Available at: http://www.worldbank.org/en/country/georgia/overview (Accessed: 19 February 2018).
World Bank (2017b) World Development Indicators. The World Bank Group. Available at: https://data.worldbank.org/products/wdi.
World Bank (2018a) ‘Economic Outlook for the Europe and Central Asia Region’. Available at: http://pubdocs.worldbank.org/en/465111512062598806/Global-Economic-Prospects-Jan-2018-Europe-and-Central-Asia-analysis.pdf.
World Bank (2018b) Population Growth (Annual %). Available at: https://data.worldbank.org/indicator/SP.POP.GROW?locations=GE (Accessed: 15 March 2018).
Wucke, A. (2015) Overview of German INDC Support. Available at: https://unfccc.int/files/cooperation_and_support/capacity_building/application/pdf/germany_indc_support.pdf (Accessed: 20 February 2018).
Zarzo, O., Vardosanidze, K. and Janashia, N. (2017) ‘MRV Set-up Workshop Workshop Documentation’. Available at: https://www.transparency-partnership.net/system/files/document/3rd_capacity_building_training_report_3.pdf.


![THE INTENDED NATIONALLY DETERMINED CONTRIBUTIONS ... · PDF fileiv THE AGRICULTURE SECTORS IN THE INTENDED NATIONALLY DETERMINED CONTRIBUTIONS - ANALYSIS] [Figure 1. Percentage of](https://img.pdfslide.net/doc/110x75/5a7de13a7f8b9a66798dfe6b/the-intended-nationally-determined-contributions-the-agriculture-sectors-in.jpg)