Embed Size (px)
Citation preview

Phares, et al.
1
Implementation of Physical Testing for Typical Bridge Load and Superload Rating
Brent Phares Iowa State University – CTRE 2901 S. Loop Dr., Suite 3100 Ames, IA 50010 515-294-5879 Fax 515-294-0467 [email protected] Terry Wipf Iowa State University – CTRE 2901 S. Loop Dr., Suite 3100 Ames, IA 50010 515-294-6979 Fax 515-294-0467 [email protected] F. Wayne Klaiber Iowa State University – CTRE 2901 S. Loop Dr., Suite 3100 Ames, IA 50010 515-294-6979 Fax 515-294-0467 [email protected] Ahmad Abu-Hawash Office of Bridges and Structures Iowa Department of Transportation 800 Lincoln Way Ames, IA 50010 515-239-1393 Fax 515-294-1978 [email protected] Scott Neubauer Office of Bridges and Structures Iowa Department of Transportation 800 Lincoln Way Ames, IA 50010 515-239-1290 Fax 515-294-1978 [email protected]
Word Count: 3788 text + 1 table + 13 figures = total word count = 7280 words
Phares, et al.
2
ABSTRACT Accurately and effectively assessing the safe load carrying capacity of bridges is a common problem faced by bridge owners. Diagnostic testing can be especially beneficial for bridges that are part of an aging and rapidly decaying infrastructure. In addition, diagnostic testing can be useful in assessing whether superloads can safely cross a bridge. When tested, typically bridges often exhibit strength and stiffness characteristics greater than traditional codified parameters and beyond conventional rating values. Commercial equipment and analytical tools have simplified the process of testing, modeling, and rating bridges. This paper presents several case studies using diagnostic load testing by the Iowa Department of Transportation and provides information regarding the Iowa DOT implementation perspective.
Pertinent results from a bridge tested prior to the passage of a superload and another bridge tested as part of online bridge evaluations are presented. Before the passage of the superload, which weighed approximately 2848 kN (640,000 lb.), the bridge was instrumented with strain transducers and tested with known, more typical, loads. Several finite element models of the bridge were developed and calibrated based on the observed behavior and the field measured strains. Results from the calibrated model were used to perform load rating calculations for the bridge using the superload geometry and axle loadings. Based on the predicted results, the bridge owner allowed passage of the superload. During subsequent passage of the superload, the bridge was instrumented and monitored in a similar manner and the data were correlated with the initial predictions to determine the validity of the system’s predictive capability for superloads.

Phares, et al.
3
INTRODUCTION
Diagnostic load testing of bridges is an important tool used by engineers to understand global and local behavior of bridges. It has long been recognized that load tested bridges often exhibit strength and serviceability attributes that exceed the levels predicted by accepted codified parameters (1). This means that many bridges have reserve strength/stiffness beyond that predicted by traditional calculations. Knowledge of these reserves is especially important for bridges of marginal condition which frequently must be posted at load levels below legal limits.
Although the use of load testing for the purpose of load rating is not a new technique, only recently have easy-to-use, integrated tools been developed to facilitate the rational integration of field test results into rating calculations. Bridge Diagnostics, Inc. (BDI). has developed a suite of software which, when used in combination with specially developed hardware, provide the needed tools for collecting field performance data, calibrating a finite element model with the field collected data, and performing load rating calculations based on the calibrated finite element model.
BRIDGE OWNER IMPLEMENTATION PERSPECTIVE
With the current economic condition, state Departments of Transportation are continuously asked to streamline processes in order to deliver more services with less funding. Managing the large inventory of primary system bridges, about 4000, in Iowa under these economic conditions becomes a daunting task. The Iowa Department of Transportation (Iowa DOT) looked for innovative solutions to supplement the traditional analysis techniques in dealing with tasks such as:
• Increasing the capacity of older bridges that were adequately designed but may no longer be sufficient based on today’s specifications.
• Determining the capacity of bridges with unknown or insufficient design data. • Evaluating the need for imposing temporary load restriction on damaged bridges. • Reducing the number of bridges that restrict a reasonable flow of overweight trucks. • Verifying the effectiveness of new strengthening techniques. • Removing load restrictions imposed on additional bridges due to the implementation of new
weight laws. • Load testing as a means to determine the behavior of structures under heavy load that have
calculated load ratings below anticipated capacity needs. It became obvious that a tool such as bridge rating through diagnostic load testing is a viable option to consider when dealing with bridges that are in reasonably good condition. With the help of funding from the Iowa Highway Research Board (IHRB) and the existence of a cooperative agreement with the Center for Transportation Research and Education (CTRE) in the form of providing expert staff within the Bridge Engineering Center (BEC), a pilot project was initiated in 1999. The Iowa DOT contracted with BDI to perform load testing on eight bridges followed by the establishment of a Load Testing program in 2000 with the help of the BEC at Iowa State University (ISU).
In summary, the Iowa DOT believes many of Iowa’s bridges have ratings well above what can be predicted by traditional analysis methods. These higher ratings can be numerically quantified by using diagnostic load testing. This can be attributed to the fact that traditional design/analysis is based on specifications that are derived from theoretical analysis while diagnostic load testing utilizes models based on actual bridge behavior; composite action and boundary conditions are two examples.
GENERAL TESTING SYSTEM DESCRIPTION
The system developed by BDI is a systematic approach to the testing, modeling, and rating of bridges. The system is used in phases each with their own tools and individual processes. Initially, existing data on the bridge being evaluated are examined. Often, previous load rating calculations or visual inspection

Phares, et al.
4
reports reveal the limiting or critical elements and sections of a bridge. This survey of existing data can then be used to develop an instrumentation plan for the bridge.
Generally, the instrumentation plan is designed to address the issues and concerns identified from the evaluation of the existing condition data. The plan should include the collection of data that may impact the attributes of the finite element model. Common issues include girder end conditions, the presence of composite action, and others.
Structural Testing System
Implementing the instrumentation plan in the field is simplified by the BDI Structural Testing System (STS). Installation of the strain transducers simply involves the cleaning of the surface at the gage location and placement of the transducer using an adhesive and accelerant (2). An extender device is available to increase the 7.62 cm (3 in.) gage length of the transducer for use on reinforced concrete, if desirable. Each transducer is referred to as an “Intelliducer” due to its ability to identify itself to the system control unit. This attribute allows for automatic calibration and balancing of the gages. Each Intelliducer connects to a small box, called an STS Unit, in groups of four. Individual STS Units are connected to one another (typically in series) and finally to the Power Unit. This allows for a minimum number of wires to relay data for up to 64 Intelliducers. The Power Unit is connected to a PC that controls the functions of the system. Data can be collected at rates from 0.01 to 100 Hz.
The system also has a remote load position indicator called the “Autoclicker.” The Autoclicker uses a reflective strip on the load vehicle wheel, a photo sensor, and a handheld radio to transmit the truck position (in terms of wheel revolutions) to the Power Unit.
Software Suite
The BDI Software Suite is used for the analysis, modeling, and rating of the bridge. Included in the package are software for graphing field and analytical data, model generation, and model analysis and calibration.
WinGRF is the first of the analysis tools used in the analysis. WinGRF uses transducer output and load position data to plot results verses truck position. When the user inputs information related to gage location (e.g., gage pairs, vertical distance between gages, etc.) more advanced plots can be created (3). Results such as strain, neutral axis, and curvature may all be plotted with respect to vehicle position. Options, such as data filtering and offset correction may also be completed in WinGRF.
WinGEN is used to create a finite element model of the bridge. The software is limited to beam and shell elements. The initial model is created using the overall bridge geometry and the section properties from the as-built plans. Also, neutral axis location information identified from the field test data can be incorporated. Other significant behaviors identified during the investigation of the field results can also be included in the model. The inclusion of rotational and/or translational springs at the supports is a typical model modification. Transducer locations are also input in the model for calibration with the field data.
WinSAC analyzes and calibrates the analytical model. Limits of properties, such as modulus of elasticity, moment of inertia, and spring constants, are input into WinGEN and then analyzed using WinSAC. Within the user prescribed limits, the model is calibrated to the field results. WinSAC performs a statistical analysis of the model analytical results, as compared to the test results, to arrive at a final calibrated model from which load ratings can be calculated.
Final model results may be plotted using the WinGRF program. This will visually verify the analysis results generated from WinSAC.
FIELD TESTING AND RATING OF BRIDGE ONE
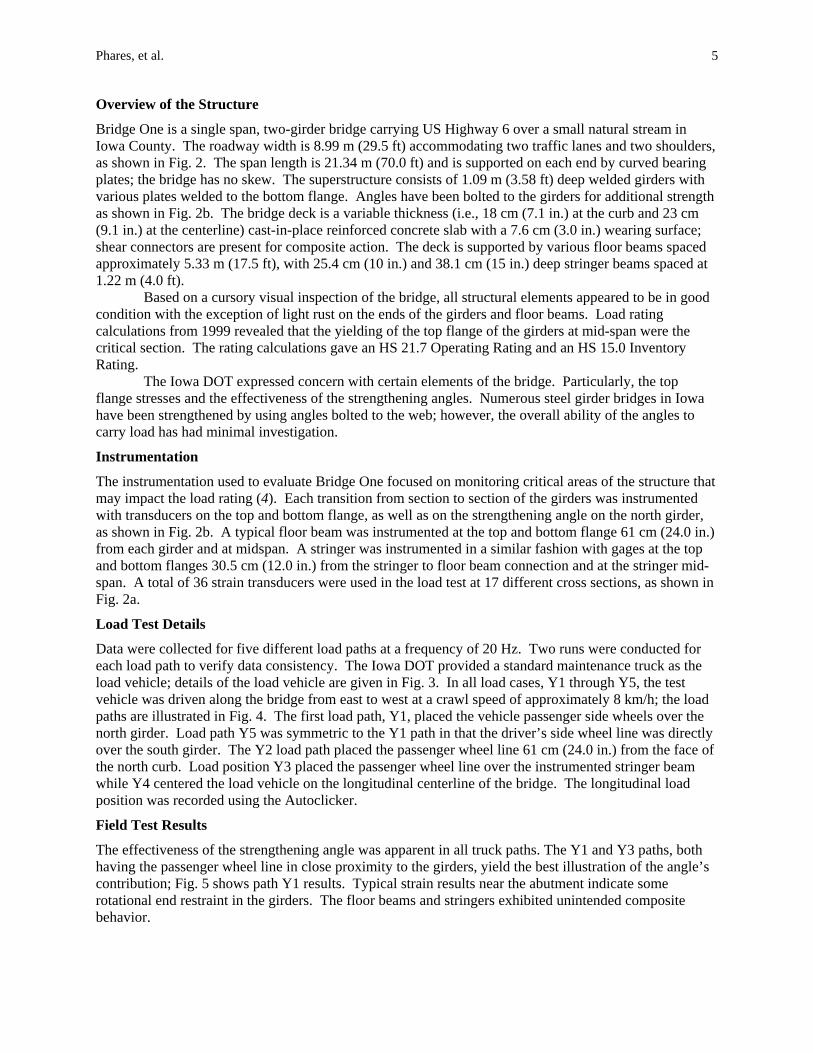
Bridge One, shown in Fig. 1, was one of five bridges tested in the field verification of the BDI system conducted by ISU in conjunction with the Iowa Department of Transportation (Iowa DOT). It was the most structurally complex of the bridges tested, having two girders with four different cross sections, numerous floor beams, and various stringers.
Phares, et al.
5
Overview of the Structure
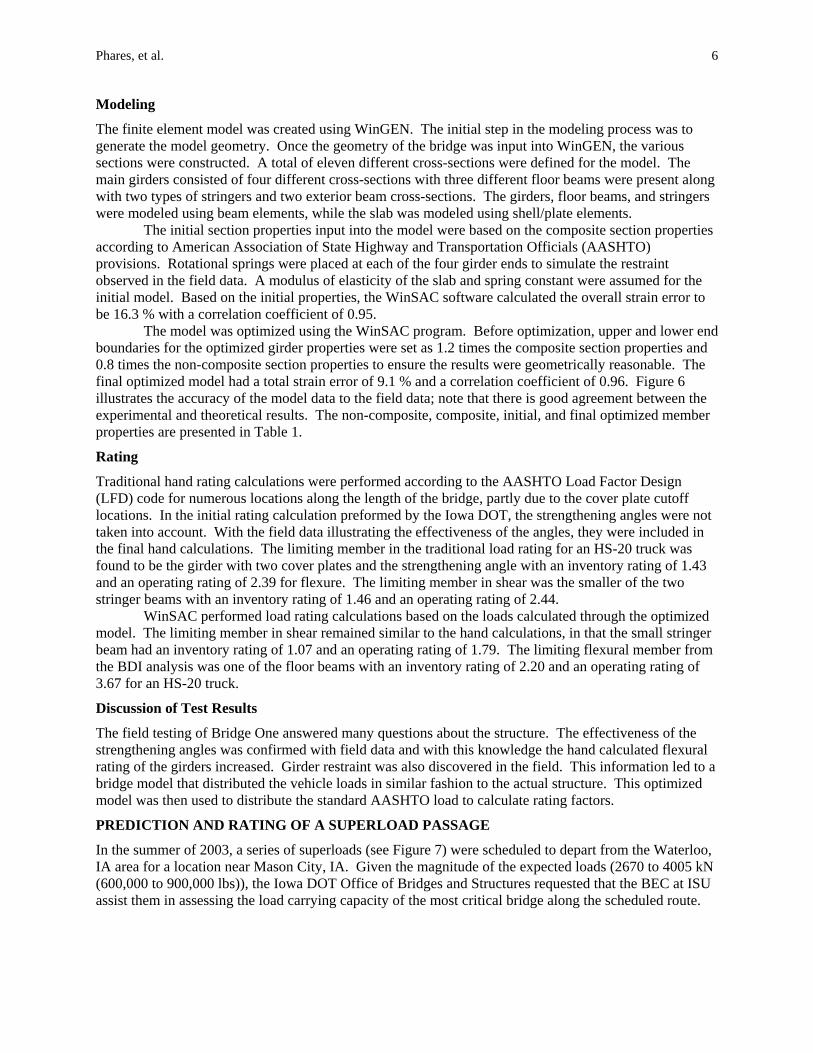
Bridge One is a single span, two-girder bridge carrying US Highway 6 over a small natural stream in Iowa County. The roadway width is 8.99 m (29.5 ft) accommodating two traffic lanes and two shoulders, as shown in Fig. 2. The span length is 21.34 m (70.0 ft) and is supported on each end by curved bearing plates; the bridge has no skew. The superstructure consists of 1.09 m (3.58 ft) deep welded girders with various plates welded to the bottom flange. Angles have been bolted to the girders for additional strength as shown in Fig. 2b. The bridge deck is a variable thickness (i.e., 18 cm (7.1 in.) at the curb and 23 cm (9.1 in.) at the centerline) cast-in-place reinforced concrete slab with a 7.6 cm (3.0 in.) wearing surface; shear connectors are present for composite action. The deck is supported by various floor beams spaced approximately 5.33 m (17.5 ft), with 25.4 cm (10 in.) and 38.1 cm (15 in.) deep stringer beams spaced at 1.22 m (4.0 ft).
Based on a cursory visual inspection of the bridge, all structural elements appeared to be in good condition with the exception of light rust on the ends of the girders and floor beams. Load rating calculations from 1999 revealed that the yielding of the top flange of the girders at mid-span were the critical section. The rating calculations gave an HS 21.7 Operating Rating and an HS 15.0 Inventory Rating.
The Iowa DOT expressed concern with certain elements of the bridge. Particularly, the top flange stresses and the effectiveness of the strengthening angles. Numerous steel girder bridges in Iowa have been strengthened by using angles bolted to the web; however, the overall ability of the angles to carry load has had minimal investigation.
Instrumentation
The instrumentation used to evaluate Bridge One focused on monitoring critical areas of the structure that may impact the load rating (4). Each transition from section to section of the girders was instrumented with transducers on the top and bottom flange, as well as on the strengthening angle on the north girder, as shown in Fig. 2b. A typical floor beam was instrumented at the top and bottom flange 61 cm (24.0 in.) from each girder and at midspan. A stringer was instrumented in a similar fashion with gages at the top and bottom flanges 30.5 cm (12.0 in.) from the stringer to floor beam connection and at the stringer mid-span. A total of 36 strain transducers were used in the load test at 17 different cross sections, as shown in Fig. 2a.
Load Test Details
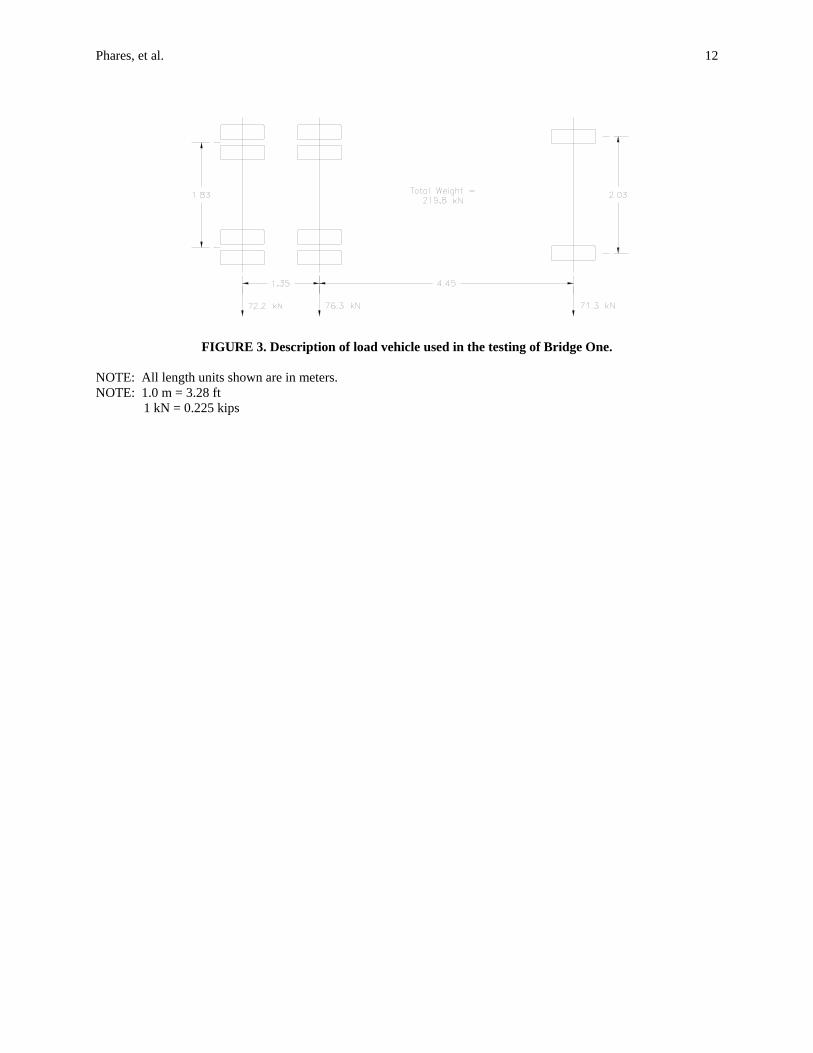
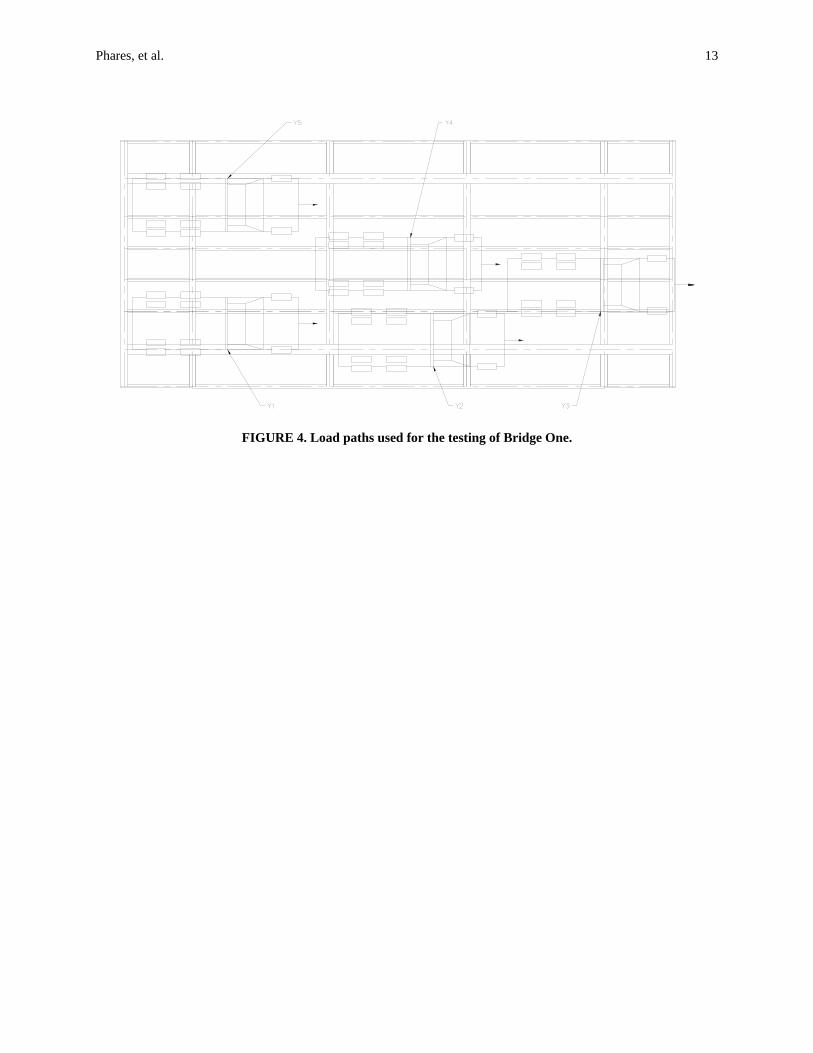
Data were collected for five different load paths at a frequency of 20 Hz. Two runs were conducted for each load path to verify data consistency. The Iowa DOT provided a standard maintenance truck as the load vehicle; details of the load vehicle are given in Fig. 3. In all load cases, Y1 through Y5, the test vehicle was driven along the bridge from east to west at a crawl speed of approximately 8 km/h; the load paths are illustrated in Fig. 4. The first load path, Y1, placed the vehicle passenger side wheels over the north girder. Load path Y5 was symmetric to the Y1 path in that the driver’s side wheel line was directly over the south girder. The Y2 load path placed the passenger wheel line 61 cm (24.0 in.) from the face of the north curb. Load position Y3 placed the passenger wheel line over the instrumented stringer beam while Y4 centered the load vehicle on the longitudinal centerline of the bridge. The longitudinal load position was recorded using the Autoclicker.
Field Test Results
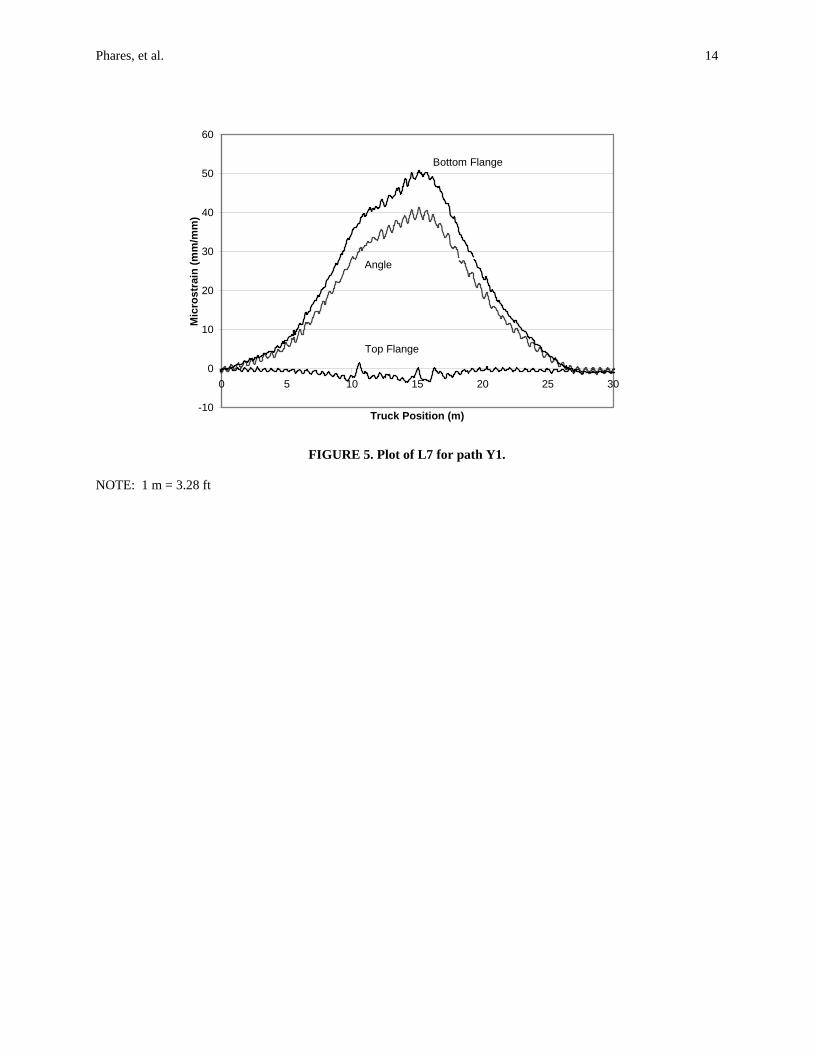
The effectiveness of the strengthening angle was apparent in all truck paths. The Y1 and Y3 paths, both having the passenger wheel line in close proximity to the girders, yield the best illustration of the angle’s contribution; Fig. 5 shows path Y1 results. Typical strain results near the abutment indicate some rotational end restraint in the girders. The floor beams and stringers exhibited unintended composite behavior.
Phares, et al.
6
Modeling
The finite element model was created using WinGEN. The initial step in the modeling process was to generate the model geometry. Once the geometry of the bridge was input into WinGEN, the various sections were constructed. A total of eleven different cross-sections were defined for the model. The main girders consisted of four different cross-sections with three different floor beams were present along with two types of stringers and two exterior beam cross-sections. The girders, floor beams, and stringers were modeled using beam elements, while the slab was modeled using shell/plate elements.
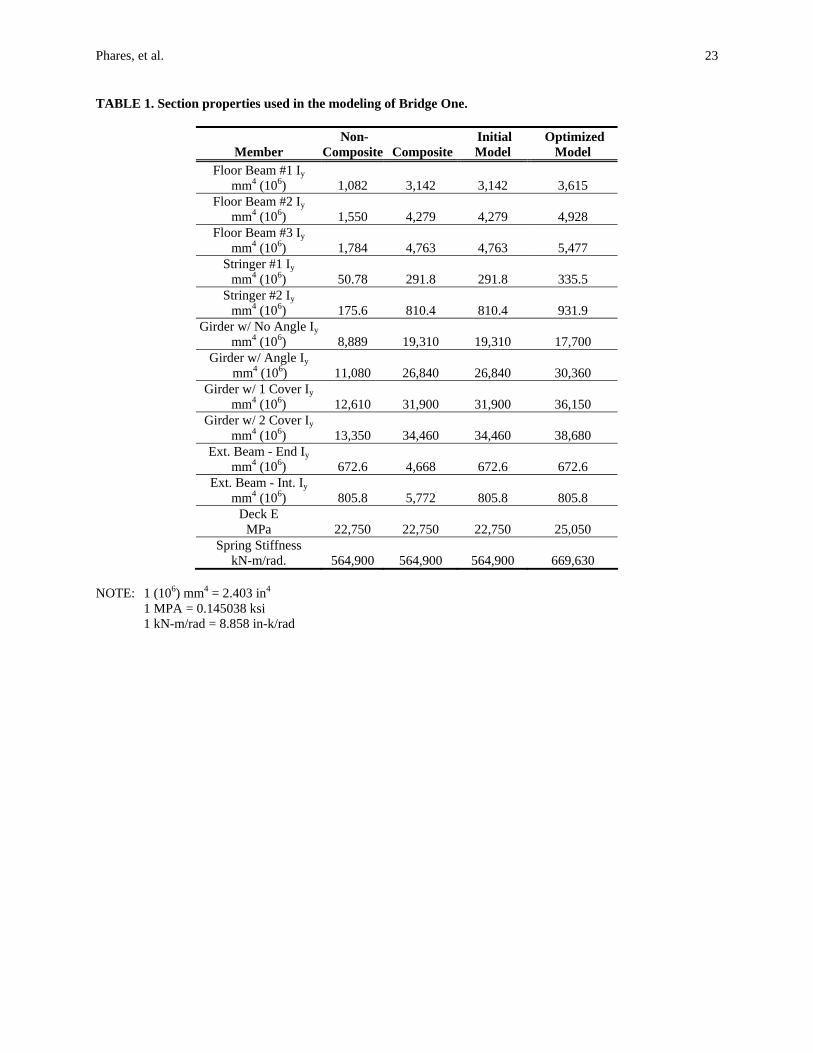
The initial section properties input into the model were based on the composite section properties according to American Association of State Highway and Transportation Officials (AASHTO) provisions. Rotational springs were placed at each of the four girder ends to simulate the restraint observed in the field data. A modulus of elasticity of the slab and spring constant were assumed for the initial model. Based on the initial properties, the WinSAC software calculated the overall strain error to be 16.3 % with a correlation coefficient of 0.95.
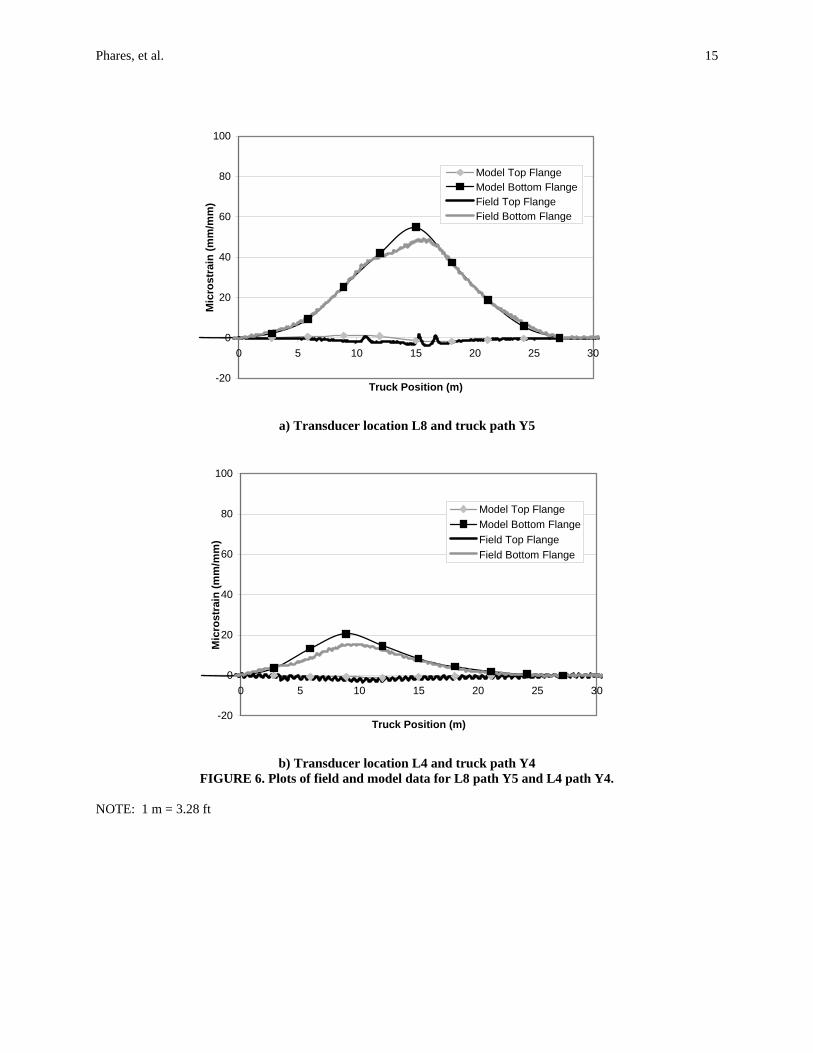
The model was optimized using the WinSAC program. Before optimization, upper and lower end boundaries for the optimized girder properties were set as 1.2 times the composite section properties and 0.8 times the non-composite section properties to ensure the results were geometrically reasonable. The final optimized model had a total strain error of 9.1 % and a correlation coefficient of 0.96. Figure 6 illustrates the accuracy of the model data to the field data; note that there is good agreement between the experimental and theoretical results. The non-composite, composite, initial, and final optimized member properties are presented in Table 1.
Rating
Traditional hand rating calculations were performed according to the AASHTO Load Factor Design (LFD) code for numerous locations along the length of the bridge, partly due to the cover plate cutoff locations. In the initial rating calculation preformed by the Iowa DOT, the strengthening angles were not taken into account. With the field data illustrating the effectiveness of the angles, they were included in the final hand calculations. The limiting member in the traditional load rating for an HS-20 truck was found to be the girder with two cover plates and the strengthening angle with an inventory rating of 1.43 and an operating rating of 2.39 for flexure. The limiting member in shear was the smaller of the two stringer beams with an inventory rating of 1.46 and an operating rating of 2.44.
WinSAC performed load rating calculations based on the loads calculated through the optimized model. The limiting member in shear remained similar to the hand calculations, in that the small stringer beam had an inventory rating of 1.07 and an operating rating of 1.79. The limiting flexural member from the BDI analysis was one of the floor beams with an inventory rating of 2.20 and an operating rating of 3.67 for an HS-20 truck.
Discussion of Test Results
The field testing of Bridge One answered many questions about the structure. The effectiveness of the strengthening angles was confirmed with field data and with this knowledge the hand calculated flexural rating of the girders increased. Girder restraint was also discovered in the field. This information led to a bridge model that distributed the vehicle loads in similar fashion to the actual structure. This optimized model was then used to distribute the standard AASHTO load to calculate rating factors.
PREDICTION AND RATING OF A SUPERLOAD PASSAGE
In the summer of 2003, a series of superloads (see Figure 7) were scheduled to depart from the Waterloo, IA area for a location near Mason City, IA. Given the magnitude of the expected loads (2670 to 4005 kN (600,000 to 900,000 lbs)), the Iowa DOT Office of Bridges and Structures requested that the BEC at ISU assist them in assessing the load carrying capacity of the most critical bridge along the scheduled route.

Phares, et al.
7
Overview of the Structure
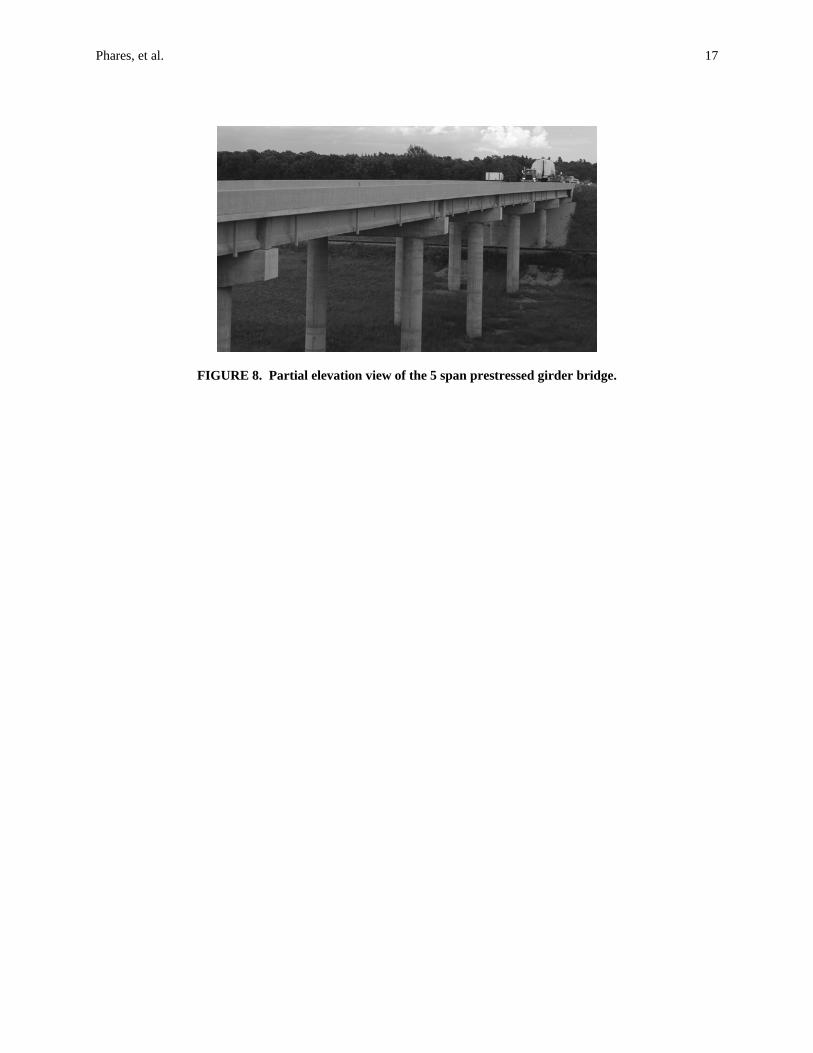
The critical bridge was a five span, prestressed concrete girder bridge, with a six girder cross-section, crossing a small creek and a railroad line. The bridge has an overall length of approximately 182.5 m (600 ft) with an overall roadway width of approximately 12 m (39 ft); one span of this bridge was found, through traditional calculations, to be of greatest concern. This span has a span length of approximately 36.5 m (120 ft – 6 in.). Figure 8 shows a partial view of the bridge.
Instrumentation
To assist the DOT in assessing this bridge, the BEC conducted a traditional load rating test on the bridge using various combinations of one and two loaded tandem axle dump trucks (see Figure 9). Strain data were collected at three cross-sections of the critical span: near the west abutment, at mid-span, and near the first pier. Four girders were instrumented with two strain gages each (one each on the top and bottom flanges) at the sections near the abutment and pier and all six girders were instrumented with two strain gages each (one each on the top and bottom flanges) at the section near midspan.
Modeling/Rating
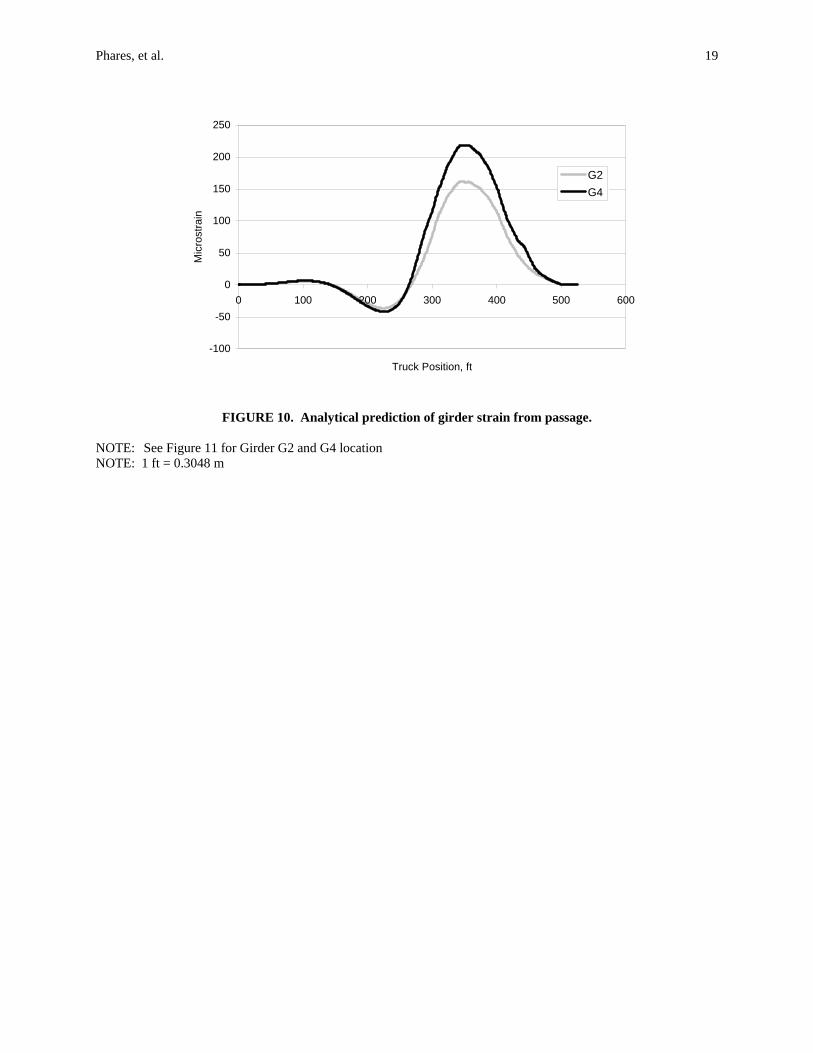
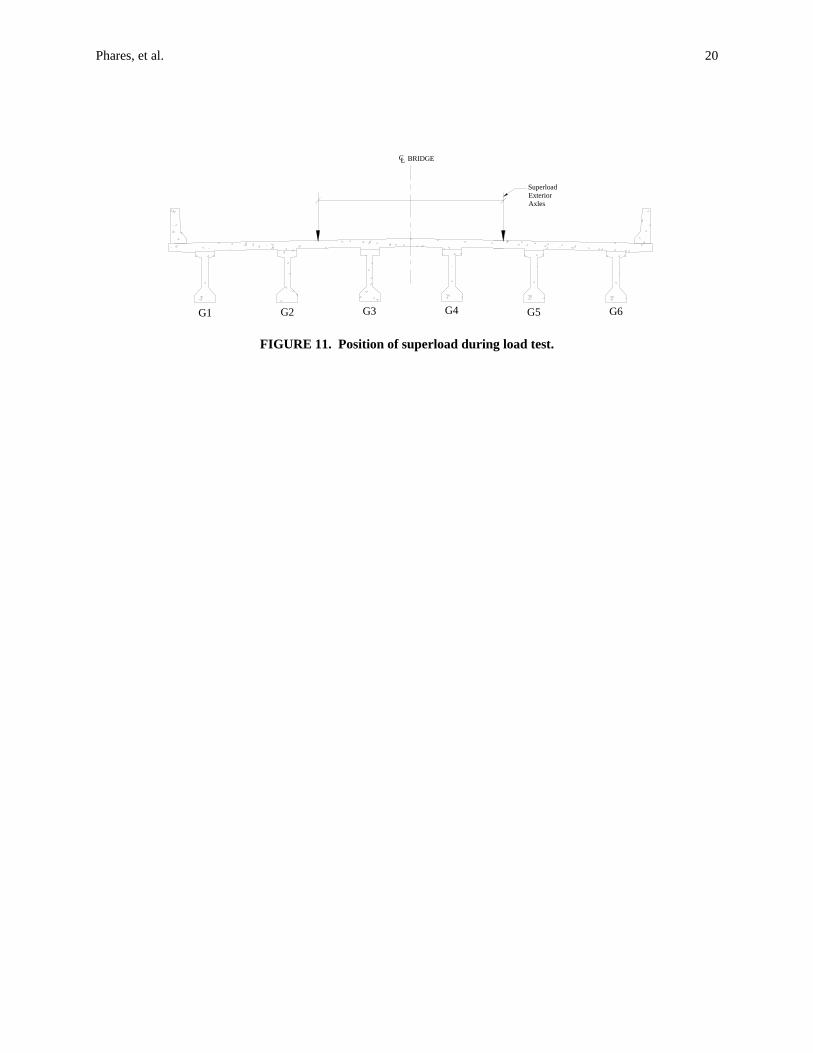
From the data collected during the above mentioned test, a finite element model was created and calibrated. The final model had less than a 9% error at predicting the field test results. This model was then used to predict the response of the bridge to the first superload expected to cross the bridge (approximately 2848 kN (640,000 lbs). Typical strain results from this prediction are shown in Fig. 10. It was assumed for this analysis that the truck crossed the bridge centered on the bridge (i.e. not the centerline of the traveled roadway; see Fig. 11). As one would expect, a symmetric behavior was predicted as shown in the figure. From this model, and further consultation with the DOT, it was determined that the bridge did have sufficient strength (both flexural and shear) to allow passage of the loads.
Discussion of Test Results
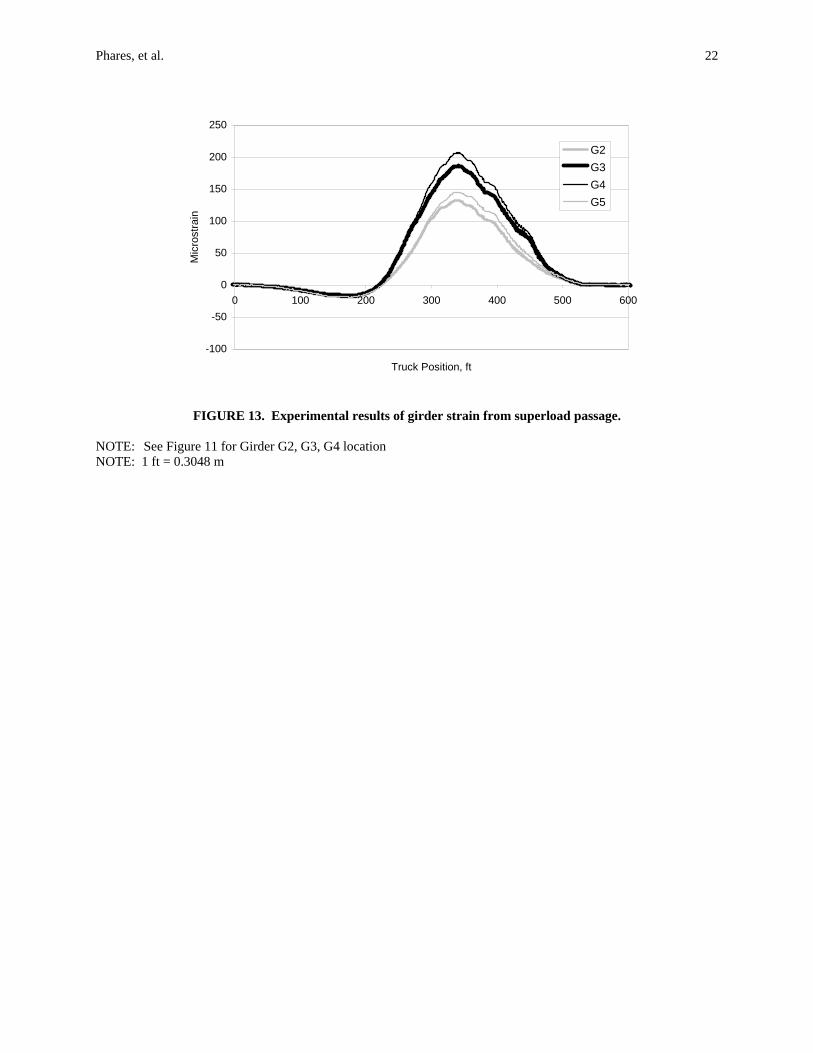
During passage of the first superload (see Fig. 12), the same instrumentation scheme was installed on the bridge prior to the load arriving. The response of the bridge was then measured as the load crossed the bridge. Typical results from this can be seen in Fig. 13 which shows the response at the same locations shown in Figure 10. As one can see in comparing Figures 10 and 13, there is very good correlation between the predicted and actual response at midspan. In Fig. 13 one can note, however, that the response does not appear to be symmetric (i.e., strain levels are different in symmetric girders). However, it should be pointed out that the truck did not track down the centerline of the bridge. This may be the source of some of the behavior seen in Figure 13. Although not shown here, the predicted strain at the pier was not as accurate as that predicted near midspan and near the abutment. A brief post-loading visual inspection of the bridge reveled that additional cracking in the barrier wall and deck had occurred. This may account for the generally less accurate prediction.
In general, this approach (preliminary testing, modeling, and prediction) proved to be relatively easy to complete. Further, the results obtained show that, in general, good accuracy can be attained using this system and can provide bridge owners with additional valuable information.
SUMMARY AND CONCLUSIONS
Commercial systems, such as the BDI system, are commonly being used as tools to implement the testing, modeling, and rating of existing structures. With an aging and rapidly decaying bridge inventory, the effective management of marginal condition structures is a pressing issue for bridge owners. Diagnostic load testing for the purpose of load rating is the only currently cost effective and accurate technique for determining load carrying characteristics. Most bridges exhibit strength and stiffness that exceeds that which traditional calculations predict and results in a more accurate and increased load rating. Identification of this “reserve” strength can delay when bridges must be rehabilitated or replaced which

Phares, et al.
8
can result in significant long-term cost savings. Further, diagnostic load testing can be used to more accurately determine the ability of a bridge to safely carry superloads. While it is recognized that developing load ratings through diagnostic testing costs more than load ratings by traditional hand calculations, the long-term savings resulting from extending a bridge’s useful life may offset these costs.
REFERENCES 1. Chajes MJ, Mertz DR & Commander Bl 1997. Experimental Load Rating of a Posted Bridge, Journal of Bridge Engineering 2(1) 1-10. 2. Bridge Diagnostics, Inc. Manual. 1999. BDI Structural Testing System Operation Manual. 3. Bridge Diagnostics, Inc. Software. 2002. BDI Software Package Bridge Modeling and Analysis Program Manuals. 4. Bridge Diagnostics, Inc. Report. 1999. Load Testing and Load Rating Eight State Highway Bridges in Iowa, Final Report. Office of Bridges and Structures, Iowa Department of Transportation.

Phares, et al.
9
LIST OF TABLES Table 1. Section properties used in the modeling of Bridge One. LIST OF FIGURES Figure 1. Photograph of the main girders of Bridge One. Figure 2. Illustrations of Bridge One. Figure 3. Description of load vehicle used in the testing of Bridge One. Figure 4. Load paths used for the testing of Bridge One. Figure 5. Plot of L7 for path Y1. Figure 6. Plots of field and model data for L8 path Y5 and L4 path Y4. Figure 7. The first Superload vehicle to cross the test bridge. Figure 8. Partial elevation view of the 5 span prestressed girder bridge. Figure 9. Test trucks used for load rating prior to passage of superload vehicle. Figure 10. Analytical prediction of girder strain from passage. Figure 11. Position of superload during load test. Figure 12. Superload crossing the prestressed girder bridge during load rating test. Figure 13. Experimental results of girder strain from superload passage.
Phares, et al.
10
FIGURE 1. Photograph of the main girders of Bridge One.
Phares, et al.
11
a) Plan view of Bridge One with transducer locations.
b) Cross section at mid-span with instrumentation. FIGURE 2. Illustrations of Bridge One.
NOTE: All units shown are in meters. NOTE: 1.0 m = 3.28 ft
Phares, et al.
12
FIGURE 3. Description of load vehicle used in the testing of Bridge One. NOTE: All length units shown are in meters. NOTE: 1.0 m = 3.28 ft 1 kN = 0.225 kips
Phares, et al.
13
FIGURE 4. Load paths used for the testing of Bridge One.
Phares, et al.
14
-10
0
10
20
30
40
50
60
0 5 10 15 20 25 30
Truck Position (m)
Mic
rost
rain
(mm
/mm
)
Angle
Bottom Flange
Top Flange
FIGURE 5. Plot of L7 for path Y1.
NOTE: 1 m = 3.28 ft
Phares, et al.
15
-20
0
20
40
60
80
100
0 5 10 15 20 25 30
Truck Position (m)
Mic
rost
rain
(mm
/mm
)
Model Top FlangeModel Bottom FlangeField Top FlangeField Bottom Flange
a) Transducer location L8 and truck path Y5
-20
0
20
40
60
80
100
0 5 10 15 20 25 30
Truck Position (m)
Mic
rost
rain
(mm
/mm
)
Model Top FlangeModel Bottom FlangeField Top FlangeField Bottom Flange
b) Transducer location L4 and truck path Y4 FIGURE 6. Plots of field and model data for L8 path Y5 and L4 path Y4.
NOTE: 1 m = 3.28 ft

Phares, et al.
16
FIGURE 7. The first Superload vehicle to cross the test bridge.
Phares, et al.
17
FIGURE 8. Partial elevation view of the 5 span prestressed girder bridge.

Phares, et al.
18
FIGURE 9. Test trucks used for load rating test prior to passage of superload vehicle.
Phares, et al.
19
-100
-50
0
50
100
150
200
250
0 100 200 300 400 500 600
Truck Position, ft
Mic
rost
rain
G2G4
FIGURE 10. Analytical prediction of girder strain from passage.
NOTE: See Figure 11 for Girder G2 and G4 location NOTE: 1 ft = 0.3048 m
Phares, et al.
20
FIGURE 11. Position of superload during load test.
BRIDGELC
Superload Exterior Axles
G1 G2 G3 G4 G5 G6

Phares, et al.
21
FIGURE 12. Superload crossing the prestressed girder bridge during load rating test.
Phares, et al.
22
-100
-50
0
50
100
150
200
250
0 100 200 300 400 500 600
Truck Position, ft
Mic
rost
rain
G2G3G4G5
FIGURE 13. Experimental results of girder strain from superload passage.
NOTE: See Figure 11 for Girder G2, G3, G4 location NOTE: 1 ft = 0.3048 m
Phares, et al.
23
TABLE 1. Section properties used in the modeling of Bridge One.
Member Non-
Composite Composite Initial Model
Optimized Model
Floor Beam #1 Iy
mm4 (106) 1,082 3,142 3,142 3,615 Floor Beam #2 Iy
mm4 (106) 1,550 4,279 4,279 4,928 Floor Beam #3 Iy
mm4 (106) 1,784 4,763 4,763 5,477 Stringer #1 Iy
mm4 (106) 50.78 291.8 291.8 335.5 Stringer #2 Iy
mm4 (106) 175.6 810.4 810.4 931.9 Girder w/ No Angle Iy
mm4 (106) 8,889 19,310 19,310 17,700 Girder w/ Angle Iy
mm4 (106) 11,080 26,840 26,840 30,360 Girder w/ 1 Cover Iy
mm4 (106) 12,610 31,900 31,900 36,150 Girder w/ 2 Cover Iy
mm4 (106) 13,350 34,460 34,460 38,680 Ext. Beam - End Iy
mm4 (106) 672.6 4,668 672.6 672.6 Ext. Beam - Int. Iy
mm4 (106) 805.8 5,772 805.8 805.8 Deck E
MPa 22,750 22,750 22,750 25,050 Spring Stiffness
kN-m/rad. 564,900 564,900 564,900 669,630
NOTE: 1 (106) mm4 = 2.403 in4 1 MPA = 0.145038 ksi 1 kN-m/rad = 8.858 in-k/rad