Embed Size (px)
Citation preview
Journal of Management and Marketing Research, Volume 17 – October, 2014
Implemented strategy in the automobile, Page 1
Implemented strategy in the automobile parts supply sector:
Direct and indirect effects on performance
David G. Meyer
Meyer & Associates
Steve Dunphy
Indiana University Northwest
Abstract
Using data from multiple sources regarding corporate strategic choice and its
implementation, combined with employee data regarding that implementation and its
effects, the effects of training, work design, technology, job feedback, job control,
empowerment, job security, and measures of workplace climate on multiple measures (from
multiple sources) of relative performance regarding cost and quality are examined. The
results suggest that the implementation of strategic choices regarding human resource
management practices and technology is complex. The interrelationships, supportive of the
configurational approach to HRM, must be carefully managed to exact performance
improvements.
Keywords: Implemented strategy, HRM alignment, auto parts
Copyright statement: Authors retain the copyright to the manuscripts published in AABRI
journals. Please see the AABRI Copyright Policy at http://www.aabri.com/copyright.html
Journal of Management and Marketing Research, Volume 17 – October, 2014
Implemented strategy in the automobile, Page 2
INTRODUCTION
In an Academy of Management Review article, Colbert (2004), while examining
complexity, called for research that could address whether the use of Universalistic, Contin-
gency, or Configurational HRM practice was supported by empirical evidence. By using
structural equation models, this study finds support for the use of complex, configurational
HRM strategies across eight auto parts supplier firms in the same labor market. This support
is found in the extensive interaction among both employee affective variables and the
objective aspects of the implementation of both HRM and technology programs. Note,
however, that because these results are found across all eight firms, the configuration is
easily duplicated across firms. The ease of duplication indicates that implemented complex,
configurational strategies may not be the source of extensive competitive advantage.
LITERATURE REVIEW
The focus of this paper is on testing whether the aggregated effects of strategy
implementation on performance are mutually reinforcing (Doty & Glick, 1994). As Colbert
(2004) found, the literature yields mixed results. For example, on one hand, Batt finds a
synergistic effect on performance of teams and technology. "Without appropriate training
and HR practices, for example, increased discretion alone may have negative performance
outcomes." (1999: 554) On the other hand, most studies have examined the isolated effects
of various components of implemented strategy (e.g., Koberg, Boss, Senjem, & Goodman,
1999 on empowerment; Chen, Cheng & Lai, 2010 on production rules). One reason for the
differing results may be because of the massive data requirements of testing more complex,
more fully specified models examining the extent of the interactions and their effects. In
order to sort out the complexity of the relationships, the following discussion will present
the models tested, beginning with the effects on employees of a variety of aspects of
implemented strategy and quickly turn to the effects of those individual components on
company performance before returning, at the end, to a discussion of the total effects of
implemented strategy on the organization, its culture, and the resulting performance.
It is important to note that, due to the complexity of the relationships and their
effects on performance, throughout the following discussion references will be made not
only to the independent variable and its relationship to performance, but to the relationships
among the independent variables and their combined effects on performance. Examples of
the combinations discussed are: two-way interactions: teamwork and classroom training;
job rotation and on-the-job training; new equipment and training; training and job security;
training and job control; teamwork and empowerment; empowerment and job control; job
control and work intensification; teamwork and feedback; job control and fairness; training
and empowerment; feedback and empowerment; the three-way interaction between
empowerment, job control, and work intensity; the four-way interaction between intensity,
control, security, and fairness; and so forth. It is clear from the literature that complexity
and configurational approaches are to be expected. By modeling all of these complex
interactions, this study attempts to sort out the true, direct effects of these independent
variables as well as the total effects of these independent variables in the context of a more
fully specified model than has been examined. Once the individual components of

Journal of Management and Marketing Research, Volume 17 – October, 2014
Implemented strategy in the automobile, Page 3
workplace strategic implementation have been discussed, their joint effects on company
performance will be examined.
Implemented Strategy
"Technologies must be there to succeed, but without a motivated, educated, and
committed work force, long-term success will be a struggle." (quoted in Longenecker,
Stansfield, & Dwyer, 1997). This quote puts into context the marriage of technology
implementation with supporting HRM programs. Should configurational approaches to
strategy implementation preside (as implied in the quote), there will be synergy between the
implementation of technology, its supporting HR systems, and company performance. That
is, there will be significant indirect effects of implemented strategy on company
performance along with the significant direct effects. If universalistic practices preside, the
direct effects of technology implementation and HRM programs on company performance
will be very close to the magnitude of the total effects of each - showing a distinct lack of
synergy. Further, there will be few interactions among the measures of technology and the
HRM system.
As shown in Figure 1, the effects on performance of two aspects of implemented
strategy are examined: the objective HR and technology choices (work teams, job rotation,
training, the newness of equipment, and computer usage) and the (less objectively chosen)
resulting workplace culture (fairness and safety). Between the implementation of strategy
and the resulting performance, there are intermediate factors of satisfaction with training,
feedback, job control, work intensification, empowerment, and security. A potential
precursor to performance is the willingness of the employees to do more. As strategic
choices of work design involving the HR system and the technology are made first, we
begin with them as indicated in table 1 in the appendix.
The Implemented HR System and Its Effects on the Employees
The work design practices of teamwork and job rotation and the associated training
are examined here. Teamwork and job rotation are aspects of a flexibility approach to work
(MacDuffie, 1995) and indicate increased empowerment, shifting control to the workers
(Longenecker, et al., 1997). The underlying work design of teams is assumed to increase
the empowerment of the employees and the teams (Carroll, 1997; 1998; Donovan, 1996).
For reasons that will become obvious, teamwork, an objective implementation of strategy,
and the components of empowerment, a more subjective result of the workplace conditions
that do not necessarily involve teamwork, are treated separately.
Teamwork
In team-based work, productivity increases often occur because the team assumes
management duties (Carroll, 1997; 1998; Donovan, 1996; Faxen, 1978). In order to
effectively assume these duties, both social (team-building) and technological training are
Journal of Management and Marketing Research, Volume 17 – October, 2014
Implemented strategy in the automobile, Page 4
necessary (Carroll, 1997; Faxen, 1978). The training must be delivered properly for the
team to be effective (Donovan, 1996; Longenecker, et al., 1997; Valle, Martin, Romero, &
Dolan, 2000).
Another aspect of team-based work that improves productivity is that feedback
regarding quality is available closer to the decision makers (Carroll, 1997; 1998). Carroll's
work found that the both the speed of feedback as well as the informational content were
much higher for teams, resulting in a synergistic impact on productivity. Nicholls, Lane,
and Brechu (1999) reported that the importance of feedback was stressed by their
respondents. These authors linked empowerment to job control. In sum, factors synergistic
with teamwork that lead to performance gains are adequate training, both social and
technological, feedback, and job control.
However, the implementation of teamwork does not lead only to positive outcomes
for employees. As additional duties are shifted to employees (see work intensification
below), either through teams or not, employees may find themselves overburdened. Yates,
Lewchuck, and Stewart (2001) found that when additional duties were added to teams,
without increased employee control over those duties, work was intensified, not empowered.
Rinehart, Huxley, and Robertson found that the control systems in the auto plant that they
studied could "be more oppressive than having a foreman watching over your shoulder."
(1997: 106) Clearly, a complex relationship between empowerment, job control, and work
intensity exists. It appears that high levels of intensity and low levels of control may be
more acceptable if accompanied by high levels of employment security and fairness.
Employees need to trust that they will not be downsized as the team assumes management
functions and is more productive. Further, if there is an investment in training, employers
must be able to recoup those costs. Thus, job security is necessary to maximize the utility
derived from team-based work for employees and employers. In sum, along with teamwork,
the effects of work intensification, empowerment, security, and fairness on performance
need to be examined.
Job Rotation
The implementation of job rotation is expected to increase the flexibility of the
employer's deployment of its human resources (MacDuffie, 1995). Successful
implementation requires extensive cross training. Each employee in the rotation must be
able to perform every job in the rotation. Cross training is most likely to occur on-the-job.
When job rotation is part of the work design, the amount of individual job control available
to employees drops. However, regarding performance, Carroll (1998) stressed that the
collective ability of team members to solve problems was an important contributor to the
gains made. Each employee brings their own unique perspective to each job in the rotation,
providing a larger set of alternative solutions to problems. Yet, in the same paragraph, the
potential negative effect of peer pressure on performance was made (p. 25). De Leede,
Nijhof, and Fisscher (1999), in examining the extent of empowerment in teams, found that
coercive control and power limiting by management called into question the fairness of the
exchange of increased empowerment for reduced individual discretion. If employees
within a job rotation are egalitarian, when a particular job within the rotation is more
difficult than the others, sharing that difficulty may be seen as more fair than not sharing.
Whether the performance gains made by increasing the flexibility offset the potential
Journal of Management and Marketing Research, Volume 17 – October, 2014
Implemented strategy in the automobile, Page 5
problems from reduced individual discretion, that is, reduced empowerment, needs to be
tested.
Training
When teamwork with potential job rotation is implemented, training is essential.
Training in team building and interpersonal skills is important to ensure performance gains.
This type of training is more likely to occur off-the-job, potentially in a classroom setting.
As argued above, if job rotation is implemented, on-the-job training is more likely to be
used. Arthur (1994) suggested that high commitment systems require sufficient training to
achieve high skill levels. Barron, Berger, and Black (1999), studying on-the-job training,
found a large, robust impact of training on productivity growth. Denton (1995) found that
manufacturing firms with formal training programs had a 19% greater increase in
productivity than firms without formal training. Laschinger, Finegan, and Shamian found
that "having the opportunity to learn and grow" (2001: 8) was an important aspect of
empowerment. Longenecker and coauthors (1997) found that continuous/cross training was
cited by 63% of their respondents as a key practice for improving the organization's
performance. MacDuffie (1995) differentiated between on- and off-the-job training.
Nicholls and coauthors (1999) reported that executives called for more training in order for
workers to be more effective team members.
Having discussed the overtly chosen aspects of the implemented HRM strategy, the
less overt aspects can be discussed.
Feedback
Carroll (1997; 1998) has argued that one key component leading to improved
performance is providing greater feedback to the employees. Greater feedback can either be
from management - regarding aggregate performance, or from fellow employees - regarding
issues pertaining to the group or work area. Denton found that "team decision makers
function more effectively when information is actively exchanged among team members."
(1995: 9) Forrester and Drexler contended that "The foundation of trust is the full sharing
of important information." (1999: 39) Laschinger and coauthors found that "having access
to information" (2001: 8) is an important aspect of empowerment. Longenecker and
coauthors (1997) found that the key practice most cited in leading to increased performance
is "systematic sharing of operating data". Nicholls and coauthors (1999) reported that
executives called for the need to provide feedback in order for workers to be more effective
team members. Laschinger and coauthors (2001) found that feedback, job control, and
discretion were related to increased commitment. It is important to note that access to
information is an important precursor to Spreitzer's four-faceted measure of empowerment
(1995; 1996).
Job Control
Properly trained employees with appropriate feedback, whether they are in teams or
not, should apply their skills and efforts to maximizing their performance. In order for that
to happen, they must be provided with discretion to properly apply those skills and efforts.
Journal of Management and Marketing Research, Volume 17 – October, 2014
Implemented strategy in the automobile, Page 6
Denton (1995) found that more control over the job was an important component of
empowerment. Huselid (1995) discussed the contribution of discretionary effort. He
contend-ed that increased discretion leads to greater employee willingness to do more.
Langbein (2000) found that a trusting environment where employees can exercise discretion
without fear of reprisal is an important precursor of effectiveness. Laschinger and coauthors
(2001) found that "feelings of autonomy" was an important precursor to effectiveness.
Nicholls and coauthors (1999) reported that a result of empowering workgroups is greater
control over the job. Busche, Havlovic, and Coetzer found that "empowered team members
needed to feel an increase in choicefulness (more control over what they put their effort
into) to experience any other kind of empowerment as well." (1996b: 83) These findings
lead to an examination of job control (self-determination) separately from the other three
facets of empowerment.
Work Intensification
As discussed above, when the work redesign results in work intensification and the
shifting of management functions onto the members of the work team, employees report a
lower quality of work life and lower job satisfaction. The higher stress levels should lead to
reduced willingness to apply discretion to improved performance - Laschinger and
coauthors (2001) found that "decreased occupational stress" led to greater effectiveness.
Busche and coauthors (1996a) found that empowerment reduced the employees' stress level,
and, in linking increased empowerment to reduced stress, attributed the effect to increased
job control (1996a; 1996b). Foley, Maxwell, and McGillivray (1999) associated
intensification with the use of "hard" HRM systems - those designed to extract the greatest
performance out of employees. So, to some extent (see the "intensity and control in
exchange for security and fairness" tradeoff discussed above), increased stress through more
intensive work may lead to better company performance - a twist on the old "speed-up"
argument.
Empowerment
Although a (maybe the) key concept in the quest for improved performance,
empowerment, though oft-studied, remains somewhat elusive. Spreitzer, De Janasz, and
Quinn expressed concern that "our understanding of the consequences of employee
empowerment is limited." (1999: 511) A popular notion (e.g. Carroll, 1997; 1998;
Donovan, 1996) is that empowerment is operationalized at work through teams with the
intent of improving productivity. Thus, links from empowerment to productivity should be
found, particularly where teamwork has been implemented (see Cooke, Meyer, & Huxley,
2005).
To help frame the expected effects of empowerment on performance, a variety of
points need to be noted. Appelbaum, Hebert, and Leroux (1999) examined the
empowerment gap between managers and employees. They contend that employees may
see management's limits on their behavior, by setting the objectives, to be more constraining
than the increased autonomy offered. In contrast, Busche and coauthors found a synergistic
effect of empowered teams: "A person who experienced empowerment in one facet was
Journal of Management and Marketing Research, Volume 17 – October, 2014
Implemented strategy in the automobile, Page 7
more likely to experience it in other facets as well." (1996b: 82) One manner of resolving
this dichotomy is offered by Holden (1999). He pointed out that the perception of
increased empowerment is often one of perspective. Management perceives that employees
are more empowered, but the employees do not. Thus measuring empowerment at the
employee level is important. It could be, perhaps, that the meaning and competence facets
of empowerment are unconstrained by management, but that the impact and self-
determination (see above) facets, particularly of individuals rather than teams, are much
more constrained by management.
Implemented Technology
Here, the strategic technological implementation choices of adding new machines to
the work area and the extent of the use of computers by employees in the work area are
examined. Zammuto and O'Connor (1992) examined what organizational components must
accompany the use of advanced technology to maximize its benefits. In particular, they
examined the increased use of computers. As did MacDuffie (1995), they distinguished
between control-oriented improvements, which limit employee discretion, and flexibility-
oriented design, which, through training and team design, increases employee discretion.
Oliner and Sichel (2000) reported that increased computer usage increased productivity.
Collins (1995) found that when new tools and machinery were added, performance
improved.
The Resulting Workplace Culture
The strategic implementation of HRM practices and technology improvements does
not often occur in a vacuum. In non-greenfield workplaces there were prior HRM practices
and use of technology that formed a baseline for employee expectations. These, along with
interactions with management over time, helped to form a prevailing workplace culture.
Marcoulides and Heck (1993: 222), in examining the effects of a variety of culture variables
on organizational performance, found support for the human resource management
perspective's efforts to positively affect performance. In particular, the organization placing
emphasis on safety and the employees' view of "the organization's use of technology and
adoption of new ideas" were important. Three components of culture are examined here:
security, fairness, and safety.
Security
In addition to the work cited above, other authors also found that security was an
important component leading to improved performance. Forrester and Drexler (1999)
stressed the importance of guaranteeing the security of employees when moving to a team-
based structure. However, Fisher (1997) saw security as an aspect of the "Culture of
Complacency" and a hindrance to improved performance. Busche and coauthors (1996b)
found that security was important to empowered teams. Huselid (1995) found that
improved job security was key to improved performance.

Journal of Management and Marketing Research, Volume 17 – October, 2014
Implemented strategy in the automobile, Page 8
Fairness
As first discussed under Work Intensification, perceived fairness at the work-place is
an important precursor to employee willingness to do more for the employer. Busche and
coauthors (1996b) found that fairness was important to empowered teams. Blancero,
Marron, and Keller (1997), examining high performance work systems, reported increased
employee concern with fairness regarding pay and treatment in those systems. Concern for
a fair exchange of effort for pay and security may be especially high where there is no
formal employment contract to govern the employment relationship. Feedback regarding
performance, its linkage to pay and security, and, given that, information as to both referent
others and their employment relationship are all necessary for fairness to be perceived.
Safety
Collins (1995), concluding that trust is central to the successful implementation of a
gainsharing plan, found that employee perceptions of safety and fairness also improved
when trust increased. He found two important components of a trusting relationship that are
relevant here. As a first step in the change process, management must be willing to share
decision-making power (see Job Control above). Also, increased training and development
must accompany the implementation of new machinery (see above). McLain (1995) found
that subjective perceptions of risk to health and safety affected work attitudes and
performance. The fairness of the risk allocation across employees and jobs was also found
to affect performance. Egalitarianism may not just apply to sharing difficult jobs in a
rotation, but to all aspects of the workplace exchange.
In sum, the literature has examined various relationships among the independent
variables and their combined effects on performance. The complexity and configurational
theories of HRM variables and the resulting effects on performance seem to be expected.
However, even in these focused studies, multiple interactions were found; two-way
(e.g.,teamwork and classroom training); three-way (e.g., empowerment, job control, and
work intensity); and four-way (e.g.,intensity, control, security, and fairness) interactions
were routinely found. In a more fully specified model, it is possible to examine these
complex interactions, sorting out the direct effects on performance of the independent
variables as well as the total effects on performance of the independent variables.
IMPLEMENTED HRM AND TECHNOLOGY STRATEGIES, WORKPLACE
CULTURE, EMPLOYEE AFFECT OUTCOMES, AND COMPANY
PERFORMANCE.
For a variety of reasons, for large companies, performance data are more difficult to
come by at the plant level than at the corporate level. When this difficulty is combined with
the reluctance of all companies, privately held companies in particular, to provide specific
profitability data, it is extremely difficult to obtain appropriate performance data.
Combining these difficulties with the need to have multiple sources of subjective data to
improve the accuracy of the measures provides additional challenges to researchers.
Absent accessible hard data, plant management still should have a reasonably precise
and accurate perception of their performance relative to their competitors selling similar
Journal of Management and Marketing Research, Volume 17 – October, 2014
Implemented strategy in the automobile, Page 9
products. Further, cost containment and providing the best (and improving!) quality are the
most important performance measures to the companies studied.
To be successful, a company’s strategic choice and the resulting implementation
(e.g., see Cooke, et al., 2005) must provide the means for improving cost and quality
performance. It is proposed that the employees are the primary means by which HRM
practices and improved technology improve cost and quality performance. That is, via the
strategy implementation, the employees either do more, do better, or both. One manner of
measuring successful implementation is to determine whether the employees are willing to
do (or are doing) more or not and then determine whether management and the employees
are able to translate this increased (decreased) willingness (or action) into better (worse)
performance. Following this argument, the following hypotheses are offered:
Hypothesis 1. When employees report a) greater satisfaction with their skill development,
b) more feedback regarding their job, c) greater empowerment, d) greater control over their
job, e) less intense work, and f) greater job security, they will be more willing to do (or are
doing) more at work.
Hypothesis 2. When employees report a) greater satisfaction with their skill development,
b) more feedback regarding their job, c) greater empowerment, d) greater control over their
job, e) less intense work, and f) greater job security, managers will report improved relative
labor costs.
Hypothesis 3. When employees report a) greater satisfaction with their skill development,
b) more feedback regarding their job, c) greater empowerment, d) greater control over their
job, e) less intense work, and f) greater job security, managers will report better relative
product quality.
To backtrack a bit, though employees may perceive the individual impact of each
aspect of implemented strategy, they may not differentiate among the individual
components of the implementation. That is if management devises a particular level of
feedback and provides it, the employees may not differentiate the impact of that on their
willingness to do more or on the resulting performance from the particular level of
empowerment that was (also) devised and provided. Further, as these choices become joint
in nature, dynamic, or synergistic, the total effects should be, respectively, not solely
attributed to management implementation, changing, or greater than the sum of the parts.
Focusing on the Universalistic or Configurational effects of HRM and technology
strategic choices and their implementation on performance, if the Configurational approach
is supported, every aspect of strategic implementation will affect the other, interrelated,
choices. Further, the indirect effects will also be significant. However, a cautionary note is
necessary. Common affective reasons may also cause these interrelationships. Thus,
interrelationships are either an indication that employers carefully choose reinforcing,
coordinated strategy implementation, or that general employee affect dominates the
employees’ responses. Throwing caution to the wind, the following is offered as a test of
the Configurational vs. Universalistic approach:

Journal of Management and Marketing Research, Volume 17 – October, 2014
Implemented strategy in the automobile, Page 10
Hypothesis 4. Employee responses to strategy implementation will be global in nature.
That is: When employees report any of the following: a) greater satisfaction with their skill
development, b) more feedback regarding their job, c) greater empowerment, d) greater
control over their job, e) less intense work, or f) greater job security, they will also report
more of the others and less intense work.
Having laid the groundwork for a discussion of complexity and the contingency
approach to HRM, we now turn to that discussion. If the level of complexity of the
implemented strategy is such that it cannot be duplicated across firms, then the present study
– using data pooled across eight firms – will yield no results. Colbert (2004), drawing on
Kelly (1994: 353), states “Attempts to install highly complex organization, without growing
it, inevitably lead to failure.” If that is so, then there will be no similar interactive paths
among the strategy implementation and worker affect variables across the eight firms in this
study, let alone any relationship of those strategic variables to relative company
performance. However, these firms were members of a council to promote union-
management cooperation to positive effect. Extensive sharing and learning has taken place
across these council members. If these complex interactions did have positive effects, and if
they are easily duplicated, then it would be expected that they would spread rapidly across
council members. That is, while all member firms have some unique aspects of
implementing training, HRM programs, and technology, all have chosen the fundamental
strategy of attempting to grow a cooperative union-management environment in the same
labor market and were willing to share their experiences with each other.
Believing the latter to be more likely to be the source of performance gains,
complexity will show across firms in an extensive set of interactions across (for employees)
greater satisfaction with their skill development, more feedback regarding their job, greater
empowerment, greater control over their job, less intense work, and greater job security
(here, the independent or exogenous latent variables), as well as between those variables and
the measures of strategy implementation. Not only will there be the direct impact on
performance of these variables (discussed in hypotheses 1-3 above), there will be significant
indirect effects of the strategy implementation and its effects on the employees’ affect to go
along with the significant direct effects of the strategy implementation. Those indirect
effects will flow through the extensive interactions among the independent (here, both
strategy implementation and exogenous latent) variables and the outcome measures of
willingness to do more, and labor cost and product quality comparisons.
Hypothesis 5. A) There will be extensive interactions found among: employee reports of: i)
greater satisfaction with their skill development, ii) more feedback regarding their job, iii)
greater empowerment, iv) greater control over their job, v) less intense work, and vi)
greater job security, vii) classroom training, viii) on-the-job training, ix) working in a team,
x) rotating jobs, xi) having more new equipment in their work area, xii) more extensively
using computers, that the company: xiii) treats them more fairly, and xiv) provides a safer
work environment, and reports that they will be more willing to do more at work, as well as
managers reporting improved relative labor costs and improved product quality; b) there
will be significant indirect effects of the system of variables i-xiv on employee reports that
they will be more willing to do more at work, as well as managers reporting improved
relative labor costs and improved product quality.
Journal of Management and Marketing Research, Volume 17 – October, 2014
Implemented strategy in the automobile, Page 11
Although finding support for hypotheses 5a and 5b provides support for the configurational
theory over the universalistic and contingency theories, finding that effect across eight firms
suggests that the installation of such a system is not as difficult as suggested by the
literature.
Having discussed the general, total effects of the implemented system on employees
and company performance, we can turn to an examination of each specific aspect of the
strategy implementation on the employees and company performance.
There are two types of training examined here: classroom and on-the-job. Though
classroom training is expected to be associated with the implementation of teamwork, more
new machinery, and the increased use of computers, and on-the-job training is expected to
be associated with job rotation, testing for these relationships is not the focus of this study.
Rather, greater amounts of each type of training are expected to be associated with greater
extent of satisfaction with skill development and then to a greater willingness to do more
and then on to better performance (see hypotheses 1-3). It is thought that more training will
lead to greater effectiveness, though there may be a learning curve in operation which leads
to a lower increase in knowledge per hour of training past a certain number of hours.
Further, in support of Hypothesis 5a and 5b, we expect to see synergistic indirect effects of
satisfaction with training on company performance, either directly through satisfaction with
skill development or indirectly through feedback, empowerment, job control, intensity, and
security. Thus, the following is offered:
Hypothesis 6. When employees report more hours of a) classroom training, b) on-the-job
raining, they will also report 1) greater satisfaction with their skill development, 2) more
feedback regarding their job, 3) greater empowerment, 4) greater control over their job, 5)
less intense work, and 6) greater job security.
The implementation of teamwork and job rotation, to the extent that they have been
well-implemented, that is, to a positive effect, will have more positive affective impact on
the employees than if they are poorly implemented. Given the thrust of the literature
discussed above, both teamwork and job rotation are expected to be associated with greater
skill development satisfaction, feedback, empowerment, and, potentially, greater security.
Further, greater intensity is expected to be associated with both teamwork and job rotation,
and that teamwork is associated with greater job control, whereas job rotation is associated
with less job control. Thus, the following is offered:
Hypothesis 7. When employees report that they: a) work in a team, and/or b) rotate jobs,
they will also report 1) greater satisfaction with their skill development, 2) more feedback
regarding their job, 3) greater empowerment, a4) greater, b4) lesser control over their job,
5) more intense work, and 6) greater job security.
Matters are a bit more straightforward with technology implementation. The
implementation of a greater percentage of newer equipment and/or the more extensive use
of computers will have positive affective and performance effects. Thus, the following is
offered:
Journal of Management and Marketing Research, Volume 17 – October, 2014
Implemented strategy in the automobile, Page 12
Hypothesis 8. When employees report that they: a) have more new equipment in their work
area, and/or b) more extensively use computers, they will also report 1) greater satisfaction
with their skill development, 2) more feedback regarding their job, 3) greater empower-
ment, 4) greater control over their job, 5) less intense work, and 6) greater job security.
The overall climate is a key factor in leading to increased employee willingness to
do more as well as (the resulting) improved performance. Here, employee perceptions of
the company’s provision of a fair and safe work environment are examined. Either leads to
better outcomes. The provision of extensive levels of both may have synergistic effects.
[See above on the capacity argument – when the allocation of more intense effort is fairly
spread over the workforce, the higher level of intensity is more acceptable.] Thus, the
following is offered:
Hypothesis 9. When employees report that the company: a) treats them more fairly, and/or
b) provides a safer work environment, they will also report 1) greater satisfaction with their
skill development, 2) more feedback regarding their job, 3) greater empowerment, 4)
greater control over their job, 5) less intense work, and 6) greater job security.
Lastly, in order to provide a direct test of complexity, three different, nested models
are examined. As seen in Figure 1, all of the paths labeled ‘b’ and ‘c’ are also found in the
model containing paths labeled ‘a’. Path ‘c’, the least complex, contains direct effects of
employee affect outcomes on product quality and labor cost comparisons, but does not
contain the intermediate outcome of employee intention. Nor does model ‘c’ contain a path
from product quality comparisons to labor cost comparisons – the path added in model ‘b’.
Model ‘c’ adds the indirect paths through employee intention to the outcomes of product
quality and labor cost comparisons. The theory underlying these models is that employee
affect outcomes will have direct effects on product quality and labor cost comparisons
(model ‘c’); that improvements in product quality comparisons will be used to improve
labor cost comparisons (model ‘b’); and that employee willingness to do more (or their
doing more) will lead to improved product quality and labor cost comparisons (model ‘a’).
As described by Kelloway (1998), nested models and their fit to particular data can
be tested by examining the difference in the χ2 reduction for the degrees of freedom used. If
the use of a degree of freedom leads to a significant drop in the χ2, the data provide a better
fit to the model. Hence,
Hypothesis 10. More complex models (‘b’ and ‘c’) will provide a better fit to the data than
less complex models (‘a’ and ‘b’, respectively).
Sample
The data were drawn from part of a larger project funded by the Russell Sage and
Rockefeller Foundations. The employee responses to a questionnaire surveying their
perceptions are used here. The surveys were conducted on location, during work time,
across all shifts as needed, at eight unionized firms located in SE Michigan during 2000-
2001. A member of the research team was present at all times during the survey. Response
Journal of Management and Marketing Research, Volume 17 – October, 2014
Implemented strategy in the automobile, Page 13
rates ranged from 55% to 86% across the eight firms, with an overall response rate of 69%,
yielding a total of 888 observations.
These employee data were then paired with data drawn from questionnaire data
obtained from the HRM manager and the operations manager at each location. For these
facilities, the managers were asked to evaluate the relative performance of their company
against “other manufacturers that produce similar components.”
Measures
The employee affective and climate measures were measured using seven point
Likert scales ranging from strongly disagree (1) to strongly agree (7). Teamwork was
measured with a yes or no question. Job rotation was measured with a “not at all”, “some”,
or “a lot” choice, as were the newness of equipment (in the last 5 years, using “none”), and
computer usage (also using “none”). These were coded 0, 1, 2. Training hours were
measured with the following question format:
Roughly, how many hours of classroom [on-the-job] training have you received from the
company since you started working here? ___ hours
Due to the need to use certain questions as metrics, the outcome measures are
discussed below where the latent variables are discussed. More information on the
measures used is found in Table 1 (Appendix).
INITIAL RESULTS: STRATEGY IMPLEMENTATION AND THE
MEASUREMENT MODELS
Table 2 shows the simple first order correlations among the strategy implementation
measures. Hours of classroom training are positively correlated with use of computers and
hours of on-the-job training. Hours of on-the-job training are positively correlated with use
of computers and greater reported fairness. Being in a work team is positively correlated
with job rotation, use of computers, and greater reported fairness and safety. Job rotation is
positively correlated with more new equipment and greater reported fairness. More new
equipment is positively correlated with increased computer usage. Increased computer
usage is positively correlated with greater reported fairness and safety. And, finally, greater
fairness is positively correlated with greater safety. These results are not surprising, nor are
they terribly insightful. Note that hours of classroom training are not correlated with being
in a work team, and that hours of on-the-job training are not correlated with job rotation.
Determining the effects of these strategic implementations on company performance will be
shown to be complex as indicated in table 2 in the appendix.
The results of the measurement models for the LISREL model are shown in Tables 3
and 4. All coefficients reported in this study are drawn from the most complex model -
labeled 'a' in Figure 1. Table 3 shows that all of the outcome measures are significantly
associated with the appropriate outcome latent variables. The latent variable "Employee
willingness to do more (DoesMore)", metrically established by "My company inspires me to
do my best in performing my job", contains four measures and has a coefficient α of .600.
The latent variable "Relative labor cost comparison (LabCost)", metrically established by

Journal of Management and Marketing Research, Volume 17 – October, 2014
Implemented strategy in the automobile, Page 14
the Operations Manager's response to the question "In comparison to other manufacturers
that produce similar components, how does your company perform regarding ……. c. unit
labor costs", contains two components and has a coefficient α of .940. The other
component is the Human Resource Manager's response to the same question. Last, the
latent variable "Relative quality performance (QualPerf)", metrically established by the
Operations Manager's response to the question "In comparison to other manufacturers that
produce similar components, how does your company perform regarding ……. d. product
quality", contains two components and has a coefficient α of .537. The other component is
the Human Resource Manager's response to the same question. Every measure associated
with the appropriate latent outcome variable achieves a high significance level.
Table 4 shows all of the coefficients of the measurement variables associated with
the employee affect outcome variables - the unmeasured exogenous latent independent
variables, as well as the coefficients of the strategy implementation variables on those
employee affect variables. All of these variables are employee level responses to questions
on a questionnaire (See Table 1). The latent variable "Skill Development Satisfaction
(SklDevSa)" contains seven measures and has a coefficient α of .815. The latent variable
"Feedback" contains three measures and has a coefficient α of .544. The latent variable
"Job Control (JobCont)" (one facet of empowerment) contains three measures and has a
coefficient α of .705. The latent variable "Work Intensity (Intensit)" contains three
measures and has a coefficient α of .656. The latent variable "Empowerment (Empowerm)"
(representing the other three facets of empowerment) contains nine measures and has a
coefficient α of .742. The latent variable "Employment Security (Security)" contains eight
measures and has a coefficient α of .543. In sum, all of the latent variables exhibit
acceptable coefficient alphas. Further, all measures attain high levels of significance for
their loadings on the associated latent variables. Only the reverse coded "Not Mastered
Skill" falls short of the .001 level.
Also shown in Table 4 are the implementation variables and their coefficients of
association with the latent variables. As these results affect the tests of the hypotheses,
these coefficients will be discussed in the next section and are summarized in tables 3 and 4
in the appendix.
RESULTS
Figure 2 shows one part of the results of the LISREL estimation - the impact of
various employee responses to strategy implementation on employee affect outcomes and
those outcomes’ effects on the three outcome variables (model 'a' in Figure 1). The results
presented in Figure 2 are also presented in Table 5. Note that only one model (model 'a') is
reported here. The results are broken into two figures for clarity. The significant results
are: When employees report greater satisfaction with their skill development, they are
willing to do (or are doing) more (Hypothesis 1a) and managers report decreased relative
product quality (counter to Hypothesis 3a). Hypothesis 2a is not supported. When
employees report that they receive more feedback, they are willing to do (or are doing) more
(Hypothesis 1b), managers report poorer labor cost comparisons (counter to Hypothesis 2b),
and managers report increased relative product quality (Hypothesis 3b). When employees
report greater job control, they are less willing to do more (counter to Hypothesis 1d,
significant in a one-tailed test), managers report improved labor cost comparisons
Journal of Management and Marketing Research, Volume 17 – October, 2014
Implemented strategy in the automobile, Page 15
(Hypothesis 2d) and decreased relative product quality (counter to Hypothesis 3d). When
employees report greater work intensity, they are willing to do (or are doing) more (counter
to Hypothesis 1e), and managers report poorer labor cost comparisons (Hypothesis 2e) and
increased relative product quality (counter to Hypothesis 3e). When employees report
greater (three faceted) empowerment, managers report poorer labor cost comparisons
(counter to Hypothesis 2c, significant in a one-tailed test). Hypotheses 1c and 3c are not
supported. When employees report greater job security, they are willing to do (or are doing)
more (Hypothesis 1f) and managers report poorer labor cost comparisons (counter to
Hypothesis 2f). Hypothesis 3f is not supported. In sum, of the 18 hypotheses offered, 6
receive support, 8 are counter indicated, and 4 are not supported. These complex,
conflicting results will be discussed further in the next section and are summarized in figure
2 and tables 5, 6 and 7 in the appendix.
Two other results shown in Figure 2 are important. Of greatest importance is the
high magnitude, negative, significant relationship between managerial reports of relative
labor cost comparisons and relative product quality. These plant managers report that
improved labor costs (lower relative to the others) are associated with improved quality. Of
lower magnitude, but important, is the low magnitude, significant, negative relationship
between employee willingness to do more and reports of relative labor cost comparisons.
When employees are willing to do (or are doing) more, management reports that they are
able to achieve improved relative labor costs. These results are also found in Table 7. Note
the high R2's for willingness to do more and labor cost comparisons. The impact of the
implemented strategies and employee affective responses explain quite a bit of the variance
in employee willingness to do more and labor cost comparisons. Hence, the strategic
implementation variables examined here seem to be used by management to improve their
labor costs - a significant finding. Though the results reported above are conflicting
regarding the path, the results regarding the outcomes are clear and significant: the strategy
implemented provides improved outcomes in these eight facilities. The discussion will
provide some clarification regarding the path by which these outcomes are achieved.
A supporting point to the above is the complexity and interrelatedness of strategic
choices and their implementation, shown in Table 6. All of the endogenous latent variables
are significantly related to each other, with high magnitudes. All exhibit the signs expected:
intensity is negatively related to all the others, which have positive relationships.
Hypotheses 4a-f are supported.
The effects of strategy implementation on worker affective outcome variables are
exhibited in Figure 3. Only the significant linkages are shown. These results are also found
in Table 4. As expected, the two types of training are positively and significantly associated
with skill development satisfaction (Hypotheses 6a1 and 6b1). Also, as expected, more
hours of classroom training are associated with increased job control (Hypothesis 6a4) and
more on-the-job training hours are associated with reduced intensity (Hypothesis 6b5,
significant in a one-tailed test). Unexpected results are that greater amounts of both types
of training are associated with lower security (counter to Hypotheses 6a6 and 6b6
[significant in a one-tailed test]) and more hours of classroom training are associated with
decreased feedback (counter to Hypothesis 6a2). Hypotheses 6a3, 6a5, 6b2, 6b3, and 6b4
are not supported.
Being in a work team is, as expected, positively and significantly associated with
feedback (Hypothesis 7a2), and negatively and significantly associated with job control
Journal of Management and Marketing Research, Volume 17 – October, 2014
Implemented strategy in the automobile, Page 16
(Hypothesis 7a4). Rotating jobs, correlated with being in a work team, is positively and
significantly associated with skill development satisfaction, feedback, and intensity
(Hypotheses 7b1, 7b2, and 7b5 [significant in a one-tailed test]), and negatively and
significantly associated with job control and security (supporting Hypothesis 7b4, and
counter to Hypothesis 7b6). Hypotheses 7a1, 7a3, 7a5, 7a6, and 7b3 are not supported.
Newer equipment, associated with greater classroom training, is positively and
significantly associated with skill development satisfaction, feedback, and intensity
(supporting Hypotheses 8a1 and 8a2, and counter to Hypothesis 8a4), and negatively and
significantly associated with security (counter to Hypothesis 8a6). Greater use of
computers, correlated with greater classroom and on-the-job training, is positively and
significantly associated with skill development satisfaction, job control, and empowerment
(Hypotheses 8b1, 8b3, and 8b5), and negatively and significantly associated with feedback
and security (counter to Hypotheses 8b2 and 8b6). Hypotheses 8a3, 8a5, and 8b4 are not
supported.
Of the more global measures of workplace culture, fairness and safety, each has
significant effects on five of the employee affect outcome variables. Fairness is positively
and significantly associated with skill development satisfaction, feedback, and security
(Hypotheses 9a1, 9a2, and 9a6), and negatively and significantly associated with intensity
and empowerment (supporting Hypothesis 9a5 and counter to Hypothesis 9a3 [significant in
a one-tailed test]). Safety is positively and significantly associated with feedback,
empowerment, and security (Hypotheses 9b2, 9b3 [significant in a one-tailed test], and 9b6),
and negatively and significantly associated with job control and intensity (counter to
Hypothesis 9b4, supporting Hypothesis 9b5 [significant in a one-tailed test]). Hypotheses
9a4 and 9b1 are not supported.
In sum of these 48 hypotheses relating specific aspects of strategy implementation
on employee affect, 23 are supported, 10 are counterindicated, and 15 are not supported.
These results further support the complexity of the situation as indicated in figure 3 and in
tables 8 and 9 in the appendix.
Turning to the direct test of complexity, Hypothesis 10, three different, nested
models were examined. The least complex of the three models, path 'c' in Figure 1, resulted
in a χ2 of 4800.01 with 888 degrees of freedom. The next most complex of the three
models, paths 'b' in Figure 1, resulted in a χ2 of 4664.52 with 887 degrees of freedom, a
reduction in the χ2 of more than 135 using one degree of freedom - highly significant. The
most complex of the three models, paths 'a' in Figure 1, resulted in a χ2 of 4223.06 with
1102 degrees of freedom, a reduction in the χ2 of more than 341 using 215 more degrees of
freedom - a significant improvement. Hypothesis 10 is supported.
This brings us to the test of Hypotheses 5a and 5b. Given that complexity is
supported, it should not be surprising that there are multiple paths by which the strategy
implementation variables affect the independent latent variables (Table 4 and Figure 3) and
that the independent latent variables all affect each other (Table 6) as well as having
extensive effects on the outcome variables (Figure 2 and Tables 5 and 8). In a test of
hypothesis 5a, of the 81 potential interactions among the 8 strategy implementation
variables, the 6 latent exogenous (independent) variables, and the 3 (ordered) endogenous
(outcome) variables, 62 achieve some level of significance (77%). If (three faceted)
empowerment is excluded, 58 of 70 achieve significance (83%). Given that complexity is
supported (paths 'a' in Figure 1), the only indirect effects left in the model are those affecting

Journal of Management and Marketing Research, Volume 17 – October, 2014
Implemented strategy in the automobile, Page 17
labor cost reduction. Five of the six indirect paths have significant impact on labor cost
reduction (see Table 8). Only (three faceted) empowerment does not have a significant
indirect effect. Indeed the direct effect of three faceted empowerment is only marginally
significant. All other latent variables exhibit significant and extensive indirect and direct
effects on the outcome variables. In fact, 70% of the variance in labor cost reduction is
explained by this model. Lest this be attributed to the common method variance, or (more
likely) common perceptions, of the eight operations and eight HR managers, note that 72%
of the variance in "DoesMore" is also explained. There are 888 different perceptions of
"DoesMore".
To bring some sense of impact to these results, Table 9 presents the standardized
magnitudes of the impact of the strategic implementation measures on the latent exogenous
variables - the employee affect outcomes. An examination of these magnitudes provides a
sense of the complexity of the full model and the extent of the interactions involved. For
example, the variables with the largest magnitude effects on labor cost comparisons are
feedback and job control (direct, see Table 5), skill development satisfaction (indirect, see
Table 8), and security (direct and indirect). The strategy implementation variables affecting
labor cost comparisons (through these four variables) are: 1) hours of classroom training,
hours of on-the-job training, job rotation, the newness of equipment, use of computers, and
fair treatment - all through skill development satisfaction; 2) hours of classroom training,
hours of on-the-job training, work team, job rotation, the newness of equipment, use of
computers, fair treatment, and safety - all through feedback; 3) hours of classroom training,
work team, job rotation, use of computers, and safety - all through job control; and 4) hours
of classroom training, hours of on-the-job training, job rotation, the newness of equipment,
use of computers, fair treatment, and safety - all through security. Though it appears that
everything affects everything (that's the complexity) we can be much more precise - some
things do not affect other things - for example, empowerment has only a marginal effect on
labor cost reduction (through use of computers). Further, the effect of a certain strategic
implementation variable, even taken on its own, has complex effects. For example, the use
of job rotation is positively associated with skill development satisfaction and feedback, but
negatively associated with job control and security, all of which have significant effects on
labor cost reduction.
Although we would expect the extensive interactions shown among the latent
variables to be due to common method variance due to the questionnaire methodology, we
would not expect to see the extensive interactive effects of the implemented strategic
variables, which are objectively measured, on the latent variables. This supports the
configurational perspective on HRM strategy. Note that none of these complex results
could have been inferred from the correlations found in Table 2.
DISCUSSION
The greatest limitation of this study, that there are only eight cases examined, also
leads to a significant finding: these eight companies exhibit extremely similar sets of
relationships in their implementation of strategy and the resulting performance. This is
particularly striking given the support for complexity over simplicity. These eight council
members, all willing to share with each other their experiences in choosing and
implementing technology and HR systems, reached convergence as to the effects of those
Journal of Management and Marketing Research, Volume 17 – October, 2014
Implemented strategy in the automobile, Page 18
implementations. Many other factors may be at work here: their choice to be a council
member, their willingness to be studied by outside researchers, etc. Even though these
companies might be "poster children" for sharing their secrets of competitive advantage - or,
at least, improving cost and quality, apparently the ability of other firms to duplicate the
complex implementation and yield positive performance results needs further examination.
If technology and HRM systems do not provide lasting or sustainable competitive
advantage, companies need to look elsewhere for competitive advantage, sustainable or not.
It could be that in this age of hypercompetition simple survival may be sufficient for many
companies.
The results provide support for complexity as a manner of explaining the phenomena
of implementation of strategic choices and the resulting impact on company performance.
The more complex the model estimated against the data, the better the fit. This result brings
back to the fore the issue of underspecification of models. Because of study or data
limitations, many studies have limited the scope of the issues studied. It could be that the
results of such studies are misleading future work, at best. Note here, that when the job
control aspects of empowerment are examined on their own, the other three facets of
empowerment do not have as great of an effect.
By attempting to explore the "black box" of strategy implementation, even in this
limited setting, a much greater understanding of the effect of particular strategic levers on
company performance results. The closest thing to a "universally" prescriptive suggestion
evident here is to achieve fairness. Even so, fairness is negatively associated with
empowerment. Even something as seemingly simple as safety (the other climate variable)
does not have only positive effects on company performance - it is negatively associated
with job control - and job control has the largest direct effect in improving labor cost
comparisons.
Moving from the climate and objective strategy implementation variables to
employee affect variables - complexity reigns. Providing more feedback, for example, is
associated with greater employee willingness to do more (or their doing more), and better
relative quality performance, but it is also associated with worse relative labor cost
performance. However, since greater willingness to do more and better relative quality
performance (taking into account the effects of the other variables) are associated with better
relative labor cost performance, the total effect (direct and indirect) of feedback on relative
labor cost comparisons is that more feedback improves labor costs. If the complex
relationship were not carefully examined, it is possible that the opposite conclusion might be
reached.
That said, there are a number of prescriptions that are more simply stated. Improved
quality performance is associated with improved labor cost performance. Employee
willingness to do more, or their doing more, is associated with improved labor cost
performance. Improved skill development satisfaction is associated with increased
willingness to do more (or doing more) though it has negative direct effects on improved
labor cost and quality performance. Note that the implementation of training did not follow
the theoretical path of providing classroom training for the employees in teams and on-the-
job training for employees who rotate jobs. Perhaps these eight companies were not as
careful concerning the implementation of their strategy as they could have been. Increased
feedback is associated with improved labor cost performance indirectly through greater
employee willingness to do more and improved quality performance, though its direct
Journal of Management and Marketing Research, Volume 17 – October, 2014
Implemented strategy in the automobile, Page 19
association is negative. Providing improved security is associated with greater willingness
to do more, but its total effect on labor cost performance (given the other variables and their
effects) is negligible. The facets of empowerment aside from job control are not associated
with improvements in labor cost or quality in this sample.
CONCLUSIONS
This study provides support for the notion that strategy implementation and its
effects on company performance is complex. For HRM systems, particularly when allied
with technological changes, the configurational approach is supported over the contingency
and universal approaches. Great care must be taken to fully specify any model tested that
involves HRM practices and technology used.
Complexity notwithstanding, the expected advantages of implementing a complex
system of training, work teams, job rotation, new equipment, and computer usage, along
with the fairness and safety of the work climate, are much more easily duplicated than
expected. Eight companies in the same labor market, all members of a council established
to disseminate experience with union-management cooperation, were able to yield
convergent, positive performance results. Whether non-union employers, those who do not
willingly share strategic choice, implementation, and resulting performance information
with others, or those who do not have sufficient labor market pressure to improve, can
achieve the same performance improvements is unknown.
Thus we arrive at the major limitations of this study. The results may not represent
the strategic implementation and resulting performance effects of non-union employers,
more secretive employers, or employers outside of a heavily unionized labor market. These
factors could be those that cause the model to be complex and the HRM approach to be
configurational. It is well documented that unions change the flexibility of employers in the
choice and implementation of strategy (Cooke, 2001). However, it is also well documented
that being unionized has particular performance advantages over non-union competition
(Meyer & Cooke, 1993).
Thus the reader should be cautious in expecting other non-union, non-manufacturing
employers to exhibit complex, configurational approaches to HRM implementation. This is
particularly true if there is not labor market pressure to seek performance improvements.
Until future research provides insight into the existence of complex, configurational systems
of strategy implementation in other industries and other labor markets, the results of this
study should be considered speculative.
Journal of Management and Marketing Research, Volume 17 – October, 2014
Implemented strategy in the automobile, Page 20
REFERENCES
Appelbaum, S., Hebert, D., & Leroux, S. 1999. Empowerment: Power, culture and
leadership - A strategy or fad for the millennium? Journal of Workplace Learning,
11: 233-254.
Arthur, J. 1994. Effects of human resources systems on manufacturing performance and
turnover. The Academy of Management Journal, 37: 670-687.
Barron, J., Berger, M., & Black, D. 1999. Do workers pay for on-the-job training? The
Journal of Human Resources, 34: 235-252.
Batt, R. 1999. Work organization, technology, and performance in customer service and
sales. Industrial and Labor Relations Review, 52: 539-564.
Blancero, D., Marron, G., & Keller, T. 1997. Managing psychological contracts.
Employment Relations Today, 24(2): 1-10.
Bushe, G., Havlovic, S., & Coetzer, G. 1996a. Exploring empowerment from the inside-out.
Journal for Quality and Participation, 19(2): 36-45.
Bushe, G., Havlovic, S., & Coetzer, G. 1996b. Exploring empowerment from the inside-out
(part two). Journal for Quality and Participation, 19(3): 78-84.
Carroll, B. 1997. The role of management intervention in the development of empowered
work teams. National Productivity Review, 16(2): 25-30.
Carroll, B. 1998. The self-management payoff: Making ten years of improvements in one.
National Productivity Review, 18(1): 21-27.
Chen, You-shyang; Cheng, Ching-hsue; Lai, Chien-jung. (2010). A hybrid procedure for
extracting rules of production performance in the automobile parts industry. Journal
of Intelligent Manufacturing, 21(4): 423-437.
Colbert, B. 2004. The complex resource-based view: Implications for theory and practice in
strategic human resource management. Academy of Management Review, 29: 341-
358.
Collins, D. 1995. A socio-political theory of workplace democracy: Class conflict,
constituent reactions and organizational outcomes at a gainsharing facility.
Organization Science, 6: 628-644.
Cooke, W. 2001. Union avoidance and foreign direct investment in the USA. Employee
Relations, 23: 558-580.
Cooke, W., Meyer, D., & Huxley, C. 2005. Teamworking in the U.S. motor vehicle supplier
sector: Strategies and effects on manufacturing performance and worker outcomes.
In F. Garibaldo & A. Bardi (eds.) Company strategies and organizational evolution
in the automotive sector: A worldwide perspective: 405-440. Frankfurt am Main:
Peter Lang.
De Leede, J., Nijhof, A., & Fisscher, O. 1999. The myth of self-managed teams: A
reflection on the allocation of responsibilities, teams, and organization. Journal of
Business Ethics, 21: 203-215.
Denton, D. 1995. Competence-based team management. Team Performance Management,
1(4): 5-12.
Donovan, M. 1996. The first step to self-direction is NOT empowerment. Journal for
Quality and Participation, 19(3): 64-66.
Journal of Management and Marketing Research, Volume 17 – October, 2014
Implemented strategy in the automobile, Page 21
Doty, D., & Glick, W. 1994. Typologies as a unique form of theory building: Toward
improved understanding and modeling. Academy of Management Review, 19: 230-
251.
Faxen, K. 1978. Disembodied technical progress: Does employee participation in decision
making contribute to change and growth? American Economic Association, 68: 131-
134.
Fisher, J., Jr. 1997. The three dominant cultures of the workplace. National Productivity
Review, 16(2): 37-48.
Foley, M., Maxwell, G., & McGillivray, D. 1999. The UK context of workplace
empowerment(:) Debating HRM and postmodernity. Participation & Empowerment,
7: 163-179.
Forrester, R. & Drexler, A. 1999. A model for team-based organization performance. The
Academy of Management Executive, 13(3): 36-49.
Holden, L. 1999. The perception gap in employee empowerment: A comparative study of
banks in Sweden and Britain. Personnel Review, 28: 222-241.
Huselid, M. 1995. The impact of human resource management practices on turnover,
productivity, and corporate financial performance. Academy of Management
Journal, 38: 635-672.
Kelloway, E. 1998. Using LISREL for structural equation modeling: A researcher's guide.
Thousand Oaks, CA: Sage.
Koberg, C., Boss, R., Senjem, J., & Goodman, E. 1999. Antecedents and outcomes of
empowerment. Group and Organization Management, 24: 71-91.
Langbein, L. 2000. Ownership, empowerment, and productivity: Some empirical evidence
on the causes and consequences of employee discretion. Journal of Policy Analysis
and Management, 19: 427-449.
Laschinger, H., Finegan, J., & Shamian, J. 2001. The impact of workplace empowerment,
organizational trust on staff nurses’ work satisfaction and organizational
commitment. Health Care Management Review, 26: 7-23.
Longenecker, C., Stansfield, T., & Dwyer, D. 1997. The human side of manufacturing
improvement. Business Horizons, 40(2): 7-17.
MacDuffie, J. 1995. Human resource bundles and manufacturing performance:
organizational logic and flexible production systems in the world auto industry.
Industrial and Labor Relations Review, 48: 197-221.
Marcoulides, G., & Heck, R. 1993. Organizational culture and performance: Proposing and
testing a model. Organization Science, 4: 209-225.
McLain, D. 1995. Responses to health and safety risk in the work environment. The
Academy of Management Journal, 38: 1726-1743.
Meyer, D. & Cooke, W. 1993. US labour relations in transition: Emerging strategies and
company performance. The British Journal of Industrial Relations, 31: 531-552.
Nicholls, C., Lane, H., & Brechu, M. 1999. Taking self-managed teams to Mexico. The
Academy of Management Executive, 13(3): 15-25.
Oliner, S., & Sichel, D. 2000. The resurgence of growth in the late 1990s: Is information
technology the story? Journal of Economic Perspectives, 14: 3-22.
Rinehart, J., Huxley, C., & Robertson, D. 1997. Just another car factory? Lean production
and its discontents. Ithaca, NY: ILR Press.

Journal of Management and Marketing Research, Volume 17 – October, 2014
Implemented strategy in the automobile, Page 22
Spreitzer, G. 1995. Psychological empowerment in the workplace: Dimensions,
measurement, and validation. The Academy of Management Journal, 38: 1442-
1465.
Spreitzer, G. 1996. Social structural characteristics of psychological empowerment. The
Academy of Management Journal, 39: 483-504.
Spreitzer, G., De Janasz, S., & Quinn, R. 1999. Empowered to lead: The role of
psychological empowerment in leadership. Journal of Organizational Behavior, 20:
511-527.
Valle, R., Martin, F., Romero, P., & Dolan, S. 2000. Business strategy, work processes and
human resource training: Are they congruent? Journal of Organizational Behavior,
21: 283-297.
Yates, C., Lewchuk, W., & Stewart, P. 2001. Empowerment as a trojan horse: New systems
of work organization in the north american automobile industry. Economic and
Industrial Democracy, 22: 517-541.
Zammuto, R., & O'Connor, E. 1992. Gaining advanced manufacturing technologies'
benefits: The roles of organization design and culture. The Academy of
Management Review, 17: 701-728.

Journal of Management and Marketing Research, Volume 17 – October, 2014
Implemented strategy in the automobile, Page 23
APPENDIX
Table 1
Variables: Construct Items, Names, and Cronbach Alphas
(1-7 scale, strongly disagree to strongly agree)
I. Skill Development Satisfaction (Cronbach’s Alpha: .815)
1. Did you attend a job orientation meeting when you were hired? If yes, Orient equals 1.
2. I am satisfied with the training I have received from this company. (TrainSat)
3. My company provides good opportunities to get more training. (GoodOppT)
4. I have good opportunities to improve my skills here. (GoodOppS)
5. I expect that I will receive more training in the near future. (MorT)
6. My opportunities to get a better job in the near future are better today than they were 5 years ago.
(OppBtrJb)
7. The opportunities to improve my skills are better today than they were 5 years ago. (OppImpSk)
II. Feedback (Cronbach’s Alpha: .544)
1. I get meaningful feedback on how well I am doing as I am working. (MnFdbck)
2. I know whether I am performing well or poorly. (PerfKnow)
3. I can find out how well I am doing. (HowWell)
III. Job Control (Self-Determination) (Cronbach’s Alpha: .705)
1. I get to decide how best to do my job. (DecBest)
2. I have considerable opportunity for independence and freedom in how I do my job. (IndepFre)
3. I can decide on my own how to go about doing my work. (DecWrk)
IV. Work Intensity (Cronbach’s Alpha: .656)
1. I am often tense and wound-up at the end of my shift. (Tense)
2. I often experience some pain from my work. (Pain)
3. I often feel exhausted at the end of my shift. (Exhaust)
V. Empowerment (Cronbach’s Alpha: .742)
1. The work I do is important to me. (WrkImp) (Meaning)
2. I am confident about my ability to do my main job. (ConfJb) (Competence)
3. How well I do my job is important to my work area. (JbImpWA) (Impact)
4. My main job tasks are personally meaningful to me. (JbPersMe) (Meaning)
5. I am capable of performing all of my various job tasks. (CapPerf) (Competence)
6. The work I do is personally rewarding. (WrkPersR) (Meaning)
7. It is important to the success of my work area that I do my job well. (SuccWAJb) (Impact)
8. I have not mastered the skills necessary for my job. (NotMastS) (Competence, reversed)
9. I have a significant influence on the success of our work area. (SigInfSu) (Impact)
VI. Employment Security (Cronbach’s Alpha: .543)
1. I talk up this company as a good place to work. (CoGood)
2. I do not enjoy working here. (NotEnjoy)
3. I have a good chance of getting a higher paying job here. (HgrPay)
4. I expect to stay in my present job classification for a long time. (JbLT)
5. I don’t expect to get laid off in the near future. (NoLayOff)
6. I expect to work here for a long-time. (WrkLT)
7. My company does its best to keep employees working full time. (CoBstFE)
8. I have a good future in this company. (GoodFut)
Journal of Management and Marketing Research, Volume 17 – October, 2014
Implemented strategy in the automobile, Page 24
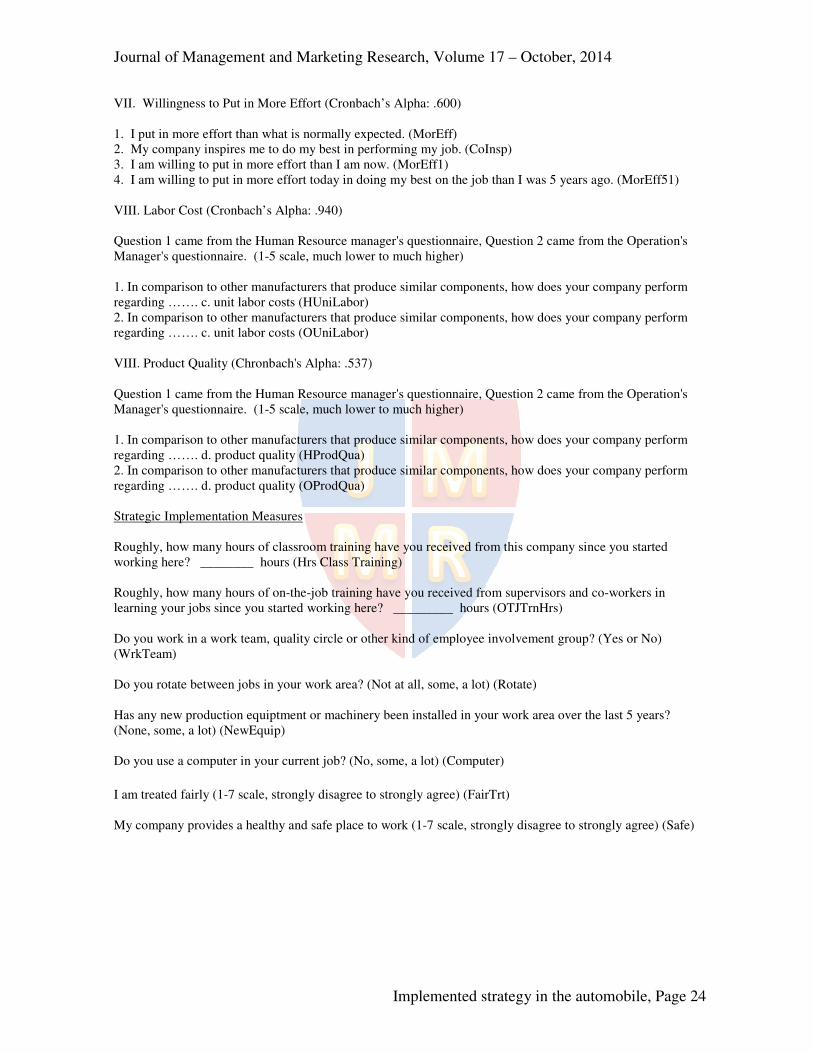
VII. Willingness to Put in More Effort (Cronbach’s Alpha: .600)
1. I put in more effort than what is normally expected. (MorEff)
2. My company inspires me to do my best in performing my job. (CoInsp)
3. I am willing to put in more effort than I am now. (MorEff1)
4. I am willing to put in more effort today in doing my best on the job than I was 5 years ago. (MorEff51)
VIII. Labor Cost (Cronbach’s Alpha: .940)
Question 1 came from the Human Resource manager's questionnaire, Question 2 came from the Operation's
Manager's questionnaire. (1-5 scale, much lower to much higher)
1. In comparison to other manufacturers that produce similar components, how does your company perform
regarding ……. c. unit labor costs (HUniLabor)
2. In comparison to other manufacturers that produce similar components, how does your company perform
regarding ……. c. unit labor costs (OUniLabor)
VIII. Product Quality (Chronbach's Alpha: .537)
Question 1 came from the Human Resource manager's questionnaire, Question 2 came from the Operation's
Manager's questionnaire. (1-5 scale, much lower to much higher)
1. In comparison to other manufacturers that produce similar components, how does your company perform
regarding ……. d. product quality (HProdQua)
2. In comparison to other manufacturers that produce similar components, how does your company perform
regarding ……. d. product quality (OProdQua)
Strategic Implementation Measures
Roughly, how many hours of classroom training have you received from this company since you started
working here? ________ hours (Hrs Class Training)
Roughly, how many hours of on-the-job training have you received from supervisors and co-workers in
learning your jobs since you started working here? _________ hours (OTJTrnHrs)
Do you work in a work team, quality circle or other kind of employee involvement group? (Yes or No)
(WrkTeam)
Do you rotate between jobs in your work area? (Not at all, some, a lot) (Rotate)
Has any new production equiptment or machinery been installed in your work area over the last 5 years?
(None, some, a lot) (NewEquip)
Do you use a computer in your current job? (No, some, a lot) (Computer)
I am treated fairly (1-7 scale, strongly disagree to strongly agree) (FairTrt)
My company provides a healthy and safe place to work (1-7 scale, strongly disagree to strongly agree) (Safe)

Journal of Management and Marketing Research, Volume 17 – October, 2014
Implemented strategy in the automobile, Page 25
Table 2
Means, Standard Deviations, and Correlations of the Strategy Implementation Measures
Measure Mean Std. Dev. HrsClass OTJTrnHrs WrkTeam Rotate NewEquip Computer FairTrt
HrsClass 45.25 129.72
OTJTrnHrs 62.13 210.58 .142***
WrkTeam .488 .513 .062 .049
Rotate .994 .705 -.031 .022 .140***
NewEquip .936 .697 .022 .012 .044 .108***
Computer .531 .696 .103*** .151*** .095*** .027 .090***
FairTrt 4.263 1.952 -.004 .089*** .128*** .073** .034 .098***
Safe 4.317 1.839 -.057 .050 .145*** .037 .022 .074* .390***
__________________
*** - p < .01
** - p < .05
______________________________________________________________________________________
Table 3
Coefficients of Measures on Endogenous Latent Variables
(std. errors in parentheses)
Latent Variable
Measure DoesMore LabCost QualPerf
Moreff 0.25***
(0.06)
CoInsp 1.00
MoreEff51 0.61***
(0.06)
MoreEff1 0.58***
(0.05)
OUnitLab 1.00
HUnitLab 0.90***
(0.02)
OProdQua 1.00
HProdQua 0.95***
(0.08)
_______________
*** - p < .01
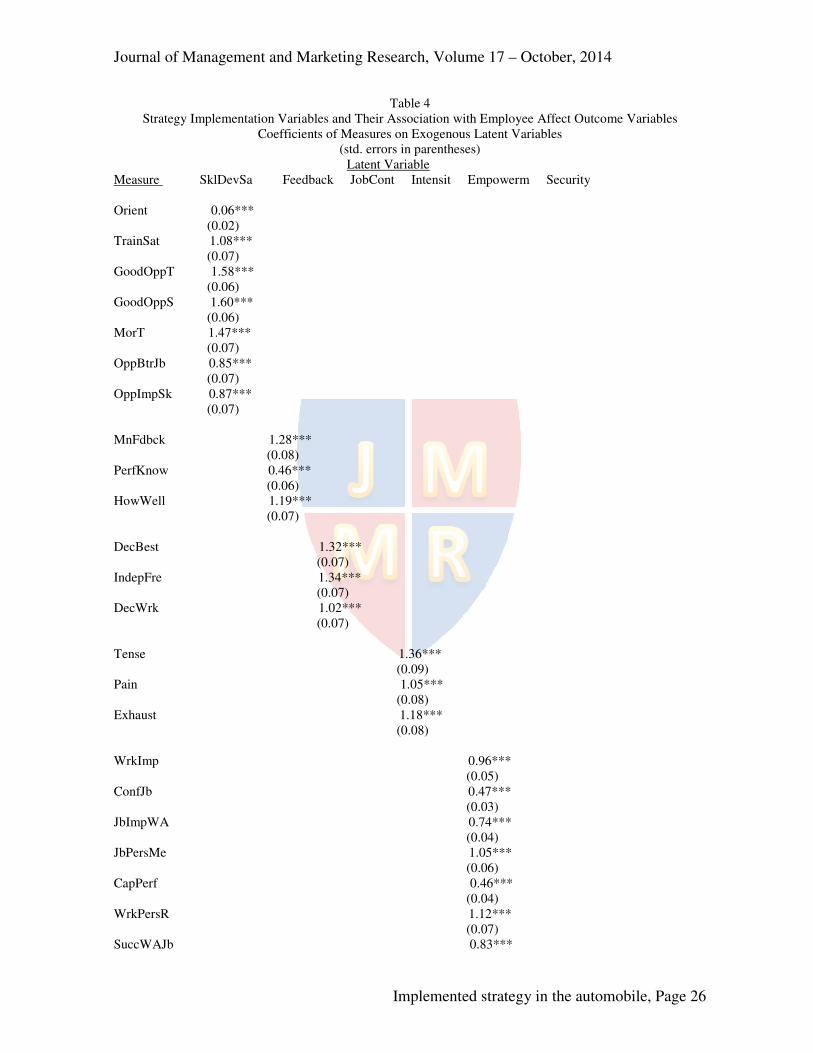
Journal of Management and Marketing Research, Volume 17 – October, 2014
Implemented strategy in the automobile, Page 26
Table 4
Strategy Implementation Variables and Their Association with Employee Affect Outcome Variables
Coefficients of Measures on Exogenous Latent Variables
(std. errors in parentheses)
Latent Variable
Measure SklDevSa Feedback JobCont Intensit Empowerm Security
Orient 0.06***
(0.02)
TrainSat 1.08***
(0.07)
GoodOppT 1.58***
(0.06)
GoodOppS 1.60***
(0.06)
MorT 1.47***
(0.07)
OppBtrJb 0.85***
(0.07)
OppImpSk 0.87***
(0.07)
MnFdbck 1.28***
(0.08)
PerfKnow 0.46***
(0.06)
HowWell 1.19***
(0.07)
DecBest 1.32***
(0.07)
IndepFre 1.34***
(0.07)
DecWrk 1.02***
(0.07)
Tense 1.36***
(0.09)
Pain 1.05***
(0.08)
Exhaust 1.18***
(0.08)
WrkImp 0.96***
(0.05)
ConfJb 0.47***
(0.03)
JbImpWA 0.74***
(0.04)
JbPersMe 1.05***
(0.06)
CapPerf 0.46***
(0.04)
WrkPersR 1.12***
(0.07)
SuccWAJb 0.83***

Journal of Management and Marketing Research, Volume 17 – October, 2014
Implemented strategy in the automobile, Page 27
(0.04)
NotMastS -0.10*
(0.08)
SigInfSu 0.75***
(0.06)
CoGood 1.36***
(0.06)
NotEnjoy -1.06***
(0.07)
HgrPay 1.13***
(0.07)
JbLT 0.51***
(0.08)
NoLayOff 0.39***
(0.07)
WrkLT 1.14***
(0.07)
CoBstFE 0.68***
(0.06)
GoodFut 1.39***
(0.06)
HrsClass 44.60*** -52.84*** 36.94*** -3.27 - -15.72*
(5.04) (13.25) (10.40) (6.81) (8.44)
EeOJTHrs 15.16*** -7.59 3.75 -6.52# - -6.79#
(3.26) (7.94) (6.23) (4.20) (5.20)
WrkTeam 0.03 0.12** -0.09** 0.03 0.01 0.02
(0.03) (0.05) (0.04) (0.03) (0.02) (0.03)
Rotate 0.13*** 0.18*** -0.18*** 0.05# 0.00 -0.06#
(0.04) (0.07) (0.05) (0.04) (0.03) (0.05)
NewEquip 0.09** 0.12* -0.03 0.08** 0.00 -0.10**
(0.04) (0.06) (0.05) (0.03) (0.03) (0.04)
Computer 0.14*** -0.17*** 0.16*** -0.03 0.06* -0.06#
(0.04) (0.06) (0.05) (0.03) (0.03) (0.04)
FairTrt 0.16# 1.01*** 0.00 -0.33*** -0.13# 0.45***
(0.12) (0.17) (0.13) (0.09) (0.09) (0.11)
Safe -0.09 0.68*** -0.46*** -0.12# 0.13# 0.75***
(0.11) (0.16) (0.13) (0.08) (0.08) (0.11)
_______________
*** - p < .01
** - p < .05
* - p < .10
# - p < .10, one tailed test
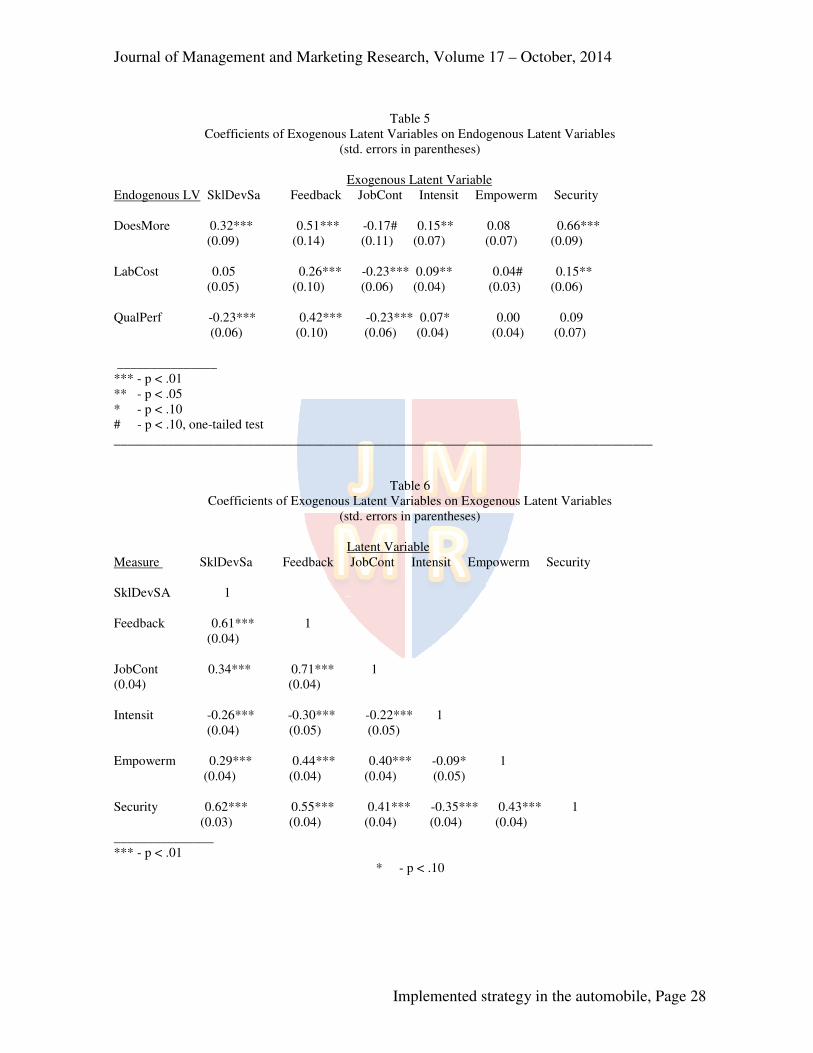
Journal of Management and Marketing Research, Volume 17 – October, 2014
Implemented strategy in the automobile, Page 28
Table 5
Coefficients of Exogenous Latent Variables on Endogenous Latent Variables
(std. errors in parentheses)
Exogenous Latent Variable
Endogenous LV SklDevSa Feedback JobCont Intensit Empowerm Security
DoesMore 0.32*** 0.51*** -0.17# 0.15** 0.08 0.66***
(0.09) (0.14) (0.11) (0.07) (0.07) (0.09)
LabCost 0.05 0.26*** -0.23*** 0.09** 0.04# 0.15**
(0.05) (0.10) (0.06) (0.04) (0.03) (0.06)
QualPerf -0.23*** 0.42*** -0.23*** 0.07* 0.00 0.09
(0.06) (0.10) (0.06) (0.04) (0.04) (0.07)
_______________
*** - p < .01
** - p < .05
* - p < .10
# - p < .10, one-tailed test
_________________________________________________________________________________
Table 6
Coefficients of Exogenous Latent Variables on Exogenous Latent Variables
(std. errors in parentheses)
Latent Variable
Measure SklDevSa Feedback JobCont Intensit Empowerm Security
SklDevSA 1
Feedback 0.61*** 1
(0.04)
JobCont 0.34*** 0.71*** 1
(0.04) (0.04)
Intensit -0.26*** -0.30*** -0.22*** 1
(0.04) (0.05) (0.05)
Empowerm 0.29*** 0.44*** 0.40*** -0.09* 1
(0.04) (0.04) (0.04) (0.05)
Security 0.62*** 0.55*** 0.41*** -0.35*** 0.43*** 1
(0.03) (0.04) (0.04) (0.04) (0.04)
_______________
*** - p < .01
* - p < .10
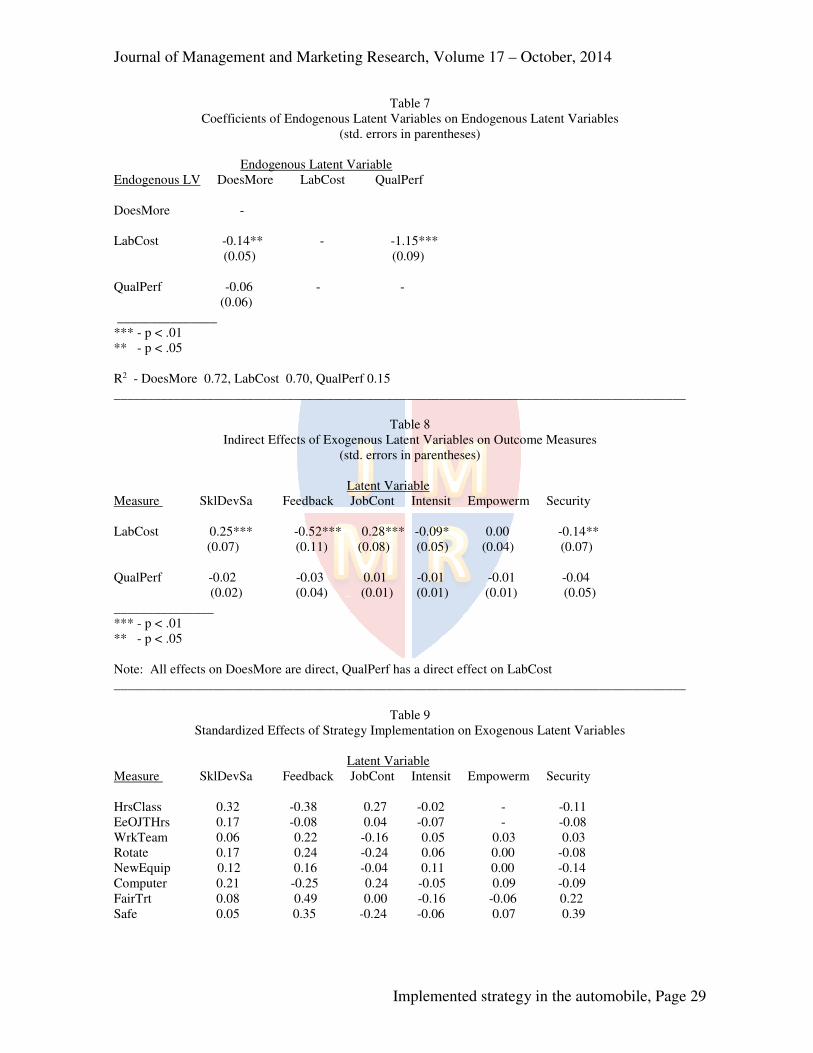
Journal of Management and Marketing Research, Volume 17 – October, 2014
Implemented strategy in the automobile, Page 29
Table 7
Coefficients of Endogenous Latent Variables on Endogenous Latent Variables
(std. errors in parentheses)
Endogenous Latent Variable
Endogenous LV DoesMore LabCost QualPerf
DoesMore -
LabCost -0.14** - -1.15***
(0.05) (0.09)
QualPerf -0.06 - -
(0.06)
_______________
*** - p < .01
** - p < .05
R2 - DoesMore 0.72, LabCost 0.70, QualPerf 0.15
______________________________________________________________________________________
Table 8
Indirect Effects of Exogenous Latent Variables on Outcome Measures
(std. errors in parentheses)
Latent Variable
Measure SklDevSa Feedback JobCont Intensit Empowerm Security
LabCost 0.25*** -0.52*** 0.28*** -0.09* 0.00 -0.14**
(0.07) (0.11) (0.08) (0.05) (0.04) (0.07)
QualPerf -0.02 -0.03 0.01 -0.01 -0.01 -0.04
(0.02) (0.04) (0.01) (0.01) (0.01) (0.05)
_______________
*** - p < .01
** - p < .05
Note: All effects on DoesMore are direct, QualPerf has a direct effect on LabCost
______________________________________________________________________________________
Table 9
Standardized Effects of Strategy Implementation on Exogenous Latent Variables
Latent Variable
Measure SklDevSa Feedback JobCont Intensit Empowerm Security
HrsClass 0.32 -0.38 0.27 -0.02 - -0.11
EeOJTHrs 0.17 -0.08 0.04 -0.07 - -0.08
WrkTeam 0.06 0.22 -0.16 0.05 0.03 0.03
Rotate 0.17 0.24 -0.24 0.06 0.00 -0.08
NewEquip 0.12 0.16 -0.04 0.11 0.00 -0.14
Computer 0.21 -0.25 0.24 -0.05 0.09 -0.09
FairTrt 0.08 0.49 0.00 -0.16 -0.06 0.22
Safe 0.05 0.35 -0.24 -0.06 0.07 0.39
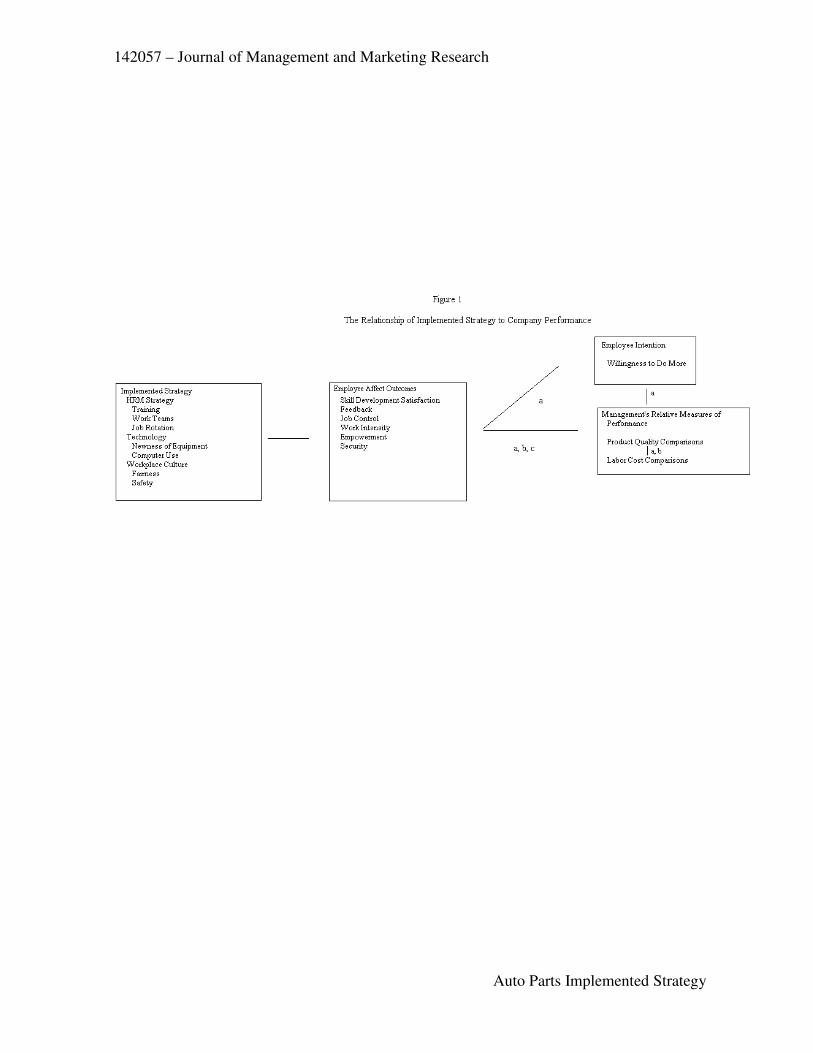
142057 – Journal of Management and Marketing Research
Auto Parts Implemented Strategy
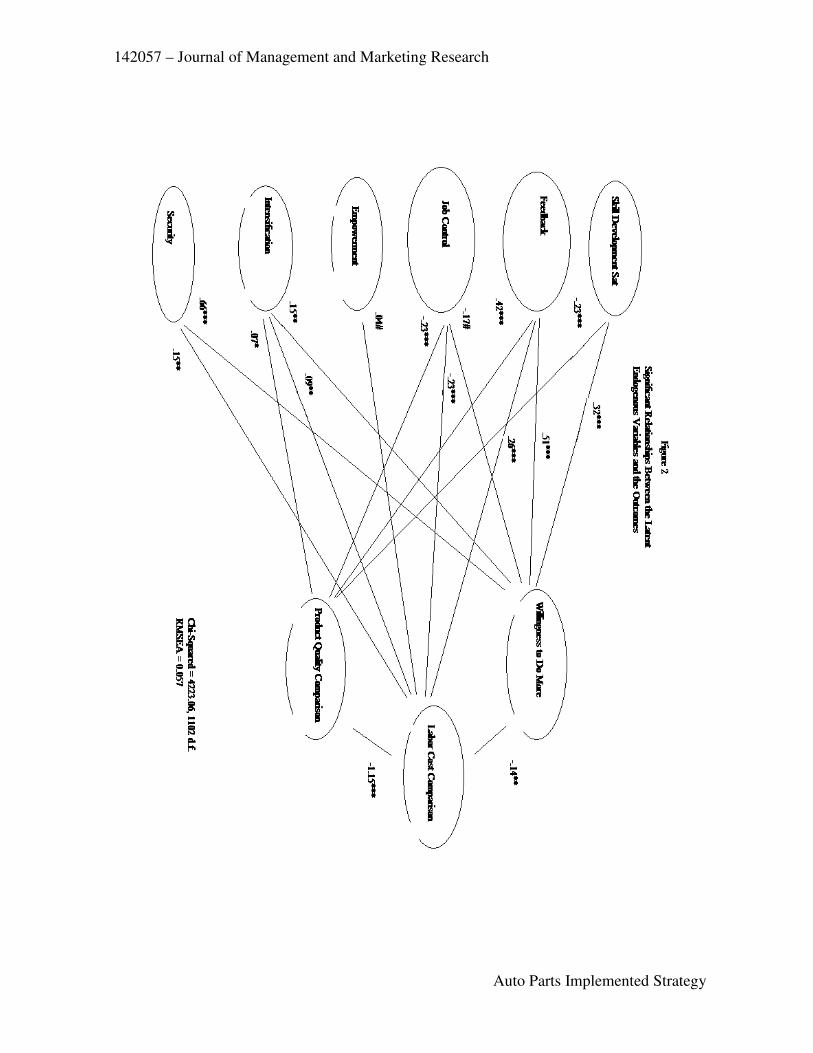
142057 – Journal of Management and Marketing Research
Auto Parts Implemented Strategy

Journal of Management and Marketing Research, Volume 17 – October, 2014
Implemented strategy in the automobile, Page 32