Embed Size (px)
Citation preview

U N I V E R S I TAT I S O U L U E N S I SACTAA
SCIENTIAE RERUMNATURALIUM
OULU 2006
A 470
Pasi Ojala
IMPLEMENTING A VALUE-BASED APPROACH TO SOFTWARE ASSESSMENT AND IMPROVEMENT
FACULTY OF SCIENCE, DEPARTMENT OF INFORMATION PROCESSING SCIENCE,UNIVERSITY OF OULU
ABCDEFG
UNIVERS ITY OF OULU P.O. Box 7500 F I -90014 UNIVERS ITY OF OULU F INLAND
A C T A U N I V E R S I T A T I S O U L U E N S I S
S E R I E S E D I T O R S
SCIENTIAE RERUM NATURALIUM
HUMANIORA
TECHNICA
MEDICA
SCIENTIAE RERUM SOCIALIUM
SCRIPTA ACADEMICA
OECONOMICA
EDITOR IN CHIEF
EDITORIAL SECRETARY
Professor Mikko Siponen
Professor Harri Mantila
Professor Juha Kostamovaara
Professor Olli Vuolteenaho
Senior Assistant Timo Latomaa
Communications Officer Elna Stjerna
Senior Lecturer Seppo Eriksson
Professor Olli Vuolteenaho
Publication Editor Kirsti Nurkkala
ISBN 951-42-8211-6 (Paperback)ISBN 951-42-8212-4 (PDF)ISSN 0355-3191 (Print)ISSN 1796-220X (Online)
A 470
AC
TA Pasi O
jala
A470etukansi.fm Page 1 Wednesday, November 1, 2006 11:28 AM


A C T A U N I V E R S I T A T I S O U L U E N S I SA S c i e n t i a e R e r u m N a t u r a l i u m 4 7 0
PASI OJALA
IMPLEMENTING A VALUE-BASED APPROACH TO SOFTWARE ASSESSMENT AND IMPROVEMENT
Academic dissertation to be presented, with the assent ofthe Faculty of Science of the University of Oulu, for publicdefence in Auditorium IT115, Linnanmaa, on November10th, 2006, at 12 noon
OULUN YLIOPISTO, OULU 2006

Copyright © 2006Acta Univ. Oul. A 470, 2006
Supervised byProfessor Veikko Seppänen
Reviewed byProfessor Hannu JaakkolaProfessor Jürgen Münch
ISBN 951-42-8211-6 (Paperback)ISBN 951-42-8212-4 (PDF) http://herkules.oulu.fi/isbn9514282124/ISSN 0355-3191 (Printed)ISSN 1796-220X (Online) http://herkules.oulu.fi/issn03553191/
Cover designRaimo Ahonen
OULU UNIVERSITY PRESSOULU 2006
Ojala, Pasi, Implementing a value-based approach to software assessment andimprovementFaculty of Science, Department of Information Processing Science, University of Oulu, P.O.Box3000, FI-90014 University of Oulu, Finland Acta Univ. Oul. A 470, 2006Oulu, Finland
AbstractSoftware has become an important part of our everyday life in the form of various informationprocessing intensive products and services. The number of companies producing software has risenconsiderably and at the same time competition between software businesses has greatly intensified.
During the last decades software process improvement (SPI) has been recognized as a usablepossibility to increase the quality of software development. Implemented SPI investments have oftenindicated increased process capabilities as well. Recently more attention has been focused on thecosts of SPI as well as on the cost-effectiveness and productivity of software development, althoughthe roots of economic-driven software engineering originate from the very early days of softwareengineering research.
This research tries to advance the concepts, principles and practical methods of economic-drivensoftware engineering by associating them with SPI concepts, theories and software processassessment methods, in particular, capability-maturity -based assessment methods. This is done inpart by presenting an analysis of the economic-driven view of software development and in part bydiscussing the SPI context and cost-efficiency characteristics.
As a result of this analysis work, a value-based approach is adopted in the study, involvingdefinition of the essential concepts of value, cost and worth in software development. Thesedefinitions originate from the Value Engineering (VE) method, originally applied and developed forthe needs of the production industry. Therefore, for the purposes of this study these concepts arefirstly justified and secondly defined.
In order to study and evaluate the value-based approach, a method called value assessment isdeveloped and later on also combined with capability-maturity -based assessment and called theValue Enhanced Assessment (VEA) method. The combination is seen to respond even better to theoverall challenges of software development and SPI. Although VEA is used here only for researchpurposes, it is a rational outcome of the value-based approach and developed in the context of theBOOTSRAP software process assessment method.
The results show that even though there is still much to do in making the economic-driven viewcomplete in software engineering, the value-based approach outlines a way towards a morecomprehensive understanding of it. In addition, value-based methods are most likely to be needed tocomplete existing capability-maturity -based assessment methods, such as BOOTSTRAP.
Keywords: assessment, capability, cost, economic-driven software engineering, maturity,process, product, service, software process improvement, value


Preface
This research originates from my earlier studies and from my work experience. As a Mas-ter of Science in Accounting I realized that I would like to know more about information processing science. My work concerned information processing projects and I took part in several software implementations as a project manager. In my opinion, a project man-ager’s work always requires a lot of different kinds of education and work experience, and I felt that information processing studies would be very useful to me. So, I was looking for opportunities to study when I met Prof. Samuli Saukkonen, who encouraged me to start graduate studies again, in information processing science at the University of Oulu. At first I hesitated, but then I decided to take up the challenge presented to me by applying to the University of Oulu again in the summer of 1998. Since then I have worked full time while studying at the same time. It is hard, but rewarding.
Concerning this thesis, I would like to thank my supervisor Prof. Veikko Seppänen, for guiding my research work. He has always been available to read my work-in-progress writings, and his feedback has been very valuable and encouraging to me. I am most grateful also to Prof. Jouni Similä and project manager Pasi Kuvaja, who decided that my research area would also be worth examining in the Monica and Moose projects. Jouni Similä also earns my gratitude because he has been my second supervisor. His criticism has helped me to concentrate on the main issues and to explain my ideas more clearly. Prof. Samuli Saukkonen earns thanks for guiding and encouraging me to study again. Alphonso Del Isola and Del Younker have helped me in understanding Value Engineering (VE) in practice and in theory, which has been vital for this thesis. Del Younker also earns my gratitude for organizing the chance for me to participate in a VE study in Florida. Even though the purpose of our VE study was to evaluate highway routing possibilities, it showed me how VE works in practice.
Professor Hannu Jaakkola and professor Jürgen Münch, the reviewers of my thesis have provided constructive critique to my work. Their feedback has helped me to construct a solid ground for the final version of this thesis.
I would also like to thank the Infotech Oulu research group, SPIRAL, which has supported this work from the beginning. The Monica and Moose research groups at the University of Oulu have given support to this study as well. Project financiers CCC Automation, Elektrobit, Necsom, Nokia Mobile Phones, Solid Information Technology,

Sonera, NetHawk, TEKES, VTT Electronics and the University of Oulu are also re-membered, as are the Tauno Tönning Foundation and the Oulu University Research Foundation, who have provided grants to support my work.
The few lines here at the end of the preface cannot show enough appreciation for the love and support I have received from Sonia and my relatives and friends. So, I would like to thank you warmly for giving me support and understanding me during this project. You have understood my absence on some occasions, and you have encouraged me to continue. Furthermore, you have given me the opportunity to think about matters other than my dissertation, and by doing so you have always given me more strength to continue. Hopefully I can show you my gratitude in person, with caring and joyous companionship.
Oulu, 10 August 2006 Pasi Ojala

Abbreviations
ABC Activity-Based Costing CMM Capability Maturity Model CMMI Capability Maturity Model Integration FA Functional Analysis FAST Function Analysis System Technique GOALS Goal-Oriented Approach to Life-cycle Software KPA Key Process Area LCC Life Cycle Costing QFD Quality Function Deployment ROI Return on Investment SEI Software Engineering Institute SPI Software Process Improvement SPU Software Producing Unit TCM Target Cost Management TQM Total Quality Management VA Value Analysis VE Value Engineering VEA Value Enhanced Assessment VM Value Management


List of tables
Table 1. Engineering approaches................................................................................... 25 Table 2. Function worksheet.......................................................................................... 68 Table 3. Function/process worksheet in Software Ltd................................................... 83 Table 4. Function/process result analysis in Software Ltd. ........................................... 84 Table 5. Function/process worksheet in Software Ltd................................................... 87 Table 6. Function/process result analysis in Software Ltd. ........................................... 87 Table 7. Calculated capability levels and values for BOOTSTRAP processes ............. 92 Table 8. Assessment processes for Value Enhanced Assessment .................................. 95 Table 9. Goal-related prioritized improvement areas .................................................. 127 Table 10. Improvement actions and overall schedule.................................................... 128 Table 11. Evaluated improvement proposals................................................................. 156


List of figures
Fig. 1. Software development: capability and value points of view............................... 19 Fig. 2. Successful software engineering ......................................................................... 30 Fig. 3. VE process phases............................................................................................... 62 Fig. 4. Continuous BOOTSTRAP and Value Assessment. ............................................. 91 Fig. 5. The BOOTSTRAP assessment process............................................................... 97 Fig. 6. The enhanced BOOTSTRAP assessment process............................................. 102 Fig. 7. Calculating the allowable cost. ......................................................................... 115 Fig. 8. SPU maturity profile ......................................................................................... 122 Fig. 9. Overall project maturity profile ........................................................................ 122 Fig. 10. Capability profile of Value Engineering processes ........................................... 123 Fig. 11. Worth & Cost in platforms (AV=average, C=customer, V=vendor) ................. 134 Fig. 12. Worth & Cost in processes (AV=average, C=customer, V=vendor) ................. 135 Fig. 13. Value in platforms ............................................................................................. 136 Fig. 14. Value in processes ............................................................................................. 136 Fig. 15. Average priorities for requirements including all interviewees
(AV=average, C=customer, V=vendor)............................................................. 146 Fig. 16. Average priorities for requirements including all interviewed customers
(AV=average, C=customer) .............................................................................. 146 Fig. 17. Average priorities for requirements including all interviewed vendors
(AV=average, V=vendor).................................................................................. 147 Fig. 18. Average priorities for components including all interviewees
(AV=average, C=customer, V=vendor)............................................................. 148 Fig. 19. Average priorities for components including all interviewed customers
(AV=average, C=customer) .............................................................................. 149 Fig. 20. Average priorities for components including all interviewed vendors
(AV=average, V=vendor).................................................................................. 150 Fig. 21. Average worth and cost for requirements including all interviewees
(AV=average, C=customer, V=vendor)............................................................. 151 Fig. 22. Average worth and cost for components including all interviewees
(AV=average, V=vendor).................................................................................. 151 Fig. 23. Value indexes for requirements including all interviewees............................... 153

Fig. 24. Value indexes for components including all interviewees ............................. 153 Fig. 25. Value indexes for fully-implemented requirements including all
interviewees................................................................................................... 155 Fig. 26. Value indexes for fully-implemented components including all
interviewees................................................................................................... 155 Fig. 27. CMM structure (SEI 2001, 33)...................................................................... 186 Fig. 28. One suggestion for enhancing key process areas by maturity level............... 188 Fig. 29. The VE-enhanced BOOTSTRAP process model .......................................... 191 Fig. 30. Company A: Maturity of SPU ....................................................................... 193 Fig. 31. Company A: Maturity of Project A................................................................ 194 Fig. 32. Company A: Maturity of Project B................................................................ 195
Contents
Abstract Preface Abbreviations List of Tables List of Figures Contents 1 Introduction ................................................................................................................... 17
1.1 Motivation ..............................................................................................................17 1.2 Scope of the research..............................................................................................19 1.3 Research problem ...................................................................................................20 1.4 Research methods, main results and limitations .....................................................21 1.5 Structure of the dissertation ....................................................................................22
2 Economic-driven software engineering and value-based approach............................... 23 2.1 Software business and engineering – an economic view........................................23 2.2 Software cost estimation.........................................................................................26 2.3 Software quality improvement as an investment ....................................................27 2.4 Activity-Based Costing (ABC) ...............................................................................32 2.5 Value in software process and products ..................................................................34 2.6 Value-based approach .............................................................................................37
3 The concepts and improvement of value and capability................................................ 39 3.1 Value .......................................................................................................................39
3.1.1 Value as a force................................................................................................39 3.1.2 Customer, retail and manufacturing value .......................................................42 3.1.3 Value and its relationship to software processes and products ........................44
3.2 Value Engineering and improvement......................................................................47 3.2.1 Value Engineering............................................................................................47 3.2.2 Two possible ways to increase value in software companies ..........................50
3.3 Capability ...............................................................................................................51 3.4 Model-based software process improvement..........................................................53
4 The Value Engineering process ..................................................................................... 57 4.1 Different definitions ...............................................................................................57

4.2 The Value Engineering process in this dissertation ................................................60 4.2.1 Pre-study..........................................................................................................63
4.2.1.1 Orientation................................................................................................63 4.2.2 Value study ......................................................................................................65
4.2.2.1 The information phase ..............................................................................65 4.2.2.2 The function analysis phase......................................................................66 4.2.2.3 The creativity phase..................................................................................70 4.2.2.4 The evaluation phase ................................................................................71 4.2.2.5 The development phase ............................................................................72 4.2.2.6 The presentation phase .............................................................................73
4.2.3 Post-study ........................................................................................................74 4.2.4 Conclusions of the Value Engineering process................................................75
5 Combining capability, value and quality – towards an Value Enhanced Assessment method....................................................................................................... 76 5.1 Assessment .............................................................................................................76 5.2 Principles of the Value Enhanced Assessment method...........................................79 5.3 Capability-maturity -based assessment for VE processes.......................................79 5.4 Value Assessment for processes using a reference model.......................................80
5.4.1 An illustrative example of use of the BOOTSTRAP method ..........................81 5.5 Value Assessment for processes without a reference model ...................................86
5.5.1 An illustrative example without a reference model .........................................86 5.6 Combined value and capability-maturity -based assessment for processes............88 5.7 Value assessment for a product...............................................................................89 5.8 Using value and capability information in improvement planning and
development: BOOTSTRAP example...................................................................90 5.8.1 Value enhancement to the BOOTSTRAP method’s improvement
planning and development phase.....................................................................90 5.8.2 Use of VE in process improvement planning and execution ...........................91
6 Assessment processes for Value Enhanced Assessment ................................................ 95 6.1 Capability-maturity -based assessment for VE processes.......................................96 6.2 Value Assessment for processes and products ........................................................97 6.3 Combined value and capability-maturity -based assessment..................................98
6.3.1 Assessment process for combined value and capability-maturity -based assessment .............................................................................................99
6.3.2 Value-based focusing: BOOTSTRAP example .............................................102 7 Value Enhanced Assessment types and tools ............................................................... 105
7.1 Assessment types and tools for capability-maturity -based assessment: BOOTSTRAP example .......................................................................................105
7.2 Value assessment types .........................................................................................106 7.3 Value assessment tools..........................................................................................106
7.3.1 Key techniques ..............................................................................................106 7.3.2 Tests for value................................................................................................ 111 7.3.3 Tests for costing............................................................................................. 111
7.3.3.1 Life cycle costing.................................................................................... 112 7.3.3.2 Target costing.......................................................................................... 115

8 Using Value Enhanced Assessment ............................................................................. 116 8.1 Case study method................................................................................................ 116 8.2 Capability-maturity -based assessment for VE processes: Company A ............... 117
8.2.1 Preparation..................................................................................................... 118 8.2.2 Execution.......................................................................................................120
8.2.2.1 Maturity levels........................................................................................121 8.2.2.2 Capability levels and main findings concerning VE processes...............123 8.2.2.3 Improvement planning and execution.....................................................126
8.2.3 Strengths and weaknesses of capability-maturity -based assessment including VE processes .................................................................................128
8.3 Value assessment for processes and products: Company B..................................130 8.3.1 Background ...................................................................................................130 8.3.2 Information....................................................................................................131 8.3.3 Function analysis ...........................................................................................133 8.3.4 Creativity .......................................................................................................137 8.3.5 Evaluation......................................................................................................138 8.3.6 Development..................................................................................................138 8.3.7 Presentation ...................................................................................................139 8.3.8 Strengths and weaknesses of value assessment for processes and
products .........................................................................................................140 8.4 Value assessment for products: Company C.........................................................142
8.4.1 Background ...................................................................................................142 8.4.2 Information....................................................................................................143 8.4.3 Function analysis ...........................................................................................144 8.4.4 Creativity .......................................................................................................152 8.4.5 Evaluation......................................................................................................156 8.4.6 Development..................................................................................................156 8.4.7 Presentation ...................................................................................................158 8.4.8 Strengths and weaknesses of value assessment for products .........................158
9 Conclusions ................................................................................................................. 161 9.1 Research results and contributions .......................................................................161 9.2 Limitations of the study........................................................................................165 9.3 Recommendations for future research ..................................................................166
References Appendices


1 Introduction
1.1 Motivation
Software (see chapter 1.2) has become more and more important in recent years. The number of companies producing software has grown constantly, and we need software in our everyday lives. Hence the importance of good quality software has increased and it touches many people and most companies today. The processes (see chapter 1.2) which produce software are important, and from the customer’s point of view they should produce cheap, reliable and usable help for everyday life. From the software industry’s point of view they should be cost-effective, productive and reliable so that companies are able to survive in the face of intensive competition.
According to Humphrey (1989), the paradigm of the software process proponents is that the quality of the software development process is closely related to the quality of the resulting software. Krasner (1999, 151) points out that “in a mature software organization, the following holds:
− Quality is defined and therefore predictable − Costs and schedules are predictable and normally met − Processes are defined and under statistical control”.
For several decades companies have aimed at software process improvement, SPI, (Rico 1999) using different capability-maturity -based assessments which are based on capability-maturity models like CMM or BOOTSTRAP (introduced in appendixes) as a basis for discovering necessary improvement initiatives. For example, the basic purpose of the BOOTSTRAP methodology has been to prepare the way for the introduction of modern software technology into European industry. More precisely, its objective has been to:
1. Develop a European software process assessment and improvement methodology starting with existing knowledge.
2. Validate the methodology’s assessment capabilities by applying it to a number of com-panies to define their capability levels and profiles.

18
3. Include such improvement features in the methodology that support the setting of im-provement targets and generate improvement plans which match the organization’s business needs and improvement possibilities.
4. Validate the improvement methodology by applying it to a number of companies. (Kuvaja et al. 1994)
Although capability-maturity -based assessments have been recognized as a viable means of increasing the quality of the software development, they are perhaps not complete. They have been criticized as expensive, disruptive, infrequent and inflexible (Bollinger & McGowan 1991, Campbell 1995, Drouin 1999 and Johnson & Brodman 1999). Herbsleb et al. (1997, 31) have stated that they also often encourage too much bureaucracy.
In addition, methods like BOOTSTRAP, the Capability Maturity Model (CMM) and ISO standards seem to have weaknesses in recognizing costs, values (see chapter 3.1) and business needs, since these aims have not been considered to be the most important ones when developing these methods. For example, the BOOTSTRAP method does not support process assessment and improvement work by justified and defined cost calcula-tions and accounting. Therefore, if a company is, for example, interested in focusing assessment on processes where there are a lot of costs and value creation is therefore low, the BOOTSTRAP method does not give support in finding these areas and improving them by focusing the assessment and using cost or value as criteria. Nor do the other methods which have been used in its development, such as the Capability Maturity Model (CMM), ISO or several other standards.
However, although the assessment methods discussed do not seem to be complete, interest in their development is increasing (SEMA 2000) and some researchers are also examining alternative possibilities for assessing (see chapter 5.1) software processes (Campbell 1995, Miyazaki et al. 1995). From this dissertation’s point of view, a method (see chapter 1.3), which does not take into account costs and values created in processes is perhaps not complete enough for business purposes and for taking business needs into account. Basically, it does not represent the value-based approach (see chapter 2) to software development and SPI either.
This criticism has strengthened the author’s view that capability-maturity -based assessment methods lack proper cost and value calculation characteristics, which provides a motivation for this study as the importance of such characteristics seems to be increasing. The author also sees that many companies are in a situation where they would like to make use of methods which can point out their most capable processes (see chapter 3.3) and identify how much value these processes provide to justify for example, SPI initiatives or see whether software development is cost-effective.
In this study, capability, defined in detail in each capability-maturity model for its own use (see chapter 3.3 and appendixes), and value are seen as equally important. There are mainly four reasons for this. Firstly, if the capability of the process is high, it will probably cause high product quality, and if the value is also high, the situation is under control, because the company is acting economically (see chapter 1.2) and is creating value and high product quality with capable processes. Secondly, problems arise if a process’s capability is low, which will also probably cause low product quality and if a process’s value is low, the low quality products will not be produced economically either. Thirdly, problems arise when the company is creating high quality products with high

19
capability processes, which are not cost-efficient and do not create value either. In the long term this is not economical and will endanger the future of the company. Fourthly, problems arise when the company is producing low quality products with low capability processes even if they would create value and be cost-efficient, because in the long term customers might not be happy about buying low quality products even if it would be economical to the company. (Figure 1)
Fig. 1. Software development: capability and value points of view
1.2 Scope of the research
This research tries to advance the concepts, principles and practical methods of “economic-driven software engineering” (see chapter 2) by associating them with SPI concepts, theories and software process assessment methods (see appendixes), in particular with capability-maturity -based assessment methods. This is done in part by presenting an analysis of the “economic-driven view” (see chapter 2) of software development and in part by discussing the SPI context and cost-efficiency characteristics.
In this study, the term “economic” is considered to be budgetary, business, financial, fiscal, monetary and money-making solution. “Economical” is understood as cheap, cost-effective, inexpensive, low-priced, money saving, reasonable and also value for money creating solution. (Oxford University 1992, 164)
As a result of the above-mentioned analysis work, “a value-based approach” (see chapter 2) is adopted in the study, involving definition of the essential concepts of “value, cost and worth” (see chapter 3.1) in software development. These definitions originate from the “Value Engineering method” (see chapter 3.2), originally applied and developed for the needs of the production industry. Therefore, for the purposes of this study these concepts are firstly justified and secondly defined.
Generally, this study sees software engineering as a challenging combination of people working in teams, using processes in order to have effective work procedures, and technology for the creation and development of software. Furthermore, it notifies that
VALUE (+)economical, economical,
value creating and value creating andalso low capability & quality also high capability & quality
software development software developmentCAPABILITY (-) not economical, not economical, CAPABILITY (+)
not value creating and not value creating andalso low capability & quality also high capability & quality
software developmet software developmentVALUE (-)

20
there are several different approaches to software process improvement, as Kuvaja et al. (1994, 29), for example, have emphasized. These include assessment, modeling, measurement and technology transfer. (Kuvaja et al. 1994, 29) This study concentrates mainly on developing assessment (see chapter 5.1) processes and their improvement using Value Engineering, VE, which is considered to include engineering methods and tools for cost and value improvement work.
Conceptually this study makes use of the terms “software” and “engineering” as defined in Webster’s New Intercollegiate Dictionary (1979). “Software” is the entire set of programs, procedures, and related documentation associated with a system, especially a computer system. “Engineering” is the application of science and mathematics by which the properties of matter and sources of energy in nature are made useful to man in structures, machines, products, systems, and processes. “Software engineering” is considered to mean the application of science and mathematics by which the capabilities of computer equipment are made useful to man via computer programs, procedures, and associated documentation (Boehm 1981, 16).
Generally, “software process” is understood as SEI (1994, 9) has defined it, as “a set of activities, methods, practices, and transformations that people employ to develop and maintain software and the associated products (e.g., project plans, design documents, code, test cases, and user manuals). In addition, SPI has been considered generally as Rico (1999) has defined it: “a discipline of devising new and improved policies, procedures, standards, activities, tasks, processes, and tools for computer programming, software development, and software engineering, it may result in more successful software products, projects, programs, business divisions, organizational units, and ultimately businesses and organizations themselves.”
1.3 Research problem
This study adopts the value-based approach as a result of analyzing the economic-driven view of software development and discussing the SPI context and cost efficiency characteristics (see chapter 2). In order to study and evaluate the value-based approach this study develops a value assessment method, defined later in this study. Later on the value assessment is also combined with the capability-maturity -based assessment and called the Value Enhanced Assessment (VEA) method. As a whole the developed combination is seen to respond better to the presented overall challenges of software development and SPI containing both capability and value points of view and the value-based approach.
The overall research problem of this thesis is to answer the following questions:
− What kind of characteristics does the value-based approach include? − What kind of characteristics does the VEA method include? − Do industrial VEA cases support the value-based approach and do companies see VEA
as usable?
In this study, value assessment and VEA are considered to be predefined and organized collections of techniques and sets of rules which state by whom, in what order, and in

21
what way the techniques are used to achieve and maintain some objectives. More precisely, as methods they both aim to include knowledge of conceptual structure, notation of concepts, process, participation & roles, development activities & decisions and the values & assumptions of method. (Tolvanen 1998, 33-43).
1.4 Research methods, main results and limitations
The main parts of this research are constructive. Constructive research constructs new reality by using research results which have in part been presented before. (Järvinen 2001, 88-117)
The state-of-the-art part of this dissertation advances the concepts, principles and practical methods of economic-driven software engineering by associating them with SPI concepts, theories and software process assessment methods, in particular capability-maturity -based assessment methods (see appendixes) using literature analysis. Since the author has also become familiar with the problem area, VE and software process assessment methods, by implementing several value studies and industrial assessments, a basic discussion about the SPI context and its cost-efficiency characteristics is presented as well. As a result of the literature analysis, a value-based approach is adopted in the study.
In order to study and evaluate the value-based approach, a method called value assessment is developed in this research. Later on it is also combined with capability-maturity -based assessment, to respond better to the overall challenges of software development and SPI. In this development work the author has used his assessment experience to strengthen the overall understanding of the phenomena and analysis results to build proposed methods.
In this study the BOOTSTRAP method has been selected as a basis for developing VEA for two main reasons: firstly because it offers a possibility to assess all processes in all capability levels (see appendixes), and secondly because it represents a typical capability-maturity -based assessment. The first reason is seen as particularly important since it is not possible to know beforehand what capability levels the processes of each case company are at, and in some models only a limited number of processes belong to each level. If this kind of method (for example CMM) had been selected it would have lead to experimental value assessments where only a few processes would have been assessed, based on the maturity level (see appendixes) the company was at.
The developed new method is evaluated using the feedback collected from each of the three case companies, reporting the strengths and weaknesses found based on assessment reports and ensuring the reliability of the assessment results using several interviews and cross-checking them with written materials (for example process descriptions).
The results show that although there is still much to do in making the economic-driven view complete in software engineering, the value-based approach outlines a way towards a more comprehensive understanding of it. In addition, value assessment methods are most likely to be needed to complete existing capability-maturity -based assessment methods, like BOOTSTRAP

22
Although the cases selected represent all the proposed enhancements, there are a number of limitations to this study. The three case studies analyzed at the end of this dis-sertation use an empirical approach but the number of case examples could have been bigger, to make the understanding of the value-based approach and proposed method more thorough. The measurement of customer worth could also have been more accurate. This is due to the fact that least cost (or lowest cost) or price (see chapter 3), which is not calculated directly based on customer needs and wants, does not necessarily represent customer worth as accurately as possible. Moreover, the software process assessment methods seem seldom to be based on a solid theory. This is the case with, for example, BOOTSTRAP, CMM and ISO 15504. Historically, all these methods have clearly been based on a collection of heuristics and industry best practices rather than a theory. Unfortunately, Value Engineering seems also to have a similar base and to lack a solid theory.
1.5 Structure of the dissertation
The first chapter introduces this dissertation. It explains the motivation behind this research, its scope, research problem, methods, main results, limitations, and structure.
The second chapter advances the concepts, principles and practical methods of economic-driven software engineering and introduces the value-based approach.
The third chapter justifies and defines the roots and concepts of value as it is understood in the value-based approach using terminology presented in the Value Engineering literature. Furthermore, it defines the concept of capability, especially in relation to value, and presents the principles of model-based software process improvement.
The fourth chapter introduces the Value Engineering process which is used in value assessments and VEA in order to study and evaluate the value-based approach.
The fifth chapter discusses the capability-maturity -based and value assessments and outlines a way to combine them into VEA.
The sixth chapter presents the assessment processes used in VEA method, using the BOOTSTRAP method as an example.
The seventh chapter outlines the assessment types and tools for VEA, and situates them on the map of other assessment types, as well.
The eighth chapter applies the developed method in several real life industrial cases to see if they support the value-based approach. It also discusses the experiences collected during the assessments.
The ninth chapter draws conclusions from this work. Appendix 1 presents the theoretical and methodological background for common
software process assessment methods. Appendix 2 defines VE into CMM and BOOTSTRAP models. Appendix 3 illustrates maturity levels of assessment in Company B.

2 Economic-driven software engineering and value-based approach
This chapter makes use of the words “software” and “engineering” as defined in Webster’s New Intercollegiate Dictionary (1979). “Software” is the entire set of programs, procedures, and related documentation associated with a system, especially a computer system. “Engineering” is the application of science and mathematics by which the properties of matter and sources of energy in nature are made useful to man in structures, machines, products, systems, and processes. “Software engineering” is considered to mean the application of science and mathematics by which the capabilities of computer equipment are made useful to man via computer programs, procedures, and associated documentation (Boehm 1981, 16).
“Economic” is considered to be budgetary, business, financial, fiscal, monetary and money-making solution. “Economical” is cheap, cost-effective, inexpensive, low-priced, money saving, reasonable and also value for money creating solution. (Oxford University 1992, 164).
2.1 Software business and engineering – an economic view
Reo (2000) has stated that: “Software business is a much broader concept than, for exam-ple, software engineering or software production. It refers to a holistic, process-driven, cross-functional, and multi-disciplinary view of software companies. According to this view, all functional areas of a software business such as product planning and manage-ment, systems engineering, customer support, and information and knowledge, human resource, marketing, legal, and financial management need to be addressed in a balanced way.” Product planning needs to be in balance so that we fulfill most of our customers’ expectations. Systems engineering needs to provide solutions for the production of the products as well as marketing needs to provide ways to sell them. We also need to organize customer support functions so that we can support users using the products. Furthermore, we should also recognize that the customer is interested mostly in our

24
products, not necessarily in other functions or in our processes. If the product works and all customer requirements are fulfilled, the customer will be satisfied.
Since the software business offers several points of view to us, it also offers several re-search challenges. According to Käkölä (2002), software business research offers: “Chal-lenges in topics including leadership, managerial, organizational, contractual, and product creation and delivery practices as well as in competitive strategies and knowledge management systems of software companies.” Käkölä (2002) sees this kind of broad, multidisciplinary view as necessary to understand these companies holistically. Without such an understanding it is difficult to suggest relatively detailed but generic solutions for a specific strategy, process, product or service (Käkölä, 2002).
According to Käkölä (2002): “Software production is an important functional disci-pline but can only realize its potential in full when it is seen in the holistic context of soft-ware business.” Morrissey and Wu (1979) emphasize that the production of software can be viewed as an economic, as well as an engineering process, admitting that there is also considerable contact with such disciplines as psychology, linguistics, and management.
Morrissey & Wu (1979) continue: “... However, aside from some cost estimating topics, interaction with economics has been rather curiously neglected.” This conclusion seems to gain support from Erdogmus et al. (2004), who state that: “Traditionally, the study of software engineering has been primarily a technical endeavor with minimal attention given to its economic context.” Morrissey & Wu (1979) emphasize that at least costs, capital-labor relationships and productivity should be examined in relation to software engineering. Slaughter et al. (1998, 67) highlight the need to evaluate the cost of software quality and note that there are some people who believe that it is economical to maximize quality, and others who believe that it is necessary to sacrifice quality to achieve other objectives like reduced development cycles. This opinion is also supported by SEI (1994), who quotes a software manager stating: “I’d rather have it wrong than have it late. We can always fix it later.”
Slaughter et al. (1998) also note that in software companies important questions arise concerning whether and how much to invest in specific software quality improvement initiatives. They continue by saying that one key management problem is making profitable decisions concerning expenditure on quality. Regarding improvement initiatives, Jones raises three questions to illustrate the same situation by asking: (1996b)
− What does it cost to improve software processes? − How long will it take to make tangible improvements? − What kind of value can be expected in terms of better quality, productivity, or user
satisfaction?
Erdogmus et al. (2004) are amazed at our current way of producing software. They state that: “Software development essentially is an irreversible capital investment and software should add value to the organization just as any other capital expenditure that creates a net benefit. Therefore, it is surprising that software engineers in organizations whose very existence is dependent upon the profitability of their software find themselves poorly equipped to make technical decisions that have significant but poorly understood eco-nomic consequences.” Other disciplines, such as decision theory, game theory, and economics, have highly relevant concepts and well-established ideas that have the poten-tial to contribute to the foundations of software engineering, but the typical software

25
engineer seldom encounters this work. By viewing the software product as an economic artifact as opposed to a strictly technical one, we find that much of this research from other fields has the potential to contribute to concepts, tools, and methods that align with the software industry’s needs (Erdogmus et al., 2004). Kemerer (1998, 63-66) shares this point of view and states that: “Computer scientists too frequently fail to cite relevant work done by business school researchers that is published in business journals. Software costs continue to be significant, and industry’s understanding of how to reduce them has improved only very slowly for example in contrast to hardware… which is improving by producing smaller products and continuously decreasing prices.”
Perhaps we are moving towards more economical software engineering. If it happens as Kaufman & Higgins (1998, 32) state, we will need the next generation of researchers from business school doctoral programs to carry out this work.
Koskela & Huovila (1997) have defined this situation by stating that the conventional software engineering approach is based on conversion and flow views, whereas the approach is changing nowadays in favor of a value generation view. The content of this development can be seen in Table 1.
Table 1. Engineering approaches
Conversion view Flow view Value Generation view Conceptualization of Engineering
As a conversion of requirement into product design
As a flow of information, composed of conversion, inspection, moving and waiting
As a process where value for the customer is created through fullfillment of his requirements
Main Principles Hierarchical decomposition;control and optimization of decomposed activities
Elimination of waste (non-conversion activities), time reduction
Elimination of value loss (achieved value in relation to best possible value)
Method and practises Work breakdown structure, Critical path Method, Organizational responsibility chart
Rapid reduction of uncertainty, team apprach, tool integration, partnering
Rigorous requirement analysis, systematized management of flowdown of requirements, optimization
Practical contribution Taking care of what has to be done
Taking care of that what is necessary is done as little as possible
Taking care of that customer requirements are met in the best possible manner
Suggested name for practical application of the view
Task Management Flow Management Value Management

26
2.2 Software cost estimation
The markets around software companies have changed significantly during recent years. Several authors have stated that delivering a software product on time, on budget, and at an agreed level of quality is a critical concern for software companies (see Briand et al. 2000). Underestimating costs has significant effects on the quality of the delivered soft-ware, and on the company’s business reputation as well as its competitiveness (Briand et al. 2000, 377). On the other hand, overestimation of software costs can result in missed opportunities for funds in other projects (Briand et al. 2000, 377).
Over the last thirty years, a significant effort has been put into developing software cost estimation techniques. These techniques have drawn upon a variety of fields, such as statistics, machine learning, and knowledge acquisition (Briand et al. 2000, 377). The methods developed include, for example: model-based, expertise-based, learning-oriented, dynamics-based, regression-based, and composite-Bayesian models (Chulani 2001). All these models have tried to answer basic questions such as: What is a software cost estimate? Is it the most likely cost, the planned cost, the budget, the price or something else? Jørgensen (2003, 1) sees that it is not meaningful to compare and analyze cost estimates unless it is clear which interpretation is applied. He continues by saying that: “Several software engineering textbooks and scientific estimation studies do not clarify how they apply the term “cost estimate”.” Nemecek (2001, 414) defines software cost estimation as “the process of predicting the amount of effort required to build a software system, and it is a fundamental managerial planning activity. Software cost estimation models provide one or more mathematical algorithms that compute cost as a function of one or more variables.”
Chulani (2001, 1) has stated that due to the “pervasive nature of software, software-engineering practitioners have continuously expressed their concerns over their inability to accurately predict the cost, schedule and quality of a software product under develop-ment.” Several estimation methods have been compared in order to find the most suitable one (Chulani et al. 2000, Briand et al. 2000 and Yokoyama & Kodaira 1998). But still Putnam & Myers (1997, 105) ask: “How solved is the cost estimation problem?” They point out that negotiations on project costs and delivery dates between the developers of software and the managers who request it are often like the negotiations between opposing factions. “Each side is only concerned with what it can win, even if the resulting loss to the other side may jeopardize the entire situation.” To avoid this, Putnam & Myers (1997, 105) suggest an approach for establishing peace between software engineers and their customers. Their proposal is based on the use of a few commonsense steps coupled with more efficient use of historical data.
Fairley (2002, 61) sees the question of using the right estimation method in another way. Instead of recommending any estimation method he points out 12 issues to consider in making accurate estimates. These are:
− Establish local calibrations − Provide accurate inputs − Distinguish between accuracy and precision − Involve key team members − Include all applicable activities in bottom-up estimates

27
− Apply constraints top-down, measure status bottom-up − Account for resource availability − Understand what is estimated − Re-estimate periodically and as events dictate − Maintain a balance between requirements, resources, and time − Distinguish between estimates and commitments − Use standardized templates to report estimates.
However, Nemecek (2001, 314) states: “Yet today we are rarely able to accurately predict the costs of software development while we are faced with increasing demands for better software costs estimation. Why?” One reason for this is perhaps that we do not necessarily have complete data, as Strike et al. (2001, 890) say. This is often due to the fact that historical databases are missing data or are incomplete. It is also possible that the company may be using multi-company data instead of company-specific costs, and there-fore the estimate differs significantly from real data. According to Nemecek (2001, 314): “There are numbers of cost models, all of which perform approximately similarly and similarly poorly.” He continues by giving the example that “estimates which are within 30% of actuals 29% of the time are not uncommon.”
As a whole, estimated cost information seems to have a clear place in software development. A good estimate gives a clear direction and framework for starting develop-ment work. However, when making estimates one should always take into account the entire product or development life cycle. Bhattacharjee & Ramesh (2000) have defined a model for dividing software development into phases for cost estimation purposes. Their framework contains five kinds of costs:
− Planning cost − Development cost − Acquisition cost − Implementation cost − Management cost.
In their study, they emphasize that different costs behave in different ways in different phases of the development life cycle. Some costs come into effect earlier and some at the end of the development.
2.3 Software quality improvement as an investment
Slaughter et al. (1998, 67) indicate that the economics of improving quality are clearly not understood. In their opinion, “the time has come to financially justify investments in software quality improvements, just like we justify other software projects.” They con-tinue by saying that the explosive growth of the software industry in recent years has focused attention on the problems long associated with software development: uncontrollable costs, missed schedules, and unpredictable quality. According to Slaughter et al., this may happen because companies try to get their products on the market more quickly and hence try to avoid quality improvement processes such as design reviews and

28
code inspections, believing that these processes only add time to the development cycle (Slaughter et al. 1998, 67).
In their research, Slaughter et al. (1998, 73) emphasize that software quality improve-ment should be viewed as an investment. It is possible to spend too much on software quality and therefore it is important that companies financially justify each software quality improvement effort (1998, 73). Finally, Slaughter et al. (1998, 73) state that “it is important to monitor software quality conformance (baseline configuration management, design review, system testing, quality assurance) and nonconformance (debugging, configuration management migrations of software fixes, regression testing, additional audits and reviews) costs so that conformance policies can be adjusted to reduce the total costs of software quality.”
If software development costs are uncontrollable, what should we do? Slaughter et al. (1998) propose that we should see software quality improvement as an investment. They suggest that one possibility for the evaluation of software development is the net present value of the software quality revenues and costs, or cash flows (NPVCF), divided by the net present value of the initial investment and ongoing maintenance costs for the software quality initiative (NPVIC) (Slaughter et al. 1998, 69).
Solingen (2004, 32) also proposes a financial point of view on software process devel-opment. He points out that “many companies have invested large sums of money in im-proving their software processes, and several research papers document Software Process Improvement’s (SPI) effectiveness. SPI aims at more effective and efficient software development and maintenance by structuring and optimizing processes. SPI assumes that a well-managed organization with a defined process is more likely to produce products that consistently meet the purchaser’s requirements within the schedule and budget than a poorly managed organization with no such engineering process … It does not guarantee good products … and a question regularly pops up whether these investments are worth their cost” (see also Solingen 2004, Emam & Briand 1997 and Rico 2004). Solingen (2004) also points out that “we find only a limited number of industrial SPI publications that contain cost-benefit numbers and that measure Return on Investment.” He considers analyzing SPI’s Return on Investment (ROI) to be relevant in:
− Convincing managers to invest money and effort in improvement, and convincing them that SPI can help solve structural problems.
− Estimating how much effort to invest to solve a certain problem, or estimating whether a certain intended benefit is worth its cost.
− Deciding which process improvement to implement first. Many organizations must prioritize due to timing and resource constraints.
− Continuing improvement programs. SPI budgets are assigned and discussed yearly, so benefits must be explicit and organizations must show sufficient Return on Investment (ROI), or continuation is at risk.
− Surviving, because any investment in an organization should be valued against its return. Otherwise, money will likely be wasted and in the long run you risk bankruptcy. (Solingen 2004, 32)
How should we develop our software processes and products then, to consider cost and Return on Investment (ROI) points of view?

29
Barry Boehm (1981) has outlined a hierarchical GOALS (Goal-Oriented Approach to Life-cycle Software) structure (Figure 2) for successful software engineering. He claims that if we wish to be fully successful in software engineering we need to pay attention to two primary sub-goals (Boehm 1981, 718):
1. Achieving a successful software product 2. Conducting a successful software development and maintenance process.
More precisely, Boehm states (1981, 718) that both of these sub-goals have three similar components:
1. Human relations. The application of science and human judgment to the development of systems which enable people to satisfy their human needs and to fulfill their human potential.
2. Resource engineering. The application of science and mathematics to the development of cost-effective systems.
3. Program engineering. The application of science and mathematics to the development of computer programs.

30
Fig. 2. Successful software engineering
Boehm (1981, 719) concludes that “successful software engineering is the result of achieving an appropriate balance between these component sub-goals, for both the soft-ware product and the software process. The GOALS approach can be used to guide how we specify, develop, and maintain software (Boehm, 1981, 23).” The GOALS approach includes the following steps for following the described hierarchical structure:
1. Define the major goals to be achieved by the software product and the software process.
2. Use the software engineering goal structure as a checklist. 3. Define the means by which you will achieve the goals. 4. Follow your plan through the achievement of your next process sub-goal. 5. Review both your product and process status with respect to goals. 6. Iterate your goals and plans as necessary. 7. Continue to perform steps 4 to 6 for successive process sub-goals until the process is
completed.
Successful software engineering
Feasibility Validation
Requirements Validation
Product Design
-Verifying and validating
Staffing
Successful software development processSuccessful software product
Human relations
Integration (V&V)
Implementation (V&V)
Configuration Management (V&V)
Resourceengineering
Program engineering
Programming (V&V)
Human relations
Resourceengineering
Program engineering
Phaseout (V&V)
Maintenance (V&V)
Cost-effectiveness
Planning
- Estimating
Controlling
-Meeting schedules & budgets
PlanningPrecisely specified
-Complete
-Guarded
-Consistent
-Feasible
-Testable
Using modified golden rule
Automating
Controlling
Directing
Organizing
Adaptable
-Structured
-Device-independent
-Understand-able
Correct
Tunable
Efficient
-Balanced
Follows modified golden rule
Fullfills human potential
Satisfies human needs
Easy to use

31
8. Independently of all, review your progress with respect to the entire software engineering goal structure. Iterate your goals and plans as necessary. (Boehm 1981, 24)
However, even though Boehm (1994, 2000, 2003) has contributed several articles after defining elements for successful software engineering, it is surprising that he has not considered economical approaches to Software Process Improvement (SPI). Since SPI can be considered as “a discipline of devising new and improved policies, procedures, standards, activities, tasks, processes, and tools for computer programming, software development, and software engineering, it may result in more successful software prod-ucts, projects, programs, business divisions, organizational units, and ultimately busi-nesses and organizations themselves.” Therefore, Rico’s (1999) wide managerial point of view seems to be more valid. After analyzing several SPI methods he found significant differences between the best and worst SPI methods. These differences manifest themselves in terms of cost, quality, productivity, cycle time and ROI (Rico 1999).
Why then is an economically-focused managerial point of view of SPI so vital? Because SPI is expensive, it involves several people in the organization, and it affects everything the company does. One can also state that there is no point starting improvement initiatives, which have not been evaluated economically and have not passed the economically-based criteria. Even Rico (1999) has found differences in the economical effectiveness of SPI methods and strategies, his purely managerial point of view can be challenged, because it does not take into account customer point of view. Even if we prioritize SPI methods using cost, quality, productivity, cycle time and ROI, we would still not know what the customer wants, because these measures are rather clearly developed to evaluate the company’s own internal effectiveness. How much the customer, who is paying for our products, benefits from our SPI should also be considered, so that the universal complaint that SPI is not worth the money would be examined from the external customer point of view as well. This should be rather clear since the customer is bringing the money to the company and his interests should also guide our SPI activities, so that we would serve him as well as possible using our processes.
In addition to Boehm’s way of classifying processes, several other researchers have classified process areas using different work practices. Models such as Bootstrap, CMM and CMMI propose that to be successful in software process improvement we should classify processes into practices and use capability-maturity -based assessment to produce improvement proposals for their improvement. However, according to Rico’s (1999) research, these methods do not guarantee to software managers the falsity of the universal complaint stating that moving from level to level can cost thousands or even millions of dollars (as presented, for example, by Saiedian & Kuzara 1995); nor do they mean that companies should believe that these investments will return their money. Rico (1999) merely outlines which methods perform better than others.

32
2.4 Activity-Based Costing (ABC)
Theoretically, one could claim that it is not enough simply to admit, like Boehm (1981, 17), that when process costs determine product costs, cost effectiveness is analyzed and controlled only in regard to the software development process as Boehm has encouraged (1981, 24). This is because products are the outputs of processes and, according to Kap-lan & Cooper (1998, 3), for instance, there is a clear dependency between process and product costs. Products use processes and therefore, in Activity-Based Costing (ABC), costs are allocated to products as well. If product prices do not cover all production costs, the company suffers losses. Product pricing is also significantly more difficult if we do not know the quantities of materials, the amount of working time and other resources we have used in production, and how much these items have cost us. We can rather easily find ourselves in a situation in which we price products based on our beliefs, and we hope that customers will buy them. When we do not know which product has generated which particular cost for us, we cannot tell which products are the most profitable either. In this kind of situation there is the danger that some products may look profitable and other ones may not, so we end up cutting the manufacturing quantities of the most profitable products, rather than of the products which cause the greatest losses.
Activity-Based Costing is based on rationalizing and strengthening cost accounting at the process as well as the product level. More precisely, ABC enables expenses to be driven using cost drivers, first in activities and processes, and then in products, services, and customers (Kaplan & Cooper 1998, 3). Naturally, the more use products make of processes, the more costs are allocated to them, and this is taken into account in product pricing too. According to Jones (1996, 103), the ability to measure all activities associated with software production, not just coding, has led to the concept of activity-based studies. He continues by saying that activity-based cost analysis can be much more accurate than other estimating methods that lack any internal structure or granularity.
Jones (1996, 103) claims that “the ability to measure all activities associated with soft-ware production, not just coding, has led to the concept of activity-based studies”. Ooi et al. (1998, 341) note that many companies nowadays use large integrated systems, and because of this there is a clear need for accurate estimation and appropriate allocation of actual development and implementation costs to users. Ooi et al. (1998, 341) also present an ABC approach to estimating and recovering software development and implementation costs. They also address two main problems faced currently by many organizations: “1) inaccurate estimation of project resources and 2) incorrect allocation of actual resource costs to projects. Inaccurate estimation occurs because there is often no systematic organizational procedure for learning from previous estimation errors. The ABC approach enables organizations to track actual resource consumption by development activity for each project and provides a basis for variance analysis of esti-mated and actual costs. This facilitates learning that is specific to the organizational con-text.”
Ooi (1998, 341) point out that: “Many organizations apply a single charge-out rate to the number of man-days consumed by the project. This does not recognize the vastly different unit costs of different types of IT resources and penalizes the simple project that may be using relatively less skilled and hence less expensive development resources. The

33
ABC approach explicitly recognizes different resource pools and allocates the different costs to various development and implementation activities.”
Even though the dependency between process and product cost is obvious, some peo-ple still think that in a world of Total Quality Management (TQM) and customer satisfac-tion, financial and cost measurement may be unimportant. For example, a group of professors (Nanni et al. 1990) argue against the costing system: “… when cost accounting data of any kind does not help, “better” cost accounting data will not help either … Several companies had even gone beyond tinkering with their cost accounting systems. These companies cut the Gordian knot by finding simple, innovative, yet bold solutions to the performance measurement problem.”
The theory that advocates the elimination of financial measures for front-line employ-ees and replaces financial measures with measures of quality and timeliness, apparently assumes that “if the operational measures are good, the result is on-time delivery and product-line budget cost. If operational measures are bad, these results should not occur.” (Kaplan & Cooper 1998, 54) In other words, good operational measures are both neces-sary and sufficient for achieving good financial performance, so employees do not need to see and consider cost-based measures (Kaplan & Cooper 1998, 54). Nanni et al. (1990) state that “Accounting-based performance measures become less useful as the following situations occur:
1. The market environment in which the firm competes becomes more dynamic; and 2. The level of management at which performance is being measured becomes closer to
physical activities.”
Kaplan & Cooper (1998, 54) consider that in the statement above, the authors clearly believe that cost signals are, at best, distracting and disruptive to front-line employees in innovative, quick response, high quality environments. It is, however, implausible to suggest that if we have a business in a more dynamic environment, we would not be interested in minimizing costs at all levels and at the same time maximizing profits as well. In a dynamic environment employees as well as managers can own the company, and they are sincerely interested in minimizing costs and maximizing profits as well.
Another academic, Johnson (1990, 15-21), argues that companies should focus on the most important information concerning what it takes to keep customers satisfied, and states that cost and financial information are not relevant for this purpose: “Always keep information that is used to control operating activities separate from the financial information that is used for planning and budgeting.” Johnson seems to be fully against sharing financial information with employees involved in customer-satisfaction activities; he states: “Whatever form management accounting takes … never again should it be seen as a tool to drive people with measures.” Why, then, do many companies have bonus salary systems based on this financial information? Why do employees get stock options based on financial results not on measures? Most probably because the owner of the company is willing to reward them based on results not measures.
According to Kaplan & Cooper (1998, 55), “these academic critics claim that financial measures should not coexist with non-financial measures to promote employee learning and improvement activities. Their quite explicit recommendation is that in a world where quality, responsiveness, and customer satisfaction are primary, organizations should di-rect their front-line people towards achieving excellence along these dimensions. They

34
assume that companies that improve quality, reduce cycle and lead times, and keep customers satisfied will be rewarded with both low costs and high profits. If this view is correct, indeed there would be little apparent need for financial measurements for front-line employees. They should just focus on quality and time. Low costs and expense con-trol will inexorably follow. And there should not be no space for employees to enhance learning and improvement activities.” In Johnson’s environment, employees do not know which products are the most profitable. They try to improve all processes based on the assumption that if processes are randomly improved, costs will be lower and customers happier. Quite often this applies to capability-maturity -based assessments methods too, which focus on improving processes and assume that the products will get better too.
Kaplan & Cooper (1998, 55) point out that: “Facts, unfortunately, occasionally intrude on academic theories, because many companies have made enormous commitments to improving quality and satisfying customers, yet still had disappointing, if not disastrous, financial performance.” This is quite obvious. If the company concentrates only on qual-ity and timeliness and forgets costs many things can happen. For example, workers may not have any idea what kind of work gives the best financial benefits to the company, and most of the working time they will neglect these tasks. Furthermore, to improve timeliness, managers may add resources, such as workers or machines, so that there is always the capacity to handle new orders, but perhaps no orders will come in, and as a result costs will rise significantly. It is also always possible that to improve quality, managers run machines at low speeds to avoid errors, which creates a need for more labor to run the machines and is in conflict with timeliness and possibly also with financial profit maximization by cutting costs.
As an addition to Activity-Based Costing we should also note that costs need to be cal-culated for the entire process, product or service life cycle. If only certain costs are taken into calculation in a certain period, cost accounting does not give an accurate view of the situation. Dell’Isola (1997, 111) has defined life cycle costing (LCC) as follows: “It is the process of making an economic assessment of an item, area, system, or facility by consid-ering significant costs of ownership over economic life, expressed in terms of equivalent costs. The essence of LCC is the analysis of the equivalent costs of various alternative proposals. To ensure that costs are compared on an equivalent basis, the baseline used for initial costs must be the same as that used for all other costs associated with each pro-posal, including maintenance and operating costs.”
2.5 Value in software process and products
The fundamental goal of all good design and engineering – to create maximal value added for a given investment – has become vital for many software companies. Boehm (2000, 321) notes that there are many dimensions in which “value can be assessed”, from monetary profits to the solution of social problems. He continues (2000, 321): “Software economics is the field that seeks to enable significant improvements in software design and engineering through economic reasoning about product, process, program, and portfolio and policy issues.”

35
Past work in the software engineering field has focused largely on costs, not on benefits, thus not on value added; nor are current technical software design criteria linked clearly to value creation (Boehm 2000, 321). This is rather surprising because Value Engineering (VE) as a theory already has a forty- to fifty-year history (for the history see Brown 1992, 1-5). It has been used in several different situations in several different branches (Dell’Isola, 1997).
Perhaps the slow approval for Value Engineering in software engineering has some-thing do with the business’s maturity. When companies do not see value improvement as a priority, they focus mainly on “technical design.” Frederik Mosteller (1981) gives an interesting example of how Innovation and Evaluation can proceed. “The first ship test concerning the adoption of fresh fruit in the British Navy was carried out in 1601. It was called off because too many sailors who were in the control group died. Despite this evidence, a second test was performed in 1747. In spite of its success it took another 48 years to wipe out scurvy in the British Navy. However, it is even more remarkable that it took 70 more years to adopt a similar policy in the merchant navy. One can only imagine the ship specification: “an extra 100 percent crew-quarter space for the sick and dying.” If this sounds ridiculous to us, how about a software specification: “an extra 100 percent time to fix some of the problems that we didn’t take the time to prevent earlier.” In both cases, decisions were made to carry out certain actions instead of others. Other innova-tions like new ships and new guns were accepted more readily.”
Are we also improving software processes in the same way? The priority for improv-ements is the “ships and guns,” in other words we are increasing time for testing, not for preventing problems earlier when they arise. Quite often we start our software process improvement by looking at the capability levels of processes, and we increase resources but not necessarily in the right processes. Grady (1997) states “adoption of any practice requires widespread convincing. The heart of convincing anyone to change is their perceived value of the change. How do we express the value of changes better so that we can leverage proven successes more quickly?”
Grady (1997, 218) has outlined a model for the value of software development process improvement. This model is made from the development organization’s point of view and can be presented as follows (1):
Value = Benefit - Cost (1)
Grady (1997, 218) emphasizes that his model offers four benefits as answers to common questions. Will an improvement in process:
− Get you more/better products? (Product Capability) − Get you products sooner? (Time to Market) − Get you products to meet commitments? (Timeliness) − Help make your products long-lasting and easy to evolve? (Product Evolution)
Grady (1997) also notes that Product Capability, Time to Market, Timeliness and Product Evolution affect our decisions about how much benefit (or worth) we get. In relation to costs, the more Development, Rework or Knowledge Recovery we do the more we create costs in our processes.

36
Grady’s model is based on improving value in software processes. It ties together soft-ware processes and products, but it neglects value in software products. Boehm (2003, 34) also sees that there has been progress over the years in integrating some value-ori-ented perspectives into software engineering. However, he states that these approaches have generally been treated as “add-on band-aids” to baseline software engineering principles and practices including:
− Requirements engineering − Architecting − Design and development − Verification and validation − Planning and control − Risk management − Quality management − People management − Principles and practices. (Boehm 2003, 34)
Tallon et al. (1999) have confirmed that process-level impacts can be used to measure IT business value. According to their value-based model of IT, business value can be derived from the impact of IT on processes and inter-process linkages within the value chain. Using their model they have explained IT business value at the organizational level.
Grady (1997), Boehm (2003) and Tallon et al. (1999) see value from a process point of view. This is a good start but not necessarily enough. In successful software engineering we should take the product point of view into account more clearly, because a product is usually what the customer is buying, and the more worth they see in it the more income the company gets. All companies which are able to calculate value (Value= Worth/Cost) for their manufactured components have a more powerful tool at their disposal, because the product value will represent the customer’s point of view more clearly. In the product value formula, “Worth” describes how much worth all product components give to the customer and “Cost” what amount of resources the company has used as costs in order to make the components in question.
In a successful business relationship both the customer and the manufacturer points of view need to be taken into account. If both feel that trade is worth doing, it is usually done. This applies to processes, products, and services. It is not also enough to show that a certain process or product is more valuable than another. To be effective, the software process and product improvement itself should also give value, which is neglected in Grady’s (1997), Boehm’s (1984, 2000, 2003) and Tallon et al.’s (1999) research. If the value of the improvement itself is not taken into account properly, the justification for the management’s use of resources for improvement work continues to be poor. Since earlier in this study it was showed that improvement is expensive, and climbing from one capability level to another may be expensive for any company, this point of view seems to be justified. Capers (1996, 95) supports this point of view by stating that “comparatively little solid, empirical data is being published on three important topics:
− What does it cost to improve software processes? − How long will it take to make tangible improvements?

37
− What kind of value can be expected in terms of better quality, productivity, or user satisfaction?”
According to the outlined theory of successful software engineering, we need to concen-trate equally on quality, timeliness and value. At the product level the customer evaluates our products from the quality point of view to find out how good the product is, from the worth point of view to evaluate how he would benefit from using it, and from the timeli-ness point of view to evaluate whether he needs it at this particular moment. If we have effective processes producing reliable, good quality products at a reasonable cost and at the right moment, we form our business on a healthy basis. If the quality is not good, the customer will not necessarily want to buy our product, or he will not be willing to pay as much as we want. Furthermore, even a good product is useless if it arrives too late to meet the customer’s needs, or is too expensive.
2.6 Value-based approach
According to Boehm (2003, 33), “the value-based approach to software development integrates value considerations into current and emerging software engineering principles and practices, while developing an overall framework in which these techniques compati-bly reinforce each other.” As Boehm’s definition is very general, it is not enough for the purposes of this study. Mostly this is due to the fact that it does not offer support as to where to find the needed concepts, principles and practical methods of economic-driven software engineering to adopt the value-based approach in practice.
Using the framework presented by Koskela & Huovila (1997), the value-based approach is understood in this study as a process. The main principle of this process is to eliminate value losses in software development, products, processes and SPI. It uses economic-driven tools, which are based on economic studies including, for example, the areas of cost estimation, cost calculation (for example ABC and life cycle costing) and investment calculation. The value-based approach prefers calculating costs instead of estimating them, and also considers software development and SPI as investments, on which it is possible to spend too much money. In practice, the value-based approach takes care that the customer requirements are met in the best possible manner, ensuring quality, timeliness and value in products as well as in processes, over their entire life cycle. In particular, the aim of ensuring quality connects it to the other methods aiming for quality improvement.
The value-based approach also indicates a clear dependency between the process and products. It sees that we need to develop and optimize process activities so that processes produce the products needed. Furthermore, it sees that we must analyze products in order to reveal problems in processes and develop processes from the product point of view as well. This is vitally important, especially for companies respecting customer opinions and aiming to optimize costs in their processes, because the customers are the ones paying for the products and product-related services, and companies have to allocate all costs to products to be able to price them. The happier the customer is, the more worth he sees in buying the products from us. It is also clear that when we know our process and product

38
costs, worth and value, our ability to estimate, budget and control future risks will improve significantly.
Due to the economic-driven nature of the value-based approach, several improvement decisions are made at the management level. Management support is also vital in software process and product improvement initiatives. Therefore it is surprising that several studies in the area neglect the importance of product value by assuming that it is only achieved by improving processes. It is also just as surprising that many researchers do not examine the value of SPI itself. Studies are mostly carried out on assessing the value of processes, if they are carried out at all, but the improvement decision and initiative itself, which in many companies is difficult to make, is not considered from a value point of view at all. To be effective, the value-based approach to successful software engineering should evaluate processes and products as well as the economical benefits of starting and implementing their improvement.
In addition to the definition of the value-based approach presented in this chapter, chapter 3 justifies and defines the concept of value for the purposes of this study. Chapter 4 outlines the Value Engineering process, which is used as a basis in value assessments and VEA when studying and evaluating the value-based approach.

3 The concepts and improvement of value and capability
This chapter justifies and defines the roots and concepts of value as it is understood in value-based approach using Value Engineering terminology and literature. Furthermore, this chapter defines the concept of capability and presents the principles of model-based software process improvement. Of particular concern is an explanation of the underlying principles for combining Value Engineering and model-based software process improvement (SPI).
3.1 Value
Value is a goal in many activities we perform. However, as a concept it is a large, com-plex, and abstract subject, and simply defining it requires a great deal of thought, as, for example, Shillito and De Marle (1992, vii) have stated. It has been defined in literature using economic, moral, aesthetic, social, political, religious, and judicial values (see O’Brien 1976, 15, or Mudge 1971, 13).
3.1.1 Value as a force
In Ancient Greece people believed that certain primary or essential principles existed in the environment. According to Shillito & De Marle (1992) these indwelling principles gave value to the items they inhabited. Furthermore, Ethics contained” the good”, Relig-ion, “the holy”, and Aesthetics, “the beautiful.” When the indwelling principle was pre-sent, the object had value, when it was absent, the object was worthless. Religion was perverted when it lost its holiness. Art was degraded when it lacked beauty.
Even though from a historical point of view the Greeks’ idea of spirits dwelling in the rocks, water and other objects around us is old, it still influences our thinking. We quite often see value as dwelling in a product. Engineers and economists quite often think of value as a feature that a product or a feature has. A good example of this thinking is the way in which modern advertising sees these features. If when we fill our car’s gas tank

40
we ‘put a tiger in our tank’, the car’s engine will sound like a cat. However, Shillito & De Marle (1992) see value as more than just a property of matter. They consider it to be a force that governs our behavior. In their opinion we need to discard the anthropomorphic concept of value, and examine this force.
Shillito & De Marle (1992) say that an analogy between value and gravity will help to describe the force of value. They base their conclusion on Isaac Newton’s description of gravity as a physical force that attracts masses to each other. In his famous law of univer-sal gravitation, he stated that the force of gravity is directly proportional to the product of the masses of the bodies and inversely proportional to the square of the distance between them. He found that gravity was independent of the physical or chemical state of the bod-ies and of the presence of intervening bodies. According to Newton’s formula (2):
1 22
m mg
d⋅
= (2)
where:
g = gravity m1 = mass of object 1 m2 = mass of second object 2 d = distance between the objects.
Shillito & De Marle (1992) see the force of value as analogous to the force of gravity, and define it in the equation (3) as the product of the need for an object (n) times its ability to satisfy this need (a), divided by the cost of the object (c).
n avc⋅
= (3)
where:
v = the value of some object or service n = the need for the object or service a = the ability of the object or service to satisfy this need c = the cost of the object or service.
This equation shows that value is directly proportional to the product of the need for an object or service and the ability of the object or service to satisfy this need, and inversely proportional to the cost of the object (Shillito & De Marle 1992). Individuals commonly rate the importance of items in terms of their ability to satisfy their needs. According to Shillito & De Marle (1992), “importance” can be defined as (4):
I n a= ⋅ (4)

41
where:
I = importance a = ability to satisfy need n = need.
Furthermore, it is often relevant to measure the customer’s perception of the importance of the product. Several authors have defined value using the equation (5) (Dell’ Isola 1997, xix):
IVC
= (5)
where:
V = the value of some object, product or service I = the importance of the object, product or service C = the cost of the object, product or service.
Shillito & De Marle emphasize the fact that a wide variety of measurement techniques compare the importance and cost of items in order to measure value (Shillito & De Marle 1992, 10). Normally, these techniques establish numerical estimates of the importance and cost of items in a market. These techniques are also often used in evaluating the value of functions and/or components in design. In practice, these estimates are normalized by calculating the relative importance or cost of each item as a percentage of the total rating given to all items (Shillito & De Marle 1992, 10). From this point of view, value can be presented as formula (6) (Shillito & De Marle 1992, 10):
IVC
= (6)
where:
V = value of some object, product or service I = the relative importance (in percentage) of an object, product or service C = the relative cost (in percentage) of the object, product or service.
In value literature the most often-used equation for presenting value uses concepts like value, worth, and cost. The concepts of value and worth are often confused, but they have come to the English language from different roots. The word “value” is derived from the Latin word valare, which has market connotations. Its purpose is to explain value in terms of trading and marketing. The word “worth” is from Anglo-Saxon roots, being derived from weorth, which has a more personal connotation, describing the esteem that people have for items they want. From this point of view, “worth” describes the worth of a product or service to an individual and “value” describes an average of the worth that a

42
group of people ascribe to a product or service. Using this as a basis, Shillito & De Marle (1992) present the formula (7):
( 1 2 )worth worth worth nValuen
+ + +=
… (7)
According to Shillito & De Marle (1992), people often confuse value and quality. Quality is a characteristic of a product or service that can increase or decrease the value of an item. Quality, reliability, serviceability, maintainability and so on are attributes of a product or service. Value can include all these attributes and more. An imbalance between value and quality can lead to a situation in which inexpensive products of poor quality and reliability are offered. Likewise, an imbalance between profits and value can lead to a situation in which a manufacturer continues to make products which in their customer’s eyes are less interesting. In the worst case, they might already be seeking out competitors’ products.
According to Shillito and De Marle (1992, 24), “value is a form of energy, a force that satisfies our needs and motivates us to work. When people think of value as a property of an object or service they confuse cause with effect and overlook the energetic nature of value. Just as temperature is an effect of heat on matter, valuableness is an effect of value on matter. Value is directly related to the ability of a product or service to satisfy our needs and is inversely related to cost. Although value is transient and highly variable, it can be measured and modeled. By expressing value in energy terms analysts can bring the accuracy and rigor of science to economics and management. They can quantify and model the value of products and services and create new standards for value.”
3.1.2 Customer, retail and manufacturing value
Even though value as force is perhaps more variable than other forces it can be measured from several points of view. According to Shillito & De Marle (1992), good consumer value exists when the product needed costs little and performs well (8):
performanceCustomer valueprice
= (8)
This formula is based on idea that each product component or function has its own spe-cific cost, which increases product price. In practice, the cost of manufacturing these functions varies between customers, as do individual customers’ needs for them. There-fore, each product function should satisfy a customer need as described in the following formula (9):
Value = [(n · a/c) 1 + (n · a/c) 2 + (n · a/c) ?] (9)

43
where:
n = the need for an object or service a = the ability of an object or service to satisfy this need c = the cost of the object.
In this formula, all the functions, which should fulfill customer needs, are presented in numbers and the final function as a question mark. Crum (1971, 13-14) has defined cus-tomer value using four types of value concepts, which are:
− Use value: the properties that accomplish a use, work task or service. (Note that the use value of a product can be no greater than the value of the individual functions per-formed.)
− Esteem value: the properties, features or attractiveness that make ownership desirable. − Exchange value: the properties or qualities of an object that make ownership desirable. − Cost value: the sum of labor, material and overhead costs required to produce
something.
Using these concepts, price can be defined as (10):
Price = Use value + Esteem value (10)
and therefore, in Crum’s (1971) opinion, the ratio (11):
Use value Esteem valueprice+ (11)
represents a measure of the value opportunity for customer. The value of a product to a retailer may differ significantly from the value to a cus-
tomer. This is because, for one thing, the retailer is primarily interested in a financial return on his investments (Shillito & De Marle 1992, 19). Retailers are interested in quick profits, and products that they can sell quickly. Furthermore, retailers want to achieve maximum income with minimum investment. Therefore the value formula for a retailer differs from the value formula for a customer. A retailer’s value formula shows that instead of calculating a cost-benefit ratio, retailers estimate the sales revenues they would expect to receive from selling their products. Retail product value is calculated using the formula (12) (Shillito & De Marle 1992, 19):
Retail value = unit sales (unit price – unit cost) (12)
The manufacturer of a product for a retailer or a customer also uses his own formula for value calculation. This is because his interest is slightly different than the others’ inter-ests. Compared to a retailer he has higher capital costs, related to the manufacturing plant and tools. This also forces manufacturers to keep manufacturing going on most of the time. Because the manufacturer is also interested in the return he will get on his money,
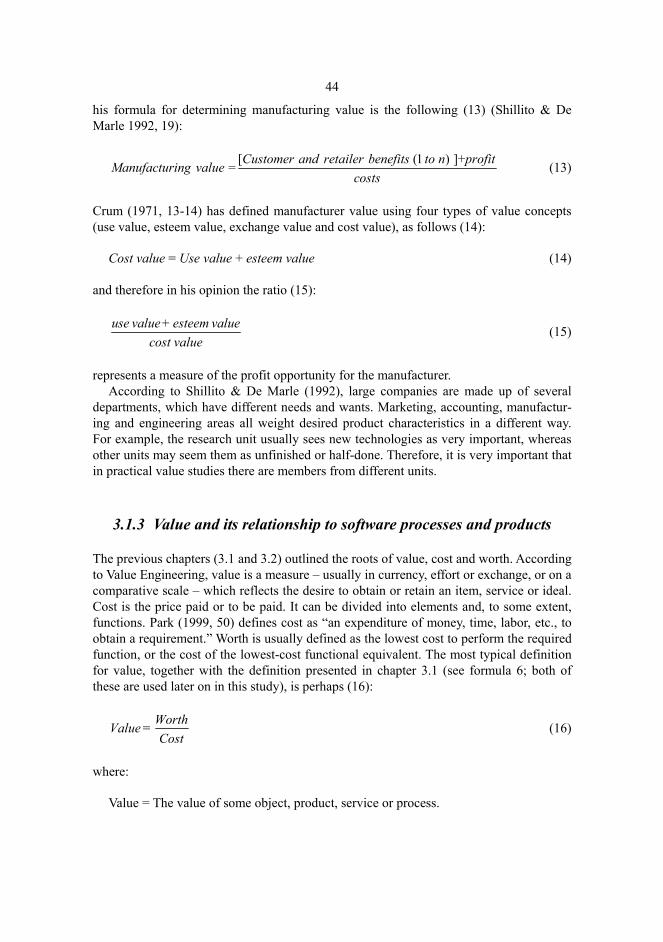
44
his formula for determining manufacturing value is the following (13) (Shillito & De Marle 1992, 19):
[ (1 ) ]+ = Customer and retailer benefits to n profitManufacturing valuecosts
(13)
Crum (1971, 13-14) has defined manufacturer value using four types of value concepts (use value, esteem value, exchange value and cost value), as follows (14):
Cost value = Use value + esteem value (14)
and therefore in his opinion the ratio (15):
use value + esteem valuecost value
(15)
represents a measure of the profit opportunity for the manufacturer. According to Shillito & De Marle (1992), large companies are made up of several
departments, which have different needs and wants. Marketing, accounting, manufactur-ing and engineering areas all weight desired product characteristics in a different way. For example, the research unit usually sees new technologies as very important, whereas other units may seem them as unfinished or half-done. Therefore, it is very important that in practical value studies there are members from different units.
3.1.3 Value and its relationship to software processes and products
The previous chapters (3.1 and 3.2) outlined the roots of value, cost and worth. According to Value Engineering, value is a measure – usually in currency, effort or exchange, or on a comparative scale – which reflects the desire to obtain or retain an item, service or ideal. Cost is the price paid or to be paid. It can be divided into elements and, to some extent, functions. Park (1999, 50) defines cost as “an expenditure of money, time, labor, etc., to obtain a requirement.” Worth is usually defined as the lowest cost to perform the required function, or the cost of the lowest-cost functional equivalent. The most typical definition for value, together with the definition presented in chapter 3.1 (see formula 6; both of these are used later on in this study), is perhaps (16):
WorthValue =Cost
(16)
where:
Value = The value of some object, product, service or process.
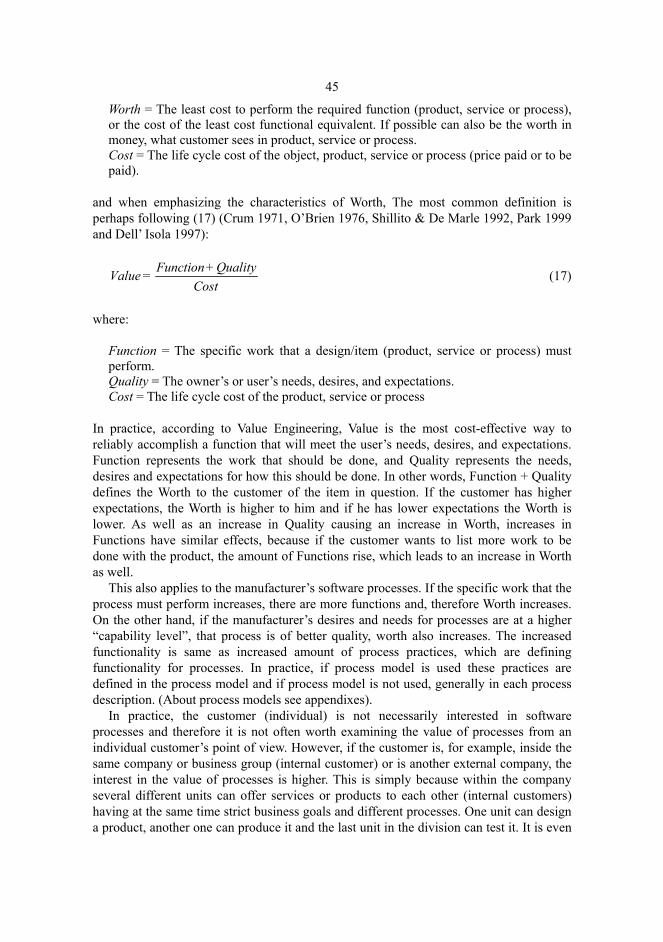
45
Worth = The least cost to perform the required function (product, service or process), or the cost of the least cost functional equivalent. If possible can also be the worth in money, what customer sees in product, service or process. Cost = The life cycle cost of the object, product, service or process (price paid or to be paid).
and when emphasizing the characteristics of Worth, The most common definition is perhaps following (17) (Crum 1971, O’Brien 1976, Shillito & De Marle 1992, Park 1999 and Dell’ Isola 1997):
Function+ QualityValue =Cost
(17)
where:
Function = The specific work that a design/item (product, service or process) must perform. Quality = The owner’s or user’s needs, desires, and expectations. Cost = The life cycle cost of the product, service or process
In practice, according to Value Engineering, Value is the most cost-effective way to reliably accomplish a function that will meet the user’s needs, desires, and expectations. Function represents the work that should be done, and Quality represents the needs, desires and expectations for how this should be done. In other words, Function + Quality defines the Worth to the customer of the item in question. If the customer has higher expectations, the Worth is higher to him and if he has lower expectations the Worth is lower. As well as an increase in Quality causing an increase in Worth, increases in Functions have similar effects, because if the customer wants to list more work to be done with the product, the amount of Functions rise, which leads to an increase in Worth as well.
This also applies to the manufacturer’s software processes. If the specific work that the process must perform increases, there are more functions and, therefore Worth increases. On the other hand, if the manufacturer’s desires and needs for processes are at a higher “capability level”, that process is of better quality, worth also increases. The increased functionality is same as increased amount of process practices, which are defining functionality for processes. In practice, if process model is used these practices are defined in the process model and if process model is not used, generally in each process description. (About process models see appendixes).
In practice, the customer (individual) is not necessarily interested in software processes and therefore it is not often worth examining the value of processes from an individual customer’s point of view. However, if the customer is, for example, inside the same company or business group (internal customer) or is another external company, the interest in the value of processes is higher. This is simply because within the company several different units can offer services or products to each other (internal customers) having at the same time strict business goals and different processes. One unit can design a product, another one can produce it and the last unit in the division can test it. It is even

46
possible that a unit from another division may buy this product for use as a component in its own product. It is also possible that the customer (external company) may be buying for example, testing services and therefore has a strong interest in the capability and value of the vendor’s testing process. One example of customers demanding a certain capability level and low costs from a vendor’s processes are public sector customers in the USA (Saiedian & Kuzara 1995).
In general, a product is often seen as an output of the use of processes. Therefore, it is possible to claim that it is not enough merely to assess processes; products should be assessed as well. This means that value should be examined from both points of view – especially from the product point of view, because this viewpoint is interesting to both the customer and the manufacturer.
In conclusion, it can be seen that value has a close relationship with cost. This is in-evitable, because if more functions are expected to be performed with a single process, and expectations do not become lower, the costs of running the process will be higher. The same logic applies to software products as well. If it is expected that a software process should perform more work, the product costs become higher. If the expectations for functions – how the product should perform – become stricter, again costs will rise.
However, there is one significant difference between assessing processes and assessing products. This is due to the fact that customers tend to have clearer opinions about product worth than about process worth, because they buy products more often than “processes” or process services. However, there seem to be situations where a customer (internal or external) is acting as a buyer of “processes” as well. When this happens the calculation of worth can happen using real worth as defined by the customer (using “wants and needs”), and when it does not happen, the assessed company should use the least cost as customer worth. This is simply because, finally, the customer is always interested in getting the process service as cheaply as possible, and least cost perhaps represents this customer point of view best. However, if worth is defined using least cost, the criticism might be made that the calculated value index is therefore closer to cost index than value index. This is perhaps partially true, but always when calculating the value index, the company should consider customer interest when defining worth, which does not happen if the company defines the “pure least cost” only from its own point of view.
In both products and processes, the value should also be calculated using the same life cycle, the same period of time. For a product it is easier to see the life cycle, which means the entire time that the product is defined, designed, manufactured and used by the customer. Product worth is calculated over the time the customer is using it and the product costs over the time the vendor has costs due to it. However, if it is not possible to calculate worth using customer opinions, the company should use least cost, defined using customer needs for functionality and needed quality level.
For processes, the concept of life cycle is more complex. What is the life cycle of a process? How long the process is used? Naturally, small updates in a process should not mean that the process is completely new and that the life cycle has changed, but if the tools used in the process have changed and the personnel do not know how to use the new defined process, the life cycle has clearly changed. In practice, the assessed company has to define the life cycle for a process based on these assumptions, so that worth and cost can be defined for a process and value can be calculated.

47
3.2 Value Engineering and improvement
Value Engineering has been defined in many ways. The literature has used terms like Functional Analysis (FA), Value Analysis (VA), Value Engineering (VE) and Value Man-agement (VM), depending on which aspects of this phenomenon are emphasized and from which period in time the article or writing originates. For example, Lawrence Miles (1972) has described Value Analysis as “a disciplined action system, attuned to one specific need: accomplishing the functions that the customer needs and wants”.
In addition, Crum (1971, 10) has called Value Analysis (in the broadest sense): “a disciplined procedure directed towards the achievement of necessary functions for minimum cost, without detriment to quality, reliability, performance and delivery. It also means the application of VA techniques to existing products.”
The roots of using the term Value Engineering are in the year 1954, when the Navy’s Bureau of Ships became the first Department of Defense organization to set up a formal value analysis program, and Lawrence Miles was instrumental in the development of that program. This program was called: “Value Engineering”, to reflect the engineering emphasis of the Bureau of Ships (O’ Brien 1976, 1).
Furthermore, Kelly and Male (1993, 3) have emphasized the managerial aspect of phenomenon. They have seen: “Value Management as a service in which the sponsor of a project, the client, transmits a clear statement of the value requirements of that project to the project designers.” They have also given a definition for Value Management: “Value Management is a service, which maximizes the functional value of a project by managing its development from concept to completion and commissioning through the audit (examination) of all decisions against a value system determined by the client.” (For more on VM see Brown 1992, 10-16)
For Value Engineering purposes Burt (1975) has defined the maximum value: “as least cost for a required level of quality, highest level of quality for a given cost, or as an optimum compromise between the two.” Furthermore he has defined Value Management as: “a process to obtain the maximum value, on a scale determined by the client. A number of techniques are identified as being useful in this enterprise but none are compulsory.”
3.2.1 Value Engineering
VE has a fifty-year history (for more on its history, see Brown 1992, 1-5). It was developed as a specific technique after World War II. The development work was carried out under the direction of the General Electric Company’s vice president of purchasing, Mr. Harry Erlicher, who observed that some of the substitute materials and designs utilized as a necessity because of wartime shortages offered superior performance at lower cost. As a result he directed that an in-house effort be undertaken to improve product efficiency by intentionally developing substitute materials and methods to replace the function of more costly components.
After these observations the task of development was given to Lawrence Miles, a staff engineer with the General Electric Company in 1947. Miles researched the techniques

48
and methodology available and utilized a number of proven approaches in combination with his own procedural approach to analysis for value. The value analysis technique was accepted as a G.E. standard, and gradually other companies and governmental organiza-tions adopted the new approach as a means of reducing costs (O’ Brien 1976, 1).
In 1954, the Navy’s Bureau of Ships became the first Department of Defense organiza-tion to set up a formal value analysis program, and Lawrence Miles was instrumental in the development of that program. This program was called “Value Engineering”, to re-flect the engineering emphasis of the Bureau of Ships (O’ Brien 1976, 1).
Since those times, Value Engineering has become much more popular in many ways. Several books have been published on the subject (see for example O’Brien 1976 or Dell’ Isola 1997). Value Engineering has also been applied in several different situations and branches, and these implementations have been documented in different books (see for example Dell’ Isola 1997). In almost every case Value Engineering has:
− Reduced project construction costs − Decreased operation and maintenance costs − Reduced paperwork − Simplified procedures − Improved project schedules − Reduced waste − Increased procurement efficiency − Used resources more effectively − Developed innovative solutions − Influenced state laws in the U.S.A.
Typically, nowadays, Value Engineering is defined as: a professionally applied, function-oriented, systematic team approach, used to analyze and improve value in a product, facility design, system or service – a methodology for solving problems and/or reducing costs while improving performance/quality requirements. According to Mudge (1971, 4) it can be applied to “all business areas; i.e., hardware and software, systems and procedures, processes and services – indeed, to anything that affects a product’s total cost. Paulson (1995, 281) has seen it “applicable to hardware, software; development, production manufacturing; specifications, standards, contract requirements, and other acquisition documentation.” More recently Fry (1995), Wixson (1997), Ojala (2001) and Smith et al. (2002) have emphasized the possibilities to use it as well in process and sub process improvement.
Through the decades it has been typical for Value Engineering to collect information of customer worth and production costs to calculate value and finally, to engineer it. For these purposes Value Engineering has formulated a function, which has commonly been called as: an activity or action for which an examined item or topic is specifically fitted or used, or for which something exists. A basic function has been defined as the per-formance characteristics, which must be attained by the technical solution chosen. Secon-dary functions have been the performance characteristics of the technical solution chosen, other than the required basic function. In Value Engineering:
− Value is usually measured in currency, effort or exchange or on a comparative scale, and reflects the desire to obtain or retain an item, service or ideal.

49
− Cost is the price paid or to be paid. It can be divided into elements and, to some extent, functions.
− Worth is defined as the lowest cost to perform the required function or the cost of the lowest cost functional equivalent or the worth of money what sees in function.
By enhancing value characteristics, Value Engineering has increased customer satisfac-tion and added value to investments. Kelly and Male (1993, 3) have also realized that the client’s value system can be used to audit or assess:
− The client’s use of a facility in relation to their corporate strategy, − The project brief, − The emerging design, − The production method.
Since VE has a rather long history it has been improved, combined and used together with several other methods. Syverson (1992, 86) has stated that Quality Function Deployment (QFD) is a problem/opportunity identification; VA is a problem/opportunity solving method and therefore, they compliment each other. In his opinion QFD provides a method to convert customer expectations into quantified technical design characteristics and development of the product plan. Furthermore, it assures that you are developing a “right product” and VE assures that you are doing it the “best way.”
Noda & Tanaka (1997) see VE as: “an essential technique to Target Cost Management (TCM).” They also state that TCM will not be successful without VE because it is very difficult to achieve the tight target cost within a limited period of time by R&D staff efforts alone. They continue that there are two kinds of VE procedures: one is “schedule type” and the other one is “problem-solution type.” In the former type of procedure, VE is regarded as a step in the development and design phase and is implemented as an important step in development and design activities. “Problem-solution type” VE is designed to solve unexpected issues such as functional problems or other issues that will interrupt achievement of the target cost. Furthermore, Tanaka & Noda (1994) state that VE’s role in TCM is most important and essential for cost and value improvement.
In reference to VE and cost accounting, Smith et al. (2002) have proposed a managerial framework containing an Activity-Based Costing, Target Costing and VE combination to achieve superior improvement in supply chain processes’ performance.
Al-Yousefi & Hayden (1995) have combined VE with TQM. They state that: “…as our firms continue their VE/TQM journey, the notion of re-inventing or re-engineering is surfacing. The mind-set for re-engineering moves back from solving the apparent problem, and takes a “what if …” approach to major portions of the process. This immediate moving to problem-solving is referred to by many as “the soft side” of TQM.” They continue that at times they hear firms rejecting the soft side of TQM, wanting to get to the “hard part”, process improvement using VE as well.
According to Nielsen & Pries-Heje (2002) there are model-based and problem-based assessments. Model-based assessment focuses on best practices and processes defined in process models, and problem-based assessment focuses on what software practitioners and their managers see as problems in the software process. Using this classification, VE is perhaps closer to a problem-oriented assessment, since it does not define specific process practices in a process model, but defines function analysis tools to be used when

50
defining process areas instead of defined practices. From this point of view it seems to be combinable with methods based on specific practices (like BOOTSTRAP or CMMI) if we assume that functions are considered to be processes or their practices. This point of view is also supported by Noda & Tanaka (1997), who claim that VE has a problem-solution side as well.
In conclusion, VE has been influenced by several other methods, and it has also been used together with several of them. Mostly these methods have been related to quality improvement and cost management. From a quality point of view the combination of VE and model-based capability-maturity methods seems to have same basis in respecting the importance of quality. From a cost management point of view VE perhaps gives new characteristics to model-based capability-maturity methods, since it is able to calculate and manage costs in processes and their practices.
3.2.2 Two possible ways to increase value in software companies
During recent years, several software companies have noticed that competition has in-creased significantly. Therefore, they have sought to create flexible organizational structures in order to improve their performance and to enable them to respond to the rapidly increasing competition. However, increasing value by increasing performance is not always possible if customers’ “needs and wants” are not willing to pay for it. This also applies to software processes, because it is clearly more expensive to achieve higher maturity levels than lower ones, and if the customer is not willing to pay for them, value will not improve. As well if the customer is not willing to pay more for increased performance in a product, product value will not increase either.
Several companies are also in the process of cutting their costs in order to increase profitability and value. However, when cutting costs they should have a clear understanding of which of their activities’ costs are the unnecessary ones, because if the company cuts costs which are the basis for profitable business, it creates problems for itself. In other words, there are always costs, which produce an increase in the product’s value and are essential in achieving the specified functions. These costs should not be cut.
There are various causes of unnecessary costs for software companies and their software processes. The main causes or reasons for unnecessary costs can be classified into four groups: management inefficiency, inability to apply value considerations, human weaknesses, and competitive pressures (Crum 1971, 18-30).
Management inefficiency can be caused by a lack of training, pressure, planning, or a lack of value objectives. Inability to apply value considerations is caused by a lack of in-formation, communication and ideas. Human weaknesses are usually caused by honest wrong beliefs, habits and attitudes, and by pride. Competitive pressures and tight delivery dates cause a lack of adequate time and often costs (Crum 1971, 18-30).
Dell’Isola (1997, xx) has listed causes of unnecessary costs as follows: lack of in-formation, lack of ideas, temporary circumstances, honest wrong beliefs, habits and attitudes, changes in owner requirements, lack of communication and coordination, and outdated standards and specifications.

51
Whatever the reasons are for unnecessary costs in products or processes, they are best understood if their causes are established, interpreted and analyzed. The establishment of these costs is not easy, because they are many and varied. Using a systematic method like VE, however, helps to handle this complex situation, because VE can be understood to be a procedure to eliminate the unnecessary costs from processes, sub-processes, products or services (Ojala 2001. See also Wixson 1997 and Fry 1995).
3.3 Capability
SEI (1994, 9) has defined a software process in CMM model as: “a set of activities, methods, practices, and transformations that people employ to develop and maintain software and the associated products (e.g., project plans, design documents, code, test cases, and user manuals). As an organization matures, the software process becomes better defined and more consistently implemented throughout the organization. CMM focuses on process as a way to empower the people doing the work.” Furthermore, “software process capability” describes the range of expected results that can be achieved by following a software process. The software process capability of an organization provides one means of predicting the most likely outcomes to be expected from the next software project the organization undertakes (SEI 1994, 9).
In the BOOTSTRAP model, ‘software process’ has been defined as a “process performed in a software production unit (company or single department) that produces the software.” (Kuvaja & Bicego 1994, 118) Furthermore, in the BOOTSTRAP model the software process capability is understood as “the ability of each process to achieve its goals in the context of the assessed organization.” (Kuvaja 1999, 13)
According to SEI (1994, 9-10), in CMM model software process maturity is: “the extent to which a specific process is explicitly defined, managed, measured, controlled, and effective. It implies a potential for growth in capability and indicates both the richness of an organization’s software process and the consistency with which it is applied in projects throughout the organization. It implies that software process capability must be grown. Improvement requires strong management support and a consistent long-term focus. As a software organization matures, it needs an infrastructure and culture to support its methods, practices, and procedures …”
In the BOOTSTRAP model the purpose has been to keep maturity and maturity levels easily understood and compatible with CMM, and therefore, according to Kuvaja & Bicego (1994, 122-123), the same maturity levels were included in the BOOTSTRAP algorithm. In practice, in the BOOTSTRAP model, maturity can be considered as “the extent to which a specific process is performed, managed, established, predicted and optimized.” (Kuvaja 1999, 14) Even in the BOOTSTRAP model the maturity level definition is carried out by using an identical algorithm to the CMM; maturity levels are counted separately for each process and subprocess area of the software process under assessment (Kuvaja & Bicego 1994, 118). (See also appendixes.)
For the purposes of this research, the conceptual relationship between value and capability needs to be discussed, since enhancement is based on the use of both

52
dimensions. What is capability from the value point of view, and what is value from the capability point of view?
When combining the definitions of Shillito & De Marle (1992) and SEI (1994) we could define the relationship between value and capability one way. This definition is based on the idea that we see value as more than just a property of matter. We see it as a force that governs our behavior. The same analogy in relation to capability and maturity would mean that the force exists in both of them as well. Since capability provides a means for the prediction of the outcomes to be expected from the next software project the organization undertakes, and includes several levels as well, there exists a force which drives our activities to achieve these levels. The force also exists when we are trying to achieve the goals of each process. The higher levels are more desirable, but since they are not as easily achieved as lower ones and the costs of achieving them are greater, they are not necessarily applied in all companies.
Hence it is possible to see the “driving” force of capability we can state that capability itself has a value. This value of capability (or process) can be presented as follows (18):
n aVc =c⋅ (18)
where:
Vc = the value of the process capability (or process) n = the need for a capability (or process) a = the ability of a capability (or process) to satisfy this need c = the cost of the capability (or process).
Furthermore, using the analogy of importance we can state that individuals and com-panies rate the importance of a capability (or process) in terms of its ability to satisfy their needs. The importance formula (19) used will be the same as earlier (Shillito & De Marle, 1992):
I = n · a (19)
where:
I = importance a = ability to satisfy need n = need.
Furthermore, we can continue by stating that it is often relevant to measure the customer’s perception of the importance of the capability (or process), using the equation equation presented by Dell’ Isola (1997, xix), with the addition of the concept “process capability”(20):

53
IpcVc =C
(20)
where:
Vc = the value of the process capability (or process) Ipc = the importance of the process capability (or process) C = the cost of the process capability (or process).
Using Shillito & De Marle’s (1992) “relative importance”, we could represent the value of a process capability (or process) using the formula (21):
IrpcVc =Cr
(21)
where:
Vc = the value of the process capability (or process) Irpc = the relative (in percentage) importance of the process capability (or process) Cr = the relative (in percentage) cost of the process capability (or process)
Since the value literature most often uses concepts such as value, worth and cost, we could represent the value of process capability (or process) as a sum containing each individual worth of process practices divided by the amount of practices as follows (22):
( 1 2 )worth worth worth nVcn
+ + +=
… (22)
where:
Vc = the value of the process capability (or process)
Since the worth of all process capabilities is often considered as an organizational-level term, it is possible to say that in practice, in this formula, Vc = Vm (value of organiza-tional maturity).
3.4 Model-based software process improvement
According to Curtis et al. (1992, 75), “traditionally, the modeling of information systems has focused on analyzing data flows and transformations. This modeling accounted only for the organization’s data and that portion of its processes that interacted with data. Newer uses of information technology extend computer use beyond transaction

54
processing into communication and coordination. Successfully integrating these systems into the enterprise often requires modeling even the manual organizational processes into which these systems intervene.” Furthermore, Curtis et al. (1992, 75) list the following three such applications:
− Business process re-engineering – the redesign of an organization’s business processes to make them more efficient.
− Coordination technology – an aid to managing dependencies among the agents within a business process; it also provides automated support for the most routinized component processes.
− Process-driven software development environments – an automated system for integrating the work of software-related management and staff; it provides embedded support for an orderly and defined software development process.
In practice, research on software process modeling supports a wide range of objectives (Kellner 1989 & Riddle 1989). Curtis et al. (1992) list five basic uses for process models, ranging from understanding aids to automated execution support:
− Facilitate human understanding and communication – requires that a group be able to share a common representational format
− Support process improvement – requires a basis for defining and analyzing processes − Support process management – requires a defined process against which actual project
behaviors can be compared − Automate process guidance – requires automated tools for manipulating process
descriptions − Automate execution support – requires a computational basis for controlling behavior
within an automated environment.
Typically, in process modeling, “a model is an abstract representation of reality that excludes much of the world’s infinite detail. The purpose of a model is to reduce the complexity of understanding or interacting with a phenomenon by eliminating the detail that does not influence its relevant behavior. Therefore, a model reveals what its creator believes is important in understanding or predicting the phenomena modeled.” (Curtis et al. 1992, 76)
Humphrey & Feiler (1992) have presented a foundational lexicon on which to build a conceptual framework for software process modeling and definition. They define a process as “set of partially ordered steps intended to reach a goal.” Any component of a process is a “process element”. A process step is “an atomic action of a process that has externally visible substructure.” Determining that a process element is a process step depends in part on whether any further decomposition of the element’s structure is needed to support the objectives of the process model.
According to Humprey & Feiler (1992) and Osterweil (1987), a process model is an abstract description of an actual or proposed process that represents selected process elements that are considered important to the purpose of the model and can be enacted by a human or machine. The levels of abstraction within the domain of software development range from the detailed process steps executed entirely on a machine, to the larger-grained human processes involved in executing a lifecycle phase, to the abstract stages of the lifecycle chosen for the product. Defined or not, the collection of all the

55
process steps executed to develop a software system constitutes a software development process. These processes, however, do not constitute a software process model until they are represented in some medium. A process model to be performed by a human will be called a process script, while one to be enacted by a machine will be called a process program.
Model-based software process improvement involves the use of a model to guide the improvement of an organization’s processes. Historically, process improvement grew out of the quality management work of Deming (1986), Crosby (1979) and Juran (1988), and it is still aimed at increasing the capability of work processes. Essentially, process capability is the inherent ability of a process to produce planned results. As the capability of the process increases, it becomes predictable and measurable, and the most significant causes of poor quality and productivity are controlled and eliminated. By steadily improving its process capability, the organization matures. Maturity improvement requires strong management support and a consistent long-term focus. In addition, it necessitates fundamental changes in the way managers do their jobs. (Ahern et al. 2001. For more on appendices.)
One means of achieving this focus has been the use of capability-maturity models, such as CMM, CMMI or BOOTSTRAP. All these models provide a common set of process requirements that capture best practices and practical knowledge in a format that can be used to guide priorities. By using a model, organizations can modify or create processes using practices that have been proven to increase process capability. Organizations may also employ models to assess process capability for two purposes: to establish a baseline for improvement and to measure progress as improvement activities proceed (Ahern et al. 2001).
Generally, model-based improvement begins with management commitment and assessment. The findings of this assessment, in turn, feed action plans. When these plans have been completed, further assessments are performed and the cycle continues. The goal is for the organization to mature so that it continuously monitors and improves its processes, consistently produces high-quality products, is agile within its marketplace, and adjusts quickly to customer needs (Ahern et al. 2001).
Process modeling work is young, and the span of the research agenda is still undergoing formulation. According to Nielsen & Pries-Heje (2002) “the use of a CMM or similar models as a basis for your improvement is an expression of faith in the maturity model paradigm rather than a strictly rational act.” Therefore, when using or combining the aforementioned models to other models it is important to understand the models’ underlying assumptions.
Typically, process maturity models focus solely on one factor in a company – processes – and neglect other aspects. They assume that good processes alone will lead to the goal of better software development. Furthermore, they assume that what is best for one kind of company is also good for another kind, by assuming that you can generalize best practices across the software industry and that the more best practices in your company, the better your maturity (Nielsen & Pries-Heje, 2002). Typically, these models are also based on two underlying philosophies, which influence their assumptions as well. The first of these philosophies is Total Quality Management (TQM), which is a “management philosophy embracing all activities through which the needs and expectations are satisfied in the most efficient and cost effective way by maximizing the

56
potential of all employees in a continuing drive for improvement” (British Standard 1991). The second philosophy is step-by-step, one-small-step-at-a-time learning, such as that practiced in the Japanese Kaizen strategy (Colenso 2000).
When combining maturity models with VE, perhaps one of the biggest underlying differences is that maturity models define the content of best practices, whereas VE does not do this. It uses function analysis to define the content for examined functions. If we assume that a function can be, for example, a best practice, these models can perhaps be integrated, but the limitations of having model-defined best practices are in these circumstances valid for the enhanced model, as well. However, if we do not base our integration on a combination of these models at the practical level, we lose the idea of assessing value and capability for the same item.
Since maturity models have been criticized from the point of view that it is not profitable to climb to higher capability levels by fulfilling more and more process practices, it seems logical to use VE and evaluate the value of practices as well. This dependency is perhaps most logical if the function is considered to be a process practice. However, if information needs are not so demanding, there do not seem to be any obstacles to considering a function as a process or process cluster as well, or even understanding functions to be processes and secondary functions to be practices.
Since VE can be applied to systems and procedures, processes and services or products (Fry (1995), Mudge (1971, 4), Paulson (1995) and Wixson (1997)), and capability models only to processes, it seems to be reasonable to investigate the possibilities of using VE for product improvement as well. However, one of the underlying assumptions of capability models was to achieve better product quality using more capable processes.
The underlying philosophies in both models seem to be rather similar. Michaels & Younker (1994) have even shown that “there is a total commonality among…Concurrent Engineering (CE), Quality Function Deployment (QFD), Total Quality Management (TQM) and Value Engineering (VE).” Since VE seems also to respect step-by-step, one-small-step-at-the-time learning (see Chapter 4), such as practiced in the Japanese Kaizen strategy, the philosophical foundations seem to be similar. In addition, however, VE perhaps enhances the philosophical basis by bringing more of a customer and business point of view to the enhanced model.

4 The Value Engineering process
Nowadays, VE methodology is widely known and accepted in the industry. It is an organ-ized process with a history of improving value and quality. The VE process identifies ar-eas in which unnecessary costs can be removed, while assuring that quality, reliability, capability, and other critical factors will meet or exceed the customer’s expectations.
All published VE processes usually begin by describing the research topic in functions, and analyzing these functions. Creativity is necessary in order to generate new ideas for the possible replacement of some of the functions used. Evaluation addresses these new ideas, and development forms new function structures by replacing old functions with new ones. If the quality, cost levels and customer requirements defined and needed are still fulfilled, and unnecessary costs have been cut, value has been increased.
In practice, the improvements developed are the result of recommendations made by a multidisciplinary team representing all the parties involved in the subject studied, and led by a facilitator. Development ideas are systematic efforts to improve the value and optimize the life cycle cost of a function or facility. It is vitally important that the VE team has technical as well as cost-accounting knowledge. A wide range of companies and establishments have used VE effectively, to achieve their continuous goal of improvement in the decision-making process.
4.1 Different definitions
Miles (1972) has stated that: “Value Analysis (synonymous to Value Engineering) is a system, a complete set of techniques, properly arranged, for the sole purpose of effi-ciently identifying unnecessary costs before, during or after the fact. Some of the tech-niques are familiar, some modified, some new … It is a disciplined action system …”
Miles has defined the Value Engineering process using seven phases (as described in Kelly & Male 1993, 10):

58
− Phase 1: Orientation
What is to be accomplished, what does the client need and/or want, which characteristics are desirable?
− Phase 2: Information
Secure all costs, quantities, drawings, specifications, manufacturing methods, samples and prototypes. Understand the manufacturing process. Determine the amount of effort that should reasonably be expended on the study.
− Phase 3: Speculation
Generate every possible solution to the identified problem using brainstorming sessions. Record all suggestions.
− Phase 4: Analysis
Estimate the dollar (or other currency) value of each idea, and rank them in order of highest gain and highest likely acceptability. Investigate the best ideas thoroughly.
− Phase 5: Program planning
Establish the manufacturing program by identifying operations, design and production personnel, supplies, etc. Promote an ethos of creativity in all involved parties.
− Phase 6: Program execution
Pursue the program, evaluating and appraising further suggestions from suppliers, etc.
− Phase 7: Status summary and conclusion
If the VE team is in a position to take executive decisions then act on new ideas; if not, make recommendations to those who have the authority to make the decision.
In the literature these phases have also been presented in other ways. Park (1999, 202-204) has presented somewhat different phases in a number of organizations and countries as follows:
DEPARTMENT OF DEFENSE
1. Orientation phase 2. Information phase 3. Speculation phase 4. Analysis phase 5. Development phase 6. Presentation and Follow-up phase

59
FALLON
1. Preparation phase 2. Information phase 3. Analytic phase 4. Creative phase 5. Evaluation phase 6. Presentation phase 7. Implementation phase
MUDGE
1. General phase 2. Information phase 3. Function phase 4. Creation phase 5. Evaluation phase 6. Investigation phase 7. Recommendation phase
VALUE ANALYSIS INC.
1. Information phase 2. Speculation phase 3. Analytical phase 4. Planning phase 5. Execution phase 6. Recommendation phase
GERMANY, VDI SPEC. VA/E 69-910
1. Preparatory measures 2. Determine existing conditions: defining functions and function costs 3. Verifying existing conditions 4. Generating solutions 5. Verifying solutions 6. Proposal and implementation
FRANCE, Specification NF x 50 152 (August 1990)
1. Orientation 2. Data collection 3. Function and cost analysis 4. Gathering and reviewing solutions 5. Building on ideas 6. Presenting recommendations 7. Implementing recommendations

60
JAPAN
1. Information collection stage 2. Function evaluation stage 3. Creation stage 4. Schematic evaluation stage 5. Detailed evaluation stage 6. Proposal preparation stage 7. Proposal follow-up stage.
Even though there are several definitions in the literature for the VE process, they all have similarities. Generally, they state that VE collects and analyzes value-related information, to create new ideas using the analyzed results and to evaluate and further develop them into a meaningful package, with the reduction of costs or the increase of worth and improvement of value as ultimate goals.
Despite the fact that the VE process still seems to have similarities with the “original” process of Miles, significant changes have taken place in the technical tools used in the different phases. During recent years the key techniques presented by Miles have been replaced by more practical and scientifically approvable methods, including, for example, life cycle costing. (For more on this development, see Chapter 7.) VE has been combined with several other methods, such as TQM and ABC. Most likely this direction has strengthened VE’s interpretation as an “Engineering” method, rather than an “Analyzing” method (VA), as well.
4.2 The Value Engineering process in this dissertation
This study categorizes VE phases in three main classes: pre-study (tasks carried out before the value study), value study, and post-study. These phases are considered appropriate since they constitute independent areas of VE, emphasizing the preparation aspect, the independent study aspect and the post-study aspect performed after the other phases. Figure 3 shows in more detail the phases used and defined in this chapter for the purposes of this research. The structure mainly follows the lines which Lawrence Miles outlined at General Electric and later refined for the purposes of the Department of Defense. However, since the significance of function analysis as a separate phase has been presented in nearly all recent VE process descriptions, it is presented as a separate phase. This is also seen as justified, because it provides a clear structural way to analyze the value of different functions which are later defined more precisely to be processes, practices and products or their components. Finally, the flexibility of function analysis is considered necessary in order to combine capability and value assessment together, as discussed later in this study. Furthermore, the creativity phase is considered as a separate phase since it questions the earlier VE phases and, using this information, produces alternatives for the subsequent ones. The inclusion of this process in its own phase, rather than combined with other phases, highlights the importance of such comprehensive investigative work.

61
The structure used to explain the content of each VE phase represents the author’s own experience of defining software processes and therefore other similar structures may also exist. All the phases of the VE process are explained using the following structure, which is typical in many software process definitions:
1. Purpose of the phase − Describes the purpose of the phase.
2. Scope − Defines the scope of the phase.
3. Entry criteria − Defines criteria for entering this phase.
4. Exit criteria − Defines criteria for exiting this phase.
5. Activities − Defines the actions for this phase.
6. Required know-how and resources − Describes organizational requirements for the phase.
7. Work products − Defines the work products produced in this phase.
8. Methods and techniques − Outlines possible methods and techniques that support this phase.
9. Templates − Defines templates that can be used in the phase.

62
Fig. 3. VE process phases.
PRE - STUDY
Orientation Collect user / Customer requirements Complete data file Det ermine evaluation factors Scope the study Build data models Determine team composition
VALUE STUDY Information phase Complete data package Modify scope Function Analysis phase Identify functions Classify functions Develop function models Establish function worth Cost functions Establish value indexSelect function for study Creativity phase Create quantity of ideas by function Evaluation phase Rank and rate alternative ideas Select ideas for development Development phase Conduct benefit analysis Complete technical data package Create implementation plan Prepare final proposals
Presentation phase
Present oral reportPrepare written report
POST STUDY Complete changes Implement changes Monitor status
63
4.2.1 Pre-study
Pre-study activities should always be considered carefully before starting the VE process. The success of a VE study depends largely on preparation and coordination. Mudge (1971, 30-31) describes this as follows: “use good human relations, inspire teamwork, work on specifics, overcome roadblocks and apply good business judgment”.
4.2.1.1 Orientation
The purpose of the orientation phase is to collect and define user/customer requirements, and to gather a complete data file on the project, Software Producing Unit (SPU), process and/or product (depending on whether the study is to examine a process or a product). The evaluation factors and the make-up of the team are determined, and appropriate models are built. The scope of the orientation is specified so that there is a general understanding of which SPU/project and process/product/component is to be studied (see Dell’ Isola 1997, 65-66 and SAVE 1998, 4-5). This phase does not have specific entry criteria. It has seven exit criteria:
− Customer requirements are known − Customer priorities are known − The study’s structure has been decided (process and/or product structure) − The evaluation criteria are known − The models and techniques to be used in the study have been decided − The VE study schedule is complete − The VE study team has been nominated
The orientation phase includes several activities. It precedes the value study, and so it has been omitted as the first phase of planning in many considerations. To orient is to “place or arrange relative to an external reference frame…” (O’Brien 1976, 29). In a properly established Value Analysis situation, orientation includes:
− Collecting user/customer requirements − Complete data file − Determine evaluation factors − Define the scope for the study − Build data models and − Determine team composition.
In an organization which has been conducting Value Analysis, policies will have been established which assist in these determinations.
User/customer requirements are compiled by an in-house focus group and/or by using external market surveys and meetings. The objectives of this step are to:
− Determine the prime buying importance for customer and influence to manufacturer; − Define and rate the importance of certain features and characteristics of the product or
project;

64
− Determine and rate the seriousness of user-perceived faults in and complaints with the product or project;
− Compare the product or project with the competition or through direct comparison with similar products or projects.
The results of collecting user/customer attitudes will be analyzed and developed further in the information phase.
A data file is compiled from primary and secondary sources of information. The primary sources of information include the company’s marketing, accounting, maintenance, field service and designing staff. Secondary information is collected from books, standards, reports, journals and suppliers.
The VE team determines the criteria for the evaluation of new ideas. This step influ-ences all recommendations and decisions and it should therefore be discussed with the customer’s management. The VE team also determines the scope for the study. The study’s scope is considered together with all the data collected and it includes the starting point and finishing point of the study.
Based on the scope of the study, the VE team compiles the models and techniques to be used in the forthcoming VE process. The orientation phase ends when the VE team leader presents the schedule for the value study, and the personnel list to the VE team. He also assigns data-collection tasks to the VE team members.
Considering the required know-how and resource needs, Kelly and Male (1993, 11) suggest that orientation should take place in a meeting chaired by the value engineer for the project and attended by the design team and those client representatives who have an interest in or some ownership of the problem being addressed.
The orientation phase produces the following work products:
− The customer requirement list (complete) − The customer priority list (complete) − The study’s structure has been decided and described (process and/or product struc-
ture) − The evaluation criteria list for analyzing improvement proposals has been drawn up − The models and techniques to be used in study have been decided and defined − The VE study schedule is complete − The VE study team has been nominated
In this phase the most-used methods and techniques are related to customer service and collecting customer information. For example, if the project is in the planning phase, nor-mal selling meetings are good for the purposes of defining requirements and worth from the customer’s point of view, as well as for creating the structure for the VE study. Templates used in this phase include lists of the following items: requirements, evaluation criteria, models and techniques, and team members.
65
4.2.2 Value study
A key point in organizing the VE effort is the use of the job plan. The job plan or value study includes six phases: an information phase, a function analysis phase, a creativity phase, an evaluation phase, a development phase and a presentation phase.
4.2.2.1 The information phase
The information phase is a fact-finding phase. The purpose is to accumulate all the fac-tual information available regarding the proposed area of study, to complete the data package and modify the scope of the study. In the information phase, the scope of the VE study is defined so that there is a clear understanding of which SPU/project and process/product /component is to be studied.
This phase is implemented after the completion of the orientation phase. Entry criteria include the following:
− Customer requirements are known − Customer priorities are known − The study structure (scope) has been decided (process and/or product structure) − Evaluation criteria are known − The models and techniques to be used in the study have been decided − The VE study schedule is complete − The VE study team has been nominated
The exit criteria are:
− Complete data package and − Modified scope.
The main activities in the information phase are checking and completing the data package, and modifying the scope of the study. If the information phase is the initial one, this may require the collection of information on the entire project so that the selection of the most opportune area for value analysis can be made. If the area has already been selected, the collection of facts can focus upon that one phase of the project or process in this sector of the Value Analysis study. Mudge (1971, 31) describes this phase as the most difficult and most time-consuming to carry out. In practice, the completed data package including, for example, budgetary limits and modified information about allocating costs to the study can also lead to minor modifications of the study’s scope. Kelly & Male (1993, 11) have emphasized that the objective of the information gathering stage is to identify the functions of the whole or parts of the project or process, as seen by the client organization, in clear, unambiguous terms.
In practice, the information phase is based on completing the value study data pack-age started in the pre-study work. If the VE team has found questions concerning the data research (carried out in the pre-study phase), these questions are put to the customer at this point. The VE team agrees the most important targets, such as value, cost, performance and schedule factors, which are then reviewed by the appropriate

66
management personnel. The final thing to be carried out is a review of the scope statement written in the pre-study, taking the new information into account.
The information phase is implemented using the same VE team that was nominated in the orientation phase. Therefore, the required know-how and resource needs are the same.
The information phase produces the following work products:
− Client needs and intentions list (requirements) − Client wants list (elements, which are desired but not necessarily needed) − VE project constraints list (for example, financial, technological or time constraints) − Budgetary limits for the study (budgets at the process/product/component level) − Time allocation for design and implementation (hours needed for designing and
completing each requirement)
The methods and techniques used in this phase include requirement analysis, cost calculation, budgetary, and estimation methods. Requirement analysis is necessary in order to gain a clear idea of what the customer wants and needs. This can be performed, for instance, using prioritization methods, so that requirements can be listed in order of importance. Knowledge of cost calculation methods and budgets is required so that costs can be allocated and estimated for processes, products and components using the principles already in use in the company. Templates in this phase include budgets, cost reports, estimation forms and lists of customer wants and needs.
4.2.2.2 The function analysis phase
The function analysis phase is the heart of Value Methodology. Mudge (1971, 31-32) has formulated function analysis as based on two major parts: defining a function, and evalu-ating function relationships. He emphasizes that: “within defining the functions lies the keystone of the Value Engineering systematic approach”. He continues: “the evaluation of function relationships is accomplished by taking the above technique and the in-formation and data secured in the information phase, and establishing a relationship between them.”
The purpose of the function analysis phase is to identify functions, classify functions, define function models, establish function worth, cost functions, establish the value index and select a function for study. The scope of function analysis is defined so that it produces a general picture of the study, and value indexes (Value = Worth/Cost) for the defined functions.
The entry criteria include:
− Complete data package and − Modified scope.
The exit criteria include:
− A function list (a list of the processes/practices/products/components to be examined) has been drawn up

67
− A function model (a picture showing how functions are tied to each other) has been created
− Value indexes have been assigned to functions.
The function analysis phase is the primary activity that separates Value Methodology from all other “improvement” practices. The objective of this step is to ascertain the most beneficial areas for the continuing study. While unnecessary cost removal has been the traditional target for value studies, it is important to emphasize that value studies are these days more frequently conducted in order to improve a product or service’s perform-ance, in terms of time or quality, without increasing cost. The VE team performs the fol-lowing steps:
− Identify and define functions of the product, project, or process under study using active verbs and measurable nouns
− Classify functions as basic or secondary − Expand the functions identified in step 1 (optional) − Build a function model – a Function Hierarchy/Logic or Function Analysis System
Technique (FAST) diagram − Assign cost and/or other measurement criteria to functions − Establish the worth of different functions by assigning the previously established
user/customer attitudes to the functions − Compare cost to worth of functions to establish the best opportunities for im-
provement − Assess functions for performance/schedule considerations − Select functions for continued analysis − Refine study scope (SAVE 1998, 5)
These steps are performed so that the purpose of the analysis phase can be achieved. The identifying and defining of functions is a prerequisite for all function studies. The iden-tification of functions is a keystone of VA and VE. It leads a person or the whole VE team to understand what something does, first generally, then specifically, and finally it leads to better-value products. Function analysis is concerned with locating unnecessary costs and specific requirements, and determining the value of the project selected for study.
A function makes an item or service work or sell – in other words the function is a rea-son for the customer to buy the product or service. An item, including structures and services, is a means to the end of providing a function, not the end itself. In using the function approach, the value study team constantly returns to the primary reason for the design and build cycles – the ultimate use of the item. Customers buy a product or service because it will provide a function that satisfies their needs at a cost they are willing to pay. If, as is almost always the case, if customers wish to minimize their total costs, they must look beyond price and consider other costs – operational, maintenance and usage. For successful product improvement, a “function” must be carefully defined from the as-pect of total life cycle cost, so its associated costs must be properly assigned.
In value studies, a function is always expressed by a verb and noun. This two-word de-scription has several advantages: (see Dell’ Isola 1997, 74)
1. The description pinpoints the functions and nothing else. 2. Possible alternative solutions for providing the functions are not restricted.
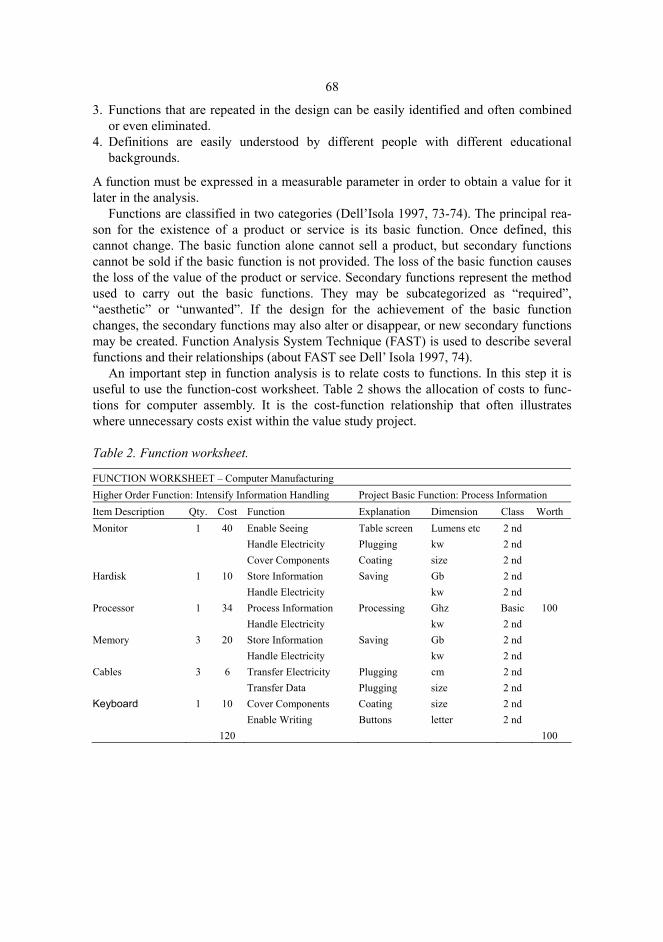
68
3. Functions that are repeated in the design can be easily identified and often combined or even eliminated.
4. Definitions are easily understood by different people with different educational backgrounds.
A function must be expressed in a measurable parameter in order to obtain a value for it later in the analysis.
Functions are classified in two categories (Dell’Isola 1997, 73-74). The principal rea-son for the existence of a product or service is its basic function. Once defined, this cannot change. The basic function alone cannot sell a product, but secondary functions cannot be sold if the basic function is not provided. The loss of the basic function causes the loss of the value of the product or service. Secondary functions represent the method used to carry out the basic functions. They may be subcategorized as “required”, “aesthetic” or “unwanted”. If the design for the achievement of the basic function changes, the secondary functions may also alter or disappear, or new secondary functions may be created. Function Analysis System Technique (FAST) is used to describe several functions and their relationships (about FAST see Dell’ Isola 1997, 74).
An important step in function analysis is to relate costs to functions. In this step it is useful to use the function-cost worksheet. Table 2 shows the allocation of costs to func-tions for computer assembly. It is the cost-function relationship that often illustrates where unnecessary costs exist within the value study project.
Table 2. Function worksheet.
FUNCTION WORKSHEET – Computer Manufacturing Higher Order Function: Intensify Information Handling Project Basic Function: Process Information Item Description Qty. Cost Function Explanation Dimension Class Worth Monitor 1 40 Enable Seeing Table screen Lumens etc 2 nd Handle Electricity Plugging kw 2 nd Cover Components Coating size 2 nd Hardisk 1 10 Store Information Saving Gb 2 nd Handle Electricity kw 2 nd Processor 1 34 Process Information Processing Ghz Basic 100 Handle Electricity kw 2 nd Memory 3 20 Store Information Saving Gb 2 nd Handle Electricity kw 2 nd Cables 3 6 Transfer Electricity Plugging cm 2 nd Transfer Data Plugging size 2 nd Keyboard 1 10 Cover Components Coating size 2 nd Enable Writing Buttons letter 2 nd 120 100
69
In assigning cost to functions (as an example):
1. List the functions within the scope of the project across the top of the form. 2. List parts, major subassemblies/sub-systems, steps of a procedure, etc. vertically on
the left-hand side of the form with their associated costs as determined in the infor-mation phase.
3. Check off which functions are affected by each item/step. 4. Determine how much cost of each item belongs to each function. 5. Add all columns vertically to determine how much cost is allocated to each function.
The function-cost relationship is used in VE to show where the opportunities for greatest value improvement on a cost basis are. Together with other criteria, such as quality and reliability, “costs” is a powerful criterion.
In the VE literature, value is usually determined as “lowest overall cost to perform a function without regard to criteria or codes” (see definitions in Chapter 4). Comparing function cost to function worth is the primary technique for helping study teams to identify areas of greatest potential value improvement. Comparing function cost worksheets to worth worksheets usually brings up comments like: “that function costs too much,” “all that time for that function,” or “there is our quality problem.” Worth can be assigned to functions using different methods. The most useful is perhaps a penalty system, which is based on the idea that any cost, in addition to the primarily used material, occurs as a penalty of processing due to the design utilized. Therefore, alternative ways to reduce or eliminate the penalties will be developed.
Finally, function analysis ends with the creation of a value index. This index has already been described in this thesis and it states that value is the relationship between cost and worth. The formula is (23):
Value = Worth / Cost (23)
The ideal goal here is a ratio of 1. Basically, this ratio emphasizes the cost effect of a function, but one must remember that it is caused by improvements in performance, such as in time or quality.
Cost calculations (for Table 2) can be done using the LCC technique (defined in Chapter 7), which also takes into account life cycle costs over time. Worth calculations can be done using for example penalties technique. In penalty techniques, the company first calculates the ideal situation of worth and then takes into account obvious problems, which cannot be solved and which are reducing value. These problems are put into value calculations as penalty costs, and they have a negative effect on the value result.
The function analysis phase is implemented using the same VE team that was nomi-nated in the orientation phase. Therefore, the required know-how and resource needs are the same as in earlier phases.
The function analysis phase produces the following work products:
− Function list (a list of the processes/practices/products/components to be examined) − Function model (a picture showing how functions are tied to each other) and − List of calculated worth, cost and value indexes for each function.

70
Methods and techniques used in this phase include function analysis and the FAST dia-gram as well as worth, cost and value index-calculating methods and techniques. Templates in this phase include a function list or sheet including worth, cost and value information, and the FAST diagram.
4.2.2.3 The creativity phase
The purpose of the creativity phase is to create a number of ideas for each selected function. The scope is defined, so that the VE team members are encouraged to present improvement proposals related to selected functions. The entry criteria for the creativity phase are:
− A function list (a list of the processes/practices/products/components to be examined) has been drawn up
− A function model (a picture showing how functions are tied to each other) has been created
− Value indexes have been assigned to functions.
The exit criterion is:
− A list of improvement proposals has been created
The creativity phase includes one main activity, which is to determine improvement proposals for the functions examined. This is a creativity type of effort, totally unconstrained by habit, tradition, negative attitudes, assumed restrictions, and specific criteria (SAVE 1998, 6). All the ideas presented are evaluated in the evaluation phase to reach the quality target for each idea. The main idea is to create new combinations which will perform the desired function at lower total cost and with improved performance, by using existing knowledge in creating new ideas.
In the creativity phase the Value Engineering team puts forward suggestions to answer the functions that have been selected for study. It can be noted from the case studies in Kelly & Male’s book (1993) that only a few cost-dominant functions will normally be se-lected for creativity study.
The creativity phase is implemented using the same VE team that was nominated in the orientation phase. Therefore, the required know-how and resource needs are the same as in earlier phases. As a work product, the creativity phase produces a list of improvement proposals.
There are a number of creativity techniques, for example: brainstorming, the Gordon technique, the Synectic Technique and many more (see Dell’ Isola 1997, 102-109). Because the idea is to develop new ideas by, for example, brainstorming, discussions should be creativity and open, not judgmental. Value Engineering research has also shown that original suggestions are more likely to come from non-experts in the given subject than from those who are experts. The necessary improvement proposals are listed using a defined improvement proposal template.
71
4.2.2.4 The evaluation phase
The purpose of the evaluation phase is to evaluate the ideas generated in the creativity phase using one of a number of techniques, many of which depend upon some form of weighted vote. This stage forms a crude filter for reducing the ideas generated to a manageable number for further study (Kelly & Male 1993, 13-14). The scope of this phase is defined so that all presented ideas are analyzed equally based on pre-decided criteria. The entry criterion for the evaluation phase is:
− A list of improvement proposals has been created.
The exit criteria are:
− Improvement proposals have been evaluated against pre-decided approval criteria using weighted voting.
− There are improvement ideas which fulfill pre-decided approval criteria
The evaluation should be carried out by using comparison, advantage vs. disadvantage thinking, ranking, checklists, probabilities and creativity approaches. In performing the evaluation one should establish criteria and also calculate the costs of each idea.
The objective of evaluation is the evaluation of the new ideas and concepts generated in the creativity phase, and the selection of ideas for development and value improvement. The criteria used are presented in the pre-study. The evaluation process in-cludes several activities:
1. Eliminate nonsense or “thought-provoker” ideas. 2. Group similar ideas by category within long term and short term implications. Ex-
amples of groupings include electrical, mechanical, structural, materials, special proc-esses, etc.
3. Have one team member agree to “champion” each idea during further discussions and evaluations. If no team member volunteers, the idea or concept is dropped.
4. List the advantages and disadvantages of each idea. 5. Rank ideas within each category according to prioritized/weightened evaluation
criteria, using techniques such as indexing, numerical evaluation, and team consensus. 6. If competing combinations still exist, use matrix analysis to rank mutually exclusive
ideas satisfying the same function. 7. Select ideas for development and value improvement. Make sure that the selected
ideas fulfill customer needs.
If none of the presented ideas appears to satisfactorily meet the criteria, the value study team returns to the creativity phase. Even though not all ideas are put into practice or taken for closer examination, and they are often personalized to certain people, they should not be formed as an obstacle for evaluation work within the team.
The evaluation phase is implemented using the same VE team that was nominated in the orientation phase. Therefore, the required know-how and resource needs are the same as in earlier phases. As a work product, the evaluation phase produces a list of evaluated improvement proposals, which shows how much cost-cutting each idea generates.

72
Usable techniques in the evaluating phase include screening and selection techniques which have weighted evaluation characteristics. In the evaluation phase, the template used is a cross matrix where improvement ideas are listed in rows and evaluation criteria in columns. The template is filled out so that in each cell the VE team inserts the average number of points the team has given in voting to the idea in question. When filling out the template it should also be noted that not all criteria necessarily have the same maximum number of points.
4.2.2.5 The development phase
The purpose of the development phase is to investigate all selected ideas in detail for their technical feasibility and economic viability. Outline designs will be worked out and costs estimated (Kelly and Male 1993, 14). In this study the purpose of the development phase is also to select and prepare the best alternative(s) for improving value. The scope of the development phase is defined so that the VE team gathers persuasive facts about each idea, works on technical specifics, and finally calculates potential cost savings for each idea. The team can help set the scope for this work by asking themselves:
− Will it work? − Will it meat all the requirements? − Who has to approve it? − What are the implementation problems? − What are the costs? − What are the savings? (O’Brien 1976, 33)
The entry criteria for the development phase are:
− Improvement proposals have been evaluated against pre defined approval criteria using weighted voting.
− There are improvement ideas which fulfill approval criteria
The exit criteria are:
− Benefit analysis is complete − The technical data package on how the ideas could be implemented is complete − The implementation plan is complete − Final proposals have been prepared, and they include short descriptions of each idea
with positive and negative effects and potential cost savings − Presentation material for top level management has been prepared.
The development phase includes the following activities:
1. Beginning with the highest ranked value alternatives, develop benefit analysis and implementation requirements, including estimated initial costs, life cycle costs, and implementation costs, taking into account risk and uncertainty.
2. Conduct performance benefit analysis. 3. Compile technical data package for each proposed alternative:

73
a) Written descriptions of original design and proposed alternative(s) b) Sketches of original design and proposed alternative(s) c) Cost and performance data, clearly showing the differences between the original
design and proposed alternative(s) d) Any technical back-up data such as information sources, calculations, and literature e) Schedule impact
4. Prepare an implementation plan, including a proposed schedule for all implementation activities, team assignments and management requirements.
5. Complete recommendations including any unique conditions for the project under study, such as emerging technology, political concerns, impact on other ongoing pro-jects, marketing plans, etc. (SAVE 1998, 7)
At the end of the development phase the team collects all the ideas together. The ideas should comply with the basic Value Engineering philosophy. In other words all ideas that cost more than the original idea or are found to reduce quality are rejected.
The development phase is implemented using the same VE team that was nominated in the orientation phase. Therefore, the required know-how and resource needs are the same as in earlier phases. As work products, the development phase produces:
− Benefit analysis document − Technical data package containing design − Implementation plan − Presentation material stating short descriptions of each idea with positive and negative
effects and potential cost savings.
There is a wide range of techniques used in this phase. The benefit analysis document is a literal description of how each idea benefits the customer and the company. The technical design can be done using, for example, the UML method. The implementation plan varies a lot depending on the milestone structure used in the company. Usable techniques also include screening and selection techniques which have weighted evaluation characteristics. The most useful in terms of costing is the LCC method, because it can show the cost for each alternative over time, which helps to see the cheapest suggestion. Depending on the company, the templates used in benefit analysis, design, implementation and presentation may vary.
4.2.2.6 The presentation phase
The purpose of the presentation phase is to present refined ideas, supported by drawings, calculations and cost information, to top-level management for decision-making purposes. This includes an initial oral presentation followed by a complete written report (SAVE 1998, 7). The scope of the presentation phase is defined, to serve the decision-making process and the interests of top-level management. The entry criteria for the presentation phase are:
− Benefit analysis is complete

74
− The technical data package on how the ideas could be implemented is complete − The implementation plan is complete − Final proposals have been prepared, and they include short descriptions of each idea
with positive and negative effects and potential cost savings.
The exit criteria are:
− The presentation has been given, and value improvement recommendations have been made.
− Top-level management has approved the study.
The main activity in the presentation is to talk about the presented problem, explain the situation before and after, and explain the advantages, disadvantages and potential cost savings and value improvements. The presentation is given using the same VE team that was nominated in the orientation phase. Therefore, the required know-how and resource needs are the same as in earlier phases. The presentation phase produces as a work product the minutes recording comments given during the presentation. The presentation phase does not include any special techniques or templates.
4.2.3 Post-study
The purpose of the post study is to assure the implementation of the approved value study change recommendations. The implementation tasks are carried out by the VE team, the organization’s own personnel, or both together.
The scope of the Post-study is defined so that each new alternative must be independently designed and confirmed, including contractual changes if required, before its implementation into the product, project, process or procedure. The entry criteria for the Post-study are:
− The presentation has been given and value improvement recommendations have been made.
− Top-level management has approved the study.
The exit criteria are:
− A financial post-study stating the full benefits of the implemented ideas (audit) has been completed and the results given to top-level management.
The main activity in the post-study is to assure the implementation of approved ideas and report the results to management. The post-study is carried out using the same VE team that was nominated in the orientation phase. The required know-how and resource needs are mainly the same as in earlier phases. However, the implementation of the suggested ideas might cause new resource needs, as might the auditing of the final financial benefits. The presentation phase produces as a work product an audit report prepared by the financial department or an auditor. The presentation phase does not have any special techniques or templates.

75
4.2.4 Conclusions of the Value Engineering process
The VE methodology is known and accepted in many countries all over the world. It is an organized process with an impressive history of improving value and quality. The VE process identifies areas in which to remove unnecessary costs, while assuring that quality, reliability, capability, and other critical factors will meet or exceed the customer’s ex-pectations. In this sense, VE supports the same basic idea of the customer’s expectations and satisfaction as many capability-maturity -based assessment methods, when they emphasize the company’s business goals as assessment’s corner-stone.
As a method, VE does not sacrifice achieved capability levels which can be measured or developed for example by the BOOTSTRAP assessment method. This is important to note, if these methodologies are considered together, because if one methodology sacri-fices the results which the other methodology has succeeded in creating, the new combination will not work properly. Either capability or value might then be neglected.
The improvement proposal given in the VE presentation phase includes the results of value-increasing recommendations made by multidisciplinary teams representing all par-ties involved. The VE improvement proposal represents a systematical effort to improve the value and optimize the life cycle cost of the examined function or process.

5 Combining capability, value and quality – towards an Value Enhanced Assessment method
5.1 Assessment
Merriam-Webster’s Online Thesaurus (2005) defines assessment as: 1) a charge usually of money collected by the government from people or business for public use “…hated paying the annual assessment (tax) on his car…”, 2) an opinion on the nature, character, or quality of something “…I’m far too quiet, in the assessment of my new boss…”, 3) the act of placing a value on the nature, character, or quality of something “…we may have been too hasty in our assessment of the value of the property...”.
Furthermore, Princeton University’s WordNet (2003) defines assessment as: 1) the classification of someone or something with respect to its worth, 2) an amount determined as payable “…the assessment for repairs outraged the club’s membership”, 3) the market value set on assets, 4) the act of judging or assessing a person or situation or event “…they criticized my judgment of the contestants”.
Both definitions together emphasize the different point of views, content and aspects of an assessment. Assessment is the process of documenting, often in measurable terms such as knowledge, skills, attitudes and beliefs. It is often used in an educational context, but applies to many other areas as well, as Wikipedia (2001-2005) shows.
According to Wikipedia (2001-2005), there are two main types of assessment:
− Summative Assessment: Summative assessment is generally carried out at the end of a course or project. In an educational setting, summative assessments are typically used to assign students a course grade.
− Formative Assessment:Formative assessment is generally carried out throughout a course or project. Formative assessment is used to aid learning. In an educational setting, formative assessment, might be a teacher (or peer) providing feedback on a student’s work, and would not necessarily be used for grading purposes.

77
Furthermore, assessment (either summative or formative) can be objective or subjective. Objective assessment is a form of questioning which has a single correct answer. Subjective assessment is a form of questioning which may have more than one correct answer (or more than one way of expressing the correct answer). (Wikipedia 2001-2005)
Assessment should be valid and reliable. A valid assessment is one which measures what it is intended to measure. For example, it would not be valid to assess driving skills through a written test (alone); the most valid way of assessing driving skills would be through a combination of practical assessment and written testing. Reliability relates to the consistency of an assessment. A reliable assessment is one which consistently achieves the same results with the same or a similar cohort of students. Various factors affect reliability, including ambiguous questions, too many options within a question paper, vague marking instructions and poorly trained markers. A good assessment is valid and reliable. However, an assessment may be valid but unreliable or reliable but invalid or unreliable and invalid. In practice, an assessment is rarely completely valid or entirely reliable. (Wikipedia 2001-2005)
Although validity and reliability are the main measures of an assessment, there are other considerations such as practicality (which relates to the feasibility of the assessment), fairness (which relates to its application across various cohorts, such as males and females) and authenticity (which relates to its realism). (Wikipedia 2001-2005)
BOOTSTRAP assessment can be classified as formative assessment. It is used to aid the learning of the software process and it can be carried out throughout the project. The goals of the BOOTSTRAP methodology are to assess the software process performed in a software production unit (software production unit or SPU is the assessed organization that produces the software – it can be a whole company or a single department), and to start its improvement. The BOOTSTRAP assessment process includes both a definition of maturity level and determination of the capability of the process. (Kuvaja & Bicego 1994, 118. See also appendices.)
The BOOTSTRAP assessment approach can be seen as method that meets its goals, firstly by describing the assessment process and providing assessment instruments for determining where an organization stands (maturity level) and what its strengths and weaknesses are in, the form of attribute profiles (capability). Secondly, the methodology meets its goals by offering improvement guidelines that describe how to select gradual changes in order to improve the software production process (action plans). The third dimension in attaining its goals is made up of guidelines for implementing the action plans. (Kuvaja & Bicego 1994, 118. See also appendices.)
Haase et al. (1994, 25) summarize this by stating that the BOOTSTRAP method assesses both the SPU and its project, thus providing answers to two important questions: is the SPU providing all the necessary resources to do the projects and are the projects using the resources efficiently? Bollinger & McGowan (1991, 25) state that in the most general use of the phrase, a software process assessment is simply a determination of how various parts of a project (such as people, tasks, tools, standards, and resources) interact to produce software. The objectives of a process assessment are to understand and improve how an organization uses its resources to build high-quality software. Since capability-maturity -based assessments, like BOOTSTRAP, aim to find more than one correct answer, (or more than one way of expressing the correct answer) they seem to be more subjective than objective in nature.

78
As a method, BOOTSTRAP aims to fulfill the measures of a good assessment. It aims at validity and reliability mostly by defining a process model which enables one to measure what the method is intended to measure. The levels used in measuring are also defined for assessment purposes.
VE based value assessment can be classified as formative assessment, just like BOOTSTRAP (for more on VE see Webb 1997). It is used to aid the learning of the functions over time. The assessment goals of VE are to assess the value of functions in an organization or in its products and services. In practice, the organization can be a unit, project, division or any other organizational unit. After assessing the value of functions, VE offers guidelines for finding improvement possibilities and for analyzing them.
Just like the BOOTSTRAP method, VE offers an assessment process and tools to determine the functions of an organization (Paulson 1995, 280-285 and Dell’ Isola 1997). It also offers guidelines and measurable measures (value index) to select the changes needed to improve the value of defined functions (Dell’Isola 1997). Finally, VE requires the organization to develop guidelines for implementing the defined improvement plans (Webb 1993 & Dell’ Isola 1997). Just like BOOTSTRAP, it also aims to find more than one correct answer, (or more than one way of expressing the correct answer) and is therefore perhaps more subjective than objective in nature.
As a method, VE aims to fulfill the measures of a good assessment. It aims at validity and reliability mostly by defining a function model which enables one to measure what the method is intended to measure and offers a ratio (value index) to illustrate the level of value achieved (Dell’ Isola 1997).
Furthermore, both methods seem to have similarities in their assessment process phases. Firstly, they collect information. Secondly, they analyze this information and form measures about it and thirdly, they form improvement proposals (for the VE process see Chapter 4 and for the BOOTSTRAP process see Chapter 6.1). However, since the collected information is different in nature (value vs. capability), it does not seem to make sense to combine all phases of these methods. Perhaps a more logical solution would be to keep both assessment processes intact, which would keep the combination more practical to use.
Conceptual similarities exist in the nature of both methods as well: both are formative and subjective, and as Paulson (1995, 281) states: “value is increased by increasing functional utility or capability, decreasing cost, or optimally, both.” The most significant difference is perhaps in their defined assessment targets. The BOOTSTRAP method uses processes defined in a process model (see appendices) and for VE it is possible to define the function (usually using a verb and a noun) based on the assessment situation itself; according to Fry (1995), Mudge (1971, 4), Paulson (1995), Wixson (1997) and Ojala (2001) it can be a process as well. Perhaps in this difference lies also the most natural way to combine these methods. If capability and value are determined for the same items such as processes, the logical solution would be to use the existing BOOTSTRAP process model, where all the processes are already defined. Otherwise, both methods would not have a combining assessed item linking each other together.
In addition, VE seems to provide a way to assess products as well. This enhancement is rather interesting, because it brings the relationship of a process and product closely together. Can a BOOTSTRAP defined process be same as a VE defined function? If it can, the capability and value could be calculated for the same target and the aim of

79
respecting both measures, value and capability, as equal would be achieved. Is value-based product assessment going to bring closer the interests of customer and vendor? If so, it might slow down the criticism that process assessment alone is a mere waste of money.
5.2 Principles of the Value Enhanced Assessment method
Several authors have stated that, in creating products, the higher the process capability, the higher the product quality. Many authors also claim that it takes several years for a company to climb to higher maturity levels (SEI 2001, 7-14). From an economical point of view this means significant investments. Therefore, any tool which can help to analyze cost and value in processes and products should be welcomed in improvement work. Together, capability, cost and value form a tool which can be used not only to define an improvement path towards higher maturity levels but also to analyze how money should be used to maximize value in processes and products when climbing to higher maturity levels.
Quality is often thought to be the result of using capable processes (Deming, 1982). In this context, cost is a result or price of aiming towards higher capability levels. Value declines, in proportion, as cost increases. Furthermore, the greater the cost, the more sure we have to be that the customer is interested in paying for what we do and sees worth in it. If the customer sees worth in what we do it enables us to price our products so that some value stays in our company. The greater the worth to the customer, the bigger the value opportunity is to us. The right balance of capability and value create quality at a reasonable cost and appropriate customer worth.
In enhancing capability-maturity -based assessment, this chapter uses the CMM and BOOTSTRAP assessment models as reference models. These are based on the TQM movement as many other software assessment methodologies. However, the presented enhancements can also be applied to other capability-maturity -based assessment methods.
In this dissertation it is seen important that the capability-maturity -based assessment method is based on a model that includes clear process definitions. This is because process improvement is seen to be more effective if capability, value, cost and worth can be calculated for the same processes. However, because process improvement should not be based only on capability-maturity -based assessment, this chapter outlines how to carry out value assessment for processes and products. The relationship between process and product is seen as very important, and therefore value assessment is also applied to products.
5.3 Capability-maturity -based assessment for VE processes
Capability-maturity -based assessment methods include process models, in which all processes and their relationships are defined. According to SEI (2001, 30) “a maturity level is a well-defined evolutionary plateau towards achieving a mature software process.
80
Each maturity level indicates a level of process capability. Since software process capability describes the range of expected results that can be achieved by following the software process, the software process capability of an organization provides one means of predicting the most likely outcomes from the next software project the organization undertakes.”
Based on earlier chapters where the principles of a value-based approach were pre-sented, it seems logical to consider value as equal to capability. One possible way to implement this statement in practice is to consider VE processes (or phases), which analyze value as being of equal significance as other processes already existing in the reference model in question. In other words, the theoretical assumption, that one should consider capability and value as equal, claims that value-related processes should have the same level of significance when determining the maturity level of a project or other organizational unit. If Value Engineering processes were not considered to be of the same level of importance as other SW processes, we would in practice continue along the same “approved” path which capability-maturity -based assessment methods have been following for several years. When carrying out assessments we would still assume that costs are accounted for sufficiently when we keep them as general assumptions or general practices in the background of assessment. Furthermore, also when assessing processes only the assessors would be able to evaluate their fulfillment, and that top management, who would “look at the maturity levels” achieved would not necessarily know how well the company is performing in creating business value, because the visibility of value would be hidden to assumptions or practices.
Therefore, when enhancing capability-maturity -based assessment using Value Engineering the first possible way to enhance existing process models is to include a new Value Engineering process cluster in the model. If Value Engineering processes are evaluated as all other processes, and the company can see in each report how they have scored in these processes, then value and costs will be considered on the same level of importance as other processes and their capabilities. In this kind of enhancement it is perhaps more difficult to hide information behind “one scope development,” which is based only on developing the capabilities of technical processes. Furthermore, in this kind of enhancement each improvement proposal given has to balance value-related improvement ideas with other improvement ideas, which give the necessary visibility to cost efficiency as well.
The addition of new processes to any reference model areas requires an understanding of the model structure in question. Appendix 2 discusses how VE enhancements could be added to BOOTSTRAP and CMM models.
5.4 Value Assessment for processes using a reference model
Software process definition is fundamental to the achievement of higher levels of maturity (SEI, 2001, 64). According to the SEI point of view, processes can be developed and maintained similarly to how products are developed and maintained. There must be:
81
− Requirements that define what process is to be described − An architecture and design that provide information on how the process will be de-
fined − Implementation of the process design in a project or organizational situation − Validation of the process description via measurement − Deployment of the process into widespread operation within the organization or
project for which the process is intended (SEI, 2001, 67)
It is obvious that in many situations, model-based software process improvement offers a great number of benefits not offered by normal process improvement. This also applies to value assessment using Value Engineering. A clear reference model, which has been used in defining process capabilities and combined with process value indexes, gives a two-sided approach to the evaluation of processes. When the company knows the capability and value of a process it is clearly more able to make improvement proposals.
Theoretically, there are, however, several possibilities to calculate value for reference models, like BOOTSTRAP model. These possibilities include at least assigning costs to process clusters, processes and process practices. All these levels exist in a typical process models and are therefore, usable. If company does not, for example, have a cost accounting which would support assigning cost to process practices other possibilities like assigning them to processes might be easier and still fulfill information needs. Process level cost accounting exists in several companies and also customers might see it easier to assign worth to processes, rather than to practices. Theoretically, it would also be possible to assign costs to process clusters, but in this case, the information would be so general that it would perhaps not help decision making enough.
The selection of the level were costs and worth are assigned depends mostly on the level of cost accounting and information needs in the company. Naturally, if customer wants to participate to assessment it might be worthwhile to consider calculating worth at process level and costs at practice level. This way company would get more precise understanding of the costs and would not miss real customer opinions of worth.
The following short illustrative example shows how value and capability-maturity -based assessment can be combined, with the result that the company gets value indexes as well as capability levels as the result of an assessment. In the example presented there is only a limited number of processes, but value assessment can be used to go through all the processes defined in a reference model, as well. Since the example bases on using a reference model, the functions (functionality) are mapped to be equal with process practices (in BOOTSTRAP base and management practices), defined in BOOTSTRAP process model or tree, which is illustrated in Figure 6 (See also chapter 3.3). The same principles and logic for calculating value can be applied using other model-based meth-ods as well. (For more on the VE process, see Chapter 4; for more on tools, see Chapter 7.)
5.4.1 An illustrative example of use of the BOOTSTRAP method
Software Ltd. has taken part in a BOOTSTRAP assessment. This assessment was carried out because the company believed its projects always to be 20 % late. Their customers

82
complained about decreased quality, and the company was not sure about the technology used in their different processes. Therefore, the company was not able to reach its goals of delivery time, improved quality and improved technology management. It wanted to measure its processes to find out which processes were causing problems. In the final assessment report it got the results of capability levels in the assessed processes. The results showed the areas of weakness in process capabilities. The calculated capability levels were as follows: Process Capability level ORG.1 Business Engineering 2 ORG.2 Human Resource Management 1 ORG.3 Infrastructure Management 1
TEC.1 Technology Innovation 2 TEC.2 Technology Support for Life Cycle Processes 1 TEC.3 Technology Support for Life Cycle Independent Processes. Tool Integration 1 MAN.1 Project Management 2 MAN.2 Quality Management 1 MAN.3 Risk Management 1 MAN.4 Subcontractor Management 1
Orientation & information
After the capability-maturity -based BOOTSTRAP assessment, Software Ltd. also wanted to know the worth, costs and value of the assessed processes. Therefore, it decided to participate in a Value assessment. In the information phase all the necessary data was collected. The VE study focused on the examined BOOTSTRAP processes; in other words, VE functions were defined in the same way as BOOTSTRAP processes. Since there was no customer who had defined worth, company used target costing to define allowable costs as worth. Actual costs were used as costs. These calculations were based on the market situation and formed limits to the levels of costs in a competitive sense.
Function analysis
Function analysis was used in calculating costs and worth for functions (Table 2). Because some processes were at base practice level (capability level 1), the costs for these levels were calculated directly by using base practices. In other words, base practices were understood to be the same as the VE functions. For other processes, which had reached higher capability levels, costs and worth were calculated separately for base practices and management practices, which were understood to be different VE functions. Costs were calculated for base practices for two main reasons:

83
− The cost accounting system made it possible to assign costs to more detailed level than for processes.
− The company believed that detailed cost information would help to track problems better.
Capability levels, company got from BOOTSTRAP assessment implemented earlier. After function/process analysis, the VE team presented the results as shown in chapter 4.2.2.2 in Table 2.
Table 3. Function/process worksheet in Software Ltd.
FUNCTION / PROCESS WORKSHEET – Software Ltd.
Organizational processes, management processes and technology processes
Item Description
Amount Cost Function/process Explanation Capability Target Cost
Worth
ORG.1. 1 6+4 Business Engineering Base +mgnt practice 2 7 10 ORG.2. 1 5 Human Resource
Management Base practice 1 5 3
ORG.3. 1 3 Infrastructure Management Base practice 1 3 2 Total 18 15 15 TEC.1. 1 4+5 Technology Innovation Base +mgnt practice 2 4 2 TEC.2. 1 5 Tech. Sup./ Life Cycle
Processes Base practice 1 2 4
TEC.3. 1 4 Tech. Sup/Life Cycle Ind.Processes
Base practice 1 2 3
Total 18 8 9 MAN.1. 1 10+4 Project Management Base +mgnt practice 2 13 7 MAN.2. 1 9 Quality management Base practice 1 9 3 MAN.3. 1 5 Risk management Base practice 1 5 2 MAN.4. 1 3 Subcontractor management Base practice 1 3 1 Total 31 30 13 TOTAL 67 53 37
After calculating the function/process worksheet (for a one year period), the company decided to analyze the results (Tables 3 and 4). “Item description” shows the abbreviation assigned to the process. “Amount” shows the number of processes, usually 1. “Cost” was understood to be the price to be paid, based on the existing, real-life costs of running processes in the company. Function/process column names the process, which is understood to be function with the same name and content as well. Explanation column defines the practice level assessed in the company. Typically it shows only base practice if company has been on capability level one and base + mgnt practice if it has been on level two. “Worth” was understood to be the least cost to perform the required func-tion/process in the company. In practice, it shows how much the company should pay for running the processes (from the customer point of view). As there was no customer explaining how much it would pay for running each process (processes were not related directly to customer service), the company defined it using ideal cost, the least cost

84
possible. However, least cost estimates were build up using company strategy and customer feedback on the background, which both reflected general customer needs. The target cost showed the average competitors’ costs in markets in which cost level company was able to compete with other companies in markets. “Value” (see Table 4) is the measure, in currency, which reflects the desire to obtain the process rather than, for example, to outsource it. In practice, value can be seen as “good” if the ratio is higher than 1.0 and if it is below 1.0, as poor.
The formula used (as presented earlier in this dissertation) in calculating value was: (company did not want to use relative numbers (percentages) of worth and cost)
Value = Worth/Cost.
Table 4. Function/process result analysis in Software Ltd.
FUNCTION / PROCESS WORKSHEET – Software Ltd. Organizational processes, management processes and technology processes Item Description
Amount Cost Function/process Explanation Capability Target Cost Worth Value
ORG.1. 1 6+4 Business Engineering Base +mgnt practice 2 7 10 1,00 ORG.2. 1 5 Human Resource
Management Base practice 1 5 3 0,60
ORG.3. 1 3 Infrastructure Management Base practice 1 3 2 0,67 Total 18 15 15 0,83 TEC.1. 1 4+5 Technology Innovation Base +mgnt practice 2 4 2 0,22 TEC.2. 1 5 Tech. Sup./ Life Cycle
Processes Base practice 1 2 4 0,80
TEC.3. 1 4 Tech. Sup/Life Cycle Ind.Processes
Base practice 1 2 3 0,75
Total 18 8 9 0,50 MAN.1. 1 10+4 Project Management Base +mgnt practice 2 13 7 0,50 MAN.2. 1 9 Quality management Base practice 1 9 3 0,33 MAN.3. 1 5 Risk management Base practice 1 5 2 0,40 MAN.4. 1 3 Subcontractor management Base practice 1 3 1 0,33 Total 31 30 13 0,42 TOTAL 67 53 37 0,55
The results showed clearly that the company’s existing costs were greater than their target costs. In other words, the cost level was too high to compete in those markets. However, the company considered that this was only temporary, due to significant temporary investments in technology innovation and taking into use new technologies. Because the cost level was significantly high the company decided to analyze the reasons for cost overruns. In terms of their targets the most significant overruns were caused by technological processes. After careful analysis it was understood that inventing, imple-menting and supporting technological development had tied up coding resources, which had delayed product launches. Technological inventions were not planned well enough,

85
and economical resource estimations were missing. It was clearly detected that the company should minimize costs, particularly in technological processes. In terms of worth to the customer it also became obvious that project and quality management costs needed to be cut. In other words, management processes used much more money than what would be reasonable in terms of how much worth management creates for the customer.
Creativity phase and evaluation
After considering all the information calculated in function analysis, the company decided to move into the creativity phase. In the creativity phase they decided to evaluate management and technological activities which, according to the capability-maturity -based assessment, were also quite weak. By brainstorming, and using capability and value as guidelines, they came up with many new ideas. Designers stated that they needed more time for SW development work. They also revealed that development personnel often interrupt their work in the middle of coding, and that “warming up” is time-consuming. Project managers argued that they are spending too much time on sales activities, because the sales personnel were not able to present the products. Therefore, in sales meetings there was always a project manager and two salespersons present. Product development problems were seen to exist in quality management as well. Quality guidelines and rules were often neglected, because there was not enough time to follow them.
All ideas were evaluated using time to market, cost efficiency and quality as criteria. As a result of the evaluation, the company decided to develop the following ideas further:
− More time for development work − Sales support not using project managers too much − Organized quality responsibility
Development
During the development phase, the ideas selected were discussed and the Value Assess-ment team proposed improvement ideas based on cost-saving opportunities, which consisted of eight cost units all together. The management’s salary system was to be changed to emphasize a system of rewards, by cutting monthly salaries and increasing bonuses for management personnel who reached their defined aims. Designers were given a more peaceful time by confining innovation-related ideas to the projects’ weekly meetings. Sales personnel were given product-related training so that they were able to give basic product presentations. Project managers were made responsible for monitoring quality-related issues and reporting them in weekly meetings.
Presentation
Capability-maturity -based assessment and value assessment results were presented to the board of the company. Each improvement idea included a benefit analysis summary, technical data package and plan for implementation. In the presentation, a special effort was made to present the positive and negative consequences of each idea and cost-saving opportunity as well. The training program was included in the suggestions, because the

86
capability-maturity -based assessment showed clearly that it was missing, and hence was influencing the management processes.
5.5 Value Assessment for processes without a reference model
Particularly in many small companies, capability-maturity models may be considered too heavy and difficult. However, these companies may still make use of their own process descriptions in SW development.
VA without a process model offers a way to track and follow the costs of the com-pany’s own processes. This can be done by first defining the practices examined, according to process descriptions, and second carrying out VA assessment for these practices.
For example, the company may have a testing process with two interesting practices, module testing and release testing. Software designers are responsible for module testing, and test engineers for release testing. The company would be interested in knowing the costs and values of these activities. Is it cheaper to carry out comprehensive module testing, or to concentrate fully on release testing? In this example we do not need CMM or BOOTSTRAP or any other capability-maturity -based assessment method; a cost and value assessment method like VE is appropriate.
5.5.1 An illustrative example without a reference model
Orientation & information
To improve the value of its testing, Software Ltd. wanted to know the worth and costs which lay in the testing process. It decided to participate in VA using VE. In the informa-tion phase all the necessary data was collected. By using target costing, the company wanted to calculate the allowable cost for module and release testing processes. These calculations were based on the market situation, and formed limits to the levels of costs in a competitive sense. Software Ltd. was also thinking of outsourcing the testing activities.
Function analysis
Function analysis was used in calculating costs and worth for the functions (Table 5). Testing activities defined in process descriptions were mapped as VE functions. After the function/process analysis the VE team presented the results shown in Table 5.

87
Table 5. Function/process worksheet in Software Ltd.
FUNCTION / PROCESS WORKSHEET – Software Ltd. Testing process Item Description Amount Cost Function/process Explanation Target Cost Worth MOD.1. 1 8 Module testing Process description 7 10 REL.1. 1 6 Release testing Process description 6 10 TOTAL 14 13 20
After calculating the function/process worksheet, the company decided to analyze the re-sults (Tables 5 and 6). In tables 5 and 6: “Item description” shows the abbreviation assigned to the process. “Amount” shows the number of processes, usually 1. “Cost” was understood to be the price to be paid, based on the existing, real-life costs of running processes in the company. Function/process column names the process, which is understood to be function with the same name and content as well. Explanation column explains that process description is the source for assessed practices. Worth was understood to be the least cost to perform the required function/process in the company. Cost was understood to be the price to be paid, based on existing real-life costs. Target cost showed competitive costs in the markets, and value was the measure, in currency, which reflected the desire to obtain or retain an item, service or ideal. “Value” (Table 6) is the measure, in currency, which reflects the desire to obtain the process rather than, for example, to outsource it. The formula used was: (company did not want to use relative numbers (percentages) of worth and cost)
Value = Worth/Cost.
Table 6. Function/process result analysis in Software Ltd.
FUNCTION / PROCESS RESULT ANALYSIS – Software Ltd. Testing process Item Description Amount Cost Function/process Target cost Worth Value MOD.1. 1 6 Module testing 7 10 1,3 REL.2. 1 4 Release testing 3 10 1,7 TOTAL 10 10 20 1,5
The results calculated show clearly that the company’s existing costs in module testing are lower than the allowable costs. Therefore, the company creates value in module test-ing. In release testing the company creates even more value, but it has not been able to reduce costs to the target level. In practice, value can be seen as “good” if the ratio is higher than 1.0.
Creativity phase and evaluation
After considering all the information calculated in function analysis, Software Ltd. decided to move into the creativity phase. In the creativity phase they decided to discuss about costs in module and release testing. By brainstorming they got many new cost sav-ing ideas, which were evaluated and ranked in the evaluation phase. The best improve-

88
ment ideas included daily module tests performed by each developer and automated test software for release testing.
Development
In the development phase they decided to propose the purchase of new release testing software for the testing unit. This decision was made due to the predicted savings in testing time, and the ability of the software to calculate quality metrics as well. Daily module tests were understood to be more efficient than weekly tests, because of changes in the working process. It was estimated that each development idea would save one unit of cost.
Presentation
Value-based process assessment results were presented to the board of the company. The process improvement suggestions were daily module testing and automated release testing software. The board of the company approved both ideas, since they noticed that they both increase value.
5.6 Combined value and capability-maturity -based assessment for processes
Combined value and capability-maturity -based assessment for processes, is an enhancement in which capability assessment and value assessment are combined. Basically, this means that capability-maturity -based assessment is done using a reference model (CMMI, Bootstrap, etc.) in a normal way. After this phase, value assessment is carried out, calculating real value indexes for all the capability-maturity assessed processes. Naturally, it is also possible to assess value first and perform the capability-maturity -based assessment afterwards. The main aim is for the assessment team to assign both capabilities and values to the processes assessed. From a methodological point of view the reference model and VE method are combined, so processes from the reference model are equal to VE functions, and practices are equal to sub-functions. It is recommended that, when allocating names, assessors use names from the reference model. From the capability point of view, the assessment is carried out using the defined assessment process from the reference model, and from the VE point of view using the VE process.
In principle, it is possible to carry out capability-maturity -based assessment and value assessment for different processes, too. However, the problem with this approach is that it does not give such comprehensive information about the same processes. Information is spread over different targets, and the idea of combining capability and value does not work as well. However, it should be noted that even though capabilities are evaluated for all processes and values, it is not always necessary to calculate values for practices as well. Sometimes process-level information is enough.

89
5.7 Value assessment for a product
According to the SEI point of view, processes can be developed and maintained in a simi-lar manner to products (SEI, 2001, 67). Based on this statement, Value Assessment can be applied not only to processes but also to products.
Jung (1998, 74) has stated that in practice software developers are often faced with many requirements and not enough time or money to implement them all. They must find a way to prioritize the requirements, in order to select those adding the most to a system implementation and to eliminate those not worth the cost.
Boehm (1994, 365) has claimed that architecture is a critical factor for software development. He considers architecture to be significantly associated with cost and benefit drivers. By combining these two views it would seem that requirement analysis and architecture points of view are both relevant to product assessment.
In practice, the earlier in software development value assessment is done, the more cost-saving possibilities it can offer. Therefore all value assessments carried out during the requirement and architecture phases improve the opportunities for planning, so that the final product is more likely to fulfill value requirements as well. This point of view also takes the customer’s point of view into account, because they usually have a clear opinion of requirements, but not necessarily of all the components described in the architectural plans.
Product assessment is carried out by implementing the normal VE process:
− Information − Function analysis − Creativity − Evaluation − Development − Presentation
In product-focused assessment, all the functions used are defined as either requirements-based and/or architecturally-based components depending on the need. In any case it is important to examine the priorities from the customer point of view first, and then add the vendor’s priorities to the examination. Afterwards, the company should ask the customer how they would share the price of the product between the different requirements, to gain an understanding of how much worth the customer allocates to each of the requirements. If the assessment concerns architectural components as well, the price of the product should also be split between components. After allocating price (worth) to architectural components and/or requirements, the company should allocate costs to the same units in order to calculate value indexes.

90
5.8 Using value and capability information in improvement planning and development: BOOTSTRAP example
Process improvement planning and development is a challenging task. The BOOTSTRAP methodology, like other capability-maturity -based assessment methods, offers a good background for improvement planning and development. Rated processes and their capability levels reveal areas where improvement planning and development should be done from the capability point of view.
The BOOTSTRAP assessment method rates processes on a scale of 0 to 5. Level 0 means, for example, an incomplete process, level 3 means an established process and level 5 means an optimized process. The rating system cannot give information on which processes should be developed first or which processes give the greatest value to the company. If all processes are, for example, rated at level 2, the BOOTSTRAP method does not provide information on which of these processes should be improved first in order to give the biggest value increase to the company and its customers. For improve-ment planning and development work it is not enough to know that one process is rated at level 1 and all others at level 2 and to conclude that the level 1 process is the area which needs improvement.
A proper improvement planning and development method can also rate processes by clearly showing which processes give the greatest value and in which processes develop-ment would bring the biggest value increase. The BOOTSTRAP methodology does not include such characteristics. It evaluates processes by capability levels and these levels and processes are not sufficient for direct use in process improvement. This is because using only capability-maturity -based improvement can lead to the situation where processes are developed to include more technical capability, ignoring process improvements which for the same cost would give better value. Particularly from the improvement planning and development point of view, the proposed enhanced assessment method would improve the situation.
5.8.1 Value enhancement to the BOOTSTRAP method’s improvement planning and development phase
The development or enhancing task in BOOTSTRAP’s process improvement planning and development can be based on calculated capability levels. The capability levels calculated for each process show the areas where process improvement planning and development tasks can be focused, if capability is used as a criterion. If one uses the value created by processes as a criterion, problems arise because BOOTSTRAP does not calculate values.
In practice, development can start by using the calculated capability levels for each process and calculating costs and values for the same processes, using VE function analy-sis. The second possibility is to use the calculated capability levels for each process and VE function analysis to divide the processes into more specific functions, and then calcu-late values for every function. In practice, this would mean for example that process

91
practices defined in process model are equal with VE functions and value is calculated for these practices. This method is capable of producing more detailed cost and value information, which can better reveal the areas to be improved in each process. The third possibility is to use the calculated capability levels as a guideline, and calculate function values totally separately from the BOOTSTRAP processes. In this case, capability levels are calculated for the BOOTSTRAP processes, and values and costs are calculated for specific VE functions. This is not satisfactory, however, if we would like to maintain the aim of calculating capabilities, costs and values for the same processes.
After calculating costs and values, and carrying out the rest of the VE process, we can use the BOOTSTRAP method for rating process capabilities again to check whether the implemented process improvement planning and execution activities have influenced to the capabilities of assessed processes. The BOOTSTRAP method can be used either fully (including all phases), or partially (just for rating purposes), to identify possible new ca-pability levels. After the second round assessment, process improvement and development can also be focused on new processes if necessary.
The second round includes, in a full assessment, assessment of all the phases of preparation, execution and improvement planning; in partial assessment only the phases after execution are included. In the next chapter 5.8.2 we will concentrate on the question of whether VE can be used as a process improvement planning and execution method between the first and second rounds (and possibly also between other rounds) of BOOTSTRAP assessment. This idea is based on continuous process improvement activities after the evaluation of the processes. The approach can be described as a spiral, which leads to more and more sharply focused process assessment and improvement. The idea of continuous BOOTSTRAP- and value assessment is illustrated in Figure 4.
Fig. 4. Continuous BOOTSTRAP and Value Assessment.
5.8.2 Use of VE in process improvement planning and execution
The use of VE in process improvement planning and execution provides support to the BOOTSTRAP assessment process. The VE process can use the BOOTSTRAP-assessed processes and calculate their values, and it can also be used independently for measuring the values of different activities or functions. In practice, these functions can be
BOOTSTRAP assessment based on capability
Results of BOOTSTRAP assessment (capability proposal)
Value assessment based on value
Results of Value assessment (value proposal)

92
understood as BOOTSTRAP base practices (level 1) or base practices and management practices (levels 1 to 5) (Table 7).
In Table 7, “Item description” shows the process area. “Amount” shows the number of processes, usually 1. “Cost” was understood to be the price to be paid, based on the existing, real-life costs of running processes in the company. Function/process column names the process, which is understood to be function with the same name and content as well. Explanation column defines the practice level assessed in the company. Typically it shows only base practice if company has been on capability level one and base + mgnt practice if it has been on level two. “Worth” was understood to be the least cost to perform the required function/process in the company. In practice, it shows how much the company should pay for running the processes (from the customer point of view). As there was no customer explaining how much it would pay for running each process, the company defined it using ideal cost, the least cost possible.
When the assessor knows the capabilities and values of the same processes based on the BOOTSTRAP assessment method, he can give more realistic suggestions for process improvement. On the other hand, if the assessor has capability-maturity -based results for the BOOTSTRAP-assessed processes and VE results for function-oriented evaluation, where functions are not BOOTSTRAP processes or their parts, he has two dimensions in which to observe the area to be improved. In some circumstances this could be useful, but it does not contribute towards solving the problem of calculating capability levels, costs and values for each BOOTSTRAP process. Therefore, this alternative is not considered further in this study.
Table 7. Calculated capability levels and values for BOOTSTRAP processes
FUNCTION / PROCESS WORKSHEET – Software Ltd. Organizational processes and Management processes: Item Description
Amount Cost Function/process Explanation Capability Worth
Organization 1 10 Business Engineering Base practice 1 10 Organization 1 5 Human Resource Mgnt Base practice 1 5 Organization 1 3 Infrastructure Mgnt Base practice 1 3 Total 18 18 Management 1 20 Project Mgnt Base practice 1 20 Management 1 1+2 Quality Mgnt Base+mgnt. prac* 2 2 Management 1 2 Risk Mgnt Base practice 1 2 Management 1 3+1 Subcontractor Mgnt Base+mgnt. prac* 2 3 Total 29 27 TOTAL 47 45 *Base practice is fulfilled in level 1. Management practices and their fulfilment are considered in levels 2 to 5.
There are many key techniques to be used in process improvement planning and execu-tion. This is because the VE process itself concentrates on continuing process improve-ment planning and execution. From this point of view the VE job plan and all key tech-niques can be used to improve processes, as described in Chapter 7.

93
Key techniques are an important part of the VE process and they should be used to re-veal the basic nature of the examined items. In process improvement planning and execu-tion, key techniques can reveal areas where closer examination is needed. Tests for value or ten questions for value can also be used in improvement planning and execution. The questions for value as presented by Mudge (1971) are:
− Does its use contribute value? − Is its cost proportionate to its usefulness? − Does it need all its features? − Is there anything better for the intended use? − Is anyone buying it for less? − Can a usable part be made by a lower-cost method? − Will another dependable supplier provide it for less? − Do material, reasonable labor, overhead, and profit total its cost? − Is it made with proper tooling – considering quantities used? − Can a standard product be found which will be usable?
These questions for value are helpful because they can focus the assessor on checking the existing value of processes, or the value of planned processes. They can also reveal the effects of improvement planning and development by showing whether value is increas-ing or decreasing. If necessary, the assessor can also make more detailed calculations of the processes’ costs and values by using costing methods.
Tests for costing can be used in calculating costs for different processes. Life cycle costing calculates costs over time. Life cycle cost information can provide the basis for comparison of different improvement alternatives, even though they might have different life cycle periods. Therefore, by using life cycle costing, the assessor can point out how costs will behave over time on the different alternatives open to the company. This is especially important because costs can, for example, be low at the beginning of a new investment, and rise greatly during subsequent years. The cost behavior of another choice can be totally different. It can cost a little bit more at first but in the future it may become much cheaper.
This information can be important, because it can be used directly for determining which alternative is the cheapest and which is the most expensive. In process improve-ment planning and development work, this information is very useful: this kind of work concentrates on many processes, and if costs rise too much and value does not increase enough, improvement should be reconsidered using alternative methods.
Target costing can also be considered as a good alternative in process improvement planning and development. This is because target costing determines allowable costs for different alternatives, which can be, for example, functions, processes or products. Target costing is based on market situations and it can also be based on real cost data and planned profit margins for processes. Therefore, target costing not only calculates costs for each alternative, but also creates levels or standards for approved cost levels. The con-cept of approved cost can be considered as a guideline for improvement planning and de-velopment work. It shows the target level of approved cost for different processes; the goal might even be too high, but in any case the company gains information on how high the markets are allowing costs to be. By using this information, the company can then

94
focus, for example, on cutting costs by choosing another production method, hence reaching the approved cost level and attaining success in these markets.
In practice, both cost-calculating techniques are good in that they give exact answers concerning which process is the cheapest and which is the most expensive, and what the costs of other alternatives are. This is important in process improvement planning and development, because development is not worth doing if costs will rise so much that the company cannot handle them. This is true even if processes would improve, and the company would reach higher rating levels.
Screening and selection techniques can also be used in process improvement planning and development. In particular, direct magnitude estimation, cost function analysis, and different checklists provide opportunities to evaluate processes in a cost-effective way. In other words, these methods also take costs into account and rank alternatives by cost information, which is essential for improvement planning and development.
The use of the entire VE process in process improvement planning and development is a good approach. The VE process is a natural choice in cost-effective process improve-ment planning and development. It can be used continuously and the set of techniques, which it uses, is applicable to many different situations. The information phase of VE collects new information, and function analysis addresses processes (called functions) and their costs. Function analysis can give powerful cost information on functions and processes (when used in processes). If used in calculating process values, it can also show the values of each process. From this point of view, improvement planning and development has solid foundations, in which value and capability-maturity -based assessments can be used together.

6 Assessment processes for Value Enhanced Assessment
This chapter presents assessment processes for Value Enhanced Assessment. The new en-hancements presented require partially differing assessment processes. This is because their natures, their assessment targets, and their perspectives on the assessment are different. Capability-maturity -based assessment for VE processes should not differ from normal capability-maturity -based assessment, because the addition of VE processes to capability models merely increases the number of processes, rather than change the way in which processes are assessed. Therefore, it is proposed that to all capability-maturity -based assessments including VE processes the assessment process is adopted from the capability-maturity method in question. Value assessment of processes and products is centered on a value point of view, and thus the natural choice of process to be used in assessment is the VE process. However, when combining capability-maturity -based and value assessments, it is clearly necessary to combine assessment processes as well, because the use of two different assessment processes in one assessment can be confusing. Hence, this chapter explains more precisely what kinds of processes are used in each enhancement. As an example of enhancing assessment processes, this chapter uses the BOOTSTRAP assessment process where necessary, but the same principles can be used when defining assessment processes in relation to other capability-maturity -based assessment methods. Table 8 shows the assessment processes explained in this chapter.
Table 8. Assessment processes for Value Enhanced Assessment
Enhancement Used process Capability Assessment of VE processes Normal Capability Assessment process Value Assessment of processes Normal VE process as assessment process Value Assessment of a product Normal VE process as assessment process Combined Value and Capability Assessment Combination of VE and Capability Assessment
processes

96
6.1 Capability-maturity -based assessment for VE processes
Several capability-maturity -based assessment processes have been described in the literature. Because, from a capability point of view, VE processes are similar to other processes defined in reference models, there is no need to develop a new special assessment process for assessing their capability. When using the BOOTSTRAP method, the assessment process is performed in three main phases: preparation, assessment exe-cution and action plan derivation (Figure 5). The preparation phase has six steps: (for more information see Kuvaja 1999 and Kuvaja & Bicego 1993)
− Pre-assessment briefing − Initialization − Assessment team identification − Collecting supporting material − Planning and scheduling − Defining the confidentiality agreement
The Pre-assessment briefing phase gives reasons for taking part in BOOTSTRAP assess-ment. “Initialization” concentrates on defining the assessment scope and selecting the projects and processes to be assessed. “Assessment team identification” includes the se-lection of the assessment team and interviewees. “Collecting supporting material” provides a chance to examine supporting material such as previous assessment results, quality manuals, etc. “Planning and scheduling” allocates time, defines resources and plans the interviews. “Defining the confidentiality agreement” focuses on determining who is allowed to see the results of the assessment and what type of results he can see. For example, in the company’s, Software Producing Unit (SPU)’s and project level’s confidentiality agreements can differ.
The second phase focuses on executing the assessment process. It includes five differ-ent steps: (for more information, see Kuvaja 1999 and Kuvaja & Bicego 1993)
− Opening briefing − SPU assessment − Project assessment − Evaluation − Feedback sessions
The purpose of the opening briefing is to get into contact with the people to be inter-viewed and to explain how the assessment will be performed. If possible, top-level management should show commitment to the assessment by taking part in the briefing. “SPU assessment” includes manager interviews and evaluation of SPU documentation. “Project assessment” includes interviews and evaluation of project documentation and practice. In the Evaluation phase, the assessors create preliminary assessment profiles. In “Feedback sessions”, the findings of the assessment are presented to the interviewees, feedback is collected and errors are corrected.
The third phase, improvement planning and execution, focuses on documentation and presentation. It includes three different steps: (for more information, see Kuvaja 1999 and Kuvaja & Bicego 1993)

97
− Assessment report preparation − Final report preparation − On-site final meeting
The “Assessment report preparation” includes, for each instance, the assessment and the proposed improvement actions based on the results of that assessment. In the final report, all assessment results, strengths and weaknesses, and a suggested action plan are documented. Finally, the on-site final meeting includes presentations of the assessment results and improvement recommendations.
Fig. 5. The BOOTSTRAP assessment process.
6.2 Value Assessment for processes and products
Value Assessment for processes and products uses the defined VE process. In Value Assessment for processes VE functions are defined to have corresponding processes and/or base practices and management practices. In the question of products, functions are defined to be product’s requirements and/or architectural components (for example software components).
The VE assessment process consists of the following phases (defined in Chapter 4):
PREPARATION
EXECUTION
IMPROVEMENT PLANNING AND EXECUTION End of BOOTSTRAP Assessment
Pre-Assessment Briefing
Opening Briefing
Assessment Report Preparation
Initialization
SPU Assessment
Final Report Preparation
Assessment team Identification
ProjectAssessments
On-Site Final Meeting
Collecting Supporting Material
Evaluation
Progress Check
Activation of the SPI Process
FeedbackSessions
Planning &Scheduling
Defining Confiden-tiality Agreement

98
− Information − Function analysis − Creativity − Evaluation − Development − Presentation.
In practice, during the information collection phase the Value Assessment team collects information about customer requirements, needs, wants and worth as well as the company’s costs. In function analysis the VE team allocates worth and costs to processes (for instance, base and management practices) or products (requirements and architectural components) in order to calculate value indexes. In some circumstances, if there is no customer (if the aim is to assess processes or products for the company’s internal use), it is possible to use the worth defined by internal customer, meaning company’s own unit buying process services and/or products. In the creativity phase, the Value Assessment team examines value improvement possibilities, and in evaluation the team evaluates these possibilities using weighted criteria. In the last phases the assessment team makes implementation plans for the selected value improving ideas and presents them to top-level management (see Chapter 4 for more detail).
6.3 Combined value and capability-maturity -based assessment
Capability-maturity -based and value assessment were originally developed for different kinds of use. As one result of this they both have different assessment processes. When combining these assessments it is important to consider the options which exist. Naturally, it is possible to perform capability-maturity -based assessment first, and when it is done carry out value assessment, or vice versa. However, even if this is possible, and works as a combination, it does not combine the phases (for example, data-collection) to save the assessors time. In other words, by combining certain phases it is possible to create an assessment process which saves both the assessors and the assessed company time.
The company and the assessors need a flexible and easy assessment process, but they might also be interested in focusing the assessment on certain processes. This need may arise, for example, after performing a full capability-maturity -based assessment. The results of this assessment may point to the benefits of carrying out value assessment only on selected processes, rather than performing a full value assessment. Likewise, after performing a full value assessment for all processes, the capability-maturity -based assessment can be focused only on certain processes. This chapter outlines a practical process for the situation in question. Figure 5 shows the basic BOOTSTRAP assessment process as a starting point.

99
6.3.1 Assessment process for combined value and capability-maturity -based assessment
The enhanced assessment process for value and capability-maturity -based assessment is performed in four main phases: preparation, assessment execution, action plan derivation and making VE study (see Figure 6). The preparation phase has six (or seven) steps:
− Pre-assessment briefing − Initialization − Function analysis (where the assessor is using value-based focusing, as explained in
the next section) − Assessment team identification − Collecting supporting material − Planning and scheduling − Defining confidentiality
The pre-assessment briefing step gives reasons for taking part in enhanced assessment. In our newly-developed process, this phase gives also reasons why the VE processes are taken along to the assessment. The initialization phase concentrates on selecting projects and processes to be assessed, or on deciding that function analysis will be used for value-based focusing of assessment. In the enhanced initialization phase, containing VE Function Analysis, the assessor can use VE techniques to make decisions of how important it is to assess each process. The “Assessment team identification” step selects the assessment team and interviewees. This step should also evaluate whether assessors are capable of taking responsibility for the VE sections of assessment or not. In many cases it would be worthwhile to use VE specialists or persons who know VE. The “Col-lecting supporting material” step provides an opportunity to review previous assessment results, quality manuals, etc. In the enhanced assessment process, this step also collects new information, depending on the selection techniques used in selecting processes or in focusing assessment work.
The “Planning and scheduling” step schedules assessment, makes resource definitions and interview planning as before. “Defining the confidentiality agreement” focuses on determining who is allowed to participate to the assessment, and what kind of results they are allowed to see. This phase does not change in the enhanced assessment process. Within the company, SPU and project level, confidentiality levels can differ. This step should also include determination of the VE proposals’ confidentiality level.
If the company is interested in focusing BOOTSTRAP assessment on areas where value creation is the biggest, the assessor could use value-based focusing. Value-based fo-cusing can select the processes which provide the greatest value for the BOOTSTRAP as-sessment process. In the case of value-based focusing, the VE function analysis is placed after the initialization phase, because the focus should be decided before the nomination of the assessment team, since it is important for the team to know what processes are assessed. In proposed place function analysis supports also directly the purpose of initiation phase, which concentrates on selecting projects and processes to be assessed,
The second phase focuses on executing the assessment process. It includes five steps:

100
− Opening briefing − SPU assessment − Project assessment − Evaluation − Feedback sessions
The purpose of the opening briefing is to make contact with the people to be interviewed and explain to them how the assessment will be done. If possible, top-level management should show commitment to the assessment in this step, by taking part in the briefing. “SPU assessment” includes manager interviews and evaluation of SPU documentation. The “Project assessment” step includes interviews and evaluation of practices for getting capability evidence. In the “Evaluation” step, assessors create preliminary assessment profiles, and in “Feedback sessions”, assessment findings are presented to interviewees, feedback is collected, and errors are corrected. In this phase it is possible for assessors to use VE techniques to get some tasks done more easily. For example, creativity techniques can be used in the opening briefing, to create an open atmosphere for assessment.
The third phase, improvement planning and execution, focuses on documenting and presentation. It includes two different steps:
− Assessment report preparation − Final assessment report
The “Assessment report preparation” step is included in the enhanced assessment process, as it summarizes the facts of the assessment results and the calculated capability levels. Possible improvement actions are presented only after the fourth phase. In the final report, all assessment results, strengths, and weaknesses are documented.
The fourth phase, making the VE study, concentrates on finding out which functions or processes create the greatest value. If values are to be calculated for the BOOTSTRAP processes, VE functions are considered to be BOOTSTRAP processes. In practice, the BOOTSTRAP processes described in Figure 29 are used in capability-level calculation and value calculation. On the other hand, if capability levels are calculated for the BOOTSTRAP processes and we need more precise value information, we can use the VE process to divide processes into functions, or we can use existing base and management practices as functions. This phase includes all seven steps of the VE process:
− Orientation phase − Information phase − Function analysis phase − Creativity phase − Evaluation phase − Development phase − Presentation phase.
Note that the VE process is only partially needed if the assessment is based on value-based focused assessments, in which all process values are calculated earlier, after the initialization phase. If this is the case, the phases needed are the creativity, evaluation, development and presentation phases.

101
Orientation is mainly needed for preparing the data file, determining evaluation factors and focusing the VE part of the study. In this step the assessor should build data models and determine team composition. Orientation can be considered as a pre-study.
During the information phase, a data package is completed and the scope of the VE study is modified. The function analysis phase is the most important part of the VE process and concentrates on:
− Identifying functions − Classifying functions − Developing function models − Establishing function worth − Costing functions − Establishing value indexes − Selecting functions for study
In this thesis, it is considered possible to calculate values and costs directly for BOOT-STRAP processes and use this information for improvement (Figure 29), because then we do not need to identify and classify functions. Function models need not be developed, because the process structure is already determined in the BOOTSTRAP process structure. We can calculate values, if we know the least cost to perform the required process or the cost of the least cost functional equivalent. If we want more precise cost and value information, we can calculate costs and values for more specific functions, which are understood to be practices of BOOTSTRAP processes. In this case, certain functions form a certain process. For example, we can identify project management (BOOTSTRAP process) functions, which might, for example, be project planning, implementation and reporting. We can also classify and model these functions as a BOOTSTRAP project management process. After calculating costs and values for these functions we can, naturally, also get information on processes and their costs and values.
During the Creative phase, the assessment team creates a number of development ideas for each function, and the Evaluation phase ranks and rates the different ideas and selects ideas for development. The Development phase conducts benefit analysis, completes a technical data package, creates an implementation plan and prepares a final VE proposal for presentation. The Development phase also prepares a software process improvement plan. It is recommended that the main findings concerning the rated processes should also be taken into account, and their capability levels reported in the final assessment report. This should be done because when the company has a list of rated processes and their capability levels, it would be worthwhile to compare this in-formation to the VE proposals improvement activities, before giving the presentation.
After the enhanced BOOTSTRAP assessment process has been carried out, all changes decided on need to be completed and implemented. After the changes it is also important to monitor the status of the new situation as it develops. The enhanced BOOTSTRAP assessment process, which includes some characteristics and techniques of VE, is the main idea and thrust of this thesis. The enhanced BOOTSTRAP assessment process with the new fourth phase is presented in Figure 6.

102
Fig. 6. The enhanced BOOTSTRAP assessment process
6.3.2 Value-based focusing: BOOTSTRAP example
The focus of assessment work depends on many issues. The assessor ultimately responsible for the assessment (the lead assessor) is concerned with many issues in focusing the assessment work. He can, for example, ask himself questions like:
− What does this company produce? − What is this company’s field? − How many significant processes are there in this company? − How many processes should I assess, and which ones?
PREPARATION EXECUTION VE STUDY, IMPROVEMENT PLANNING AND EXECUTION End of enhanced Bootstrap Assessment * Used in value based focusing. ** Not needed in value based focusing.
Creative Phase
Function Analysis **
Orientation **
Information **
Evaluation
Development
Presen-tation
Pre-Assessment Briefing
Opening Briefing
Assessment Report Preparation
Initia-lization
SPU Assess-ment
Assessment Team Iden-tification
Project Assess-ments
Collecting Supporting Material
Evalua-tion
Progress Check
Activation of the SPI Process
Feedback Sessions
Planning & Sche-duling
Defining Confidentia-lity Agree-ment
VE Function Analysis *
Final Assess-ment Report

103
− How many people should I involve in the assessment work? − Which processes create value for the customer and which do not?
All these questions can be asked when there is a possibility that focused assessment would be better than full assessment. These questions are asked because it is important to know, for example, whether the company produces hardware or software, and which processes produce hardware and which software. It is just as important to know how many processes should be taken into account, so that critical processes will be evaluated satisfactorily, and which processes create the most value for the company and the customers. The main concern for external assessor in focusing the assessment is therefore to give a suggestion to the assessed company of what kind of assessment is suitable for the company’s situation. Assessment can be carried out from a capability or a value point of view and therefore it is not always necessarily a full assessment. It can be focused by carrying out a full capability-maturity -based assessment first and then using this information to focus value assessment on certain areas, or by first performing a full value assessment, and focusing capability-maturity -based assessment on certain processes.
Instead of performing full value assessment and using the results in focusing capability-maturity -based assessment on certain processes, it is possible to carry out simple function analysis on processes to calculate their value indexes. This simple step can be very helpful in focusing capability-maturity -based assessment on areas where the company considers it most needed. In practice, tests for costing can be used in calculating costs for different BOOTSTRAP processes. Life cycle costing can be used to calculate costs over time for different processes as well. Life cycle cost information can also pro-vide a basis for the comparison of different alternatives, even though they might have different life cycle periods. This information can be important because it can be used di-rectly for determining which alternative would be cheapest and which the most expensive over time.
Target costing can also be considered as a good method for focusing the assessment. This is because it can determine allowable costs for different alternatives, for example processes. Target costing is based on market situations and can also be based on real cost data for processes, and planned profit margins. By doing so, it not only calculates costs for each alternative but also creates levels or standards for approved cost levels.
Basically, both cost calculating techniques are good, as they give exact answers to questions like:
− Which process is the cheapest? − Which is the most expensive? − What are the costs involved in different alternatives?
When focusing the assessment from a value point of view, this is important because all possibilities which create a lot of costs should be assessed from a capability point of view as well.
Screening and selection techniques can also possibly be used in focusing assessment work. In particular, direct magnitude estimation, cost function analysis and different checklists make it possible to evaluate processes in terms of cost-effectiveness and these methods also take into account costs, and rank alternatives by cost information, as is necessary in focusing assessments.

104
Together, the Information phase and Function analysis might provide assistance to focusing work. The Information phase collects new information, and Function analysis analyses functions and their costs. Function analysis can hence provide powerful cost information concerning functions’ and (when used in processes) processes’ costs. It can also be used to show the values of each process.
Cost and value information for each alternative can be used in focusing processes, be-cause together they show which alternatives create the most value. Function analysis should be done before the identification of the assessment team, because the calculated costs and values can guide assessment work better if these results are known as soon as possible in capability-maturity -based assessment.

7 Value Enhanced Assessment types and tools
This chapter outlines assessment types for Value Enhanced Assessment. Traditionally, when using capability-maturity -based assessment, these types have been self assessment, focused assessment and full assessment. VE projects have been implemented using teams including technical and business personnel concentrating on products and their components and in practice they have been done using internal and external assessors. As well VE studies have been focused to contain meaningful amount of functions in each VE study. This chapter outlines the needed assessment types and tools for VEA containing: capability-maturity -based assessment including VE processes, value assessment for processes, and value assessment for products.
7.1 Assessment types and tools for capability-maturity -based assessment: BOOTSTRAP example
Three different types of BOOTSTRAP assessment exist: self assessment, focused assess-ment and full assessment. Self assessment is done by company itself, focused assessment contains selected set of processes and full assessment all processes in process model.
All three types of BOOTSTRAP assessment cover or can cover Software Producing Unit (SPU) and project assessments. SPU process assessment focuses on processes that are within the scope of the SPU. It also evaluates project processes based on interviews. Project assessment includes assessment of project processes, based on interviews and evi-dence of the capability in each practice. In practice focused and full assessments are performed by, two external assessors.
Since the enhancement in capability-maturity -based assessment only involves additional processes (not new kinds of process), there is no need for the development of new assessment types and tools for capability-maturity -based assessment. Existing methods already include all the types and tools needed, which makes this enhancement practical for those familiar with existing capability-maturity -based assessment methods.

106
7.2 Value assessment types
Traditionally, VE has been used for product-related Value Analysis purposes. When using VE to assess the value of processes or products, the assessor has at least three options. It is possible to perform value assessment as:
− Self-assessment, where a company implements its own internal assessment using its own resources
− Focused assessment, where assessment is focused on certain processes and/or prac-tices
− Full assessment, which includes all processes (from a reference model or the com-pany’s own process descriptions).
These types are perhaps the most usable, because they work well together with capability-maturity -based assessment, and support the principles of combining capability-maturity -based assessment and value assessment in an effective way. Furthermore, these types are very well inline with VE tradition. Since it has been traditional to analyze value in products using “full assessment”, and the “focusing” has been done on product components, even though these terms may not have been used in the literature. As well in VE history it has been possible to perform self-assessments for products using internal assessors. The proposed assessment types are usable in SPU and project level assessments.
7.3 Value assessment tools
Due to the different purposes of capability-maturity -based and value assessments, both assessments need their own tools. Chapter 4 outlined a partial basis for the necessary templates, plans and reports for VE, and the purpose of this section is to illustrate the most appropriate techniques and tools for use in Value Assessment. The key techniques presented have a long history in VE, despite lacking scientific validation. However, the most important techniques and tools, used to calculate costs and determine value, are clearly more scientific.
7.3.1 Key techniques
Miles (1972, 87-161) has presented thirteen key techniques to be used in Value Analysis. These techniques form the basic technical structure for the VA process. Many other tech-niques have been created, using these as a guideline. Miles (1972, 87-161) emphasizes that the analyst usually needs more than one key technique in every VA process. The thirteen techniques are as follows:
1. Avoid generalities 2. Get all.available costs 3. Use information from only the best source

107
4. Blast, create, refine 5. Use real creativity 6. Identify and overcome roadblocks 7. Use an industry specialist to extend specialized knowledge 8. Get a dollar sign on key tolerances 9. Utilize vendors’ available functional products 10. Utilize and pay for vendors’ skills and knowledge 11. Utilize specialty processes 12. Utilize applicable standards 13. Use the criterion “Would I spend my money this way?”
Avoid generalities
The corollary to this is ‘be specific’ and that is precisely what is meant. A basic statement about anything, but particularly an idea, can be so misleading as to become a formidable roadblock. A typical example of this might be the expression ‘it can’t be improved’, which is a typical roadblock type of generality, guaranteed to daunt even the most ardent enthusiast for change. The idea behind VE, ‘challenge everything’, provides an antidote to this kind of statement by asking ‘why not?’ and ensuring that people work on the root of the problem. In software development, avoiding generalities can, for example, open roadblocks between different development possibilities. For example, in the creativity phase this means that all proposed ideas should be written down before analyzing, evaluating and developing them. In brainstorming it is typical that for example software designers are encouraged to present many usable ideas, which are not necessarily understood by other people; hence these ideas might often be neglected. Avoiding generalities is not allowing general and open solutions to problems, but it claims to find out the defined and usable ones.
Get all available costs
VE sees cost accounting and cost information as very important. The question ‘what does it cost?’ is stated in all VE processes. Meaningful costs bear the same relationship with good value as meaningful tests with good performance. In too many real life cases, deci-sions are made without relevant cost information. Collecting cost information is a complicated task. In a PC manufacturing company, for example, some machines expend more electricity and human resources than others even though they look the same. De-preciation of machines and capital costs of machines are even more difficult to calculate. The VE process encourages the calculation of costs because cost information leads to effective resource allocation. In some circumstances the opportunity to increase the number of machines and decrease the number of employees leads to maximizing value and minimizing costs. Furthermore, if we do not assign all costs to products and we price our products using only a small fraction of the total costs, we are in danger of selling the products too cheaply, and incurring losses.
Use information from only the best source
Misinformation and the lack of good information are the usual causes of a poor degree of value. In VE it is especially important to ensure that all information is taken only from

108
the best sources. In the VA information collection process in particular, one should use the best sources of information. In software development using information only from the best source leads to using the best information, for example, in planning it usually reduces the chance of using the wrong planning methods etc., and at the same time it increases value. In practice, written specifications, reports, calculations and plans should be used instead of beliefs and memories.
Blast, create, refine
This technique helps to reach value objectives. First, it helps to eliminate what is in im-mediate view so that the mind is no longer a prisoner of old thinking which restricts the growth of new ideas. Second, it focuses thinking on basic considerations, and third, it provides a mechanism for building and refining new ideas.
This technique can be very painful, because it challenges old thinking habits, which are usually the creation of the organization itself. Blasting means the generation of new products, services, materials, processes or ideas. Creating provides the means by which the concepts revealed by the blasting can be adapted to accomplish the existing functions. Refining means adopting and adding the new alternatives into practice.
In practice this means that, for example, when selecting a testing method, a company should consider all possible methods as equals when analyzing them. Only this way it is possible to make a balanced recommendation of the best alternative. In reality, many people might, however, have difficulties in considering new methods rather than the old ones already in use, because of natural passive resistance. This technique encourages one to think about what is important in planning and what is not important.
Use real creativity
Using real creativity means that the latent creative talent possessed by most individuals is the most valuable resource, capable of a high output of ideas when properly motivated. The essentials of using this creativity are:
− Brainstorm primary functions − No evaluation during speculation − As many ideas as possible − Wild ideas are encouraged
In the VE process, there are numerous places where the use of real creativity is important. Crum’s (1971, 138) opinion on using real creativity is as follows: “if function analysis is the key to VE, then the use of real creativity is analogous to the force applied to the key when it is required to open the lock to the treasure chest of new ideas.” In software development, using real creativity opens an organization up, to allow consideration of new possibilities for the performance of old processes or functions. Because real creativity does not use any kind of evaluation during brainstorming, all software developers are more willing to speak about their ideas and even wild ideas are encouraged. If the ideas presented were evaluated immediately after someone had presented them, many people would perhaps be too afraid to present any improvement ideas during creativity phases.

109
Identify and overcome roadblocks
One of the biggest barriers in problem-solving is the failure to accept that the problem exists (Crum 1971, 139). This is also the situation in VE. Some of the common road-blocks are:
− There is no better material − This has been proved to work. We won’t change it − It doesn’t make sense but it is policy − The customer like it this way − We know more about this than anyone else − Underwriters would not approve any other arrangement
It is very important that the roadblocks are brought to light as soon as possible. The decision-maker has to have the opportunity to evaluate roadblocks and new ideas, in order to be sure that the new ideas are better than the old ones. In these circumstances, simplicity, improved reliability, and lower cost are very important issues, and need to be demonstrated. For example, in a PC manufacturing company, materials such as processor chips can create roadblocks when improving processing power, because in many circumstances the company uses processors made in other companies, and new, powerful processors are perhaps not available. Identifying this kind of roadblock as soon as possible gives one time to think of other possibilities, for example planning and carrying out other manufacturing activities first in order to use processors as late as possible in the manufacturing process. The other roadblocks listed above describe people’s attitudes, and the danger in them comes from the idea that everything is always in order and nothing can be done better. This is often referred to as “change resistance”.
Use an industry specialist to extend specialized knowledge
Getting the same level of value as competitors, means performing functions as well as the competitors. Getting better value means performing functions better than the competitors. The difficult question to answer is: ‘how does one get better functions than competitors?’ As one solution for this question VE recommends using industry specialists, who are able to extend your specialized knowledge in areas where your own skills and resources are perhaps not enough or could be improved. In a software company, this can mean for example that company is using industry specialists to make databases and company itself makes applications on these databases.
Get a dollar sign on key tolerances
Tolerances are specified as and where required to obtain a necessary fit or to allow essential assembly. Nevertheless, confusion often causes tolerances to be specified un-necessarily, as illustrated in the following situations (Miles 1972, 125):
− The designer ‘thought’ that the tolerance he specified was needed to obtain the required fit.
− The designer ‘thought’ that the tolerance used would not increase costs. − The designer ‘thought’ that the tolerance would be in harmony with available material
specifications defining the needed amount of materials for each product. − Variations of raw materials in past years made it ‘seem’ necessary.

110
In a software company we can understand tolerances as, for example, software bugs which are accepted up to a certain level, but which should be corrected when they rise above that level. It is not enough to say that “in my opinion there are not too many bugs.” The company needs precise information concerning how much each tolerance can vary and what the costs are when tolerances vary.
Utilize vendors’ available functional products
All products are developed to handle one or more main functions. Bicycles, cars, per-sonal computers and airplanes all serve the main functions for which they are designed. These products and their main functions are accomplished by a group of sub-functions. There are usually a great number of functional products on the market. A company can for instance buy motors, lights, batteries and other electrical parts from vendors. These products often cost much less than planning and producing one’s own product to perform the same function. This is a real situation in the markets because specialization usually leads to special knowledge in new technologies and finally to producing new models faster, and with lower costs.
VE emphasizes the use of functional products to substitute own products or their parts if they are cheaper and they fulfill customer requirements. In software markets the possibilities to find substitutes are numerous. Substituting products can be, for example, databases, software emulators, testing programs, or project management programs.
Utilize and pay for vendors’ skills and knowledge
Sometimes it turns out that the company cannot use certain substituting products in production. For example, metal nails might be too short. In this case there are two possible choices. The company can buy metal and machines to make their own nails, or it can utilize a nail vendor’s skills and describe what kind of special nails it wants. Using the vendor’s skills and knowledge may be much cheaper and faster. For a software company, for instance, it is probably more profitable to use all the available time for making own software, and to use vendors’ skills to deliver computers for the software implementation work.
Utilize specialized processes
Generally speaking, processes develop as many other things do. Today, some processes might be fast and cheap but tomorrow they might be slow and expensive. The company should seek opportunities to use specialized new processes where possible. Specialized new processes are usually faster and cheaper, at least over a longer period. In many cases, specialized processes also become the standard processes of tomorrow. In software testing, for example, specialized and even standardized processes designed to test software are more powerful and produce more easily comparable information than testing processes, which are updated randomly using own resources.
Utilize applicable standards
The full meaning of utilizing applicable standards includes the use of applicable standard processes, parts of standard products, engineering concepts, manufacturing concepts, manufacturing processes, and materials. In software production we often need to consider, for example, to which standardized platform we implement our products.

111
Use the criterion “Would I spend my money this way?”
A lot of people use company money differently than their own money. The value of company money seems to be lower than the value of own money. The criterion concerning using one’s own money usually makes people think again, which is important when making profitable decisions. In software development this can be used, for example, to evaluate the use of vendors and their profitability.
The VE key techniques are guides, which enable assessors to understand the VE process and Value Assessment better. Some of these guides are better from the scientific point of view, and others worse. Perhaps the most usable guides are the ones which encourage reliance on written texts rather than memories, and which state that all costs have to be calculated.
7.3.2 Tests for value
In the VE process, value tests are the basic tools used in many situations. These tests comprise ten basic questions, which aid in the determination of satisfactory or unsatis-factory value. The questions can be presented as follows:
− Does its use contribute to value? − Is its cost proportionate to its usefulness? − Does it need all its features? − Is there anything better for the intended use? − Is anyone buying it for less? − Can a usable part be made by a lower-cost method? − Will another dependable supplier provide it for less? − Do material, reasonable labor, overhead, and profit total its cost? − Is it made with proper tooling – considering the quantities used? − Can a standard product be found which will be usable? (Mudge 1971, 27-30)
It has been found that, in 99 percent of cases, when these questions are answered “hon-estly”, value is unsatisfactory, with considerable room for improvement (Mudge, 1971, 30). This situation has also had an influence on the invention of the Value Engineering Job Plan and VE process. These value tests are still the main parts of the whole VE process.
These tests are mainly used as quick tests for checking value. Particularly in creating possible new processes, intended to replace old processes, these tests can be useful. They can easily be used as a guideline for analysis of new ideas, to see whether they create value or not and therefore whether they are useful or not.
7.3.3 Tests for costing
Life cycle costing is a well-known costing method. It is a powerful method for the evaluation of costs over time. It also makes possible the comparison of different solutions

112
and the making of selections between them. Target costing is a method which gives a company targets or aims to be reached. It is effective when considering market situations and comparing the situations of different companies. Both methods can be used in function analysis, as described in Chapter 4.
7.3.3.1 Life cycle costing
Life cycle costing (LCC) is the process of making an economic assessment of an item, area, system, or facility by considering the significant costs of ownership over its economic life, expressed in terms of equivalent costs. The essence of LCC is the analysis of the equivalent costs of various alternative proposals. To ensure that costs are compared on an equivalent basis, the baseline used for initial costs must be the same as that used for all other costs associated with each proposal, including maintenance and operating costs (Dell’Isola 1997, 111).
LCC is used to compare proposals. In comparing proposals it is used to identify and assess the economic impacts of each alternative over their design life. LCC is useful in decision making, because it takes into account both present and future costs. LCC understands the significance of time in the costing process. A certain amount of currency, for example, will not have the same value tomorrow as it has today. The same amounts of money invested today and in the next year do not create the same costs. LCC techniques should also be used in cost-effectiveness calculations and cost-benefit analysis. To make maximum use of LCC, it should be applied at the earliest stages of the design concept, especially during the planning and budgeting, preliminary design, and design development phases.
In comparing present and future costs, each alternative must be considered at a certain point in time. LCC offers two different methods for this. The present worth method expresses all costs in terms of today’s costs, and the annualized method converts costs to an annual series of payments.
Present worth method
The present worth method requires conversion of all present and future expenditures to be based on today’s costs. Initial costs are automatically expressed in terms of present worth. The following formulas are used to convert recurring and nonrecurring costs to present-day values. Recurring costs (24) are as follows (Dell’Isola 1997, 115):
[ (1 ) 1](1 )
n
n
A iP = PWAi i
+ −=
+ (24)
Where:
i = interest rate per interest period (in decimals); minimum attractive rate of return n = number of interest period P = present sum of money (present worth)
113
A = end-of-period payment or receipt in a uniform series continuing for the coming n periods, entire series equivalent to P at interest rate i PWA = present worth of an annuity factor.
Nonrecurring costs (25) (when A = $ 1.00) are as follows (Dell’Isola 1997, 115):
1(1 )nP = F PW
i× =
+ (25)
Where:
F = Sum of money at the end of n, from the present date that is equivalent to P, with interest rate i PW = present worth factor n = number of interest period.
To use these formulas, one needs to determine the rate of return. Naturally, the currency used can also vary and it is possible to use the euro, for example, instead of the dollar. One benefit of these formulas is their ability to calculate costs over time, in terms of using the money value of the time of the decision.
Escalation
Differential escalation (the rate of inflation above the general economy) is taken into ac-count for recurring costs, such as energy, by the following formula (26) (Dell’Isola 1997, 117):
[ ][(1 ) /(1 ) 1] [(1 ) /(1 ) 1]
(1 ) /(1 ) 1
nA e i e iP = PWAe i
+ + − × + + −=
+ + − (26)
Where:
e = escalation rate A = $ 1.00 n = number of interest periods I = interest rate per interest period (in decimals) PWAe = Present Worth of Annuity escalated
Where:
e = 1 P = An
There are many combinations of interest rates, interest periods and discount rates in different commonly presented mathematical tables. In practice the rate of inflation also varies in different costs, for instance, from energy, building, service and rents to traveling

114
and so on. For example, in a software company, statistical tables can be used to determine the escalation for rent (if the company uses rented production buildings). It is possible to use euros or other currencies, instead of dollars, in this formula.
Annualized method
The annualized method converts initial, recurring, and nonrecurring costs to an annual series of payments. This method may be used to express all life cycle costs as an annual expenditure. The annualized method can be presented as follows (27) (Dell’Isola 1997, 117-118):
(1 )(1 ) 1
n
n
i iA = P PPi+
=+ −
(27)
Where:
A = Annualized cost P = $ 1.00 I = interest rate per interest period (in decimals) n = number of interest periods PP = period payment factor.
For nonrecurring costs, Dell’ Isola (1997, 119) suggests using Equation 25 to convert fu-ture expenditure to current cost (present worth), followed by Equation 27 to convert to-day’s cost (present worth) to an annual expenditure (annualized cost). Since all costs are expressed in equivalent dollars, for both the present worth and the annualized methods, the life cycle cost is the sum of the initial, recurring, and nonrecurring costs, all expressed in equivalent dollars, he continues. If necessary, another currency can be used instead of the dollar.
Calculation of the present worth is quite often referred to as discounting. In dis-counting, the rate is called the discount rate. The discount rate means the minimum acceptable rate of return for the client for investment purposes, or the current prime or borrowing rate of interest. This rate should be formulated carefully. The source of finance (loans or own capital), the client (field) and the rate of return for the industry all influence the discount rate. Sometimes these calculations are done based only on the cost of loans, which leads to a wrong value for present worth.
Escalation has effects on LCC and is therefore accommodated in LCC by expressing all costs in terms of constant dollar. The purchasing power of the 1997 dollar is different from that of the 1999 dollar, for instance. The effect of this is canceled out by using items with equal escalation rates. If cost elements include varying escalation rates this should be taken into account in calculations.
Depreciation periods, methods and time frames may vary in different industrial cases. The depreciation periods should be considered carefully, because depreciation represents the amount of wasted assets in a certain period. The different depreciation methods are usually based on straight-line depreciation or on a sum of the years digits depreciation.

115
In LCC calculations the amortization period is the time over which periodic payments are made to discharge the debt. Salvage (residual) values are used when evaluating alter-natives with unequal useful lives during the economic life cycle period. In these situa-tions a salvage or residual value must also be established.
7.3.3.2 Target costing
Target costing begins by establishing the long-term sales and profit plans of the firm. These plans are based on a careful segmentation of the market so that a limited number of products satisfy the maximum number of customers. Once the products in the product line have been identified, their target selling prices can be established (Cooper & Slag-mulder 1997, 106).
The target selling price is set by careful analysis of competitive market conditions and customer expectations. Once the target selling price is set, the company can set a target profit margin based on its own experience. The target profit margin must take into ac-count life-cycle effects. Subtracting the target profit margin from the target selling price gives the allowable cost. The allowable cost gives the cost at which the product should be manufactured if it is to produce the target profit margin. The term of allowable cost is often a theoretical concept, since it does not include the company’s or its vendors’ real costs but is set as an estimate. When allowable costs are not achievable and target profit margin is fixed, the target costs increase target selling price (Cooper & Slagmulder 1997, 87-106). The process of calculating allowable cost is shown in Figure 7.
Fig. 7. Calculating the allowable cost.
Product-level target costing consists of three major steps. The first step is setting the tar-get cost of future products. The second step is bringing discipline to the target costing process and the third step is achieving the product-level target cost (Cooper & Slagmulder 1997, 127).
The product-level target costs take into account the company’s and its vendors’ manufacturing realities by calculating the real costs created in the company. Hence, they differ greatly from the concept of allowable costs. Together, these concepts formulate an efficient background to enable one to set goals and understand the company’s current situation. Bringing discipline to the target costing process includes a strict monitoring of product and component costs. Often, an increase in the cost of one component causes cost reductions in other components. This should also be taken into account in the costs of the product.
Market Conditions
Target Selling Price
Target Profit Margin
Allowable Cost

8 Using Value Enhanced Assessment
8.1 Case study method
The research method used in this section is a case study. Typically, a case study is an em-pirical inquiry that meets the following criteria: (Yin 1994, 13)
− It investigates a contemporary phenomenon within its real-life context, especially when
− The boundaries between phenomenon and context are not clearly evident.
In this study, all three assessments were implemented with real-life data. During the as-sessments, the assessor read several documents and guaranteed the findings using several interviews with different people. Typically, in value assessments, the assessor also organized teamwork sessions to find value improvement ideas, and to evaluate and de-velop them. Since the boundaries between value assessment phenomena and assessment context were not in every detail evident, the presented cases are reported as they hap-pened. This perhaps also helps in keeping to the real-life context and in drawing conclu-sions for each defined phase separately.
Methodologically, the applied research method can be understood also as case, be-cause the inquiry: (Yin 1994, 13)
− Copes with the technically distinctive situation in which there will be many more variables of interest than data points, and as a result
− Relies on multiple sources of evidence, with data needing to converge in a trian-gulating fashion, and as another result
− Benefits from the prior development of theoretical propositions to guide data col-lection and analysis.
All of the selected case companies represent normal software companies. Company A is an independent subsidiary of a large global corporation developing electronic products and systems and Company B operates in international software markets with several of-fices in other countries. Company C is a large corporation with several subsidiaries. All of the selected companies produced products using a project organization which was

117
managed by project managers. If they were not able to make necessary decisions, prob-lems were solved at director level.
All three cases were organized so that it was possible to draw individual conclusions from each of them and gather experiences concerning all proposed assessment enhance-ments separately. With this aim in mind, the first assessment, in Company A, covers capability-maturity -based assessment for VE processes and products, the second assessment, in Company B, covers value assessment for processes and the third assessment, in Company C, covers value assessment for products. The purpose of all three assessments was to collect actual experience concerning:
− How the proposed enhancements work in practice − The strengths and weaknesses of each enhancement − Whether the enhancements support the value-based approach to successful software
engineering − Whether the companies assessed see the enhancements as useful.
The research design that links the data collected to the initial questions of this study also follows the principles of multiple-case design. Multiple-case design was selected because it has been considered to be more robust than pure single case design, especially when forming common conclusions concerning all the proposed enhancements.
After all the individual cases, cross-section conclusions are partially made, over all the cases, in conclusions chapter.
8.2 Capability-maturity -based assessment for VE processes: Company A
This assessment was performed as a full assessment during May and June 2003, using the BOOTSTRAP Process Assessment and version 3.2 of the Improvement Methodology, with enhancements in the Value Engineering process area. The assessment was sponsored by the Managing Director, facilitated by the Human Resource Assistant, and assessed by two assessors.
As the BOOTSTRAP methodology dictates, the assessment was conducted at two levels:
− SPU, defined as Company A − Project, consisting of Projects A and B
The SPU-level assessment focused on determining the overall company maturity and process capabilities in software development. These capabilities describe how well the company has agreed, defined, described, deployed and kept updated the processes needed in mature software development. The overall maturity level gives an indication of the achieved institutionalization of all identified processes within the target organization. Project-level assessments are aimed at evaluating how the processes are applied and managed within projects.
The SPU-level assessment was performed by analyzing all available documentation for Company A, and by interviewing five employees in total. Interviewed employees

118
represented Company A’s executive management, financial management, resource management, sales management, human resources management and software development areas. The project assessments were performed by analyzing all available and relevant project documentation for Project A and Project B, and by interviewing in total eight employees from their management, quality management, product marketing, testing and software engineering areas. In all, SPU- and project-level documents included:
− Strategy plans − Project plans − Process descriptions − Budget principles − Cost accounting principles and calculations − Financial statements − Personnel task lists − Infrastructure definitions − Selling agreement templates − Personal development discussion templates − Architectural descriptions − Product requirement definitions − Product testing plans − Configuration management plans − Quality plans and reports
The assessment process used included all the phases defined in Chapter 6. The main phases were preparation, execution, and improvement planning and execution. This chap-ter explains the results of evaluating VE processes phase by phase, since the focus is on finding out how well the enhancement works. As there is also an interest in seeing how the capabilities of VE processes rate in comparison to all other processes, this chapter also presents an overall picture in which all processes are included.
8.2.1 Preparation
During the pre-assessment briefing, external assessors explained the benefits of taking part in BOOTSTRAP assessment. The purpose of capability evaluation was explained as well as the content of VE processes. The purpose of the assessment was explained as determining short-term and long-term improvement initiatives for the software production process in Company A. These initiatives were explained to support the overall business goals and software development improvement objectives of the Company. Company A presented its overall business goals and the software development improvement objectives as follows:
− To double the number of tenders for projects to customers − To attain bigger and longer projects − To improve human resource allocation in the projects so that the usage level comes
close to 90 %

119
− To improve the spirit of Company A within the company group by situating all personnel in the same physical location
− To improve the understanding of product development within projects, in which the software developed becomes a part of the final product (embedded systems viewpoint).
Additionally, Company A stated that it was aiming to implement into practice some of the ISO 9001 certification-related standards in the near future. This effort was going to be undertaken based on parent company’s earlier implementation.
In the initialization stage, the assessment content was discussed, and since the company was interested in full assessment, this was implemented. After a discussion with the external assessors, the top-level management of Company A decided the two projects to be assessed and also that the assessment would be carried out at the Software Producing Unit (SPU) level. It was decided that evaluation of the company’s current status against ISO 9001 requirements was to be an additional outcome of the assessment. Project A and Project B were selected for the assessment to represent software development at project level over the entire life cycle of the development process, and to determine the effect of organizational change taking place in the company at project level. Both projects belonged to the main business area of Company A.
During the identification of the assessment team, one external assessor was nominated as lead assessor, and the other one made responsible for implementing the assessment on VE processes. Company A gave the assessors a list of employees working at SPU level and in projects A and B, along with job titles, and based on this list the assessors proposed interviews to some of them. Since this was the first capability-maturity -based assessment in Company A, no previous assessment results were available. However, to start the assessment, Company A provided the assessors with the necessary supporting material, including project plans, requirement plans, testing plans and architectural plans for all projects. According to the project plan, the purpose of Project A was to develop technical help for elderly people so that they could stay at home longer rather than being transferred to the elderly care organized by the municipality. The system was based on the use of PCs and GSM mobile phones. Project A had the following targets:
− To transmit information from mobile phone/portable device to PC − To transmit information from PC to network − To offer touch-screen monitors which enable the user to make phone calls to relatives
by touching images on the screen
In process improvement, Project A had the following objectives:
− To change the project business style from “hand to mouth” oriented to long-term ori-ented and forecasted
− To focus software development expertise on using the Windows environment, rather than working with many different operating systems
− To improve recruiting, taking a longer-term view and aiming to get more experienced personnel
According to the project plan, Project B developed measurement software to save and handle measurement data from mobile phones to PC. Project B was also a software-

120
updating project. Specifically, Project B had the following product development objectives:
− To update the functionality of the measurement SW to match the new HW − To implement new SW features in the measurement tool
In process improvement, Project B had the following objectives:
− To improve the quality of specifications and code − To increase the expertise of the personnel in specific topics, through training − To improve human resource management and use of human resources at the project
level − To improve the division of labor and planning in projects − To describe the changes needed in SW development processes
Based on these goals the assessors described product improvement goals, as follows:
− Improve predictability and control of resources and quality − Improve understanding of the product development − Improve correctness of the results (specification and code)
After describing these goals the assessors discussed the confidentiality agreement with the Managing Director, who decided that it was possible to make the assessment’s results available to the interviewees and, to some extent, to publish them for research purposes.
8.2.2 Execution
The second phase focused on executing the assessment process. During the opening briefing, top-level management, along with external assessors, explained the purpose and content of the assessment and interviews to the personnel to be interviewed.
After reading the SPU-level documentation, the assessors interviewed managers for SPU assessment. Project assessment included interviews and evaluation of project docu-mentation. The results of the BOOTSTRAP assessment included:
− Maturity levels − Process capability profiles − The main findings concerning the processes
Since BOOTSTRAP methodology makes it possible, maturity levels were defined for:
− The SPU − Each project assessed − The projects combined − The SPU and its projects combined (overall maturity)
The process capability profiles were used to describe the capability levels of each process assessed, grouped by process cluster. The results of the assessment are outlined in the following sections.

121
8.2.2.1 Maturity levels
The following bar chart (Figure 8) shows the overall maturity level of the SPU, including the following categories and processes:
− Organizational processes, containing:
− Business engineering − Human resource management − Infrastructure management − Reuse − Product strategy formulation
− Life-cycle-dependent processes, containing:
− System requirements analysis − System architecture design − Software requirements analysis − Software architecture design − Detailed software design − Software implementation and testing − Software integration and testing − System integration and testing
− Support processes, containing:
− Documentation − Configuration management − Verification − Joint review
− Management processes, containing:
− Project management − Quality management − Risk management − Subcontractor management
− Customer-supplier processes, containing:
− Customer needs management
− Value Engineering processes, containing:
− Information − Function analysis − Creativity − Evaluation − Development − Presentation

122
0.00 1.00 2.00 3.00 4.00 5.00
Overall maturity
Life-cycle-dependent
Customer-supplier
Management
Support
Organization
Value Engineering
Level
Fig. 8. SPU maturity profile
Generally, the SPU-level overall maturity is based on the detailed scores of all the under-lined processes and base practices. The overall maturity level is decreased by the low capability of the Organizational processes and Value Engineering processes.
The following chart (Figure 9) presents the overall project maturity of Projects A and B, as well as their combined maturity.
Fig. 9. Overall project maturity profile
0 1 2 3 4 5
Overall maturity
Lif e cycle dependent
Customer-Supplier
Management
Support
Organisation
V alue Engineering
Le ve l
Projects
Project B
Project A

123
The combined overall project maturity of the projects is equal to the SPU maturity, i.e. 1.50. Appendix 3 contains maturity trees that describe the maturity levels defined for the various elements of the BOOTSTRAP process structure, and for various combinations of the SPU and its projects.
8.2.2.2 Capability levels and main findings concerning VE processes
The purpose of the capability evaluation for VE processes was to find out how capable the SPU and projects were in Value Engineering processes. The processes evaluated were: Information (VAL.1), Function Analysis (VAL.2), Creativity (VAL.3), Evaluation (VAL.4), Development (VAL.5) and Presentation (VAL.5). These processes were evalu-ated for SPU and both projects. Figure 10 shows the capabilities of the processes.
Fig. 10. Capability profile of Value Engineering processes
Information
At SPU level, Company A collected value-related information when attracting new cli-ents and conducting customer meetings. Collected information included customer opinions of worth for products and their components. The interviewees emphasized that this information was sometimes updated on an ad hoc basis. They also explained that they always took budgetary cost limits into account when deciding to start new projects. Budgets were made in a company and project levels. However, there was no plan explaining what kind of information should be collected, when and by whom. Furthermore, there was no evidence of work products or templates which could be used
0 1 2 3 4 5
Information
Function Analysis
Creativity
Evaluation
Development
Presentation
Level
Project B Project A SPU

124
to collect value-related information. All the interviewees agreed on the benefits of having a more precise understanding of customer needs and wants, and using templates to analyze these requirements, as well as customer priorities, timetables and technical wishes. At that time, projects were too often started without this information, and this led to problems in planning and prioritizing project work, especially in the starting phase. The interviewees also claimed that they attempted value improvement internally by holding development discussions with personnel. These discussions were planned but there were no agreed templates or processes for how to carry them out. There was no other evidence of internal company processes for collecting value-related information.
In Project A, interviewees pointed out that only the project manager collected customer-related information. The clearest example of the information what project manager collected included customer’s budgetary limits as well as a general list of customer needs. However, no templates, plans or specifications were found, which could have defined the way this information was collected. Interviewees stated that the human resources assistant collected human resources-related information for personal development discussions.
In Project B, interviewees stated that during technical meetings they collected in-formation about customers’ needs. This included information about customers’ budgetary limits and requirements. This information was discussed in project meetings. However, in Project B there was no evidence of the existence of requirements for what kind of information was to be collected, or how this should be done. The interviewees said that it happens as a behavior-based activity. Internal value-related data was collected for the purposes of personal development discussions.
Function analysis
Based on the SPU interviews, the classification and processing of value-related information was happening only in customer meetings and in personal development discussions. Customer- and Company A-related budget limits were assigned to tasks when setting work priorities, but there was no plan, template or criterion as to how prioritization should be done. The interviewees explained, however, that the company measured its resources for customer meetings in order to be able to make decisions about new projects. Systematic plans for classifying activities and processing customer-related value information were missing, and budgetary limits were not taken into account systematically in classifying activities for cost, worth and value calculations. There were no clear cost accounting procedures or principles for the assignment of costs in meetings either. In practice, financial personnel categorized costs in bookkeeping and allocated them to project / cost centre numbers using computer programs.
In Project A, the interviewees stated that the chief designer classifies technical issues and the project manager classifies the rest of the information collected in customer meetings. Furthermore, it was noted that software development costs, based on estimates, were assigned to architectural design objects. Classification took place in a problem-oriented way, case by case, and there was no plan for this process. A systematic plan for classifying customer worth for activities was also lacking. Generally, the project manager was aware of the project costs, but he and other project members did not know which components were the most profitable ones. Due to the implementation problems, however, they knew which features they had used too many working hours on.

125
In Project B, the findings showed that budget and resource information was identified and costs were assigned to the designed tasks and components. The project manager also stated that, based on customer meetings, he collected information about worth for each stated requirement, and that sometimes he found it exceptionally difficult to assign the worth from requirements to architectural design components. In Project B, cost and worth were compared on a task basis, but a systematic plan for classifying activities and customer-related worth information was lacking. Information collection occurred because the project manager was interested in it as general information.
Creativity phase
At SPU level, creativity sessions existed, and these were organized in two teams: a pro-ject manager team and a technology team. These teams “brainstormed” problems if they existed. However, there was no plan to do this to improve existing activities, where there were no problems. In other words, creativity occurred when facing a problem. Once a year, in personal development discussions, people were encouraged to think positively and develop new creative ideas as well. However, besides the development discussions there was no other plan with defined activities for creativity.
In Project A, the interviewees stated that creativity sessions were held on an ad hoc basis in customer meetings and technical meetings. In Project B, interviewees said that creativity sessions occurred during personal code writing, development discussions, and sometimes in customer meetings.
Evaluation
Based on the findings at SPU level, a basic procedure for eliminating nonsense ideas in personal development discussions and customer meetings existed. However, there was no evidence of criteria being used to evaluate competing ideas. Furthermore, a clear ranking method, procedure and plan were absent when evaluating new creative ideas against normal working habits.
In Project A, the findings showed that the technical lead evaluated nonsense or “thought-provoker” ideas which appeared during SW development work. However, he did not have a plan, methods, procedure or templates for this work. In Project B, the findings showed that senior developers eliminated nonsense or “thought–provoker” ideas, which arose in SW development work, but no ranking method, procedure or plan for dealing with competing ideas was present.
Development
Based on interviews it was noted that quantitative development of new ideas, took place only at SPU level. The interviewees explained that projects did not have sufficient resources to develop bigger ideas, which would need further development. At SPU level, development meetings were held based on personal development discussions. This was done using all data from development discussions, to develop activities further. Data was analyzed using budget, technical know-how and personnel’s interests as criteria and results were often compared to company’s strategy. However, there was no evidence that development of evaluated ideas would have systematically taken into account customer’s interests or wishes.

126
Presentation
In the SPU-level findings, it was noted that value-improving ideas based on personal development discussions and the annual morale survey for personnel were analyzed in teams and presented to the Executive Manager. This activity was related to internal value improvement as well as development discussions.
In Project A as well as Project B, the project manager was responsible for presenting improvement results from weekly meetings to the Executive Manager. Improvement ideas were also presented orally in weekly project meetings. However, these ideas did not go through a development phase, but were presented without further development to the Executive Manager, who decided how they should be developed further.
8.2.2.3 Improvement planning and execution
Before entering the third phase, improvement planning and execution, the assessors presented all findings to the personnel interviewed, to find out whether they were correct. Feedback was collected and errors were corrected.
In improvement planning and execution, assessors concentrated first on assessment re-port preparation and later on the final meeting with interviewees.
The preparation of the assessment report was done using normal BOOTSTRAP templates enhanced with VE process assessment data. All templates were considered to in place and the use of them did not cause any problems. In the final report all assessment results, strengths and weaknesses, and a suggested action plan were documented for the VE processes as follows:
− Strengths: Value Engineering-related information is collected from customer meetings, project meetings, personal development discussions and, on an ad hoc basis, from company-customer collaboration meetings.
− Weaknesses: Value Engineering-related information is not analyzed systematically using agreed methods and there is no information-gathering plan. Value improvement ideas are not presented using specified templates.
When formulating the improvement proposal, the trained BOOTSTRAP lead assessors did not see any difficulties in applying capability-maturity -based assessment to VE processes. They also saw that it was natural to formulate improvement recommendations of VE processes for Company A. Table 9 presents the goals of the SPU, and related processes are presented as they were ranked at the beginning of the assessment process. It should be pointed out that as a result of the assessment VE processes as well as Business Engineering process, which already existed in BOOTSTRAP model rose for a topic for improvement. This perhaps gives support to the idea that there is dependency between Value and Business Engineering processes. In this assessment, VE showed the most need for improvement, being of the highest priority (1, using 1-4 rating) in relation to Company A’s business goals. Table 9 also includes capability levels for the evaluated processes.
Using the results shown in Table 9, the following priority order was defined for the processes to be improved:

127
1. Information (VAL.1) 2. Function Analysis (VAL.2) 3. Creativity (VAL.3) (4. Business Engineering (ORG.1))
Table 9. Goal-related prioritized improvement areas
In order to improve the above-mentioned areas, the following actions were recommended:
1. Information (VAL.1)
Systematic value information collection is the basis which will enable development of value in all activities. Therefore a plan explaining in which level of processes and practices costs, worth and value are calculated to improve these activities is clearly needed. Defined plan should also explain when and for which kind of lifecycles this information is collected.
2. Function Analysis (VAL.2)
Based on the collected value information, there should be regularly-organized value analysis sessions at all organizational levels.
3. Business Engineering (ORG.1)
Business Engineering should be improved so that it is better-planned and more long-term-oriented.
4. Creativity (VAL.3)
Value improvement sessions should be planned and organized for all organizational levels.
Considering the existing priorities of Company A, it was recommended that the above-defined improvement actions be implemented within 12 - 18 months, as represented in Table 10 as follows:
GOALS and PROCESSES CAPABILITY Goal Ranking Related process SPU Proj A Proj B Business 1 (ORG.1 Business Engineering) 1.25 - - Possibilities 1 VAL.1 Information 1.25 1.5 1.25 1 VAL.2 Function Analysis 1.25 1.75 1.75 1 VAL. 3 Creativity 1.25 1.00 1.25

128
Table 10. Improvement actions and overall schedule
8.2.3 Strengths and weaknesses of capability-maturity -based assessment including VE processes
The purpose of all the assessments was to collect experiences concerning:
− How the proposed enhancements worked in practice − The strengths and weaknesses of each enhancement − Whether the enhancements support the value-based approach to successful software
engineering − Whether the companies assessed saw the enhancements as useful
The proposed enhancements worked very well in practice. Both external assessors agreed that this kind of enhancement, which places well-defined templates and assessment processes into the existing model, was easy to adopt. The existing model provided a clear framework in which the assessors could evaluate the new enhancements, as well. Both of the assessors, and Company A, felt that the process for doing capability-maturity -based assessment including value processes went according to the presented plans. The initial meeting included enough information about the purpose of the assessment. Interviews were clear, and questions related to value processes were systematic, reasonable and in balance with the BOOTSTRAP model.
In addition to a clear assessment process and model, the scoring of value processes was considered to be easy, with possibilities for comparison with all other processes. From the assessment work point of view, one of the strengths was that the normal assessment software was easy to use when assessing VE processes as well. Assessment findings were written using the assessment tool and they were reviewed together with the Company A in order to attain a precise understanding of all possible details. There was no need to develop any new tools for assessment purposes.
In the final assessment meeting, the interviewed personnel stated that they were satisfied at the number of interviews, and they felt that all necessary details were listened to, and that the interviews gave a true and fair view of work practices in their company.
Since no findings suggested that the enhancement would not have worked together with the BOOTSTRAP model, the underlying weaknesses are perhaps related to the fact that this was only a single assessment. To draw more convincing conclusions from an empirical point of view, more assessments are clearly needed. According to this assess-ment this would be worth doing not only because it seems to work as an enhancement,
Months Improvement Action 1 2 3 4 5 6 7 8 9 10 11 12 13 14 15 16 17 18
Information (VAL.1) × × × × × × × × × × × × × Function Analysis (VAL.2) × × × × × × × × Business Engineering (ORG.1) × × × × × × × × × × × × × Creativity (VAL.3) × × × × × × × × × × × × ×

129
but also because Company A realized that the results were helping in planning improve-ment proposals for software processes.
In the final assessment meeting the interviewed personnel explained that, in general, the BOOTSTRAP method suits the development of new products. However, it was emphasized that the method does not deal very well with products which are under continuous improvement. This comment is based on the idea that a new product is made only once, and the processes developed to make it are unique. After the product has been made it undergoes continuous changes, and the BOOTSTRAP method does not support this kind of development very well. Therefore, it was suggested that in order to be more effective, software engineering improvement should also take into account product-focused assessment. From a critical point of view, an observer could also conclude that when carrying out capability-maturity -based assessment for VE processes, the enhancement does not take into account real costs, worth and value, but only a capability point of view of these. Naturally, this is true, and from the model developing point of view this outlines a way to real value assessments, where costs, worth and value are calculated for the entire life cycle and if there is not enough actual cost information, some information is estimated. In conclusion, it is possible to say that the proposed enhancement supports the value-based approach to software engineering, but it is not necessarily enough when taking a value point of view of software process improvement.
During the final assessment meeting with Company A, the Value Engineering (VE) part of the assessment was discussed, with great interest. Perhaps one of the most significant managerial findings was that value seemed to combine technical and economical personnel. The topic of value improvement led to discussions concerning “How much time do we use for normal routines? Why do these routines take so long? Can some technique help in making these phases quicker?” Some interviewees also described how value discussions lead the focus of software development to outsourcing areas too. In other words, actions which are difficult and time-consuming, and therefore expensive, should be outsourced. The focus should be on the activities in which value is created.
In discussion it was also notified that mature VE requires mature cost accounting. Since in Company A costs were calculated only for each project and SPU, it was difficult to see how much each product, product component or requirement would cost. In practice, these calculations were made based on estimated needed work hours and average salary. As well it was difficult to see which customers are the most valuable, since customer level systematic cost accounting was not applied.
As a whole the Information, Function Analysis and Creativity phases were seen more mature than other phases. Value related information was collected, partially analyzed and creativity sessions were held as well when problems were faced. However, evaluation took place only when different alternatives existed and systematic tools to implement it were missing. As well missing were clear developing sessions and presentations for value improving ideas into practice.
In conclusion, all interviewees in Company A were satisfied with the assessment experience. They agreed that: “it was positive that there were so many interviews and that value-related work practices involved technical and economical personnel as well as customer interests in all discussions.” According to the designers, these interests were not always taken into account sufficiently. When the assessors asked whether VE processes

130
should be defined in capability-maturity models as their own process cluster, all employees supported this idea, as opposed to building them into reference model practices, where their capability would be hidden.
These assessment experiences showed that when making an improvement proposal, Value Engineering should be considered as own process entity or cluster. This was due to the situation that it was natural to see VE processes as own entity and determine maturity, capabilities, strengths and weaknesses for them. The visibility of economical point of view also increased when it was seen comparable and equal with other activities in the Company A. Perhaps the final discussion between the technical and economical personnel in the Company A would not have combined technical and business interest as well either if VE processes would not have had own capability levels.
In practice, during the assessment it was seen that the capability of using economical tools & methods may also vary significantly and therefore the different levels of capability when assessing them seemed to be natural. In SPU level the financial personnel was fluent in using economical tools and methods but missed the technical expertise to allocate then to process practices or product components. In project level technical personnel was not familiar with economical tools & methods but understood the process and product structures were costs should have been allocated. During the assessment, partial value index calculations supported this same point of view by showing that the ability to calculate real costs, worth and value for processes may vary significantly, because cost accounting is not necessarily applied to all the areas where it should be from a business goals point of view. As well it was easy to notify that the development of value improvement ideas was low in maturity. This was due to the observation that usually Company A implemented ideas after evaluating them.
Generally, all assessment results found are reliable. The reliability of the results was also improved significantly because the assessors interviewed several people and went through the same questions with them. Interviewed results were also compared to existing written material to check their equality. Since both assessors had also passed the lead assessor requirements for the BOOTSTRAP method, the interpretation of findings should be reliable.
8.3 Value assessment for processes and products: Company B
8.3.1 Background
Value assessment was implemented in Company B in fall 2004. It was based on focused evaluation of both processes and products. This approach was taken because Company B was interested in gaining experience of both kinds of value assessments. At first it did not know whether its cost accounting would be able to provide the necessary cost data for all processes and product components. Based on this, one purpose of the assessment was also to help to give information on how to build a cost accounting system for tracking process and product costs. The assessment was supported and sponsored by the high-level management in Company B.
131
During the first meeting, the assessor explained the purpose, content and plan of the value assessment to the personnel who were to be interviewed. The definition value=worth/cost was discussed, and it was seen as extremely important to find out which components of the product gave the best value to the vendor without neglecting customer needs. Since there were several customers for the product in question, it was not possible to include all customers in the assessment. Therefore, Company B decided to base worth calculations on ideal production costs, which represented the cheapest way of building a product or running a process.
In the meeting, Company B gave a comprehensive presentation of the company and its products. Company B’s product is a software product produced for around twenty operat-ing system environments. The main problem presented by Company B was that there was no real understanding of all the environments and their profitability. In other words, Company B did not know which operating systems gave the best value for the product and the company. Neither was it sure where the development and maintenance effort should have been focused. Some processes were attached to value assessment, because Company B saw that they were closely related to product development, and value information was needed for them as well.
Since the assessment was to include product, process and accounting system evaluations, there was a wide range of material to be analyzed. It included documents such as:
− Strategy plans − Project plans − Process descriptions − Budget principles − Cost accounting principles and calculations − Invoice approval and handling procedures − Financial statements − Personnel task lists − Infrastructure definitions − Selling agreement templates − Personal development discussion templates − Architectural descriptions − Product requirement definitions − Product testing plans − Platform definitions and manuals − Configuration management plans − Quality plans and reports − Accounting system definitions and user manuals
8.3.2 Information
The product assessed was a typical software product. It was developed and tested in the R&D department of Company B. Personnel in the sales department, together with

132
requirement engineers and technical personnel, defined the requirements for different product versions. Based on the available resources, these requirements were mapped to new product versions. The product was developed using the standard C language. The overall goal of product development was to produce different versions of the product for different operating system environments, using the same base code. Unfortunately, this was not possible because, in practice, there was always a small part of the product that had to be coded separately for each operating system environment. In practice, the product was a collection of sub-products that were selected by the customer to provide the software combination required.
There were more than 20 platforms for which the product was made. Company B had divided the supported operating systems into three categories: 1) easy; 2) difficult; 3) very difficult. For category one operating systems, the product was prepared every time the version or a product was changed. For category two, a new package was prepared twice a year, and for category three, the package was created on demand. Company B received income from product license fees and maintenance service fees. There were two different licenses. A runtime license was used when the product was used as is, and a development license when it was used as a part of the customer’s product.
Company B had a strong interest in analyzing priorities and worth in its product requirements and architectural product components for further product development work. However, when planning the assessment it was considered obvious that Company B does not have cost accounting system for architectural components, and simple estimation, not based on real calculated cost, was not considered to be good enough. Therefore it was decided that value indexes would be calculated for the prioritized requirements and component-level assessment would be postponed to the following year, when cost accounting would be able to produce the necessary component-level cost information. Based on a discussion of requirement- and component-level cost accounting, it was agreed that component-level cost accounting presented more challenges in implementation than requirement-level accounting. This was due to the fact that, based on customer meetings, salesmen had a fairly good awareness of how customers prioritize and allocate worth to requirements, but at the architectural, component level, customer was lacking enough experience to understand technical product structure enough and worth allocation was therefore not as easy. Customers did not necessarily know how the product was classified into components, or what each of these components did. Nor was Company B interested in giving precise component structures to customers for worth-calculation purposes. Therefore, component-level worth calculation was beyond the scope of this assessment, although Company B underlined it as an interesting challenge for evaluating value inside the company.
Based on a discussion in the information phase, it was noted that Company B did not have platform-level cost accounting, which would follow costs for the more than 20 platforms. Therefore it was not possible to use actual cost, worth or value information for each platform separately. However, the assessor pointed out that if Company B was interested in basing the assessment strongly on estimates, using existing cost information as a pool, it would be possible, using estimation, to allocate those costs to architectural components as well as to all platforms. Since Company B was more interested in gaining actual, rather than estimated cost information, it was decided that product-focused value assessment would only be carried out on three high priority operating systems, and

133
Company B would create accounting identifiers for each platform after the assessment. Based on this information it was decided that value assessment would be performed as well as possible and the company would create accounting identifiers to follow costs and income for each platform later. Product-focused assessment was implemented for the following operating systems:
− Windows, Linux, Solaris and HP (easy) − QNK (difficult) − UX (very difficult).
Company B had participated in a capability-maturity -based assessment in the past. The results of the capability-maturity -based assessment were available when collecting information. Also available were all process descriptions written in Company B. The assessor explained the idea of calculating value indexes for processes, both with and without a reference model. Company B preferred the idea of not using a reference model, because the personnel was dedicated more to the activities defined in the company’s own process descriptions than to those defined in an external reference model. Therefore, it was decided that the driving force of value assessment for processes should be based on the company’s own process descriptions rather than on a reference model. The processes selected for value assessment included:
− Architectural design − Design − Code Implementing − Testing
When comparing any reference model to the selected processes it is however possible to note that they represent the typical processes presented in these models as well.
8.3.3 Function analysis
After the information collection phase it was easy to “start the assessment”, as the product and process structures for assessment of value had been defined and decided. There was no need to prioritize product requirements or components, since this had already been done using three classes. The assessor pointed out that if the assessment had been implemented for all 20+ platforms, prioritization would have helped the assessment work. Since the selected processes were vital processes for Company B and there were only a few of them, they were not prioritized either. All of them were seen as necessities.
All representatives of Company B found it easy to assign costs for the selected three product categories, because Company B followed all these costs every day. However, when discussing the use of estimation methods to allocate costs to more detailed product structures, problems arose. For example, since there was no understanding of how much working time was used for each platform, it was impossible to assign salary costs to these platforms in any reliable way. At process level, these problems did not arise. Company B had a system for following hours worked at the process and process practice levels.

134
However, this information was not used to allocate actual costs to sub-processes and practices.
Since Company B did not want to make precise cost and worth information public, the following figures are percentages. Worth is calculated using the ideal cost that Company B has defined for the platform or process, and costs are based on real costs. Figure 11 illustrates the calculated percentual worth and cost for platforms.
Fig. 11. Worth & Cost in platforms (AV=average, C=customer, V=vendor)
Figure 11 shows that the platform category in which products are considered the easiest to implement creates more worth than costs. Generally, the situation is in control in this platform. However, in the platforms considered “difficult” and “very difficult”, the opposite situation is true. The actual production costs are higher than the worth that the company expects to get from these products. Therefore, in these platforms, the situation is not in control. When discussing these results with Company B, they explained that the amount of sales in the “easy” platform were significantly higher, and therefore the production costs were divided over larger amounts of sales than in the two other platforms. As an explanation, representatives of Company B also stated that employees had more experience of creating products for the “easy” platforms.
The worth and cost calculation results of value-related process assessment can be seen in Figure 12. Design and architectural design seem to be in balance with worth expectations. Company B uses the same level of resources for them as the worth that customers expect to get from them. However in coding and testing, the situation is not the same. Customers do not assign as much worth to them as they cost, which indicates a clear need to cut costs in these activities to improve value.
Worth & Cost in platforms
0.0
5.0
10.0
15.0
20.0
25.0
WIN,LIN,SOL,HP(easy)
QNK(difficult) UX(very difficult)
Requirement
%
C AVWorth(%)V AVCost (%)

135
Fig. 12. Worth & Cost in processes (AV=average, C=customer, V=vendor)
After calculating worth and cost, the assessor calculated value indexes. Platform-level value indexes (Figure 13) indicated that the easiest platforms produce the greatest value. Since the value indexes for the other platforms are below 1.0, these platforms do not pro-duce as much money as they cost. Generally, it was recommended to Company B to avoid using a lot of resources on this kind of products where value is below 1.0. However, it was also advised that if the Company B wanted to move into new markets, it might occasionally be necessary to create poor value for a certain time. In Company B’s situation, this was not the case. Company B did not consider the customers who were buying products using the “difficult” or “very difficult” platforms to be new customers in new markets. It considered these customers more like a project which would lead to a situation where they would start to use more common platforms as well.
Value indexes for processes (Figure 14) clearly show that Company B creates most value in design and architectural design. Basically, they create good architectural plans and designs as a basis for their products, and it was emphasized that Company B should start to look for value improvement possibilities mostly in coding and testing. These processes create more costs than worth.
Worth & Cost in processes
0.0
5.0
10.0
15.0
20.0
25.0
30.0
35.0
Architecturing Designing Coding Testing
Component
Prio
rity
C AVWorth (%)
V AVCost (%)

136
Fig. 13. Value in platforms
Fig. 14. Value in processes
Value in platforms
0.0
0.2
0.4
0.6
0.8
1.0
1.2
1.4
1.6
1.8
WIN,LIN,SOL,HP(easy)
QNK(difficult) UX(very difficult)
Requirement
Val
ue Value index
Value in processes
0.00
0.20
0.40
0.60
0.80
1.00
1.20
Arch
itectu
ring
Desig
ning
Codin
g
Testi
ng
Component
Val
ue
Valueindex

137
8.3.4 Creativity
At the beginning of the creativity meeting, the results of the value study were gone through with Company B. Since value determination had been performed for both products and processes, it was decided that both aspects would also be brainstormed. In addition, it was decided that the requirements for a new cost accounting system would also be discussed. All participants were asked to list product-related improvement proposals first, process-related improvement proposals second and cost accounting-related improvement proposals third. Both the assessor and top-level management encouraged people to invent as many improvement proposals as possible. People were encouraged to propose even “crazy” ideas, as they might create value for someone in the company, and their development could also lead to practical solutions to many problems.
During the brainstorming session, the discussion was very in-depth, and took into consideration both economical and technical realities. All present saw the importance of the value point of view for their company and several improvement ideas were listed during the session. The main ideas were classified in three categories, and included:
− Products:
− Someone should be responsible for discussing a move to easier platforms, with customers using “difficult” and “very difficult” platforms.
− The company should announce that it will no longer make products for “difficult” platforms.
− The company should not implement all new features in platforms which it consid-ers “difficult”, and some features should be implemented significantly later.
− Processes:
− The project managers and testing manager should organize a workshop in which the most time-consuming work practices would be listed.
− Cost accounting:
− Accounting identifiers should be created to follow costs in all platforms. − Accounting identifiers should be created to follow costs in main practices. − Reporting schedules, and templates should be created for cost accounting and
value-monitoring needs. − The working hour tracking system should be improved, to include all value
creation-related areas.
The creativity meeting ended and to the external assessor it seemed as though the participants had some important issues to discuss. The discussion continued outside the meeting room, and the driving force for improvement was value.

138
8.3.5 Evaluation
During the evaluation phase all the ideas presented were analyzed and evaluated. It was decided that there was no need to create weighted criteria in prioritizing improvement proposals. It was proposed that all of the ideas should be implemented, except the one suggesting that the company should announce that it would no longer support all platforms. This idea was not widely supported because it was considered to be against the company’s strategy and customer service principles.
8.3.6 Development
Product-related value
During the development phase, benefit analysis, a data package, an implementation plan and a presentation to top-level management were all prepared. According to the benefit analysis, product-related benefits would be achieved if customers changed their platforms from “difficult” or “very difficult” platforms to easier ones. Some customers had already indicated that this would be possible in the near future, but Company B had not been active in supporting it. Some customers had stated that they did not have technical knowledge of “easier” platforms and they would need significant support in moving to these platforms. It was estimated that within a one year timeframe, 60 percent (AV=average, C=customer, V=vendor) of customers could change platform, to an “easy” one. It was further estimated that if not all the new, minor improvements were implemented, the costs involved in “difficult” and “very difficult” platforms would de-crease by 25 percent. The total cost savings were estimated at around 50 percent. There was no need to put together a comprehensive technical data package for this proposal, since it was not a question of developing new technical solutions. The implementation plan included a program for a one-year period, in which the necessary actions were described.
Process-related value
In terms of the process-related improvement proposals, project managers and the testing manager organized workshops with their teams to discuss the most time-consuming work practices. Based on these workshops it was noted that:
− Designers came to code inspections without preparation, and there was no clear procedure for how to act in inspections.
− Module and security testing were part of each designer’s responsibilities, but they felt that they did not have enough training to implement these test procedures.
− There was no nominated testing engineer for each project, and testing engineers used a great deal of time learning about the new project before testing.
The value assessment team collected history information about code inspections, ana-lyzed all information quantitatively, and formed an understanding of which kind of inspections lasted longest and shortest. Working time in coding, module testing and

139
security testing was analyzed quantitatively as well. Empirical analysis of the history data showed that coding was done reasonably quickly, but all testing-related activities took a significant amount of time, and many designers did not have a clear understanding of what security testing should include. After collecting and analyzing the supporting data package, the participants generated improvement proposals related to processes:
− Each design should be inspected by another designer, who should send design comments, before the inspection, to the project manager, who acts as a chairman in inspection meetings.
− Security testing should be given to test engineers, who have a better understanding of it.
− The test manager should organize module test training for designers. − The test manager should nominate test engineers for each project. − Testing plans should be inspected by a test team before testing.
It was estimated that the proposed improvements would reduce coding costs by 10 percent over a one-year period. In testing, the cost reduction was estimated at around 15 percent. In relation to these value improvement proposals, it was recommended that working hours should be tracked and reported monthly in order to follow how the situation was proceeding.
Cost accounting system
The third selected value improvement area included the cost accounting system. Since Company B already had appropriate cost accounting software, it was considered possible to use it for the required cost accounting purposes. It was decided that the financial manager would create identifiers in the cost accounting system for each:
− Platform − Defined process practice.
In terms of platforms, it was decided that all income and costs would be allocated to pro-ject and product (platform) numbers. It was decided that each project would have four numbers and each product, two numbers. Using the new identifiers it was possible, for example, to get income, cost and profit reports for each project and product separately. As a final improvement proposal, all process descriptions were reviewed and work practices defined for time-keeping purposes. Since Company B had the software necessary to implement these changes, it was calculated that it would take one person one week to implement the identifiers and train the needed bill approvers in the new practices. At the company level, it was calculated that the system would pay for itself in an even shorter time, with the ability to price more products more profitably.
8.3.7 Presentation
The results of this value assessment for processes and products, including cost accounting system improvement opportunities, were presented to the top-level management. Since
140
the proposed improvements only reduced costs, the top-level management decided to put them into use.
Company B was satisfied with the results of value assessment. However, they announced that since there was no proper time-keeping and cost accounting system in place before the assessment, a new assessment, using the new information, would be carried out in the following year.
8.3.8 Strengths and weaknesses of value assessment for processes and products
The purpose of all the assessments was to collect experiences concerning:
− How the proposed enhancements worked in practice − The strengths and weaknesses of each enhancement − Whether the enhancements support the value-based approach to successful software
engineering − Whether the companies assessed saw the enhancements as useful
Company B was satisfied with the value assessment. The assessment began with an initial meeting, in which the phases of value assessment were discussed. The auditor presented the content of each assessment phase, and the decision to carry out process and product assessment was made. In practice, problems arose only when it was noted that Company B did not have a proper cost accounting system in place. Even though in this assessment the focus was on both processes and products, the value assessment process seemed to take place with no additional problems. By using both approaches at the same time, the company can gain an even more powerful value assessment tool for the formulation of improvement proposals. Because, in this assessment, capability-maturity -based assessment results were available throughout the whole assessment, it was easier for all participants to make improvement proposals which took into consideration both capability and value.
The assessment results support value-based approach to software engineering in several ways. The results show that there exists a practical need to enhance the scope of software engineering in a value-driven direction. It is easy to draw this conclusion, since Company B showed an interest not only in value assessment itself, but also in building up a cost accounting system for process practices and product components. The results also show that Company B needed a two-dimensional assessment, which evaluated both processes and products. Therefore, the theoretical claim that process-focused assessment alone is not enough to start improvement was justified. As well, capability-maturity -based assessment results formed a good basis for value assessment, even though Company B did not consider them adequate for starting expensive improvement work in the software engineering area. The assessment results also justify the use of Activity Based Costing (ABC) in improving the software engineering area. This can be justified, because Company B wanted to build a two-level cost accounting system, which took into account processes as well as products; this is one of the main ideas behind ABC. Finally, the results also gave several more reasons for using estimation methods in the software

141
engineering area. In Company B’s situation in particular, where there was no cost accounting system in place before the assessment, estimation methods were required in order to find cost-reduction and value-improvement areas. The theoretical claim that value should be considered an important part of process and product assessment was also justified, because actual costs alone would not have been enough to show Company B which areas needed improvement the most. This is due to the fact that “cost” only measures how expensive software implementation is, not how much someone would pay for it.
According to Company B the assessment process worked as planned, and the phases from creativity to presentation were also useful in combining value and capability-maturity -based assessment results. From Company B’s point of view the information collection phase collected enough information for the next VE phases. It also provided opportunities to discuss the needs of the company. The most significant result of the information phase was perhaps that Company B already knew that it needed a better cost accounting system which would justify the areas in which process- and product-related improvement should be done. Cost estimation alone was not seen as enough for these purposes even estimations were made using the main cost-driving variables, such as working hours, from the time-keeping system. Actual costs were clearly preferred to estimated ones. Company B’s top-level management also agreed that the previous capability-maturity -based assessments neglected two important points of view concerning software engineering. They did not take the product and business points of view into account sufficiently. Instead, they assumed that money is “always” given to process-related improvements if capability is low, even if there is no guarantee that these investments will ever pay back the costs incurred.
The importance of actual cost, worth and value (rather than estimates) was considered to be so great that the representatives of Company B wanted to postpone the full value as-sessment further, until the cost accounting system was working properly. However, even the focused assessment showed that Value Assessment has a significant place when improving software product profitability in relation to software process improvement.
Generally, all the assessment results found are reliable. The reliability of the results was also improved significantly because the assessor interviewed several people and went through the same questions with all of them. The interview results were also compared to existing written material to check that they matched. Since the assessor had also passed the Value Analyst exams, he had the necessary skills to interpret the findings.
However, perhaps the most significant risk of drawing false conclusions is in understanding the ideal cost that the company had defined for products and processes. This does not necessarily represent the average opinion of all customers well enough, since it is based on the company’s own estimate. The use of ideal cost is perhaps even riskier when analyzing the products, because customers usually have a clear opinion of their worth. In the case of processes, the company’s own estimates of worth are perhaps more valid, since the customer does not usually see all processes as their main interest for “buying”, whereas the company wants to manage them efficiently.

142
8.4 Value assessment for products: Company C
8.4.1 Background
Value assessment for products was implemented in fall 2004. From the first assessment meeting with the vendor it was obvious that value should be assessed using requirement lists and architectural component description lists. The first lists of requirements had been made by Company C’s customer, and even though the vendor had updated them they still represented the original customer needs very well. The vendor also had a great interest in the requirement list, as it was a starting point for product development work. The require-ment list contained requirements such as:
− Picture call − Emergency − User − Server − Distance configuration − Video − Service − Camera − Activities
The architectural component list was included in the assessment because it effectively re-vealed the technical structure of product, and the vendor had largely allocated product development resources based on this list. The component list contained components such as:
− Basic structure − Settings − Log − Telecommunication − Video − Emergency − Server − Users − Distance configuration − Sending − Activities − Surveillance − Services
Together with the requirement and component lists, several other documents were ana-lyzed during the assessment as well. These documents included:
− Strategy plans − Project plans − Process descriptions (partially)

143
− Budget principles − Cost accounting principles and calculations − Financial statements − Personnel task lists − Selling agreement templates − Product testing plans − Configuration management plans − Quality plans and reports
All the assessment team members had a strong interest in seeing how value would be assessed and improved using both lists described above.
8.4.2 Information
The product to be assessed was a typical electronic product containing software and hard-ware. It was developed in collaboration, by the vendor and the customer. The vendor was responsible for developing the product and the customer for defining user requirements for it. The vendor and the customer used project organization for specifying, implementing and testing the product. In practice, both sides nominated project managers to handle all the everyday managerial tasks involved in the project. For example, the vendor’s project manager took responsibility for customer negotiations and for the allocation of resources to tasks. The customer’s project manager coordinated customer-related tasks such as defining user needs more comprehensively and delivering information about project status to the customer organization. The overall management of the project, including issues that project managers were not able to decide on, was done in a project management group, to which both parties also nominated representatives from higher management.
After the decision concerning the development and implementation project had been made, the vendor nominated an architect for the project, who was responsible for the creation of a more detailed technical solution for system architecture and development work. He was also responsible for calculating more precise estimates of the development resources needed for each component. After estimating resource needs the vendor selected designers and testing engineers for the project, and the customer selected other project members.
The implemented product-focused assessment was supported and sponsored by the vendor’s and customer’s high-level management. In the assessment opening meeting, the purpose of the assessment was discussed with the vendor and the customer. The defini-tion value=worth/cost was discussed, and it was seen as extremely important to find out which requirements and components of the product gave the best value to the vendor without neglecting customer needs. The customer had a strong interest in analyzing priorities and worth in requirements and components, for further product development work. A two-dimensional value assessment approach was selected because it not only included both vendor and customer points of view but also provided an opportunity to evaluate the relationships and dependency between requirements, and the road mapping of components.

144
It was considered natural that too much detail in the architectural description would probably cause problems when calculating customer worth, because the customer does not necessarily have enough technical expertise to understand the technical product structure. Therefore, in the assessment, an architectural list was provided which included functional descriptions defining the activities for each existing component. The vendor also emphasized the importance of the component list because all resources were roadmapped using this list, and cost overruns could be more effectively analyzed using the component list rather than the requirement list. After the discussion, it was decided that value would be calculated for the requirements described in the product sales agreement and for the architectural components listed in the architectural description. This decision was strongly supported because the vendor’s cost accounting system made it possible to track real costs for the specified lists.
As a final point of the initial meeting, vendor and customer roles were discussed. The vendor emphasized that it would like to undertake the phases from creativity to presentation without the customer being present, since these phases included brainstorming to gain a new understanding of all the processes used to develop products. However, if needed, they would give their comments on any questions that arose. The customer saw that the most interesting phase for them was functional analysis, where both sides would prioritize requirements and components, and give estimates of worth and cost using relative numbers like percentages (not stating real costs). This point of view was clearly understood by both parties, as the customer was primarily interested in evaluating component and requirement priorities, in order to see how well the vendor had understood their wishes. As a secondary issue the vendor was also interested in getting an idea of how much each requirement and component really costs compared to the worth it provides. The customer understood all wishes of vendor and saw that they did not have a strong interest in development methods and improvement proposals, which were considered to be more critical for the vendor’s business.
8.4.3 Function analysis
After the initial meeting it was easy to “start the assessment”, because the requirements and components to be assessed were agreed in the information phase. In the first assessment meeting four customer representatives (referred to as “customers”) and three vendor representatives (referred to as “vendors”) prioritized the requirements and architectural components. Afterwards, the customers allocated worth to each requirement and component using a percentage scale from 0% to 100%. The idea was to identify in percentages what kind of worth the customer sees in the requirements and components. The vendors allocated costs using the same percentage scale from 0% to 100%. As a result of this, the customers had given worth percentages for all requirements and components, and the vendors had given cost percentages for the same items. The calculated worth and cost were later compared, using percentages, to the real worth and cost, to find out the difference between “belief” and “reality”.
During the function analysis phase the technical representative of the customer pointed out that, when prioritizing, one cannot necessarily treat all components equally, because

145
some components are tied together. In practice certain components have to be implemented before other ones. Some components are independent, and others are not. Certain components rely on certain other components for their existence. However, he emphasized that even though this is the case, it does not affect all components, and prioritization clearly gives one a better picture of components and requirements, and of their importance in relation to each other.
All the interviewees agreed that the prioritization of requirements and components clearly helped in the next phase, in which the same requirements and components were analyzed in terms of worth and cost. When asked to mark how much of the total price they would assign to each requirement, the customer representatives preferred to use percentages rather than actual monetary values. The vendors shared this viewpoint, and stated that it was easier for them to give cost information in percentages rather than in actual figures. As the final customer price and real production costs for requirements and components were all known, it was decided that these allocations would also be done, but for vendor use only.
The customers found it easy to assign worth to their requirements, based on the customer price. The vendors also considered it easy to assign costs to requirements. Both sides emphasized that requirements are easy to understand because they are based on a clear, existing agreement. Only the architect found it slightly challenging to assign costs to requirements, because resources are usually assigned to components and not to requirements. Therefore, certain designers and their work cannot necessarily be easily converted from the component level to the requirement level. However, he noted that it is important to do this because this is how cost and worth can be analyzed at the same level.
For the technically-oriented customer representatives it was fairly easy to assign worth to components. The user-oriented representatives considered it slightly difficult at first, but once explanations of each component were provided they too found it quite (AV=average, C=customer, V=vendor) easy. They found the component lists, which contained technical names (classes, etc.), were not easily understood without explana-tions.
The results of requirement prioritizations were understandable and expected among the customer and vendor representatives. Slight differences existed, and these were dis-cussed thoroughly. Figure 15 gives an overview of average priorities for requirements, including all customers and vendors.

146
Fig. 15. Average priorities for requirements including all interviewees (AV=average, C=customer, V=vendor)
The customer found differences between how their technical and user oriented personnel saw requirements. Differences between interviewed persons can be seen in Figure 16.
Fig. 16. Average priorities for requirements including all interviewed customers (AV=average, C=customer)
Prioritized Requirements
0.01.02.03.04.05.06.07.08.09.0
Picture
call
Emergenc
yUse
r
Server
Distan
ce co
nfigu
ration
Video
Service
Camera
Activit
ies
Requirement
Prio
rity C AV
V AV
Prioritized Requirements / Customer
02468
10
Pict
ure
call
Emer
genc
y
Use
r
Serv
er
Dis
tanc
eco
nfig
urat
ion
Vide
o
Serv
ice
Cam
era
Activ
ities
Requirement
Prio
rity
C 1
C 2
C 3
C 4
C AV

147
The vendor also found differences between the project management’s and the technical personnel’s comments. The vendor’s prioritization of requirements can be seen in Figure 17.
Fig. 17. Average priorities for requirements including all interviewed vendors (AV=average, V=vendor)
By comparing the customer’s and vendor’s averages it was also possible to identify some significant differences between their respective priorities. For example, requirements such as services were clearly seen as more important by the vendor than by the customer. The discussion of how the two parties could be part of the same project and yet understand each others’ interests so surprisingly wrongly was extremely profitable.
The results of prioritizing components were understandable and quite expected. During the prioritization all persons had an explanation list of the purpose of all components in front of them, which helped to understand the purpose of each component. Especially all customer representatives saw this list helpful. This prioritization exercise was carried out at approximately the same time as the requirements prioritization. Figure 18 shows the average priorities for components.
Prioritized Requirements / Vendor
0123456789
10
Picture
call
Emergenc
yUse
r
Server
Distan
ce co
nfigu
ration
Video
Service
Camera
Activit
ies
Requirement
Prio
rity
V 1
V 2
V 3
V AV

148
Fig. 18. Average priorities for components including all interviewees (AV=average, C=customer, V=vendor)
In the interviews, all the customer representatives stated that they had prioritized require-ments, and the vendor had presented the component structure to the customer before the sales agreement was signed. This was seen important because it was considered important that when there is a limited amount of money it should be used effectively both in terms of requirements and of components. During the interviews, two customer representatives also underlined that the architectural structure was evaluated separately before the project was begun because this was seen as vitally important for the future development of the product. Vendor representatives fully shared this point of view. How the customer prioritized components can be seen in Figure 19.
Priorities for Architecture
0,0
2,0
4,0
6,0
8,0
10,0
12,0
14,0
Basic
stru
cture
Settin
gs Log
Telec
omm
Video
Emer
genc
y
Serve
r
Users
Distan
ce co
nfig
Send
ing
Activ
ities
Surve
illanc
e
Servi
ces
Component
Prio
rity
C AVV AV

149
Fig. 19. Average priorities for components including all interviewed customers (AV=average, C=customer)
When comparing the customer’s and vendor’s priorities for components, one can see that variance is significantly higher among the customers. This is most probably due to the fact that there is more variance in technical knowledge among the customers. How the vendor prioritized components can be seen in Figure 20.
Priorities for Architecture / Customer
0
2
4
6
8
10
12
14
Basic
struc
ture
Setting
sLo
g
Telec
omm
Video
Emergen
cy
Server
Users
Distan
ce co
nfig
Sendin
g
Activit
ies
Surveil
lance
Service
s
Component
Prio
rity
C 1C 2C 3C 4C AV

150
Fig. 20. Average priorities for components including all interviewed vendors (AV=average, V=vendor)
One conclusion of discussions was that worth and cost allocations for all requirements and components were seen as relevant for both sides, even if only stated as percentages. According to customer they also had their own idea about the actual costs of production, and since they knew the worth they were satisfied for the situation. Figure 21 presents the average worth and cost for requirements. In this figure we can observe how, for example, the customer has evaluated the worth of picture call function as being noticeably higher than the vendor’s estimation of its production cost. In practice, this means value for the vendor. Figure 22 presents the average worth and cost for components.
Priorities for Architecture / Vendor
0
2
4
6
8
10
12
14
16
Basic
struc
ture
Setting
sLo
g
Telec
omm
Video
Emergen
cy
Server
Users
Distan
ce co
nfig
Sendin
g
Activit
ies
Surveil
lance
Service
s
Requirement
Prio
rity
V 1V 2V 3V AV

151
Fig. 21. Average worth and cost for requirements including all interviewees (AV=average, C=customer, V=vendor)
Fig. 22. Average worth and cost for components including all interviewees (AV=average, V=vendor)
On the whole, the experiences of using prioritization in ranking requirements and compo-nents were positive. Even more interest was seen in the analysis of worth and cost for each requirement and component, and especially in the differences identified between customer and vendor, as well as between technical- and user-oriented personnel.
W o r t h & C o s t i n R e q u i r e m e n t s
0 .0
5 .0
1 0 .0
1 5 .0
2 0 .0
2 5 .0
3 0 .0
Pic ture ca
ll
Emerg
ency
User
Server
D is tance con fig
u ratio
n
Video
Service
Camera
Activitie
s
R e q u ir e m e n t
%
C A VW o r th( % )V A VC o s t ( % )
Worth & Cost in Architecture
0.0
5.0
10.0
15.0
20.0
25.0
30.0
Basic
structu
re
Settin
gs Log
Telec
omm
Vide
o
Emerge
ncy
Server
Users
Dista
nce co
nfig
Send
ing
Activ
ities
Surveil
lance
Service
s
Component
Prio
rity
C AVWorth (%)
V AVCost (%)

152
8.4.4 Creativity
In accordance with the agreement between the customer and the vendor, only the vendor participated in the phases from creativity to presentation. The first step in the creativity phase was to allocate costs to all requirements, and then to all components. According to the vendor it was easy to allocate costs to the requirements and components. General costs were perhaps the most difficult costs to allocate. This was because costs such as the project manager’s salary usually cannot be allocated directly to any particular requirement or component.
The project team decided that for the purposes of this assessment it was satisfactory for only project-level costs to be allocated to requirements and components. Business unit- and company-level general costs were not allocated to requirements or components. Hence, from a value index point of view, the results are more optimistic than they should be. However, because the project personnel saw that they could not influence these costs at the project level, they should not have an effect on “project-level” value improving figures either. Naturally, if this assessment had included business unit- and company-level functions, these costs should have been taken into account too.
After cost allocations had been completed, the project team started brainstorming. The vendors evaluated priority lists, figures, and worth and cost calculations for all requirements and components. All personnel were encouraged to explain how they would improve value at both requirement and component levels. According to their comments, clear figures helped a lot in understanding where the most significant differences in value existed.

153
Fig. 23. Value indexes for requirements including all interviewees
Fig. 24. Value indexes for components including all interviewees
Value for Requirements
0,0
5,0
10,0
15,0
20,0
25,0
30,0
Picture ca
ll
Emergency User
Server
Distance co
nfiguration Videa
Service
Camera
Activitie
s
Requirement
Valu
e Value index (interview)Value index (real)
Architectural Value
0,002,004,006,008,00
10,0012,0014,0016,0018,0020,00
Basic
struc
ture
Setting
sLo
g
Teleco
mmVide
o
Emergen
cyServ
erUse
rs
Distan
ce co
nfig
Sendin
g
Activit
ies
Surveil
lance
Service
s
Component
Valu
e
Valueindex(interview)Valueindex(real)

154
Based on the figures it was noted that certain requirements and components did not create good value. After discussion of this, the project members shared the opinion that this was because of the unfinished architectural plan. This had an influence on the planning and design of these items and thus they had been delayed, and created significantly higher costs. In general, it seemed as though the components that should have been implemented first suffered the most from this situation. Designing was problematic and time-consuming, and code implementation often had to be paused. This took a lot of time, and people often had to wait for updates in design and architecture before they could start coding again. The problem was significantly smaller at the end of the project when the architectural plan was stable and clear design plans also existed.
Project members could also see from the charts presented how time-consuming it was to start using new technical environments, without good planning. The new technical environment delayed the implementation of certain requirements and components significantly.
New technical challenges, such as developing software for multiprocessor environments, were also named as one reason for delays. This was because project personnel did not have sufficient training in working in the multiprocessor environment.
All the project members also felt that estimates for work times were not realistic. As a result of all the problems mentioned, working hours were about 20 % higher than expected, and three components were not implemented at all.
In Figures 23 and 24, the real values of these requirements and components are also extremely high, because in real cost accounting costs are not allocated to these targets at all. This is due to the fact that the planned requirements (camera and activities) and components (sending, activities, and surveillance) were not implemented as planned, or were not implemented at all. Therefore, when calculating value indexes and forming estimates, it might be helpful to use relative percentages based on interviews, as in this assessment. By looking at Figures 25 and 26, we can see more clearly what kind of value the fully-implemented requirements and components had. By comparing value indexes (interview and real), we can also see how greatly the estimated calculations differ from the real situation. In practice this is due to production costs, because worth was calculated based on product price that was know from sales agreement.

155
Fig. 25. Value indexes for fully-implemented requirements including all interviewees
Fig. 26. Value indexes for fully-implemented components including all interviewees
Value for Requirements
0,0
0,51,0
1,5
2,02,5
3,0
Picture
call
Emergenc
yUse
r
Server
Distan
ce co
nfigu
ration
Video
Service
Camera
Activit
ies
Requirement
Valu
e Value index (interview )
Value index (real)
Architectural Value
0,00
0,50
1,00
1,50
2,00
2,50
3,00
3,50
4,00
Basic st
ructure
Settings
Log
Teleco
mmVideo
Emergency
Server
Users
Distance
config
Service
s
Component
Valu
e
Valueindex(interview)Valueindex(real)

156
8.4.5 Evaluation
At the beginning of the evaluation phase the project team discussed criteria for the evaluation of improvement ideas. The criteria decided on were system stability, safety, optimized functioning, ease of use, maintainability, and profitability. First, all the project team members were asked to give a relative percentage (max 100 %) for how important each criterion was for their project. Secondly, project personnel calculated averages for all the criteria. The calculated averages were as follows: system stability 25 %, safety 20 %, optimized functioning 7.5 %, ease of use 20 %, maintainability 15 %, and profitability 12.5 %.
After thus defining the weightings of the criteria, the project personnel gave points to each improvement proposal on a scale of one to six, where six indicated maximum points and one, minimum. The points allocated were multiplied by the calculated weighting percentages. The results can be seen in Table 11 as follows.
Table 11. Evaluated improvement proposals
System stability
Safety Optimized functioning
Easy to use
Maintainability Profitability Total
Estimation 25.0 40.0 15.0 80.0 15.0 75.0 250.0 Multiprocessing 125.0 20.0 22.5 20.0 30.0 12.5 230.0 Technical environment
75.0 80.0 37.5 100.0 60.0 25.0 377.5
Architectural plan 150.0 100.0 30.0 40.0 75.0 50.0 445.0 Design plan 100.0 120.0 45.0 120.0 90.0 37.5 512.5 Project mgnt process 50.0 60.0 7.5 60.0 45.0 62.5 285.0 525.0 420.0 157.5 420.0 315.0 262.5 2100.0
The project team discussed these results. The most surprising result was that the impor-tance of the technical environment was as high as third place. Problems in design and architectural planning were expected, as were problems related to project management. Estimation and multiprocessing got the least points, so their importance to the project was not considered to be as high. However, it was noted that if the project would have been more business critical this would not have been the case. The more business critical the project would have been the more weighting the profitability criterion would have got.
8.4.6 Development
In the development phase, the improvement ideas were separately developed further, in order to examine their practical implications. Each idea developed included issues such as description, positive consequences, negative consequences and potential cost savings.

157
Architectural plan and design plans
The project personnel stated: “It has been difficult to get the necessary working resources for small projects.” The architecture and design phases have perhaps suffered from this the most. There had not been enough time to review these phases, which can be seen in the presence of incomplete plans. Both plans had been updated several times during the writing of code, which had sometimes stopped coding for several days.
One proposed change was that the number of reviews for the architectural and design plans had to be increased. Project personnel also identified a clear need to develop crite-ria for these review rounds. A clear criteria stating what kind of characteristics are the most relevant in a new project was seen to help significantly to evaluation of architectural and design plans too.
The advantages of the proposed change are numerous. If all the project members work together to form success criteria for the project, and review plans using these criteria, no one person has to foresee all the forthcoming problems himself and take full responsibility for the technical environment and the quality of plans. Project members did not see any disadvantages to the proposal. They calculated that if there had been support resources for making more comprehensive plans and reviewing them, the project would have been 440 working hours shorter. The potential cost savings would have been about 26 000 €.
Technical environment
At the moment, the ability to use the existing characteristics of technical tools is weak. The use of pre-existing components is also rather poor. The result is that code has to be written from start to finish each time. Up to this point, training in using the new technical environments has not been satisfactory.
The change proposal is that there should be component libraries at company-level, categorized into classes to indicate how the component in question could be used. When starting a project, there should also be an evaluation of the needed technologies, and project members’ skills, so that the lack of training could be compensated for. The advantage of the proposal is that it probably provides cost savings at the company-level too, but the disadvantage is that there are perhaps no effective methods for handling the component libraries. The project group evaluated that if basic components for devel-opment work had existed, 100 fewer working hours would have been required. If there had been sufficient technical training concerning the new environments (dotNET and ATL 7) for key personnel, 150 fewer working hours would have been required. In total, the potential cost savings would have been approximately 9 000 €.
Project management
From a project management point of view, it is problematic that all the employees are al-ways assigned one hundred percent to a given project. As a consequence, there is not enough support available if needed, and “the wheel is invented several times in different projects.” At the company level, there is a competence center, but these personnel are also assigned to projects.
The proposed change is that the competence center activities are developed in order to be usable regularly for all projects. This could be done so that competence center
158
resources are allocated to projects at only a 70% level. In addition, it was proposed that the competence center develops its activities so that it is able to reply to technological questionnaires from different projects within two weeks. Typically, these answers would contain a short description stating what needs to be known if new technology is to be used, and giving an estimate of the number of working hours needed when using it for the first time.
It is a clear advantage in setting up new projects if there are sufficient resources for evaluating the risks involved in using new technologies. This way, projects would not all have to reinvent the wheel, but would learn from previous mistakes. However, setting up an existing competence center might require significant investment at the company level. The project team evaluated that with satisfactory support in evaluating the architectural plan, the design plans, and the extra need for time in starting to use new technologies, 100 fewer working hours would have been required. In financial terms, this would have meant a saving of about 6 000 €.
8.4.7 Presentation
The results of the product-focused value assessment were presented phase by phase to the high-level management. The project team supported the presentation by giving brief com-ments. In the presentation, a clear emphasis was placed on presenting customer needs and wants, and the corresponding costs to the company. The value indexes were used to outline the existing value-increasing opportunities. The potential cost saving proposed was approximately 26% of product price.
After the presentation had ended, the management wanted to discuss the value improvement opportunities presented with the project personnel. Some improvement ideas were implemented and some were developed further; others were postponed due to lack of resources. As a whole, the assessment strongly emphasized collaboration between the customer and the vendor, and all the improvement proposals were in line with the customer’s interests as well. All customer and vendor representatives considered product-focused assessment an interesting method for the development of product quality and value, and process capability.
8.4.8 Strengths and weaknesses of value assessment for products
The purpose of all the assessments was to collect experiences concerning:
− How the proposed enhancements worked in practice − The strengths and weaknesses of each enhancement − Whether the enhancements support the value-based approach to successful software
engineering − Whether the companies assessed saw the enhancements as useful
This product-focused assessment worked very well in Company C. All participants agreed that the assessment process was clear and practical. The product assessment was

159
considered to be significantly more effective than the process assessment. Company C did not consider capability-maturity -based assessment to be as good as product-focused assessment for its purposes. Perhaps this was due to the fact that Company C was rather small, and all improvement initiatives were expected to give advantages as soon as possible. Capability-maturity -based assessment outlines areas where improvements should be carried out, but justifications of the business advantages of the improvements are not given. Therefore, at first, the representatives of Company C were slightly negative towards the idea of using the results of the capability-maturity -based assessment as a starting point for software process and product improvement work. All the representatives of Company C were thus pleased to hear that it is possible to involve the customer in the assessment too since it increases the business point of view to assessment.
The product-focused assessment had several strengths. It was seen to give more customer-oriented improvement proposals than process assessments and product-related improvement was the language that the customer understood and was in a way “buying”. Product-focused assessment also involved the customer in the decision process. For the customer it was important to participate in decisions about which features would be implemented and which would not. The customer also wanted to prioritize product components and considered it important that the vendor asked questions what should and should not be done. Company C considered it important that when the assessment is undertaken together with the customer, it can keep the customer more satisfied, which is a good basis for business. It was also emphasized that if value assessment is done in the planning phase of a product, it is cheaper for any company than making changes after several months of development work. However, if value assessment for products is done for a new product or before collecting any supporting cost data, the company might have problems in estimating costs. These questions should not, however, be obstacles if the customer participates in the assessment and provides worth information for the vendor, who can use this to estimate whether it is possible to implement the product. In particular, all personnel with product-related responsibilities, in any organization, should consider this point of view, as it concerns them.
Value assessment for products supports value-based approach to software engineering in several ways. The comments from Company C show that there exists a practical need for enhancement of the scope of software engineering, in a more value-driven direction. This seems to be reasonable, especially if the company in question wants to calculate costs in order to plan product-related actions before implementing them. In practice, both Company C and their customer showed a special interest in this kind of planning, from which both parties get value.
The results also show that Company C had a need for two-dimensional assessment, which evaluated both processes and products. Therefore, the theoretical claim that process-focused assessment alone is not enough to start improvement was justified. When prioritizing the process and product assessments, the participants prioritized product assessment higher than process assessment. Therefore, the software engineering theory enhancement requiring a stronger role to improvement work from product point of view seems to be justified as well. In particular, companies which have a large portfolio of products should consider product-related assessments when investing money in software engineering-related improvement. Capability-maturity -based assessment results formed a

160
good basis for value assessment in Company C. By using them, it was possible to gain an understanding of the capability of the processes producing the product in question.
The assessment results for Company C also support the use of Activity Based Costing (ABC) in improving the software engineering area. When discussing cost, worth and value it seemed clear that these should be calculated for processes as well as products, which is the purpose of ABC. Finally, the assessment results also gave several further reasons to use estimation methods in the software engineering area. Cost estimation methods are particularly necessary in situations in which new products are planned together with the customer, and the customer defines worth based on product price. Since in Company C the product was expected to include several new features in the future, life-cycle costing methods also had to be used to foresee and understand product costs over time.
Generally, all the assessment results in this assessment are reliable. The reliability of the results was also improved significantly because the assessor interviewed several people and went through the same questions with all of them. The interview results were also compared to existing written material to check that they matched. Since the assessor had also passed the Value Analyst exams, he had the necessary skills to interpret the findings.
Furthermore, since in this assessment the customer allocated worth to the product requirements and components, the reliability of the results can be considered to be higher than in case 2, where worth was defined by Company B itself. However, the results of allocating worth to the components should not be thought to be equal with the results of allocating worth to requirements. This is due to the observation that customers who did not have enough technical experience of designing software found it difficult to allocate worth to components, and therefore a possibility of misunderstanding exists.

9 Conclusions
9.1 Research results and contributions
This study adopted the value-based approach as a result of analyzing the economic-driven view of software development and discussing the SPI context and cost efficiency characteristics. In order to study and evaluate the value-based approach this study developed a value assessment method and later on also combined it with the capability-maturity -based assessment, giving this combination the name “Value Enhanced Assessment (VEA) method”. As a whole the developed combination was seen to respond better to the presented overall challenges of software development and SPI, containing both capability and value points of view, and the value-based approach.
The overall research problem of this thesis was to answer the following questions:
− What kind of characteristics does the value-based approach include? − What kind of characteristics does the VEA method include? − Do industrial VEA cases support the value-based approach and do companies see VEA
as usable?
In this study, value assessment and VEA were considered to be predefined and organized collections of techniques and sets of rules which state by whom, in what order, and in what way the techniques are used to achieve and maintain some objectives. More precisely, as methods they both aim to include knowledge of conceptual structure, notation of concepts, process, participation & roles, development activities & decisions and the values & assumptions of method. (Tolvanen 1998, 33-43).
Question 1. What kind of characteristics does the value-based approach include?
Using the framework presented by Koskela & Huovila (1997), the value-based approach was understood in this study as a process. The main principle of this process was to eliminate value losses in software development, products, processes and SPI. It used economic-driven tools, which were based on economic studies including, for example, the areas of cost estimation, cost calculation (for example ABC and life cycle costing) and investment calculation. The value-based approach preferred calculating costs instead

162
of estimating them, and considered software development and SPI as investments, on which it is possible to spend too much money. In practice, the value-based approach took care that the customer requirements were met in the best possible manner, ensuring quality, timeliness and value in products as well as in processes, over their entire life cycle. In particular, the aim of ensuring quality also connected it to the other methods aiming for quality improvement.
The value-based approach also indicated a clear dependency between the process and products. It saw that we need to develop and optimize process activities so that processes produce the products needed. Furthermore, it saw that we must analyze products in order to reveal problems in processes and develop processes from the product point of view as well. This was seen as vitally important, especially for companies respecting customer opinions and aiming to optimize costs in their processes, because the customers are the ones paying for the products and product-related services. The happier the customer is, the more worth he sees in buying the products from us. It was also clear that when we know our process and product costs, worth and value, our ability to estimate, budget and control future risks will improve significantly.
Question 2. What kind of characteristics does the VEA method include?
In order to study and evaluate the value-based approach this study developed the VEA method. Therefore, giving an answer to the second question was the foundation of the development and enhancement work presented in this dissertation. For conceptual purposes it was necessary to explain the concepts of cost, value and worth used in VEA. For VEA purposes it was necessary to explain the concepts of customer, manufacturer and retailer values as well.
After outlining the theoretical and conceptual basis for the value-based approach to software engineering, this dissertation formulated a usable process definition for the Value Engineering process used in VEA. During this development, several VE processes were introduced and one defined for software engineering use. The process defined consisted of six phases: information, function analysis, creativity, evaluation, development and presentation.
Using the defined VE process as a basis, this dissertation proposed four new enhancement possibilities for VEA using Value Engineering. These possibilities included:
1. Capability-maturity -based assessment for VE processes 2. Value assessment for processes using a reference model 3. Value assessment for processes without a reference model 4. Value assessment for products
The first enhancement was a clear addition to existing models. Capability-maturity -based assessment for the enhanced process model including VE processes is based on the idea that VE process phases are defined as individual processes for the capability model used. This was justified because, theoretically, value and capability were considered to be equally important, and in this way it was possible to get visibility for the roles of value, cost and worth in the assessment as well. The second and third enhancements are based on the idea that value is assessed in processes, and value indexes are calculated for process practices that have been derived from either a reference model or the company’s own process descriptions. The fourth enhancement, value assessment for products, was

163
developed because it represented the customer point of view rather well, an area that was considered weak in capability-maturity -based assessments.
Due to the different content and points of view of the proposed capability and value enhancements, there was a practical need to define the new processes for assessment work. The capability-maturity -based assessment including VE processes was a rather clear enhancement, because it was based on the use of a defined reference model. After including VE processes, there was no need to define a new assessment process. The second, third and fourth enhancements were clearly based on Value Engineering, and the most natural assessment processes to assess value were, therefore, the phases of Value Engineering itself.
The combination of capability-maturity -based and value assessments provided the most challenges. First, the possibility was considered that capability-maturity -based assessment could be carried out first and VE assessment second, or vice versa. Secondly, the possibility was considered that value could be used as a criterion to focus capability-maturity -based assessment on areas where it is needed. This was justified by the perceived impracticality of carrying out both assessments as full assessments every time. After a discussion, the second possibility was decided to be more practical. It gave the assessment work flexibility, and did not require a full capability-maturity -based assessment every time.
In addition to the four proposed new enhancements, this study outlined a basis for using value and capability together in process improvement planning and development. This point of view was seen as important since the model-based assessment methods are often criticized for not taking costs into account sufficiently when forming a process improvement proposal. The proposed new approach seems to give usable information especially for those deciding how to use the limited amount of resources on process improvement and especially with regard to how to select which processes it is most important to improve.
Since VEA is significantly different from capability-maturity -based assessment, the development of new assessment types was considered to be necessary. However, the discussion showed that VEA is rather flexible in terms of assessment type and is therefore able to perform assessment using self-assessment, full assessment or focused assessment, as defined in capability-maturity -based assessment models.
However, the tools for calculating and assessing value in VEA were seen to be significantly different from the tools for evaluating capability. The proposed tools included guidelines called key techniques for understanding VEA in different phases. Tests for evaluating value were presented to aid in the determination of satisfactory or unsatisfactory value and lifecycle costing, to help calculate value more precisely. The presented target costing method was used to help determine cost targets for assessed processes and products.
With regard to costs and worth, it was noticed that they need to be taken into account over the same period of time otherwise the value formula will not be in balance. It might include too many costs for the described worth, or vice versa. An understanding of the importance of process and product lifecycle was therefore seen to be vital. It was seen to be extremely important when comparing different alternatives with different lifecycles. For example, one alternative can cause us higher costs at the beginning, but later on might save us more money than the competing alternative. One product can have a longer

164
lifecycle than another, and if they cost the same the former will clearly be cheaper in the long run. Furthermore, a carefully designed process with appropriate tool support can be cheaper to run than a process developed on an ad hoc basis.
Question 3. Do industrial VEA cases support the value-based approach and do companies see VEA as usable?
Finally, this dissertation presented the results of industrial assessments using the proposed method. All assessments were formulated to include specific points of view and to implement the proposed method as widely as possible. In the first capability-maturity -based assessment including VE processes, new points arose. First, it was observed that people were performing value analysis and improvement actions at the SPU (Software Producing Unit) as well as the project level. Mostly these actions were planned on many occasions but often they were not improved at all. It was rather surprising to see that human resources-related functions were planned with the most precision, and included improvement planning, whereas many technical functions were lacking systematic value improvement actions. However, this capability-maturity -based assessment gave support to the value-based approach and value assessment since value analyzing and improvement activities seemed to exist in practice as well. In particular, phases related to value data collection were seen as more mature than phases related to its evaluation and development.
Secondly, the assessed company liked the value-based approach because it combined technical and economical personnel in improvement planning, as well as taking customer needs into consideration. In practical terms, the capability-maturity -based assessment for VE processes worked well. Capability-maturity -based assessment for VE processes seemed to be justified, and the normal assessment process worked well too. In the final assessment meeting, the discussion seemed to bring up several possibilities for the improvement of quality, customer satisfaction, and the reduction of production cost. However, the discussion was at a purely conceptual level, because costs were not calculated and the exact amounts of costs were not presented. It seemed that the first enhancement was outlining the way to future ones, and supported the usefulness of the value-based approach and value assessment.
In the second assessment, the company was interested in value improvement for both processes and products. This was a challenging task, since the cost accounting system was not able to calculate costs for process practices and product components. Therefore, it was decided that the assessment would take the form of a focused value assessment for processes and products. As the company already had the results of a capability-maturity -based assessment, it seemed natural to assess the value point of view as well. Both value assessments, for processes and products, were easy to implement and did not sacrifice achieved quality levels, but if the cost accounting system had been more accurate, it would have given more actual allocated cost data for all processes and product components than it finally did. However, because the company considered value improvement at process and product levels to be important, the assessment team built up a cost accounting system for the company’s use. It was also decided that after a year had passed, and the company had more actual data, value assessment would be performed again. The assessment results clearly supported the usefulness of value-based approach
165
and value assessment. Experimental cost calculations also showed some possibilities for cost saving and value improvement.
The third assessment was carried out as a value assessment for products. The results show that this enhancement worked well and, as a whole, it was perhaps the most market-oriented of the proposed assessments since the real customer was present in meetings when determining customer worth. It effectively combined customer and company interests in prioritizing development work and helped both sides to understand each other, especially from the cost and worth points of view. A common understanding of these concepts also helped to find cost saving possibilities in software development. Value assessment for products also provided several improvement proposals for process improvement work.
As a whole, all the proposed enhancements worked well. Together they strongly support the usefulness of the value-based approach and value assessment. I agree with Boehm (2003, 33) when he states that “the value-based approach to software development integrates value considerations into current and emerging software engineering principles and practices, while developing an overall framework in which these techniques compatibly reinforce each other.” However, the use of economic-driven tools seems to be a necessity for understanding the fully the value-based approach.
In conclusion, the value-based approach to software engineering appreciates the clear dependency between process and product. It helps in developing and even optimizing process activities, while ensuring that processes still produce the services and products needed. Furthermore, it analyzes products to reveal problems in processes, and develops processes from a product point of view. This is vitally important, especially for companies who respect customer opinions and aim to optimize costs in their processes. Customers pay for products and services, and companies have to allocate all costs to products to be able to price them. The happier the customer is, the more worth he will see in buying a given product. It is also evident that when we know our process and product costs, and worth and value, our ability to estimate, budget and control future risks will increase significantly. Value assessments seem to have a place in the software engineering field.
9.2 Limitations of the study
There are several limitations to this study. First, not all VE practices have been used in the software engineering area. In other industrial areas, VE has been used for many purposes, over several decades. Even if these experiences can also be valuable when applied to the software engineering field, some of them might not be practical. With further development, the software engineering application of VE will probably also discover new ways to approach value, cost and worth.
The second limitation is due to the fact that the empirical findings of this dissertation are rather limited. There is a clear need for several other value assessments using process and product points of view. In practical terms, assessments should also cover many different software companies, and projects in different life cycle phases, so that the usefulness of the proposed assessment processes and tools could be better verified.

166
Thirdly, capability-maturity -based assessment methods seem rarely to be based on a solid theory; this is true of, for example, BOOTSTRAP, CMM, CMMI and ISO 15504. All these methods are explicitly based on a collection of heuristics and industry best practices, rather than a theory. This same limitation is also valid for Value Engineering. Even though it was developed several decades ago, in terms of theory it still seems to be in the development phase. This can be seen, for example, when analyzing its key techniques. These are recommendations or checklists aimed at focusing the work rather than carrying it out in a precise, theoretically defined, validated and verified way.
Fourthly, this dissertation has proposed several tools for use in practical assessment work. However, not all of these tools were used in the implemented assessments since some were not needed, due to the nature of these assessments.
9.3 Recommendations for future research
Further writings in this area should present more discussion on the theoretical basis of value-driven software engineering. This is due to the fact that value is a rather complex phenomenon, and the Value Engineering point of view is only one way to see the situation.
Clearly, further empirical evidence of industrial value assessments is also needed. In the first place, these experiences are needed in order to carry out an exhaustive discussion of the advantages and disadvantages of the suggested value assessment process and method. Secondly, this dissertation has only proposed guidelines on how to use value assessment in relation to assessment methods other than BOOTSTRAP, and the usefulness of the proposed method should be examined comprehensively when combined with other methods such as CMMI or SPICE as well.
In practical terms, it would also be interesting to clarify how improvement plans have changed when using value information. Do software companies still mostly use process assessments? Do they become more interested in product assessments? Is value assess-ment used as a practical tool for industrial assessments? Does value information play a more important role when formulating software process- and product-related improvement proposals? Are there conflicts when deciding whether to use value or capability information primarily, when forming improvement proposals?
More research should also be carried out in evaluating VE techniques and selecting the most suitable ones for assessment work. In this development it is clear that value assessment for processes and products, and capability-maturity -based assessment including VE processes, all need partially differing tools, templates, checklists and techniques. In this dissertation not all these use cases have been examined.
The usefulness of Activity-Based Costing (ABC) and other costing methods could also be studied further. Several companies have adopted ABC, but a significant number of them are still running other cost accounting methods as well. More information is also needed in order to make a decision concerning which estimation method would work best with value assessments.
Since value assessment claims to take the customer into account in decision-making, it would also be relevant to conduct an analysis of customer interest in participation in

167
assessment. Are customers more satisfied with projects where value assessment takes place and they can formulate their requirements together with the vendor? Does customer participation in value assessment help the vendor to implement and manage the project?

References
Ahern DM, Clouse A & Turner R (2001) CMMI Distilled. A Practical Introduction to Integrated Process Improvement. New Jersey, Addison-Wesley.
Al-Yousefi A & Hayden W (1995) Re-Engineering Through VM-TQM Integration: A Strategy for the Transformation. Dayton (Ohio). SAVE Proceedings: 286-289.
Basili VR, Caldiera G & Rombach HD (1994) Experience Factory. Encyclopaedia of Software Engineering 1: 469-476.
Basili VR & Caldiera G. (1995) Improve Software Quality by Reusing Knowledge and Experience. Sloan Management Review Fall, 37: 55-64.
Bhattacharjee S & Ramesh R (2000) Enterprise Computing Environments and Cost Assessment. Communications of ACM 43(10): 75-82.
Boehm BW (1981) Software Engineering Economics. New Jersey, Prentice-Hall. Boehm BW (1994) Software Architectures: Critical Success Factors and Cost Drivers. Proceedings
on 16th International Conference on Software Engineering, ICSE-16. 16-21th May 1994. Sorrento. IEEE Computer Society: 365.
Boehm BW (2000) Software Economics: A Roadmap. Future of Software Engineering. Limerick, Ireland. ACM: 319-343.
Boehm BW (2003) Value Based Software Engineering: A Case Study. IEEE Computer Society: 33-41.
Bollinger TB & McGowan C (1991) A Critical Look at Software Capability Evaluations. IEEE Software 8(Jul): 25-41.
Briand LC, Langley T & Wieczorek I (2000) A Replicated Assessment and Comparison of Common Software Cost Modelling Techniques. Proceedings of the 22nd International Confer-ence on Software engineering (ICSE). Limerick, Ireland, June. ACM; 377-386.
British Standard (1991) British Standard 4778: Part 2. Brown J (1992) Value Engineering. A Blueprint. Portland (Oregon), Book News. Burt ME (1975) A Survey of Quality and Value in Building. BRE. Campbell M (1995) Tool Support for Software Process Improvement and Capability De-
termination: Changing the Paradigm of Assessment. Software Process Newsletter 4 Fall: 12-15. Capers J (1996) The economics of software process improvement. Software challenges Jan: 95-97. Card D (1991) Understanding Process Improvement. IEEE Software Jul: 102-103. Carnegie Mellon University (Software Engineering Institute, SEI). 2001. The Capability Maturity
Model. Guidelines for Improving the Software Process. New Jersey, Addison-Wesley. Chulani S (2001) Bayesian analysis of software cost and quality models. IEEE International
Conference on Software Maintenance (ICSM'01): 565-568.

169
Coallier F, McKenzie M, Wilson J & Hatz J (1994) Trillium Model for Telecom Product Development & Support Process Capability, release 3.0, Internet Edition. Canada. Bell.
Colenso M (2000) Kaizen Strategies for Successful Organizational Change: Enabling Evolution and Revolution within the Organization. New York, Prentice Hall.
Cooper R & Slagmulder R (1997) Target costing and Value Engineering. Portland (Oregon), Productivity Press.
Crosby PB (1979) Quality is Free. New York, McRaw-Hill. Crum LW (1971) Value Engineering: The organized search for value. London, Longman. Curtis B, Kellner M & Over J (1992) Process Modeling. Communication of the ACM Sept 35(9):
75-90. Dell’ Isola A (1997) Value Engineering: Practical Applications…for design, Construction,
Maintenance & Operations. Kingston (MA), R.S Means Company, Inc. Deming WE (1982) Out of Crisis. Cambridge, MA, MIT: Center for Advanced Engineering Study. Deming WE (1986) Out of Crisis. Cambridge, MA, MIT: Center for Advanced Engineering Study. Drouin J-N (1999) The SPICE Project. Elements of Software Process Assessment and
Improvement. K. El Emam & N. H. Madhavji (eds.) Los Alamitos (CA). IEEE Computer Society: 45-55.
Emam KE & Briand L (1997) Cost and Benefits of Software Process Improvement. Technical report ISERN-97-12. Int’l Software Engineering. Research Network. Available from www.iese.fhg.de/network/ISERN/pub/technical_reports/isern-97-12.ps.gz.
Erdogmus H, Cusumano MA, Kontio JG & Raffo D (2004). The sixth International Workshop on Economics-Driven Software Engineering Research (EDSER-6). Proceedings of the 26th International Conference on Software Engineering (ICSE 04). Edinburg, Scotland. IEEE Computer Society. 761-762.
Fairley (2002) Making Accurate Estimates. IEEE Software Nov: 61-63. Fallon C (1971) Value Analysis to Improve Productivity, Wiley Interscience, 2nd edition. Irving
(TX), Triangle Press. Fry I (1995) London Underground Limited in Perspective. Dayton (Ohio). SAVE Proceedings.: 85-
93. Gilb T (1992) Quality Planning –Result Planware. The Esprit BOOTSTRAP conference on Lean
Software Development. Stuttgart, 22.-23.10. Steinbeis-Zentrum, Europäischer Technolo-gietransfer, Stuttgart.
Grady RB (1997) Successful Software Process Improvement. New Jersey, Prentice-Hall. Haase V, Messnarz R, Koch G, Kugler H & Decrinis P (1994) Bootstrap: Fine-Tuning Process
Assessment. IEEE Software Jul: 25-35. Herbsleb J, Zubrow D, Goldenson D, Hayes W & Paulk M (1997) Capability Maturity Model.
Communications of the ACM 40(6): 30-40. Humphrey WS (1987) Characterizing the Software Process: A Maturity Framework. Software
Engineering Institute. CMU/SEI-87-TR-11. Also published in IEEE Software 1988 5(2): 73-79. Humprey WS (1989) Managing the Software Process, Reading (MA), Addison-Wesley. Humprey WS & Feiler PH (1992) Software Process Development and Enactment: Concepts and
definitions. Tech. Rep. SEI-92-TR-4. Software Engineering Institute. Pittsburgh. Ishikawa K (1985) What is Total Quality Control? The Japanese Way. New Jersey, Prentice-Hall. ISO 9001 (1989) Quality Systems. Model for Quality Assurance in Design / Development,
Production, Installation and Servicing. Geneva: ISO. ISO 9000-3 (1991) Quality Management and Quality Assurance Standards. International Standard.
Part 3: Guidelines for the Application of ISO 9001 to the Development, Supply, and Maintenance of Software. Geneva: ISO.
ISO 9000-4 (1993) Quality Management and Quality System Elements, International Standard. Part 4: Guidelines for Quality Improvement. Geneva: ISO.

170
ISO 12207, ISO/IEC 12207 (1995) International Standard: Information Technology-Software Life Cycle Processes. Geneva: ISO.
ISO 15504, ISO/IEC TR 15504-2: 1998 (E) (1998) Information Technology-Software Process Assessment-Part 2: A Reference Model for Processes and Process Capability. Geneva: ISO.
Johnson DL & Brodman JG (1999) Tailoring the CMM for Small Businesses, Small Organisations, and Small Projects. In: El Emam K & Madhavji NH (eds) Elements of Software Process Assessment and Improvement. Los Alamitos (CA). IEEE Computer Society: 237-257.
Johnson HT (1990) Beyond Product Costing: A Challenge to Cost Management’s Conventional Wisdom. Journal of Cost Management: 15-21.
Jones C (1996b) The Economics of Software Process Improvement. Software Challenges Jan: 95-97.
Jones C (1996) Activity-based software costing. Software Challenges May: 103-104. Juran JM (1988) Juran on Planning for Quality. New York, MacMillan. Järvinen J (2000) Measurement based continuous assessment of software engineering processes.
VTT Electronics. Jørgensen M (2003) How Much Does a Vacation Cost? What is a Software Cost Estimate? ACM
SIGSOFT Engineering Notes 26(6): 1-4. Jung HW (1998) Optimizing Value and Cost in Requirement Analysis. IEEE Software Jul/Aug: 74-
78. Kaplan R & Cooper R (1998) Cost & Effect. Using Integrated Cost Systems to Drive Profitability
and Performance. Harward, Harward Business School Press. Kauffman RJ & Riggins FJ (1998) Information Systems and Economics. Communications of the
ACM 41(8): 32-34. Kelly J & Male S (1993) Value Management in Design and Construction. New York, U.S: E & FN
Spon. Kemerer CF (1998) Progress, Obstacles, and Opportunities in Software Engineering Economics.
Communications of ACM 41(8): 63-66. Kellner M (1989) Software Process Modeling: Value and Experience. SEI techn. Rev. Software
Engineering Institute. Pittsburgh, Carnegie Mellon University: 22-54. Kinnula A (2001) Software Process Engineering Systems: Models and Industry Cases. University
of Oulu. Koskela L & Huovila P (1997) “On foundations of Concurrent Engineering in Construction
CEC’97. London, 3-4 July. London, The Institution of Structural Engineers: 22-23. Krasner H (1999) The Payoff for Software Process Improvement: What it is and How to get it. In:
E1 Emam K & Madhavji NH (eds) Elements of Software process assessment and improvement. Los Alamitos (CA), IEEE Computer Society.
Kuvaja P (1999) BOOTSTRAP 3.0 – A Spice Conformant Software Process Assessment Method-ology. Software Quality Journal 8: 7-19.
Kuvaja P & Bicego A (1993) BOOTSTRAP: Europe’s assessment method. IEEE Software 10(3): 93-95.
Kuvaja P & Bicego A (1994) BOOTSTRAP - a European Assessment Methodology. Software Quality Journal 3:117-127.
Kuvaja P & Bicego A (1999) TAPISTRY – A Software Process Improvement Approach Tailored for Small Enterprises. Software Quality Journal 8: 149-156.
Kuvaja P, Similä J, Krzanik L, Bicego A, Saukkonen S & Koch G (1994) Software Process Assessment & Improvement –The BOOTSTRAP Approach. Oxford (UK), Blackwell Publishers.
Käkölä T (2002) Software Business Models and Contexts for Software Innovation: Key Areas for Software Business Research. Proceedings of the 36th Hawaii International Conference on System Sciences (HICSS’03). IEEE Computer Society.

171
Mathiassen L, Pries-Heje J & Ngwenyama O (2002) Improving Software Organizations –from Principles to Practice. New Jersey, Addison-Wesley.
McFeeley M (1996) IDEAL SM –A User’s Guide to Software Process Improvement. CMU/SEI-96-HB-001, Software Engineering Institute, February.
Merriam-Webster (2005) Online Thesaurus. Available from http://www.m-w.com/cgi-bin/thesaurus?book=Thesaurus&va=assessment&x=11&y=16.
Michaels JV & Younker DI (1994) Value Engineering in the TQM environment. Dayton (Ohio) SAVE Proceedings: 290-295.
Miles L (1972) Techniques of Value Analysis and Engineering. New York, McGraw-Hill. Miyazaki Y, Ohtaka Y, Kubono K, Fujino A & Muronaka K (1995) Software Process Assessment
and Improvement based on Capability Maturity Model for Software. Proceedings of the First World Congress for Software Quality (WCSQ). San Francisco.
Morrissey JH & WU SY (1979) Software Engineering...An Economic Perspective. Proceedings of the 4th International Conference on Software Engineering. Munich, Germany, ACM.: 412-422.
Mosteller F (1981) “Innovation and Evaluation.” Science 211: 881-886. Mudge AE (1971) Value Engineering. New York, McGraw-Hill. Mudge AE (1971) Numerical evaluation of functional relationships, Proceedings. Northbrook (IL),
Society of American Value Engineers. Nanni AJ, Dixon JR & Vollman TE (1990) “Strategic Control and Performance Measurement.”
Journal of Cost Management summer: 34-35. Nemecek S (2001) Software Defects in Software Cost Estimation Models Harm Management.
Management of Engineering and Technology. PICMET '01. Portland International Conference 1: 414 – 415.
Nielsen PA & Pries-Heje J (2002) A framework for Selecting an Assessment Strategy. On Improving Software Organizations. From Principles to Practice. New Jersey, Addison-Wesley: 185-198.
Noda K & Tanaka M (1997) Target Cost Management for Profit Engineering System Based on VE in Japanese Automotive Parts Manufacturing: 211-220.
O’ Brien J (1976) Value Analysis in Design and Construction. New York, McGraw-Hill. Ojala P (2000) Enhancing Software Process Improvement Using Value Engineering. Working
Paper. Series B. University of Oulu. Ojala P (2001) Enhancing Software Process Improvement Using Value Engineering. University of
Oulu. Ojala P (2004) Combining Capability Assessment and Value Engineering: a BOOTSTRAP
example. Proceedings of the Profes 2004. 5th International Conference. Kansai City, Japan, April.
Ooi G, Soh &Lee PM (1998) An Activity Based Costing Approach to Systems Development and Implementation. Proceedings of the International Conference on Information Systems. Helsinki, Finland: 341-345.
Osterweil L (1997) Software Processes are Software too. Proceedings of the Ninth International Conference on Software Engineering. Washington D.C. IEEE Computer Society May 17-23: 540-548.
Oxford University (1992) The Oxford Minireference Thesaurus. Oxford, Oxford University Press. Park R (1999) Value Engineering. A Plan for Invention. New York, St. Lucie Press. Paulson LW (1995) Improving Quality in the Department of Defense with Value Engineering.
Dayton (Ohio). SAVE Proceedings: 280-285. Pierce B (2000) Is CMMI ready for Prime Time? Crosstalk. Available from
http://stsc.hill.af.mil/crosstalk/2000/jul/pierce.asp Princeton University (2003) WordNet 2.0 – Online Dictionary. Available from:
http://dictionary.reference.com/.

172
Putnam LH & Myers W (1997) How solved is the Cost Estimation Problem? IEEE Software Nov: 105-107.
Pyzdek T (1992) To Improve Your Process: Keep It Simple. IEEE Software Sep: 112-113. Reo DA (2000) “The balanced IT Scorecard: quality vs. Strategy Execution”, European Software
Institute. Available from http://www.esi.es/. Rico DF (1999) Using Cost Benefit Analyses to Develop a Pluralistic Methodology for Selecting
from Multiple Prescriptive Software Process Improvement (SPI) Strategies. MSA 685 Project Report. USA.
Rico DF (2004) ROI of Software Process Improvement: Metrics for Project Managers and Software Engineers. Fort Lauderdale, J-Ross Publishing.
Riddle W (1989) Session Summary: Opening Session. Proceedings of the Fourth International Software Process Workshop. Brighton, UK. IEEE Computer Society: 5-10.
Saiedian H & Kuzara R (1995) SEI Capability Maturity Model's Impact on Contractors: 16-26. SAVE International (1998) Value Methodology Standard. Northbrook (IL), Society of American
Value Engineers. SEMA (2000) Process Maturity Profile of the Software Community 1999 Year End Update.
Software Engineering Institute of Carnegie Mellon University. Available from http://www.sei.cmu.edu/sema/pdf/2000mar.pdf
SEI (Software Engineering Institute) (2001) The Capability Maturity Model. Guidelines for Improving the Software Process. Reading (MA), Addison-Wesley Longman, Inc.
Shewhart WA (1986) Statistical Method from the Viewpoint of Quality Control, Washington: Graduate School of Agriculture. Referenced in Deming, W. E. 1986, Out of the Crisis. Cam-bridge (MA), MIT Center for Advanced Engineering Study.
Shillito ML & DeMarle DJ (1992) Value: Its Measurement, Design, and Management. New York, John Wiley & Sons.
Slaughter SA, Harter DE & Krishnan MS (1998) Evaluating the Cost of Software Quality. Communications of the ACM 41(8): 67-73.
Smith W, Lewis G, Churchwell T & Benjamin C (2002) Integrating Activity-Based Costing, Target Costing, And Value Engineering For Supply Chain Improvement. Proceedings of the 5th Biannual World Automation Congress in Orlando. IEEE Eplore 14: 447-452.
Solingen R (2004) Measuring ROI of Software Process Improvement. IEEE Software May: 32-38. Solingen R & Berghout E (1999) The Goal / Question / Metric Method. -A Practical Guide for
Quality Improvement of Software Development. New York, McCraw-Hill Publishers. SQS Software Quality Systems AG (2000) BOOTSTRAP 3.2. Overview. Strike K, El Emam, K & Madhavji N (2001) Software cost estimation with incomplete data.
Software Engineering, IEEE Transactions 27(10): 890–908. Syverson R (1992) Quality Function Deployment and Value Analysis. International Conference of
Society of American Value Engineers in Phoenix: 86-89. Tallon P, Kraemer K & Gurbaxani VA (1999) Value-Based Assessment of the Contribution of
Information Technology to Firm Performance. Working Paper ITR-119. University of California.
Tanaka M & Noda K (1994) VE’s role in Target Cost Management at the Product Design Stage in Japanese Companies. Dayton (Ohio). SAVE Proceedings.
Tolvanen J-P (1998) Incremental Method Engineering with Modeling Tools. University of Jyväskylä.
Zultner RE (1990) Software Total Quality Management (TQM): What Does it Take to be World Class? American Programmer 3(11): 2-11.
Wikipedia (2001-2005) The Free encyclopedia. Available from: http://en.wikipedia.org/wiki/ Main_Page.
Webb A (1993) Value Engineering. Part 1. Engineering Management Journal Aug: 171-175.

173
Webb A (1993) Value Engineering. Part 2. Engineering Management Journal Oct: 231-235. Webster (1979) Webster’s New Intercollegiate Dictionary. Springfield. (MA), G.&C. Merriam Co. Wixson J (1997) Value Managed Failure Analysis and Product/Process Improvement. Dayton
(Ohio). SAVE International Conference Proceedings: 276-283. Yin RK (1994) Case Study Research. Design and Methods. Second Edition. Thousand Oaks (CA),
Sage Publications. Yokoyama Y & Kodaira M (1998) Software Cost and Quality Analysis by Statistical Approaches.
The 20th International Conference on Software Engineering in Kyoto, Japan. IEEE April: 465-467.
Appendices
Appendix 1 Software process assessment principles and methods Appendix 2 Defining VE processes in CMM and BOOTSTRAP models Appendix 3 Company A: Maturity levels


Appendix 1 Software process assessment principles and methods
The most essential underlying concepts in capability-maturity -based assessment are soft-ware process, software process capability, software process performance, and software process maturity. SEI (2001) has defined these concepts as follows:
“A software process is a set of activities, methods, practices and transformations that people employ to develop and maintain software and the associated products (e.g., pro-ject plans, design documents, code, test cases, and user manuals). As an organization ma-tures, the software process becomes better defined and more consistently implemented throughout the organization.”
“Software process capability describes the range of expected results that can be achieved by following a software process. The software process capability of an organization provides one means of predicting the most likely outcomes to be expected from the next software project the organization undertakes.”
“Software process performance represents the actual results achieved by following a software process. Thus software process performance focuses on the results achieved, while software process capability focuses on results expected.”
“Software process maturity is the extent to which a specific process is explicitly de-fined, managed, measured, controlled, and effective. Maturity implies a potential for growth in capability and indicates both the richness of an organization’s software process and the consistency with which it is applied in projects throughout the organization.”
After discussing capability-maturity -based software process assessment, this appendix analyzes the main characteristics of the most common software process assessment meth-ods, techniques and tools, and outlines their connections to each other.
Capability-maturity -based Software Process Assessment
According to process-oriented research there are four main approaches for software proc-ess improvement (SPI) (Kuvaja et al. 1994, 29): assessment, modeling, measurement and technology transfer. These can be used together or separately. Many researchers have concluded that software process assessments are useful tools for software process improvement (SPI) activities. Mathiassen, Pries-Heje & Ngwenyama (2002, 131) recommend using the same tool for subsequent assessments because this allows one to compare the two sets of results, track projects, and plan future activities in a consistent way. They also go on to say that even though it is not difficult to establish an organization’s maturity level, it is difficult to explain the implications of this maturity level without using a consistent model. Using a good method helps an organization to assess its situation against the model’s requirements.
Generally speaking, software process capability is the inherent ability of a software process to produce the planned results. According to SEI (2001, 8-9), it describes the range of expected results that can be achieved by following a software process, and provides one means for predicting the most likely outcomes to be expected from the next

177
software project the organization undertakes. A software process can be defined as a set of activities, methods, practices, and transformations that people employ to develop and maintain software and the associated products (e.g., project plans, design documents, code, test cases, and user manuals). As an organization matures, the software process becomes better defined and more consistently implemented throughout the organization. (SEI 2001, 9)
To understand the background of capability-maturity -based assessment methods, one has to understand the difference between immature and mature software organizations (SEI 2001, 7). In an immature software organization, software processes are often improvised and even if they are defined, they are not necessarily followed. Managers often spend a lot of time solving problems, which pop up everywhere without warning. These organizations have problems following schedules, or the schedules might be absent. Estimates and budgets are usually missing, and if they exist they are often unrealistic, and ignored. Process and product problems lack solutions, and quality criteria are missing or, if they exist, ignored. Testing and code inspections, which are normally used to improve quality, are not carried out when the organization has problems with schedules. Customer opinions and feedback are not collected, and the customer’s participation in development work is small.
Mature organizations manage software development and processes (SEI 2001, 7). They work using documented processes and product criteria. Processes and criteria are updated when needed, and customer participation in product development is the norm. Personnel have significant participation in process improvement, and roles and respon-sibilities within the processes are clear to everyone. Schedules are followed and cost, functionality and quality requirements are met, and management has a clear role in monitoring them. The organization monitors and develops all processes, and the in-frastructure supports the processes used.
SEI (2001, 9) defines software process maturity as: “the extent to which a specific process is explicitly defined, managed, measured, controlled, and effective.” According to their definition, “maturity implies a potential for growth in capability and indicates both the richness of an organization’s software process and the consistency with which it is applied in projects throughout the organization.” An effective software process combines people, tools, and methods in an integrated whole. The quality of the software product is mainly determined by the quality of the processes used to develop it.
SW-CMM 1.1
The Capability Maturity Models (CMMs) have been developed for various purposes in recent years (Carnegie Mellon University 2001). The most recent work on CMM has focused on combining all the CMMs under one CMMI framework (Ahern, Clouse & Turner 2001). However, CMMI has been criticized for being too large and complex (Pierce 2000). It contains 437 practices, 8 key process areas (KPAs) at level two and 11 KPAs at level 3, and it seems to be even bigger than the original CMM-SW v. 1.1.
The original CMM-SW v. 1.1 is based on five levels of process capability and a set of key process areas. In this model, capability levels are used to describe process maturities

178
in key process areas. Lower levels indicate immaturity, and higher levels maturity. The KPAs that are usually thought to relate to process engineering are:
− Organizational Process Focus (OPF) − Organization Process Definition (OPD) − Training Program (TP) − Integrated Software Management (ISM) − Quantitative Process Management (QPM) − Defect Prevention (DP) − Technology Change Management (TCM) − Process Change Management (PCM).
In addition to the above-mentioned KPAs, CMM-SW v. 1.1 includes a couple of process engineering topics which are listed under “Common Features”. The purpose of a Common Feature is to describe the actual activities that aim towards reaching the KPA goal, and the factors that affect the institutionalization of these activities. The Common Features in question are: Training, Orientation, Measurement and Analysis, and Verifying Implementation.
CMM assessments seem highly structured and focused when looking the KPAs. CMM uses a lot of interviews, and the results are therefore based on the opinions of the organization’s employees. The model also includes the ability to monitor KPAs, and measurement is considered an important part of achieving each maturity level. When considering levels 4 and 5, it seems to be essential for the control and optimization of processes.
Trillium 3.0
The goal of the Trillium model is to provide ways to initiate and guide a continuous improvement program. The model is used in a variety of ways: (Coallier et al. 1994)
− To benchmark an organization’s product development and support process capability against best practices in the industry
− In self-assessment mode, to help identify opportunities for improvement within a product-development organization
− In pre-contractual negotiations, to assist in selecting a supplier
The Trillium model and its tools are not themselves a product development process or life cycle model. However, Trillium appears to offer key industry practices which can be used to improve an existing process or life-cycle. Future versions of the model are expected to contain:
− A Re-engineering Roadmap added to the Development Practices Capability Area and − A Management Information Systems Capability Area that includes the following road-
maps: Business Process Engineering, Architectures, Data Management, Data Center Management, and Maintenance.

179
In the Trillium model, Capability Area Three is devoted to process improvement and engineering activities and practices. All the four elements, known as roadmaps, within this area concern product development process-related issues, including the development, improvement and maintenance of the product development process. The existing roadmaps are: (Coallier et al. 1994, 47-57)
− Process definition − Technology management − Process improvement and engineering − Measurements
The new version (3.0) has been updated to cover 100 % of CMM version 1.1, ISO 9001:1994 and 9000-3:1991. This model should thus be used as part of the organization’s program for continuous improvement of product development and support process capability. The levels used for evaluating processes are rated from 1 to 5 as follows:
1. Unstructured 2. Repeatable and Project-Oriented 3. Defined and Process-Oriented 4. Managed and Integrated 5. Fully integrated
Compared to CMM or BOOTSTRAP, the Trillium model also includes external capabil-ity audit (referred to as Joint-Assessment), and Self-Assessment.
ISO 12207
The ISO 12207 standard includes Improvement Process in the organizational process class. Its purpose is to form a basis for assessing, measuring, controlling and improving organizational life cycle processes (ISO 12207, 1995). The activities in this process are:
− Process Establishment − Process Assessment − Process Improvement
Because the ISO 15504 process reference model is aligned with the ISO 12207 model and also contains the characteristics mentioned above, these activities will be described in more detail in the section on ISO 15504-2 and ISO 15504-5.
BOOTSTRAP
The history of the BOOTSTRAP methodology is quite short. A detailed explanation of the methodology’s background and of its previous versions can be found in Kuvaja & Bicego (1993) and Kuvaja et al. (1994). In these publications the main focus is on ex-plaining how the BOOTSTRAP method works, what it includes, and which other methodologies have influenced the BOOTSTRAP methodology. ISO 9000 standards and

180
the Capability Maturity Model have both had a very important influence on the development of the BOOTSTRAP methodology.
The BOOTSTRAP process model consists of three dimensions. The process dimension is called the BOOTSTRAP process model. The process and capability dimensions, together with the technology support dimension, form the full BOOTSTRAP model (Kuvaja 1999, 12). The BOOTSTRAP process model of processes divides processes into three main categories. These categories are: Organization, Methodology and Technology. The Organization category divides processes into:
− Business Engineering − Human Resource Management − Infrastructure Management
The Methodology category divides processes into:
− Life Cycle-Dependent − Life Cycle-Independent − Process-Related
Finally, the Technology category divides processes into:
− Technology Innovation − Technology Support for Life Cycle Dependent − Technology Support for Life Cycle-Independent − Tool Integration
Comparing BOOTSTRAP process structure with ISO 15504, it is obvious that the first two categories are basically similar in both models, as is the Technology Support Proc-esses section of the Technology category. Only Technology Innovation and Tool Inte-gration have a different scope. However, their scope seems to be same as the Technology Change Management KPA in CMM 1.1 and roadmap 3.2 in Trillium 3.0.
In a BOOTSTRAP assessment, processes are evaluated by measuring process capabili-ties. Process capability is the ability of each process to achieve its goals in the context of the assessed organization (Kuvaja 1999, 13).
The BOOTSTRAP process evaluation includes six levels, which are used when assessing all processes (as in ISO 15504):
Level 0: Incomplete Process. The process does not fulfill its purpose. Level 1: Performed Process. The implemented process achieves its defined purpose by
utilizing a set of practices (base practices) that are initiated and followed and that produce identifiable work products.
Level 2: Managed Process. The performed process delivers work products of acceptable quality within defined time scales and resource needs.
Level 3: Established Process. The process is performed according to a standard process definition that has been suitably tailored to the needs of the process instance. The process is performed with qualified and available resources.
Level 4: Predictable Process. The execution of the established process is supported by process goals and measures, which are used to ensure that implementation of the process contributes to the achievement of business goals.

181
Level 5: Optimizing Process. The predictable process optimizes its capability to meet cur-rent and future needs, and achieves repeatability in meeting defined business goals.
In the BOOTSTRAP methodology the capability levels are divided into quartiles so that the evaluation can show how close to or far from the next level the process is. The final results of the BOOTSTRAP assessment are usually presented as a figure to the nearest quartile level, or in the case of a SPICE rating, with a normal 0-5 level rating. Because the assessment consists of two levels, there are two figures. The SPU level presents the results of organizational processes, and the project level shows the results of the individ-ual projects.
The SPU-level profile shows the capability of the organizational processes and represents the management’s point of view. The project-level profile shows the process capability of the individual projects. Comparison between the SPU and project profiles provides valuable information to support improvement planning (Kuvaja 1999, 14).
In the assessment process the assessors also collect information which is not directly included in the rating. This information is used to explain the overall results with exam-ples.
ISO 15504-2 and ISO 15504-5
The ISO 15504 reference model is an attempt to combine the most usable parts of CMM, Trillium and BOOTSTRAP. The 1998 version of ISO 15504: “… consists of processes that establish the business goals of the organization and develop process, product, and resource assets” (ISO 15504 1998, 19). On this basis, the ISO 15504 reference model includes six processes and several subcomponents as follows (ISO 15504 1998):
Org.1: Organizational Alignment Process Org.2: Improvement Process
Org.2.1: Process Establishment Process Org.2.2: Process Assessment Process Org.2.3: Process Improvement Process
Org.3: Human Resource Management Process Org.4: Infrastructure Process Org.5: Measurement Process Org.6: Reuse Process
The ISO framework for software process assessment covers the planning, management, monitoring, control and improvement of the acquisition, supply, development, operation, evolution and support of software. The ISO framework also makes self-assessment possible, and produces a process rating profile. Three basic issues in the ISO model include process improvement, capability determination and process assessment. In practical terms, the idea is to examine the processes of software organization through assessment to determine the capabilities of processes and the direction for process improvement.

182
Compared to CMM, ISO 15504 seems to have combined some good points of the CMM and ISO 9000 standards. For example, it aims to provide a basis upon which the organization can assess or evaluate its competence in the area of software development. In the ISO 15504 model this is done using a framework that examines the relationship that exists between process assessment, process improvement and process capability. In addition it not only calculates capability levels but forms a wide basis for software process improvement by using the framework described above.
Software process improvement viewpoints
Many benefits arise from using a capability-maturity -based assessment model as a framework for improvement. The models establish a common language for talking about the software process, and define a set of priorities for attacking software problems. Many software process improvement models also support measurement of the process by providing a framework for performing reliable and consistent appraisals.
Many models have also been developed in collaboration with the software industry. Hundreds of software professionals have reviewed the models during their development. Based on this development work, these models provide a conceptual framework for improving the management and development of software products in a disciplined and consistent way.
Quite often, software process engineers think that software process assessment meth-ods are the same as improvement methodologies. However, assessment results are usually only a good starting-point towards knowledge of the software process status. According to Humphrey (1987), maturity-based assessment methods lead to the belief that the higher the maturity level, the better the situation.
Critical observers have observed that there are two basic approaches for improvement work: analytical and benchmarking (Card 1991). The analytical approach is based on quantitative evidence and focuses improvement on areas where it is needed. There are several different analytical approaches, which are based on Shewhart’s plan/do/check/act cycle (see, for example, Ishikawa 1985, Zultner 1990, Gilb 1992, Basili & Caldiera 1995). The classic Shewhart cycle, also known as the Deming cycle, presents a procedure for quality control by applying metrics to the process. The four steps in the model are Kinnula, 2001):
− Plan - Establish a (new) target for the process in terms of measurable characteristics − Do - Execute the process − Check - Compare the measurements against the planned target − Act - Take corrective action to improve the process.
The capability-maturity -based models, such as CMM or BOOTSTRAP, clearly demonstrate the concept of benchmarking. Benchmarking assumes that if an organization with a lower capability level adopts tools and practices from an organization with a higher capability level, it will also reach the higher level. Unfortunately, this has too often led to situations where an organization just looks at the capability-level requirements as

183
the main goal for improvement work, and misses the idea of developing the areas most important to its own business needs.
The combination of these two approaches has been identified as a necessity (Järvinen 2000). However, Pyzdek (1992) points out that every organization must come up with an approach that works for them. Therefore it seems that selecting an appropriate improve-ment path leads to a good start for improvement work (McFeeley 1996, ISO 15504-7 1998). For example, PROFES aims to this using a variant of the Quality Improvement Paradigm (QIP) improvement cycle, as well as, combining assessment and measurement (Basili et al. 1994).
Summary
This appendix has addressed the main characteristics of the most common capability-maturity -based assessment methods and techniques. It is obvious that all the presented software process assessment methods are useful in software process improvement activi-ties. Quite often they have also the same kinds of characteristics, such as process models, rating principles, and the use of interviewing techniques as a part of determining maturity levels for processes. However, one must be aware that the process models used in each assessment method examined do differ. Therefore, it is reasonable to recommend sticking to a single method for all assessments. When the same method is used for all assessments, results can be compared and the path for improvement work seems clearer.
Humphrey’s argument (Humphrey, 1987) that maturity-based assessment methods lead one to think that the higher the maturity level, the better the situation, is still reason-able. However, since it normally takes several years, according to SEI (2001, 14) even ten or more years, to build a foundation for continuous process improvement toward higher maturity levels one could claim that the method has to show the business benefits of using it as well. There should be clear evidence that the increase in maturity gives business value as well. Combining maturity assessment with value assessment helps the organization to identify which processes are most valuable, and how mature they are.

Appendix 2 Defining VE processes in CMM and BOOTSTRAP models
This appendix discusses possible ways to add VE processes to CMM and BOOTSTRAP models.
CMM
In CMM, maturity levels are divided into their constituent parts. Each maturity level is composed of several key process areas, and each key process area is organized into five sections called Common Features. The Common Features contain the key practices that, when collectively addressed, accomplish the goals of the key process area. See Figure 27 for the structure of CMM.
According to SEI (2001, 30-40), except for level 1, each maturity level is broken down into several key process areas. All these areas indicate where the organization should concentrate in order to improve its software process (see Figure 28). Process areas identify the issues that must be addressed to achieve a given maturity level. For example, if an organization is at level 3, it has addressed all of the key process areas at levels 2 and 3. The adjective “key” implies that some process areas (and processes) are not key to achieving a certain maturity level. The key process areas may be considered as re-quirements for achieving a maturity level. To achieve a maturity level, the key process areas for that level (and lower levels) must be satisfied, and the processes must be institutionalized. The goals of each key process area summarize its key practices and can be used in determining whether an organization or project has successfully implemented the key process area. The goals signify the scope, boundaries, and intent of each process area.
One possibility for the inclusion of VE processes in the CMM structure would be to see them as an independent key process area. This addition seems to be justified, because VE processes have their own independent goals, as well as practices which when collectively addressed accomplish the goals of “VE as key process area.” This possibility is also supported by the definition of a mature organization according to the CMM model,

185
which states that: “In a mature organization, managers monitor the quality of the software products and process that produces them. There is an objective quantitative basis for judging product quality and analyzing problems with the product and process. Schedules and budgets are based on historical performance and are realistic; the expected cost, schedule, functionality, and quality of the product are usually achieved. In general, the mature organization follows a disciplined process consistently because all of the participants understand the value of doing so, and the necessary infrastructure exists to support the process.” (SEI 1999, 7) If we understand this to be the heart of “maturity”, it would mean that in a mature organization, costs are followed, analyzed and tracked. The organization knows the historical performance of costs and understands their realistic level. As well costs are kept as one criterion for “achieving maturity since the definition is defining a mature organization.” There exist budgetary limits, which are followed and usually achieved. Furthermore, the organization even understands the value of doing so. Costs should also be handled equally in relation to other aims such as schedule, functionality and quality of product. Therefore, one justified requirement would be that the processes which collect and analyze cost data should be considered as one criterion for achieving maturity levels. However, the cost point of view can also be challenged by saying that it does not explain to us what are our customer’s interests, as Value (value=worth/cost) is doing when including worth as well.
Another possible way to include VE processes in the CMM would be to see them as additional process areas. These would not be required for the achievement of software engineering maturity levels, but would be used in their own maturity path, to indicate the level of maturity in VE. This addition would mean that all processes existing in the CMM model would be assessed normally and would have their own “software engineering maturity levels”, and VE processes would have their own Value Engineering maturity levels. However, when looking critically at the definition of a mature organization, this approach has some weaknesses.
The key process areas at level 2 focus on software project concerns related to estab-lishing basic project management controls (SEI 2001, 32). The basic aim is that processes are established to track cost, schedule and functionality. To fulfill the requirements of level 2 a project has to be able to repeat earlier successes with similar applications. The key process areas for level 2 include (SEI 2001, 32-35):
− Requirements Management − Software Project Planning − Software Project Tracking and Oversight − Software Subcontract Management − Software Quality Assurance − Software Configuration Management

186
Fig. 27. CMM structure (SEI 2001, 33)
In terms of Value Engineering processes, “Information” and “Presentation” could perhaps most clearly be characterized as level 2 processes. This is because they are established to track and collect cost information, and to propose also schedules for decision-making, which SEI (2001, 34) has defined as one purpose of level 2. Both of these VE processes establish basic project management controls, “collecting information and presenting it.” As a process, “Information” is also a significantly customer-oriented function, because it collects information about customer needs and wants as requirement management process does when collecting requirement information and being in level 2. It also collects cost information, which is often used for SW project planning and estimation (level 2). “Presentation” presents results and establishes a way to present cost-related information, and this is very typical of all level 2 projects when making software project planning and project initiation decisions. Therefore, this process seems to belong together with software project tracking and oversight (level 2), as well as with software project planning (level 2). Both processes, “Information” and “Presentation” are also strongly project level issues, since in this level information about what will be done and presentation, how it can be done are usually implemented. Only the sophisticated ways of doing might be missing (For more specific information on level 2 processes see SEI 2001, 34).
The key process areas at Level 3 address both project and organizational issues, as the organization establishes an infrastructure that institutionalizes effective software engineering and management processes across projects. The software process for both management and engineering activities is documented, standardized, and integrated into
Maturity levels
Process Containcapability
Key process areas
Goals Organised by
Common features
Implementation orinstitutionalization Contain
Key practises
Activities orinfrastructure

187
an organization-wide software process. All projects use a documented and approved ver-sion of the organization’s process for developing and maintaining software (SEI 2001, 35). The key process areas for Level 3 are (SEI 2001, 35-37):
− Organization Process Focus − Organization Process Definition − Training Program − Integrated Software Management − Software Product Engineering − Inter-group Coordination − Peer Reviews
“Function Analysis”, “Creativity” and “Evaluation” could perhaps be characterized as level 3 processes. They establish an infrastructure that enables effective Value Engi-neering. Information is not any more only collected and presented, but also analyzed systematically using defined standard tool like Function Analysis. Since the results of Function Analysis are the basis for creating new improvement possibilities, it seems logical that these processes are in a same level. On the other words “Creativity” is a standardized way to look improvement possibilities based on Function Analysis. Same logic applies also with “Evaluation” which is used to evaluate the ideas invented in “Creativity” phase. All three processes are also very well standardized and documented in Value Engineering. According to SEI (2001, 35-37), it is typical that level 3 processes:
− Establish the organizational responsibility for software process activities that improve the organization’s overall process capability.
Develop and maintain a usable set of software process assets that improve process performance across the projects and provide a basis for defining meaningful data for quantitative process management.
− Integrate the software engineering and management activities into a coherent, defined software process that is tailored from the organization’s standard software process and related process assets.
− Establish a means for the software engineering group to participate actively with other engineering groups so that the project is better able to satisfy the customer’s needs effectively and efficiently.
VE processes fulfill these aims well. Detailed Function Analysis produces value, cost, and worth information for the examined functions, which improves the overall business capability of processes. It also presents usable value, cost and worth numbers of process performance for the use of quantitative process management. Together with Function Analysis, Creativity and Evaluation integrate software engineering and management activities effectively. This is because in Evaluation the company has to publish the criteria that it will use for evaluating existing and analyzed engineering practices. In many companies, evaluation criteria for improvement are published by top-level management. In other words, the top-level management develops the criteria to evaluate improvement proposals, which are considered as investments. Creativity, on the other hand is strongly related to strategy planning, where brainstorming and existing data is used for improvement work and future planning.

188
The key process areas at level 4 focus on establishing a quantitative understanding of both the software process and the software products being built. Detailed measures of the software process and product quality are collected. The software process and products are quantitatively understood and controlled using detailed measures (SEI 2001, 37). The key process areas for level 4 are (SEI 2001, 37-38):
− Quantitative Process Management − Software Quality Management
Fig. 28. One suggestion for enhancing key process areas by maturity level
The VE process “Development” is based heavily on quantitative understanding of both the software process and the software product being built. Detailed measures are carried out in order to discover the economic profitability of proposed new improvements, and historical data concerning similar cases is also used. Only ideas in line with the
OptimizingDefect prevention Technology change management Process change management
ManagedQuantitative process managementSoftware quality managementDevelopment
DefinedOrganisation process focusOrganisation process definitionTraining programIntegrated software managementSoftware product engineeringIntergroup coordinationPeer reviewsFunction analysisEvaluationCreative
RepeatableRequirements managementSoftware project planningSoftware project tracking and oversightSoftware subcontract managementSoftware quality assuranceSoftware configuration managementInformationPresentation
Initial

189
customer’s needs and wants, and with the manufacturer’s strategy and economic and technical capabilities are considered. If value information shows that the proposed idea will not improve value, it is rejected. If none of the proposed ideas would improve value, the VE team returns to an earlier phase to create new ideas. These aims are very well aligned with SEI’s (2001, 38) aim for level 4 processes: “Quantitative goals are established for software products based on the needs of the organization, the customer, and the end users. So that these goals may be achieved, the organization establishes strategies and plans, and the project specifically adjusts its defined software process to accomplish the quality goals.” Rather often the improvement proposals are written directly based on “Evaluation,” which already includes weighted criteria for selecting improvement proposals for implementing. This is perhaps due to the fact that creating quantitative understanding based on measurements is demanding criteria.
The key process areas at level 5 cover the issues that both the organization and the projects must address in order to implement continuous and measurable software process improvement. Continuous process improvement is enabled by quantitative feedback from the process, and by testing innovative ideas and technologies (SEI 2001, 38). The key process areas for level 5 are (SEI 2001, 38-39):
− Defect Prevention − Technology Change Management − Process Change Management
Each key process area is described in terms of key practices. The key practices describe the activities and infrastructure that contribute most to the effective implementation and institutionalization of the key process area. The key practices describe what is to be done, but they should not be understood so that they explain how the process should be implemented. Alternative practices may also fulfill the goals of the key process area just as well. For more on common features and key practices in CMM see SEI (2001).
BOOTSTRAP
The BOOTSTRAP method has originally three dimensions: process dimension (BOOTSTRAP process model), capability dimension and technology support dimension (Kuvaja 1999). The BOOTSTRAP process dimension including a process tree is a structured way to identify process clusters, processes and base- and management practices. The process tree shows the hierarchical relationship between various components (SQS, Software Quality Systems AG 2000, 1). In the process tree the root represents the full architecture. The second level shows all the main categories to be assessed: organization, methodology and technology. Furthermore in method specifications process clusters are divided into defined processes and base and management practices, which are assessed.
Based on the principles of enhancing capability-maturity -based assessment with VE (Chapter 5.2), VE processes are a clearly independent process cluster having own methodological background designed to collect, analyze, evaluate, develop and present value improvement ideas step by step. Since they form independent entity there does not

190
seem to be any reason to split them up into several different process clusters and loose the hierarchical logic of the model. As an independent process cluster their nature is kept intact and the hierarchy of the model stays clear. Since Orientation phase and Function Analysis are also related to all other processes and their base and management practices, this solution seems natural.
Perhaps VE processes could be included also to cluster of organizational processes. At least this statement would be partially justified, because value controlling activities base clearly on cost accounting, which is an organizational process even it is not presented in the model. A negative consequence of this would, however be, that the visibility of the capability to VE would be partially lost. This would happen because the capability sum of VE would be included to the organizational processes and it does not seem to have a lot in common, in this sense, with processes like Human Resources Management or Infrastructure Management. Generally, this would also be against the idea that capability and value should be considered equal or as equal as possible in the assessment, as presented in the beginning of this study. The BOOTSTRAP process tree including VE processes is presented in Figure 29 with common process identifiers (VAL).
The capability dimension of the BOOTSTRAP 3.2 model consists of six capability levels matching the capability levels in the reference model in part 2 of ISO 15504. Management practices with their associated attribute indicators are the indicators of proc-ess capability and are the means of achieving the capabilities addressed by the process attributes. Evidence of management practice performance supports the judgment of the degree of achievement of the process attribute. Specific management practices are linked to each process attribute. The set of management practices is used in all processes in the process dimension of the model.
At level 2 (managed) the characteristics of the VE processes include:
− Management of the execution of the process to produce work products within the stated time and resource requirements
− Work products that are documented and controlled − Work products that meet their functional and non-functional requirements − Work products that are in line with product quality goalsThe most important difference from the preceding level is that the performed process delivers work products of acceptable quality within defined time scales and resource needs.
At level 3 (established) it is typical that the VE process:
− Uses a process definition based on the standard process in order to contribute to the stated organizational business goals
− Effectively utilizes skilled human resources and infrastructure to contribute to the stated organizational business goals
The most important difference from the preceding level is that the managed process is performed using a defined process based on good software engineering principles.

191
Fig. 29. The VE-enhanced BOOTSTRAP process model
At level 4 (predictable):
− The VE process is supported by defined goals and measures which are used to ensure the achievement of overall process goals
− The VE process is controlled through the collection and analysis of measures to con-trol and correct the performance of the process, to reliably achieve the defined process goals
The most important difference from the preceding level is that the established process is performed consistently within defined control limits to achieve its goals.
V A L.1 Inform ation V A L.2 Function analysis V A L.3 C reative V A L.4 Evaluation V A L.5 D evelopm ent V A L.6 Presentation O R G.1 Business engineering TEC .1 Technology Innovation O R G.2 H um an R esource M anagem ent TEC .2 Technology Support for
Life C ycle Processes O R G.3 Infrastructure M anagem ent TEC .3 Technology Support for
Life C ycle Independent Processes Tool in tegration . EN G.1 System R equirem ents Analysis PR O .1 Process definition EN G.2 System Architecture D esign PR O .2 Process Im provem ent EN G.3 Software R equirem ents Analysis EN G.4 Software Architecture D esign EN G.5 Software D etailed D esign EN G.6 Software Im plem entation and Testing EN G.7 Software In tegration and Testing EN G.8 System In tegration and Testing EN G.9 M aintenance EN G.10 M igration EN G.11 R etirem ent
SU P.1 D ocum entation M AN .1 Project m anagem ent SU P.2 C onfiguration M anagem ent C U S.1 A cquisition M AN .2 Q uality M anagem ent SU P.3 Quality Assurance C U S.2 C ustom er need m gnt M AN .3 R isk M anagem ent SU P.4 V erification C U S.3 Supply M AN .4 Subcontractor SU P.5 V alidation C U S.4 Software O peration M anagem ent SU P.6 Join t R eview C U S.5 C ustom er Support SU P.7 Audit SU P.8 Problem R esolu tion
B O O T ST R A P 3.2
M ETH O D O LO GY TEC H N O LO GY O R G A N IZ ATIO N
LIFE C Y C LE IN D EPE N D EN T
LIFE C Y C LE D E P EN D EN T
P R O C ESS - R ELA TED
M A N A GEM EN T SUPP O R T
C U STO M ER SU PP LIER
V A LU E EN GIN EER IN G

192
At level 5 (optimizing), in the VE process:
− Changes to the definition, management and performance of the process are controlled to achieve business goals
− Changes to the process are identified and implemented to ensure continuous im-provement in fulfillment of business goals.
The most important difference from the preceding level is that the predictable process optimizes its performance to meet current and future needs and achieve repeatability.
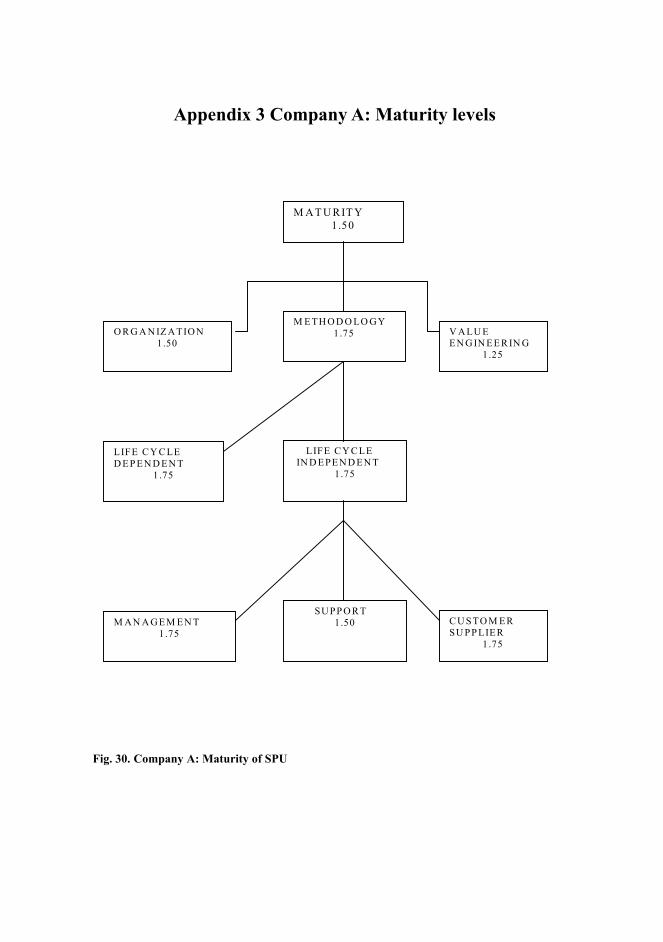
Appendix 3 Company A: Maturity levels
Fig. 30. Company A: Maturity of SPU
M A T U R IT Y 1.50
M ETH O D O LO GY 1.75 V ALU E
EN G IN EER IN G 1.25
O R G A N IZ ATIO N 1.50
LIFE C Y C LE IN D EPEN D EN T
1.75
LIFE C Y C LE D EP E N D EN T
1.75
M AN A GEM EN T 1.75
SUPP O R T 1.50 C U STO M ER
SU PP LIER 1.75

194
Fig. 31. Company A: Maturity of Project A
M A T U R IT Y 1 .5 0
M E T H O D O L O G Y 1 .7 5 V A L U E
E N G IN E E R IN G 1 .2 5
O R G A N IZ A T IO N 1 .2 5
L IF E C Y C L E IN D E P E N D E N T
1 .7 5
L IF E C Y C L E D E P E N D E N T
1 .7 5
M A N A G E M E N T 1 .5 0
S U P P O R T 1 .7 5 C U S T O M E R
S U P P L IE R 2 .0 0

195
Fig. 32. Company A: Maturity of Project B
M A T U R IT Y 1.50
M ETH O D O LO GY 1.75 V ALU E
EN G IN EER IN G 1.25
O R G A N IZ ATIO N 1.50
LIFE C Y C LE IN D EPEN D EN T
1.75
LIFE C Y C LE D EP E N D EN T
2.00
M AN A GEM EN T 1.50
SUPP O R T 1.75 C U STO M ER
SU PP LIER 2.00

A C T A U N I V E R S I T A T I S O U L U E N S I S
Distributed byOULU UNIVERSITY LIBRARY
P.O. Box 7500, FI-90014University of Oulu, Finland
Book orders:OULU UNIVERSITY PRESSP.O. Box 8200, FI-90014University of Oulu, Finland
S E R I E S A S C I E N T I A E R E R U M N A T U R A L I U M
455. Molin-Juustila, Tonja (2006) Cross-functional interaction during the early phasesof user-centered software new product development: reconsidering the commonarea of interest
456. Thomson, Robert L. (2006) Breeding habitat selection and its consequences inboreal passerines. Using the spatial dispersion of predators and heterospecifics asa source of information
457. Iivari, Netta (2006) Discourses on ‘culture’ and ‘usability work’ in softwareproduct development
458. Vähäoja, Pekka (2006) Oil analysis in machine diagnostics
459. Mutanen, Marko (2006) Genital variation in moths—evolutionary and systematicperspectives
460. Bhaumik, Prasenjit (2006) Protein crystallographic studies to understand thereac t ion mechan i sm o f enzymes : α -methy lacy l -CoA racemase andargininosuccinate lyase
461. Korkalo, Tuomo (2006) Gold and copper deposits in Central Lapland, NorthernFinland, with special reference to their exploration and exploitation
462. Pahnila, Seppo (2006) Assessing the usage of personalized web informationsystems
463. Puhakainen, Petri (2006) A design theory for information security awareness
464. Rytkönen, Anna (2006) The role of human replicative DNA polymerases in DNArepair and replication
465. Rönkä, Antti (2006) Dynamics, genetic structure and viability of a small anddeclining Temminck's stint (Calidris temminckii) population
466. Wäli, Piippa (2006) Environment and genetic background affecting endophyte-grass symbiosis
467. Broggi, Juli (2006) Patterns of variation in energy management in wintering tits(Paridae)
468. Mykrä, Heikki (2006) Spatial and temporal variability of macroinvertebrateassemblages in boreal streams: implications for conservation and bioassessment
469. Kekonen, Teija (2006) Environmental information from the Svalbard ice core forthe past 800 years
A470etukansi.fm Page 2 Wednesday, November 1, 2006 11:28 AM

U N I V E R S I TAT I S O U L U E N S I SACTAA
SCIENTIAE RERUMNATURALIUM
OULU 2006
A 470
Pasi Ojala
IMPLEMENTING A VALUE-BASED APPROACH TO SOFTWARE ASSESSMENT AND IMPROVEMENT
FACULTY OF SCIENCE, DEPARTMENT OF INFORMATION PROCESSING SCIENCE,UNIVERSITY OF OULU
ABCDEFG
UNIVERS ITY OF OULU P.O. Box 7500 F I -90014 UNIVERS ITY OF OULU F INLAND
A C T A U N I V E R S I T A T I S O U L U E N S I S
S E R I E S E D I T O R S
SCIENTIAE RERUM NATURALIUM
HUMANIORA
TECHNICA
MEDICA
SCIENTIAE RERUM SOCIALIUM
SCRIPTA ACADEMICA
OECONOMICA
EDITOR IN CHIEF
EDITORIAL SECRETARY
Professor Mikko Siponen
Professor Harri Mantila
Professor Juha Kostamovaara
Professor Olli Vuolteenaho
Senior Assistant Timo Latomaa
Communications Officer Elna Stjerna
Senior Lecturer Seppo Eriksson
Professor Olli Vuolteenaho
Publication Editor Kirsti Nurkkala
ISBN 951-42-8211-6 (Paperback)ISBN 951-42-8212-4 (PDF)ISSN 0355-3191 (Print)ISSN 1796-220X (Online)
A 470
AC
TA Pasi O
jalaA470etukansi.fm Page 1 Wednesday, November 1, 2006 11:28 AM