Embed Size (px)
Citation preview

Implementing Emerging Technologies For The Water Sector: Case Studies Emerging Technology Summit Sacramento, CA Nov 7-9, 2010
Eliza Jane Whitman, PE, LEED AP Vice President
Director of Sustainable Strategies Parsons
2
Emerging Technology Trends
Lots of money being invested for energy efficient & renewable technologies
Increased interest in new technologies Political drivers:
Be ‘sustainable’ Be ‘efficient’
Vendors/salesmen knocking on doors Many new technologies claiming to be
sustainable and energy efficient
3
What Needs To Be Overcome
• Concern of promoting and spending money on a non-competitive item (sole source)
• Perceptions that technologies are experimental - Being the guinea pig on model # 001
• Departmentalization – Accountant/risk manager vs operator/ maintenance staff: not the same priorities
• Conservative engineering approaches, management and decision making (i.e. capital costs only)
• Hear no evil: Speak no evil: See no evil - if not efficient, boss will wonder why it was not caught before
“Our industry is full of examples where equipment failed. If they (clients) have been around for awhile, they may be gun-shy.”
4
Smaller Agencies - Status
Smaller agencies often have the highest energy inefficiencies – under/over designed; poorly installed
No time to evaluate new and emerging technologies (limited staff)
Budget cuts require agencies to focus on the traditional projects
Only enough time and budget to complete capital and maintenance projects (limited funds)
Insufficient staff, or skill sets for energy audits and efficiency evaluations, payback calculations, grants, and overall understanding of benefits
5
Larger Agencies - Status
Larger bureaucracies, thus change difficult due to the multiple layers
Need a champion that is willing to work through the change process at a high enough level
Often engineering departments capable of evaluating new & ET, performing energy audits & economic analysis with payback
More willing and financially capable of funding non-traditional projects
Often will have already identified & installed improvements for decreasing inefficient systems &/or equipment
6
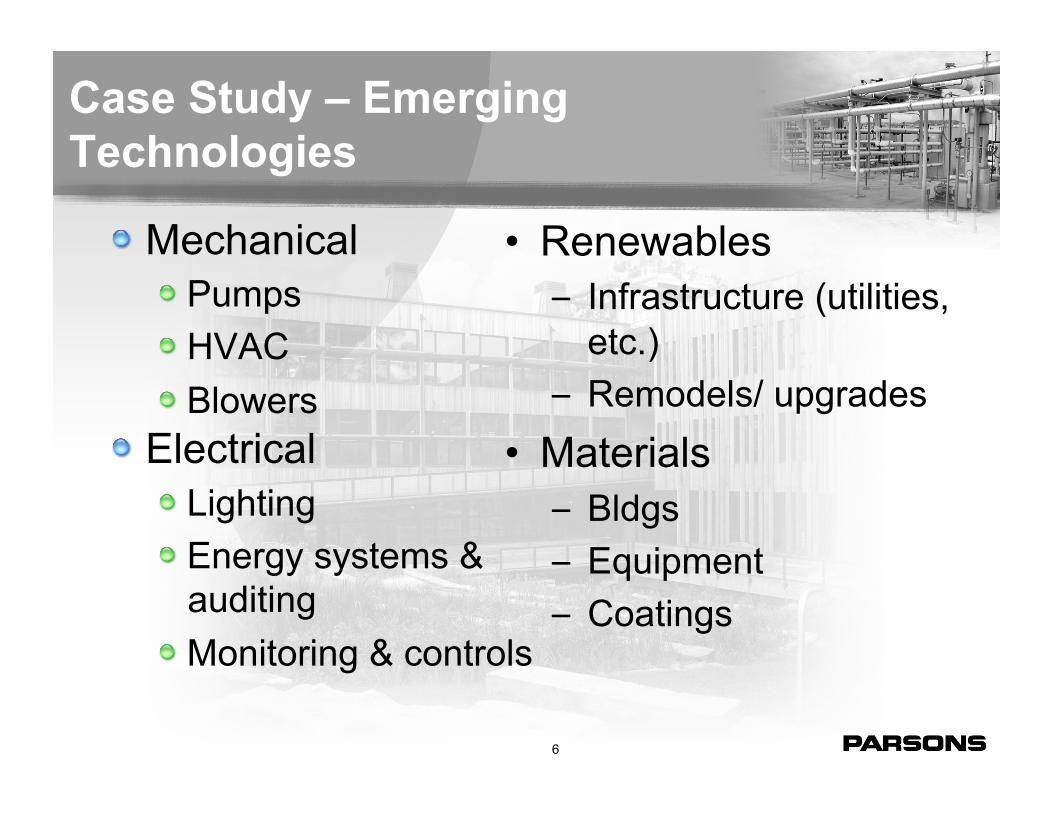
Case Study – Emerging Technologies
Mechanical Pumps HVAC Blowers
Electrical Lighting Energy systems &
auditing Monitoring & controls
• Renewables – Infrastructure (utilities,
etc.) – Remodels/ upgrades
• Materials – Bldgs – Equipment – Coatings
7
What Do We Know Works ?
Grants and other incentives to try new technologies Incorporating technologies into projects already
scheduled and in the works Company backing & proven technical expertise Some way to remove if it fails A sharing of loss/costs Assistance with energy audits and efficiency
evaluations, payback calculations, grants, and overall understanding of benefit
8
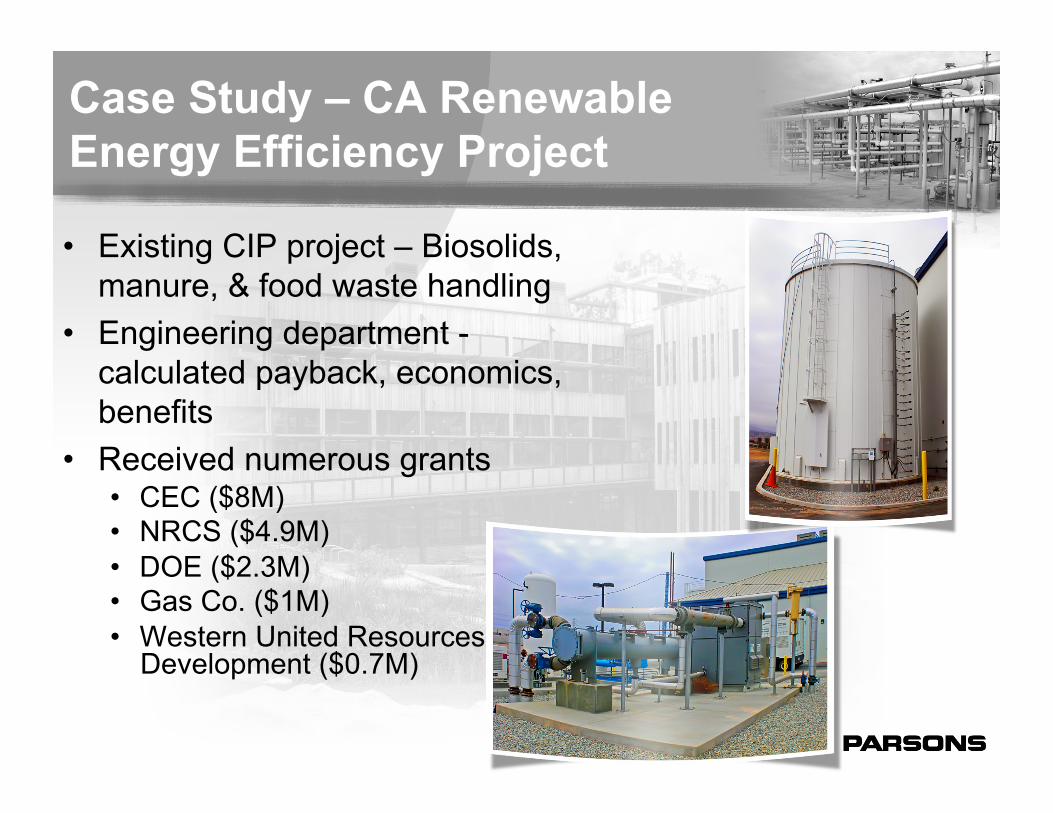
Case Study – CA Renewable Energy Efficiency Project
• Existing CIP project – Biosolids, manure, & food waste handling
• Engineering department -calculated payback, economics, benefits
• Received numerous grants • CEC ($8M) • NRCS ($4.9M) • DOE ($2.3M) • Gas Co. ($1M) • Western United Resources
Development ($0.7M)
9
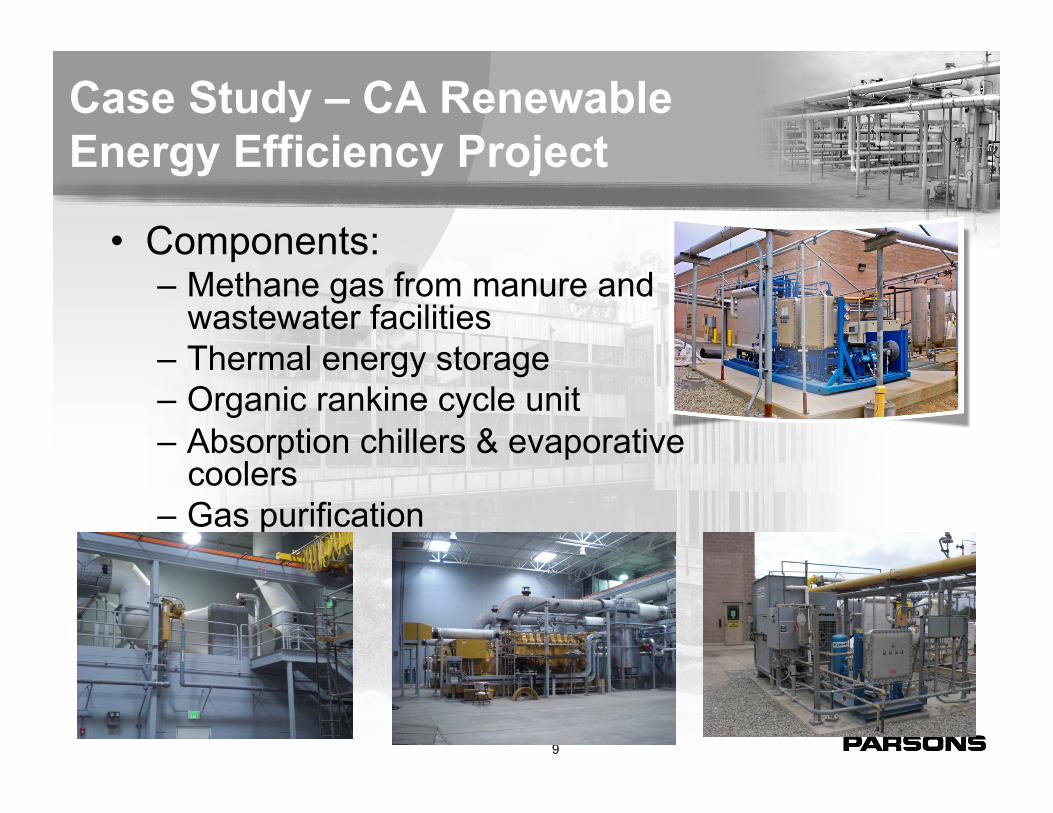
Case Study – CA Renewable Energy Efficiency Project
• Components: – Methane gas from manure and
wastewater facilities – Thermal energy storage – Organic rankine cycle unit – Absorption chillers & evaporative
coolers – Gas purification
10
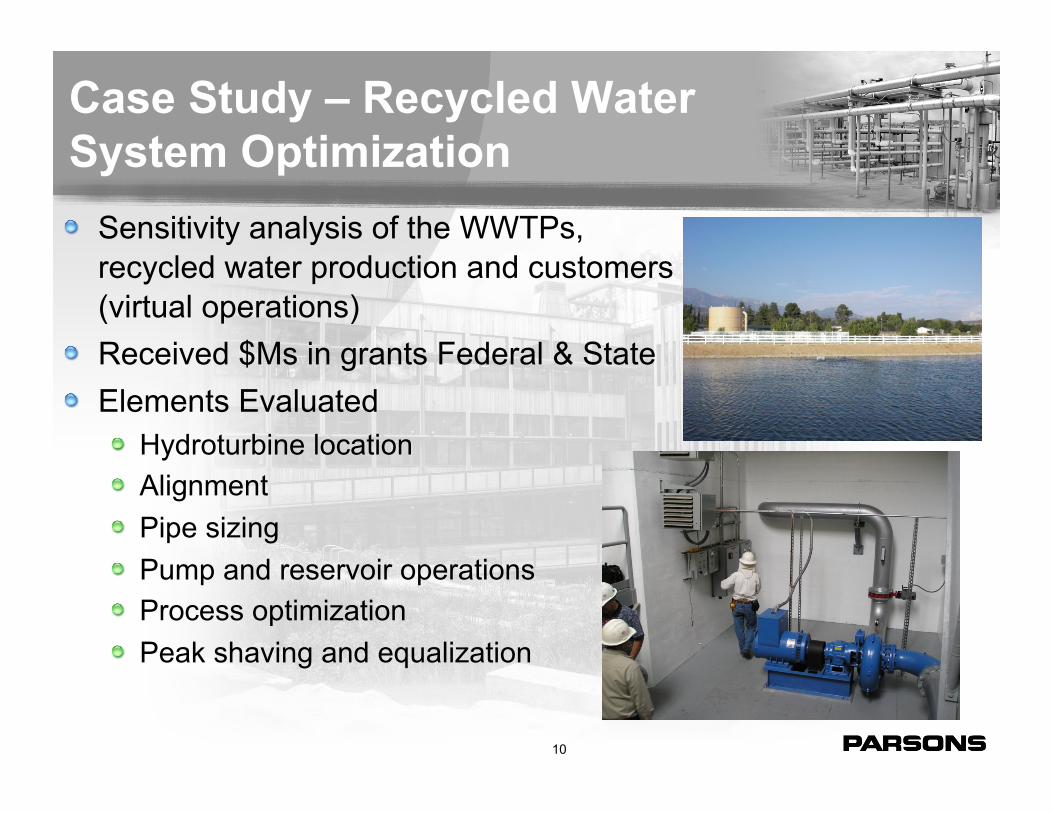
Case Study – Recycled Water System Optimization Sensitivity analysis of the WWTPs,
recycled water production and customers (virtual operations)
Received $Ms in grants Federal & State Elements Evaluated
Hydroturbine location Alignment Pipe sizing Pump and reservoir operations Process optimization Peak shaving and equalization
11
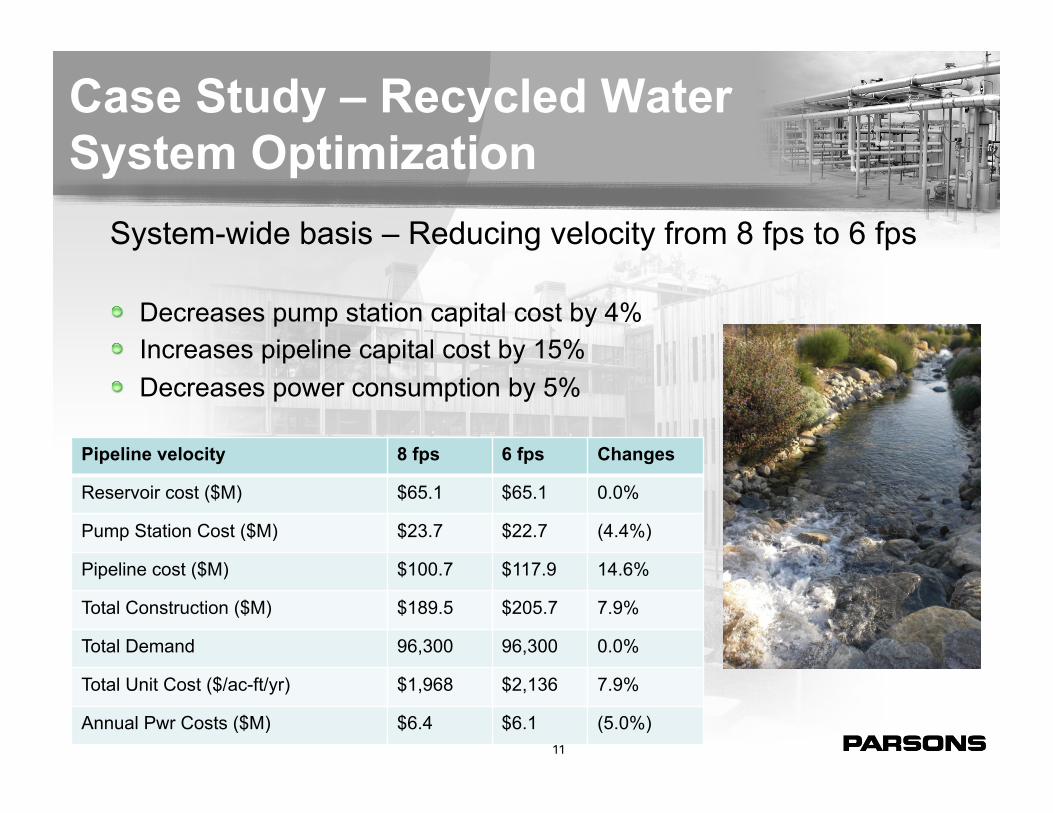
Case Study – Recycled Water System Optimization
System-wide basis – Reducing velocity from 8 fps to 6 fps
Decreases pump station capital cost by 4% Increases pipeline capital cost by 15% Decreases power consumption by 5%
Pipeline velocity 8 fps 6 fps Changes
Reservoir cost ($M) $65.1 $65.1 0.0%
Pump Station Cost ($M) $23.7 $22.7 (4.4%)
Pipeline cost ($M) $100.7 $117.9 14.6%
Total Construction ($M) $189.5 $205.7 7.9%
Total Demand 96,300 96,300 0.0%
Total Unit Cost ($/ac-ft/yr) $1,968 $2,136 7.9%
Annual Pwr Costs ($M) $6.4 $6.1 (5.0%)
12
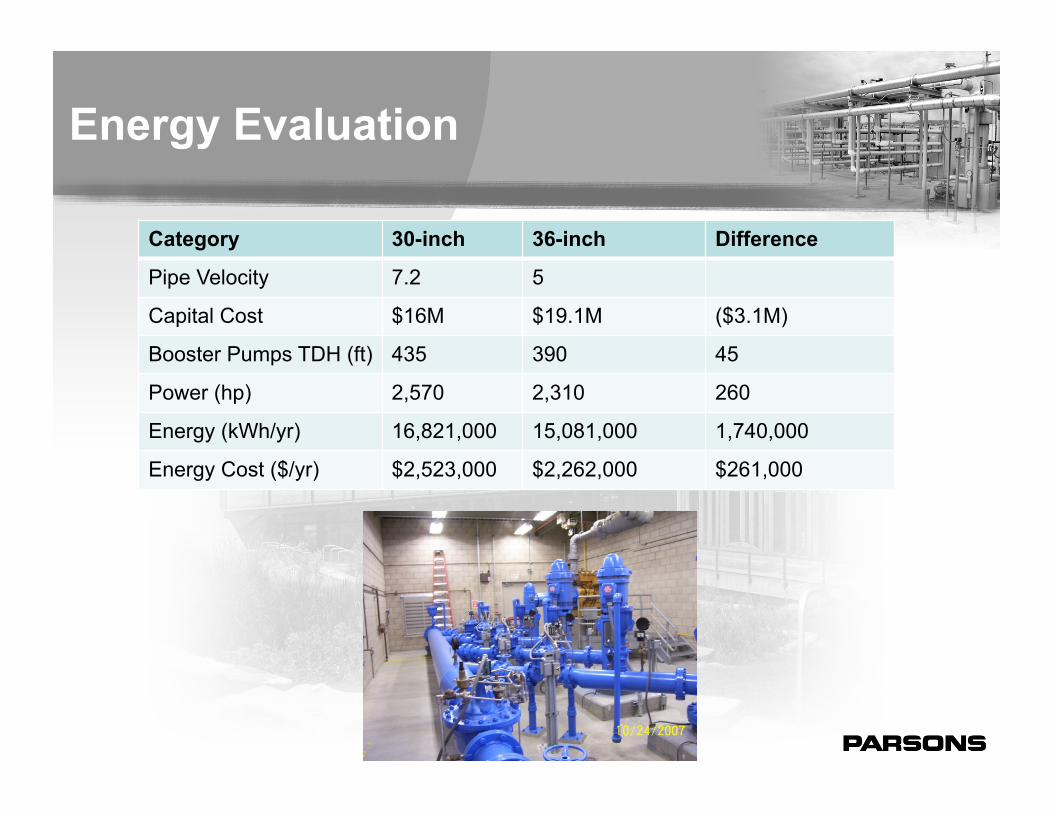
Energy Evaluation
Category 30-inch 36-inch Difference
Pipe Velocity 7.2 5
Capital Cost $16M $19.1M ($3.1M)
Booster Pumps TDH (ft) 435 390 45
Power (hp) 2,570 2,310 260
Energy (kWh/yr) 16,821,000 15,081,000 1,740,000
Energy Cost ($/yr) $2,523,000 $2,262,000 $261,000
13
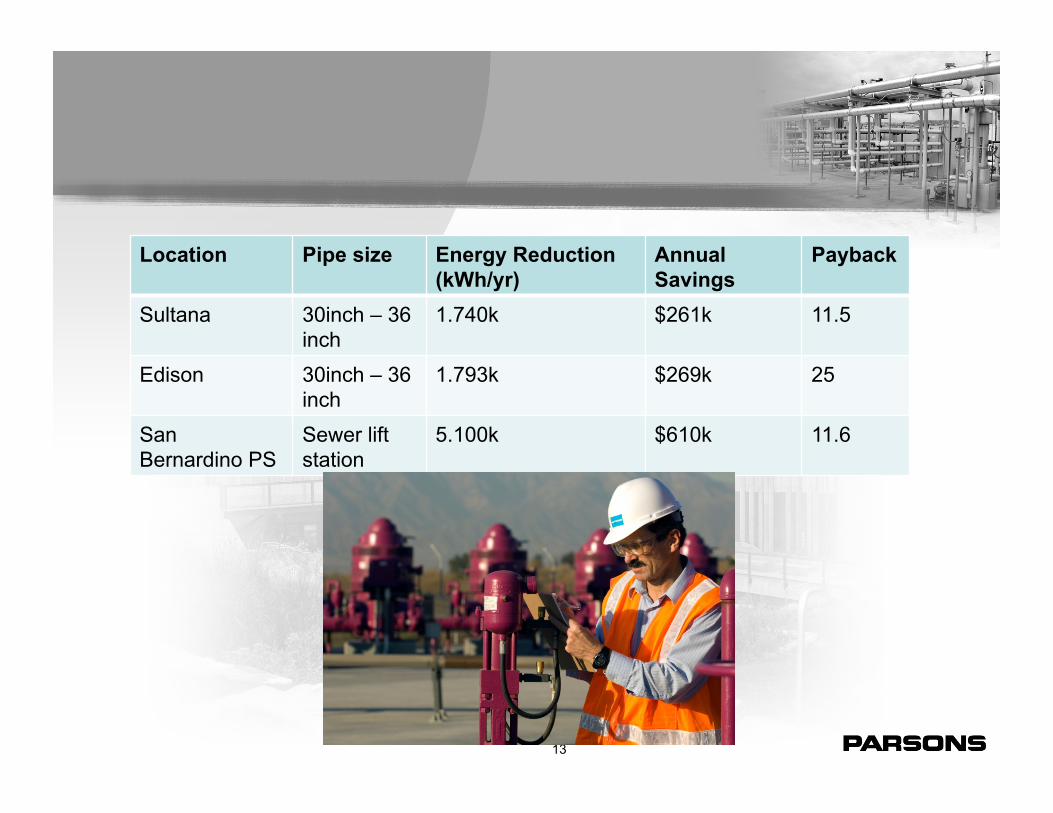
Location Pipe size Energy Reduction (kWh/yr)
Annual Savings
Payback
Sultana 30inch – 36 inch
1.740k $261k 11.5
Edison 30inch – 36 inch
1.793k $269k 25
San Bernardino PS
Sewer lift station
5.100k $610k 11.6
14
Potential Approach
Encourage energy companies to focus on smaller agencies and/or certain funding available only for small agencies
Create a market for ET Encourage more package unit designs
(plug & play) State mandated energy audits ? Require EPA’s Portfolio Manager model Help to define how much energy is
worthwhile saving
15
Questions?
Eliza Jane Whitman, PE, LEED AP Vice President
Director of Sustainable Strategies
626 440-3702 (office) 626 689-9992 (cell)