Embed Size (px)
Citation preview
7/28/2019 Implementing Reliability, Availability, Maintainability and Supportability RAMS for the MRO Industry- A Case Study at European Airlines
http://slidepdf.com/reader/full/implementing-reliability-availability-maintainability-and-supportability 1/16
34th
ESReDA Seminar on Supporting Technologies for Advanced Maintenance Information Management.
1
Implementing Reliability, Availability, Maintainability and Supportability
RAMS for the MRO Industry: a Case Study at European Airlines
Dr Adel A. Ghobbar†
Delft University of Technology, Faculty of Aerospace Engineering, Aerospace Management and Operations
Department, Kluyverweg 1, 2629 HS Delft, The Netherlands
Abstract
Maintenance of aircraft has always taken a very special place. In the first place because the
cost of ownership is so high, that a high availability is requested from the operators. In thesecond place is safety a hot issue in the aerospace industry. It was found that indeed much
emphasis is put on the monitoring of the reliability and component failures. However these
measurements give no insight in the efficiency of the maintenance process. From a field
research all the measures used at three different companies (VLM Airlines, SN Airlines
and KLM Cityhopper) were collected and investigated. It was found that indeed much
emphasis was laid on the reliability of the fleet, but that no measurements were done inside
the maintenance process. The research was performed for VLM Airlines and they agree
that measuring performance indicators is necessary to improve the maintenance process.
Model was created to measure the reliability, availability, maintainability and
supportability RAMS. The model covers the whole maintenance process and the
environment surrounding the process and concluded that was a good approach of the
reality for aircraft maintenance.
Keywords: reliability, availability, maintainability and supportability, aircraft maintenance.
†Email: [email protected]
7/28/2019 Implementing Reliability, Availability, Maintainability and Supportability RAMS for the MRO Industry- A Case Study at European Airlines
http://slidepdf.com/reader/full/implementing-reliability-availability-maintainability-and-supportability 2/16
34th
ESReDA Seminar on Supporting Technologies for Advanced Maintenance Information Management.
2
1. Introduction
Performance measurement in the MRO industry is highly regulated. Reliability reports
have to be sent to the Civil Aviation Authorities on a monthly and six monthly bases.
These regulations are necessary as aviation is a safety risk business. So the measurement of
the effectiveness of the maintenance is highly regulated. However there is no performance
measurement system in place yet that measures the efficiency of the maintenance process.
It is the goal of this research to develop a model that will measure the effectiveness of the
maintenance process as well as the efficiency.
This research is two folded. In the first place it is a case study of the performance
measurement at three different companies: VLM Airlines, SN Airlines and KLM
Cityhopper. From these airlines documentation about the performance measurement is
collected. The main contribution of this research comes from VLM Airlines, from which
not only the formulas, but also the data was fully available. All the equations were
categorized under the different RAMS factors.
The second part of the research will develop a formula for the availability based on the
different RAMS factors. RAMS analysis defines certain characteristics of a component or
system. Reliability focuses on the failure rate of the component, maintainability on the
repair or maintain rate of the component, availability on the total uptime of the component
and supportability focuses on the demand of the component for support. The goal of the
research is to link and define the factors influencing the availability. The different factors
were set as direct measures that could be implemented in the maintenance process, so that
in a later stage this model can be used in the MRO industry.
2. Literature Review
Maintenance is a very broad concept. It can be carried out on regular basis, or only once in
the lifecycle of a product, it can take very long, or just a couple of hours. In the aviation
industry maintenance takes a special place. The performance of maintenance restores
safety and reliability levels when deterioration or damage has occurred [1]. Maintenance
also has an economical drive as it influences the availability of the fleet. An aircraft that is
not available for service cost the airline operator money while it is not creating any
7/28/2019 Implementing Reliability, Availability, Maintainability and Supportability RAMS for the MRO Industry- A Case Study at European Airlines
http://slidepdf.com/reader/full/implementing-reliability-availability-maintainability-and-supportability 3/16
34th
ESReDA Seminar on Supporting Technologies for Advanced Maintenance Information Management.
3
income, increasing the total cost of ownership. Maintenance is the action necessary to
sustain or restore the integrity and performance of the airplane. It includes inspection,
overhaul, repair, preservation and replacement of parts [2]. However the tasks of the
maintenance department go further than the basic definition above. The maintenance
department is responsible for the ability of the aircraft to fly the published revenue
generating schedule [1]. In normal condition a service level agreement is raised between
the two parties, the airline on the one side the MRO company on the other side, with clear
maintenance times and limits stated.
In this study two types of maintenance will be investigated preventive and corrective.
Corrective maintenance groups all actions performed as a result of failure to restore an
item to a satisfactory condition by providing correction of a known or suspect malfunction
and/or defect. Corrective maintenance in general consists of fault verification, fault
isolation, disassembly, replacement, reassembly, alignment/adjustment and test. This type
of maintenance is known as unscheduled maintenance, and benefit from the use of
diagnostics to ease the burden on the maintenance resource. Preventive maintenance
groups all actions performed at defined intervals to retain an item in a serviceable
condition by systematic inspection, detection, replacement of wear out items, adjustment,
calibration, cleaning etc. It is carried out at prescribed points in an aircraft and equipment’s
life. It is also termed scheduled maintenance [3].
RAMS analysis is born from the statistical prediction of the performance of a component,
and is often expressed in terms of probability. So, reliability is the probability that the
component or system will be able to perform the mission and availability the probability
that the component or system will be able to perform its function at the time required.
RAMS analysis is in most cases applied at a component level, where these inherent
characteristics are measured with tests. In most cases RAMS factors are set during the
design of the component; these are called the inherent factors. Once the component is
produced, these factors will be evaluated during the functional life. After these tests the
production process or the operational process will be reengineered, in order to increase the
achieved reliability, for example preventive maintenance is introduced in the operational
7/28/2019 Implementing Reliability, Availability, Maintainability and Supportability RAMS for the MRO Industry- A Case Study at European Airlines
http://slidepdf.com/reader/full/implementing-reliability-availability-maintainability-and-supportability 4/16
34th
ESReDA Seminar on Supporting Technologies for Advanced Maintenance Information Management.
4
life. These are the achieved RAMS factors. The achieved RAMS factors are focused on the
design and the maintenance of the component, but operational elements such as support
delays or administrative delays are excluded. When these are included, the parameters are
called the operational RAMS parameters as they include all the elements of the process,
and do not only focus on the components characteristics. When the operational availability
is much lower then expected, the maintenance process can be reengineered, in order to
achieve lower supportive delay times [4].
Availability is the ratio of the actual operating time to the scheduled operating time. It is
the probability to be in service when required [5, 6]. Availability is the most important
terminology used for evaluation of the effectiveness of any process or activity, if the
machines are repairable systems. Steady-state availability of a fleet, for a given period, is
defined as the percentage of time during which the fleet is producing its designed output
adequately [7]. Supportability is the inherent characteristics of an item related to its ability
to be supported by the required resources for the execution of the specified maintenance
task [8].
The framework of the RAMS analysis is used in order to see how the efficiency and
effectiveness of the maintenance process can be measured. As RAMS factors are most
commonly applied at component level or system level a transposition towards a process
level is required. As RAMS is not applied yet at a process level inside the maintenance,
repair an overhaul, MRO companies, a new measurement system has to be developed in
order to use the new model. This led to the following research questions:
1. What are the current measures in use in different airlines and MRO industry.
2. How can RAMS be applied at a process level?
a) Modification of the RAMS formulae
b) Define the gaps between the current measures taken and the measures
required for the RAMS model.
7/28/2019 Implementing Reliability, Availability, Maintainability and Supportability RAMS for the MRO Industry- A Case Study at European Airlines
http://slidepdf.com/reader/full/implementing-reliability-availability-maintainability-and-supportability 5/16
34th
ESReDA Seminar on Supporting Technologies for Advanced Maintenance Information Management.
5
3. Experimental Design
Due to a missing data to calculate the availability a predictive model has been developed in
this research. For every parameter of the RAMS factor assumptions have been made in
order to approximate the reality. The simulation tried to model the availability in terms of
reliability, maintainability and supportability. This approach leads to a simulation in which
the effect of lack of support can be investigated.
The availability equation (Eq. 1) can be used for a certain period of time in which a certain
number of flight hours are flown and a certain number of scheduled flights are performed.
The number of corrective maintenance is dependable on the failure rate and the number of
scheduled flights, the number of preventive maintenance actions is dependable on the
maintenance rate and the number of flight hours flown.
FH ADT LDT AMT LDT AMT
ADT LDT AMT LDT AMT
Am
j
j j
n
i
ii
m
j
j j
n
i
ii
O
+
++++
++++
−=
∑∑
∑∑
==
==
11
11
)()(
)()(
1 (1)
For
i = 0,1,…,n
j = 0,1,…,m
and,
n = λ × Scheduled Flights
m = µ × Flight Hours
Reliability is covered in the equation by the failure rate and the defect rate. The failure rate
indicates the number of cancellations and delays that occur in the considered span of time.
C D λ λ λ += (2)
Where λ D is the delay rate and λ C is the cancellation rate.
The probability that rectification is needed after an inspection is adapted from the
reliability theory. It is assumed that the chance that no fault found during an inspection
decreases exponentially. The probability of an exponentional distribution is given by:
P( X = t ) = f (t ) = e−λ t This is the same reasoning that the reliability theory uses: the
chances that no defect occurs over time will decrease exponentially. This results in the
7/28/2019 Implementing Reliability, Availability, Maintainability and Supportability RAMS for the MRO Industry- A Case Study at European Airlines
http://slidepdf.com/reader/full/implementing-reliability-availability-maintainability-and-supportability 6/16
34th
ESReDA Seminar on Supporting Technologies for Advanced Maintenance Information Management.
6
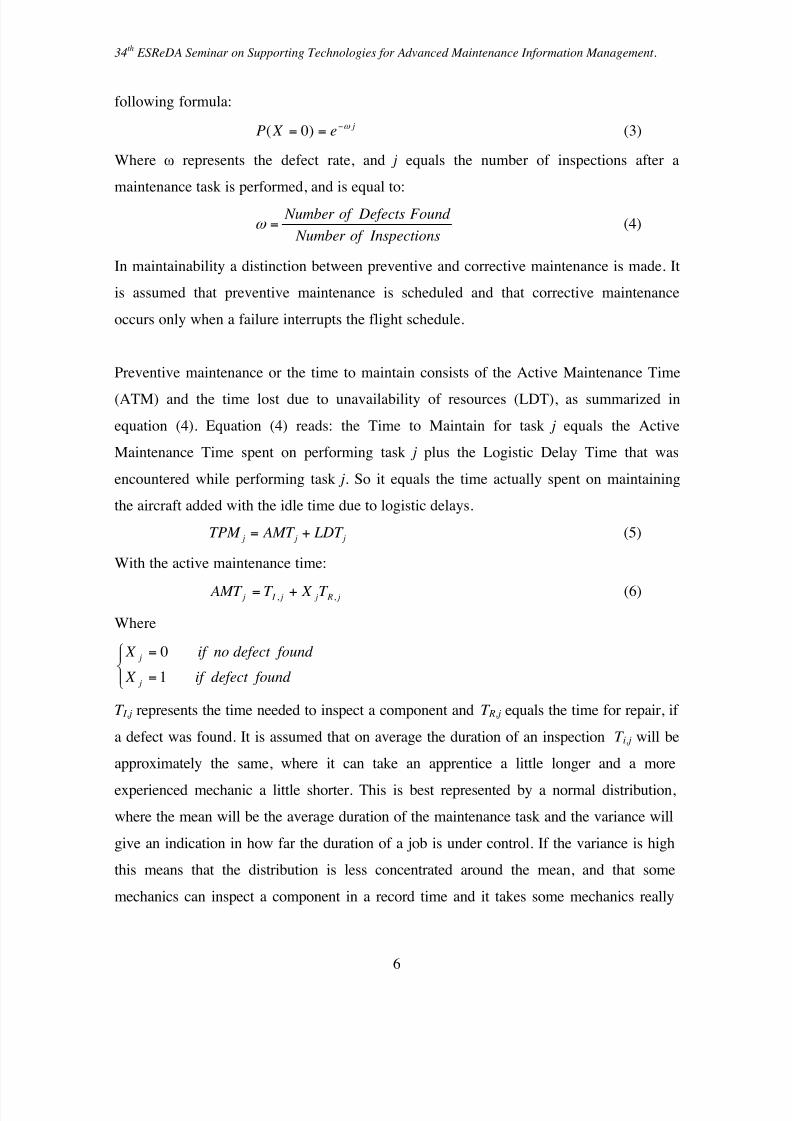
following formula:
j e X P ω −== )0( (3)
Where ω represents the defect rate, and j equals the number of inspections after a
maintenance task is performed, and is equal to:
s Inspectionof Number
Found Defectsof Number=ω (4)
In maintainability a distinction between preventive and corrective maintenance is made. It
is assumed that preventive maintenance is scheduled and that corrective maintenance
occurs only when a failure interrupts the flight schedule.
Preventive maintenance or the time to maintain consists of the Active Maintenance Time
(ATM) and the time lost due to unavailability of resources (LDT), as summarized in
equation (4). Equation (4) reads: the Time to Maintain for task j equals the Active
Maintenance Time spent on performing task j plus the Logistic Delay Time that was
encountered while performing task j . So it equals the time actually spent on maintaining
the aircraft added with the idle time due to logistic delays.
TPM j = AMT j + LDT j (5)
With the active maintenance time:
j R j j I j T X T AMT ,, += (6)
Where
=
=
found defect if X
found defect noif X
j
j
1
0
T I,j represents the time needed to inspect a component and T R,j equals the time for repair, if
a defect was found. It is assumed that on average the duration of an inspection T i,j will be
approximately the same, where it can take an apprentice a little longer and a more
experienced mechanic a little shorter. This is best represented by a normal distribution,
where the mean will be the average duration of the maintenance task and the variance will
give an indication in how far the duration of a job is under control. If the variance is high
this means that the distribution is less concentrated around the mean, and that some
mechanics can inspect a component in a record time and it takes some mechanics really
7/28/2019 Implementing Reliability, Availability, Maintainability and Supportability RAMS for the MRO Industry- A Case Study at European Airlines
http://slidepdf.com/reader/full/implementing-reliability-availability-maintainability-and-supportability 7/16
34th
ESReDA Seminar on Supporting Technologies for Advanced Maintenance Information Management.
7
long to fill-full the job. This could be solved, providing training, resulting in an increased
skill level of the mechanics, could solve this. T R,j represents the time needed to repair a
defect if required, for the same reasons as described above, it is assumed that the time to
repair will have a normal distribution.
The corrective maintenance is considered to be all the maintenance due to a delay or a
cancellation. No differentiation is made between inspection and repair time. If there are
many delays of short duration and only some with a considerable length, this is best
modeled using an exponential distribution. So for the delay time of the aircraft also an
exponential distribution is used. For the duration of a cancellation it is assumed that 60
minutes is lost, which is the average duration of a flight.
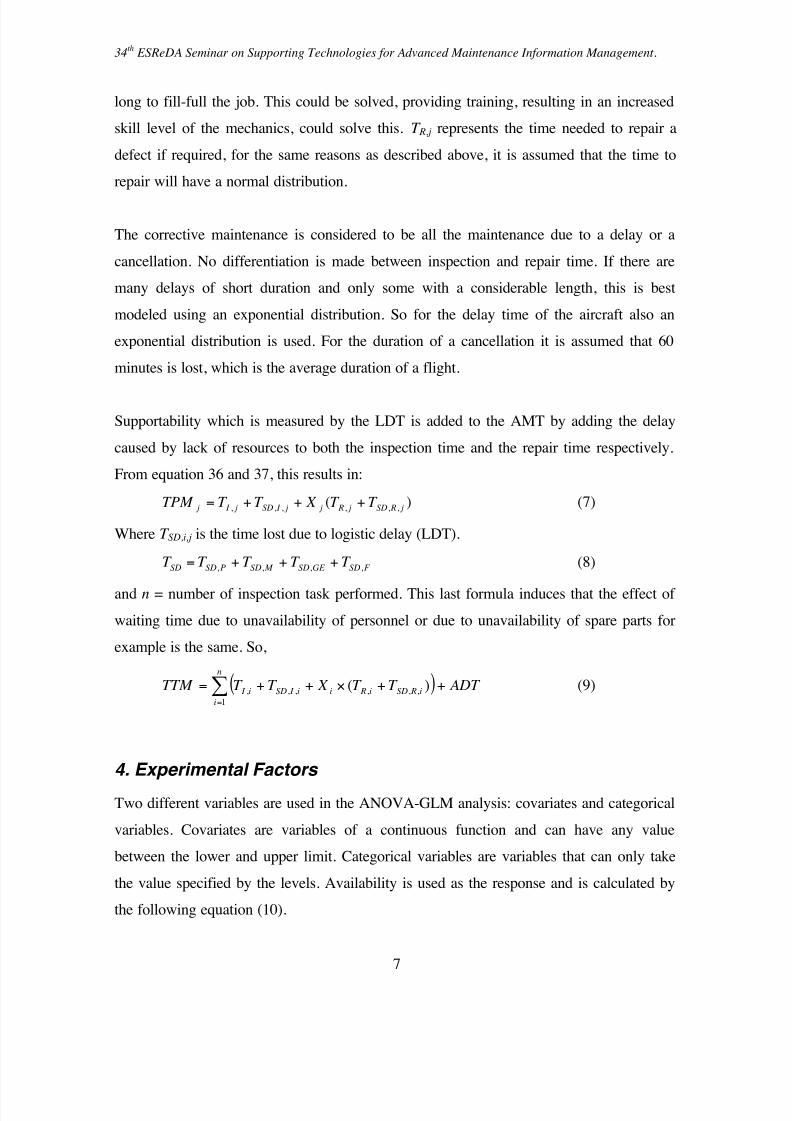
Supportability which is measured by the LDT is added to the AMT by adding the delay
caused by lack of resources to both the inspection time and the repair time respectively.
From equation 36 and 37, this results in:
)( ,,,,,, j RSD j R j j I SD j I j T T X T T TPM +++= (7)
Where T SD,i,j is the time lost due to logistic delay (LDT).
F SDGE SD M SDPSDSD T T T T T ,,,, +++= (8)
and n = number of inspection task performed. This last formula induces that the effect of
waiting time due to unavailability of personnel or due to unavailability of spare parts for
example is the same. So,
( )∑=
++×++=
n
i
i RSDi Rii I SDi I ADT T T X T T TTM 1
,,,,,, )( (9)
4. Experimental Factors
Two different variables are used in the ANOVA-GLM analysis: covariates and categorical
variables. Covariates are variables of a continuous function and can have any value
between the lower and upper limit. Categorical variables are variables that can only take
the value specified by the levels. Availability is used as the response and is calculated by
the following equation (10).
7/28/2019 Implementing Reliability, Availability, Maintainability and Supportability RAMS for the MRO Industry- A Case Study at European Airlines
http://slidepdf.com/reader/full/implementing-reliability-availability-maintainability-and-supportability 8/16
34th
ESReDA Seminar on Supporting Technologies for Advanced Maintenance Information Management.
8
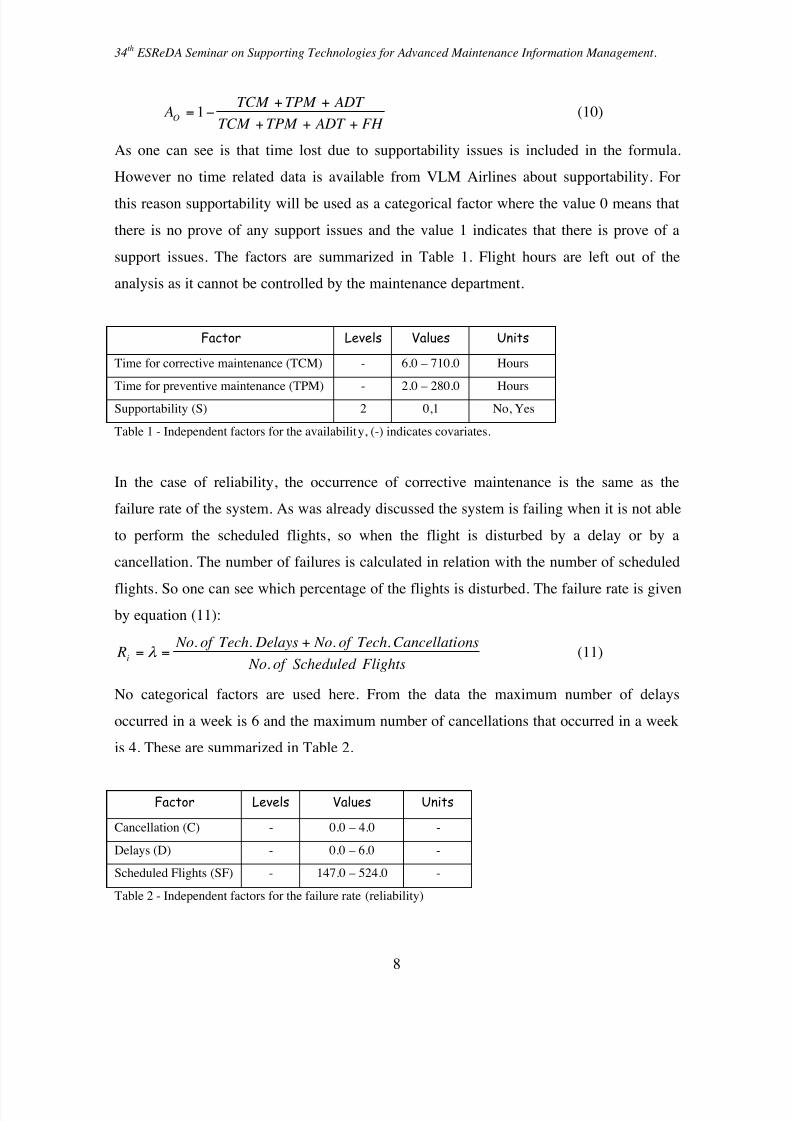
FH ADT TPM TCM
ADT TPM TCM AO
+++
++
−= 1 (10)
As one can see is that time lost due to supportability issues is included in the formula.
However no time related data is available from VLM Airlines about supportability. For
this reason supportability will be used as a categorical factor where the value 0 means that
there is no prove of any support issues and the value 1 indicates that there is prove of a
support issues. The factors are summarized in Table 1. Flight hours are left out of the
analysis as it cannot be controlled by the maintenance department.
Factor Levels Values Units
Time for corrective maintenance (TCM) - 6.0 – 710.0 Hours
Time for preventive maintenance (TPM) - 2.0 – 280.0 Hours
Supportability (S) 2 0,1 No, Yes
Table 1 - Independent factors for the availability, (-) indicates covariates.
In the case of reliability, the occurrence of corrective maintenance is the same as the
failure rate of the system. As was already discussed the system is failing when it is not able
to perform the scheduled flights, so when the flight is disturbed by a delay or by a
cancellation. The number of failures is calculated in relation with the number of scheduled
flights. So one can see which percentage of the flights is disturbed. The failure rate is given
by equation (11):
FlightsScheduled of No
onsCancellatiTechof No DelaysTechof No Ri
.
.... +
== λ (11)
No categorical factors are used here. From the data the maximum number of delays
occurred in a week is 6 and the maximum number of cancellations that occurred in a week
is 4. These are summarized in Table 2.
Factor Levels Values Units
Cancellation (C) - 0.0 – 4.0 -
Delays (D) - 0.0 – 6.0 -
Scheduled Flights (SF) - 147.0 – 524.0 -
Table 2 - Independent factors for the failure rate (reliability)
7/28/2019 Implementing Reliability, Availability, Maintainability and Supportability RAMS for the MRO Industry- A Case Study at European Airlines
http://slidepdf.com/reader/full/implementing-reliability-availability-maintainability-and-supportability 9/16
34th
ESReDA Seminar on Supporting Technologies for Advanced Maintenance Information Management.
9
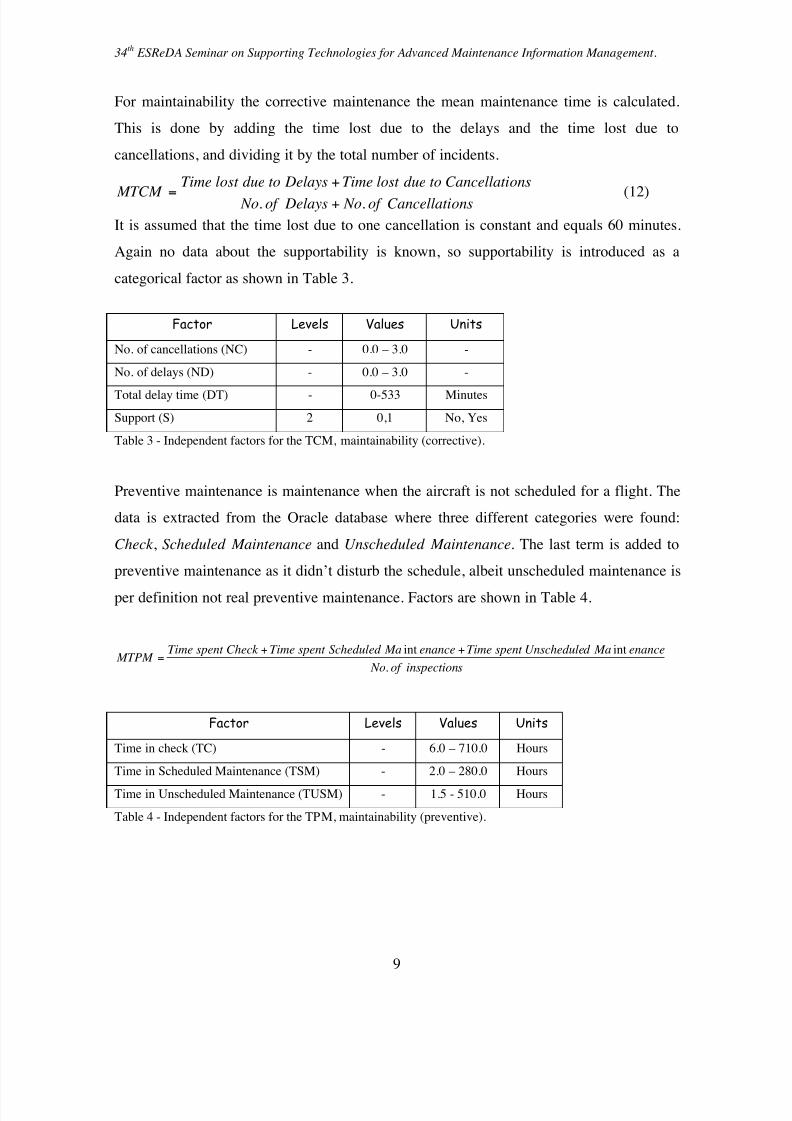
For maintainability the corrective maintenance the mean maintenance time is calculated.
This is done by adding the time lost due to the delays and the time lost due to
cancellations, and dividing it by the total number of incidents.
onsCancellatiof No Delaysof No
onsCancellatitoduelost Time Delaystoduelost Time
MTCM .. +
+
= (12)
It is assumed that the time lost due to one cancellation is constant and equals 60 minutes.
Again no data about the supportability is known, so supportability is introduced as a
categorical factor as shown in Table 3.
Factor Levels Values Units
No. of cancellations (NC) - 0.0 – 3.0 -
No. of delays (ND) - 0.0 – 3.0 -
Total delay time (DT) - 0-533 Minutes
Support (S) 2 0,1 No, Yes
Table 3 - Independent factors for the TCM, maintainability (corrective).
Preventive maintenance is maintenance when the aircraft is not scheduled for a flight. The
data is extracted from the Oracle database where three different categories were found:
Check , Scheduled Maintenance and Unscheduled Maintenance. The last term is added to
preventive maintenance as it didn’t disturb the schedule, albeit unscheduled maintenance is
per definition not real preventive maintenance. Factors are shown in Table 4.
sinspectionof No
enance Mad Unschedulespent Timeenance MaScheduled spent TimeCheck spent Time MTPM
.
intint ++
=
Factor Levels Values Units
Time in check (TC) - 6.0 – 710.0 Hours
Time in Scheduled Maintenance (TSM) - 2.0 – 280.0 Hours
Time in Unscheduled Maintenance (TUSM) - 1.5 - 510.0 Hours
Table 4 - Independent factors for the TPM, maintainability (preventive).
7/28/2019 Implementing Reliability, Availability, Maintainability and Supportability RAMS for the MRO Industry- A Case Study at European Airlines
http://slidepdf.com/reader/full/implementing-reliability-availability-maintainability-and-supportability 10/16
34th
ESReDA Seminar on Supporting Technologies for Advanced Maintenance Information Management.
10
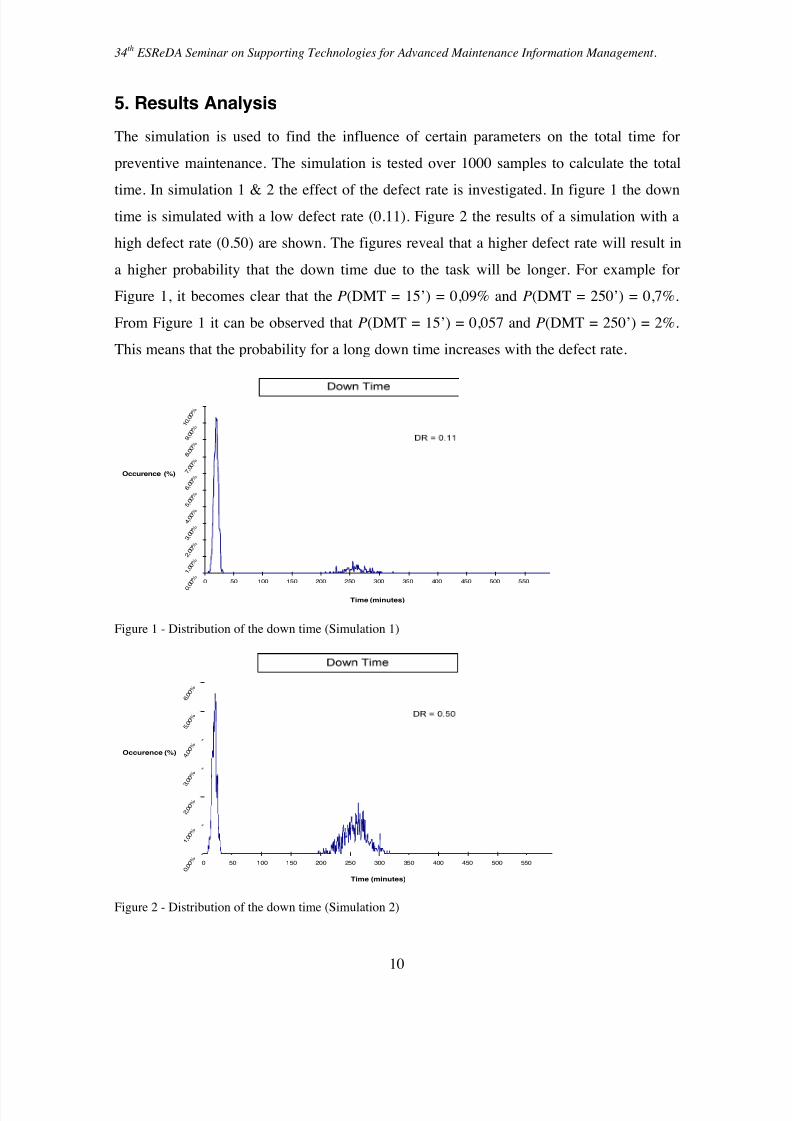
5. Results Analysis
The simulation is used to find the influence of certain parameters on the total time for
preventive maintenance. The simulation is tested over 1000 samples to calculate the total
time. In simulation 1 & 2 the effect of the defect rate is investigated. In figure 1 the downtime is simulated with a low defect rate (0.11). Figure 2 the results of a simulation with a
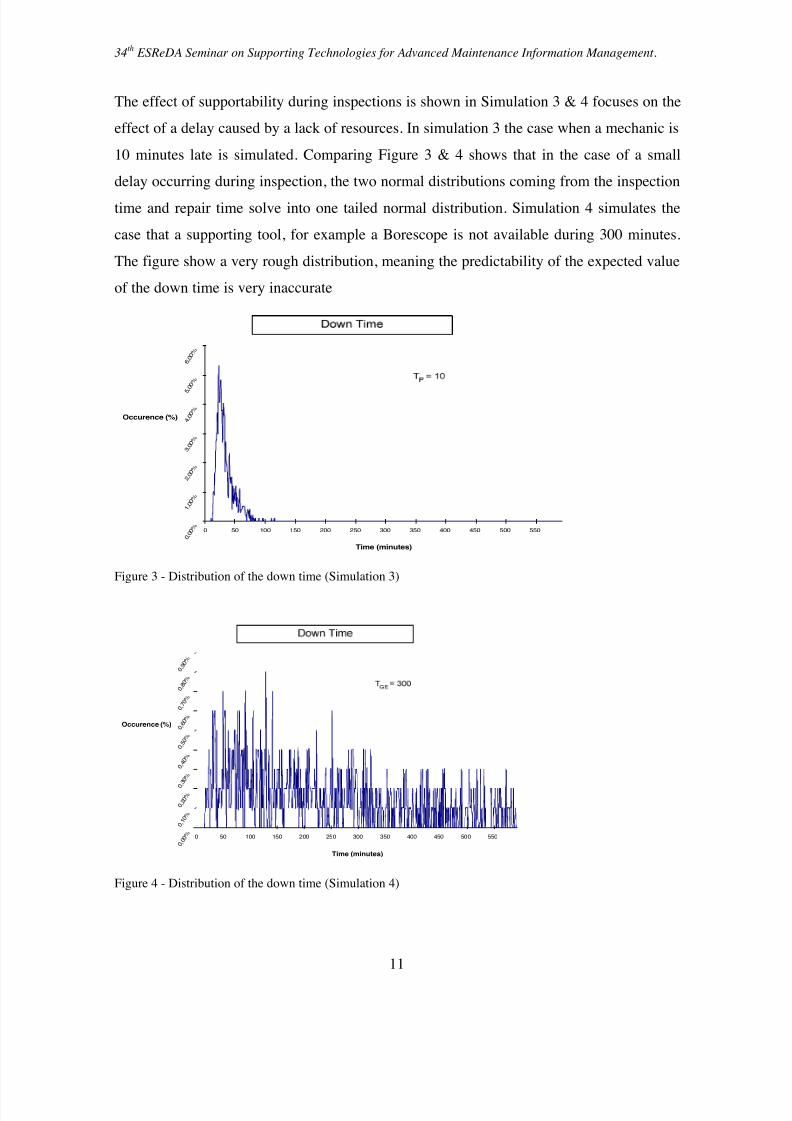
high defect rate (0.50) are shown. The figures reveal that a higher defect rate will result in
a higher probability that the down time due to the task will be longer. For example for
Figure 1, it becomes clear that the P(DMT = 15’) = 0,09% and P(DMT = 250’) = 0,7%.
From Figure 1 it can be observed that P(DMT = 15’) = 0,057 and P(DMT = 250’) = 2%.
This means that the probability for a long down time increases with the defect rate.
Active Maintenance Time
0 , 0 0 %
1 , 0 0 %
2 , 0 0 %
3 , 0 0 %
4 , 0 0 %
5 , 0 0 %
6 , 0 0 %
7 , 0 0 %
8 , 0 0 %
9 , 0 0 %
1 0 , 0 0 %
0 50 100 150 200 250 300 350 400 450 500 550
Time (minutes)
Occurence (%)
Figure 1 - Distribution of the down time (Simulation 1)
Active Maintenance Time
0 , 0 0 %
1 , 0 0 %
2 , 0 0 %
3
, 0 0 %
4 , 0 0 %
5 , 0 0 %
6 , 0 0 %
0 50 100 150 200 250 300 350 400 450 500 550
Time (minutes)
Occurence (%)
Figure 2 - Distribution of the down time (Simulation 2)
7/28/2019 Implementing Reliability, Availability, Maintainability and Supportability RAMS for the MRO Industry- A Case Study at European Airlines
http://slidepdf.com/reader/full/implementing-reliability-availability-maintainability-and-supportability 11/16
34th
ESReDA Seminar on Supporting Technologies for Advanced Maintenance Information Management.
11
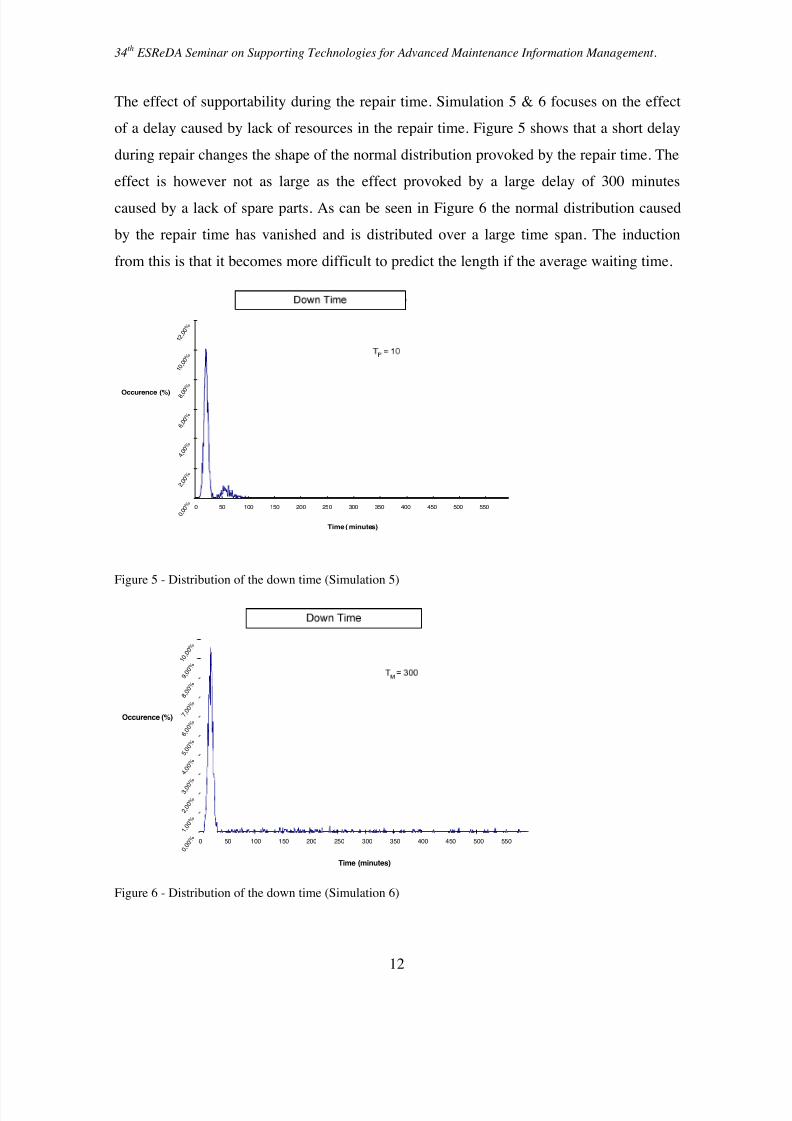
The effect of supportability during inspections is shown in Simulation 3 & 4 focuses on the
effect of a delay caused by a lack of resources. In simulation 3 the case when a mechanic is
10 minutes late is simulated. Comparing Figure 3 & 4 shows that in the case of a small
delay occurring during inspection, the two normal distributions coming from the inspection
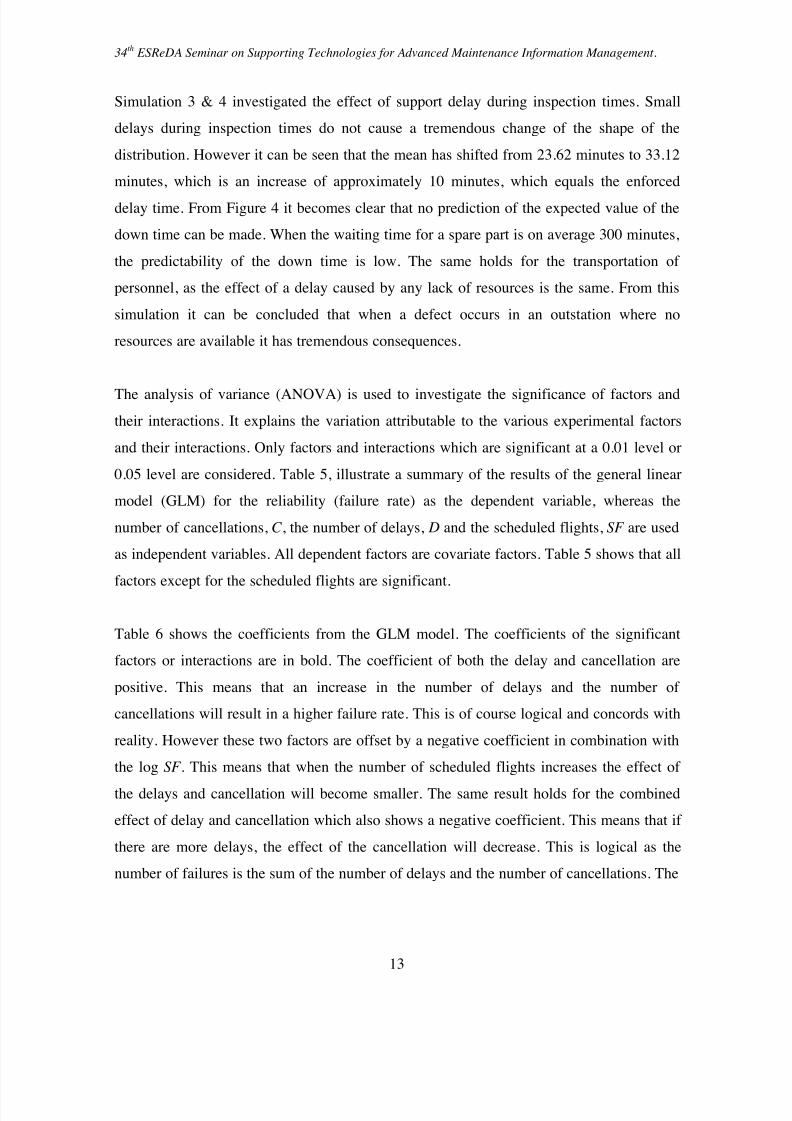
time and repair time solve into one tailed normal distribution. Simulation 4 simulates the
case that a supporting tool, for example a Borescope is not available during 300 minutes.
The figure show a very rough distribution, meaning the predictability of the expected value
of the down time is very inaccurate
Active Maintenance Time
0 , 0 0 %
1 , 0 0 %
2 , 0 0 %
3 , 0 0 %
4 , 0 0 %
5
, 0 0 %
6 , 0 0 %
0 50 100 150 200 250 300 350 400 450 500 550
Time (minutes)
Occurence (%)
Figure 3 - Distribution of the down time (Simulation 3)
Active Maintenance Time
0 , 0 0 %
0 , 1 0 %
0 , 2 0 %
0 , 3 0 %
0 , 4 0 %
0 , 5 0 %
0 , 6 0 %
0 , 7 0 %
0 , 8 0 %
0 , 9 0 %
0 50 100 150 200 250 300 350 400 450 500 550
Time (minutes)
Occurence (%)
Figure 4 - Distribution of the down time (Simulation 4)
7/28/2019 Implementing Reliability, Availability, Maintainability and Supportability RAMS for the MRO Industry- A Case Study at European Airlines
http://slidepdf.com/reader/full/implementing-reliability-availability-maintainability-and-supportability 12/16
34th
ESReDA Seminar on Supporting Technologies for Advanced Maintenance Information Management.
12
The effect of supportability during the repair time. Simulation 5 & 6 focuses on the effect
of a delay caused by lack of resources in the repair time. Figure 5 shows that a short delay
during repair changes the shape of the normal distribution provoked by the repair time. The
effect is however not as large as the effect provoked by a large delay of 300 minutes
caused by a lack of spare parts. As can be seen in Figure 6 the normal distribution caused
by the repair time has vanished and is distributed over a large time span. The induction
from this is that it becomes more difficult to predict the length if the average waiting time.
Active Maintenance Time
0 , 0 0 %
2 , 0 0 %
4 , 0 0 %
6 , 0 0 %
8 , 0 0 %
1 0 , 0 0 %
1 2 , 0 0 %
0 50 100 150 200 250 300 350 400 450 500 550
Time ( minutes)
Occurence (%)
Figure 5 - Distribution of the down time (Simulation 5)
Active Maintenance Time
0 , 0 0
%
1 , 0 0 %
2 , 0 0 %
3 , 0 0 %
4 , 0 0 %
5 , 0 0 %
6 , 0 0 %
7 , 0 0
%
8 , 0 0 %
9 , 0 0 %
1 0 , 0 0 %
0 50 100 150 200 250 300 350 400 450 500 550
Time (minutes)
Occurence (%)
Figure 6 - Distribution of the down time (Simulation 6)
7/28/2019 Implementing Reliability, Availability, Maintainability and Supportability RAMS for the MRO Industry- A Case Study at European Airlines
http://slidepdf.com/reader/full/implementing-reliability-availability-maintainability-and-supportability 13/16
34th
ESReDA Seminar on Supporting Technologies for Advanced Maintenance Information Management.
13
Simulation 3 & 4 investigated the effect of support delay during inspection times. Small
delays during inspection times do not cause a tremendous change of the shape of the
distribution. However it can be seen that the mean has shifted from 23.62 minutes to 33.12
minutes, which is an increase of approximately 10 minutes, which equals the enforced
delay time. From Figure 4 it becomes clear that no prediction of the expected value of the
down time can be made. When the waiting time for a spare part is on average 300 minutes,
the predictability of the down time is low. The same holds for the transportation of
personnel, as the effect of a delay caused by any lack of resources is the same. From this
simulation it can be concluded that when a defect occurs in an outstation where no
resources are available it has tremendous consequences.
The analysis of variance (ANOVA) is used to investigate the significance of factors and
their interactions. It explains the variation attributable to the various experimental factors
and their interactions. Only factors and interactions which are significant at a 0.01 level or
0.05 level are considered. Table 5, illustrate a summary of the results of the general linear
model (GLM) for the reliability (failure rate) as the dependent variable, whereas the
number of cancellations, C , the number of delays, D and the scheduled flights, SF are used
as independent variables. All dependent factors are covariate factors. Table 5 shows that all
factors except for the scheduled flights are significant.
Table 6 shows the coefficients from the GLM model. The coefficients of the significant
factors or interactions are in bold. The coefficient of both the delay and cancellation are
positive. This means that an increase in the number of delays and the number of
cancellations will result in a higher failure rate. This is of course logical and concords with
reality. However these two factors are offset by a negative coefficient in combination with
the log SF . This means that when the number of scheduled flights increases the effect of
the delays and cancellation will become smaller. The same result holds for the combined
effect of delay and cancellation which also shows a negative coefficient. This means that if
there are more delays, the effect of the cancellation will decrease. This is logical as the
number of failures is the sum of the number of delays and the number of cancellations. The
7/28/2019 Implementing Reliability, Availability, Maintainability and Supportability RAMS for the MRO Industry- A Case Study at European Airlines
http://slidepdf.com/reader/full/implementing-reliability-availability-maintainability-and-supportability 14/16
34th
ESReDA Seminar on Supporting Technologies for Advanced Maintenance Information Management.
14
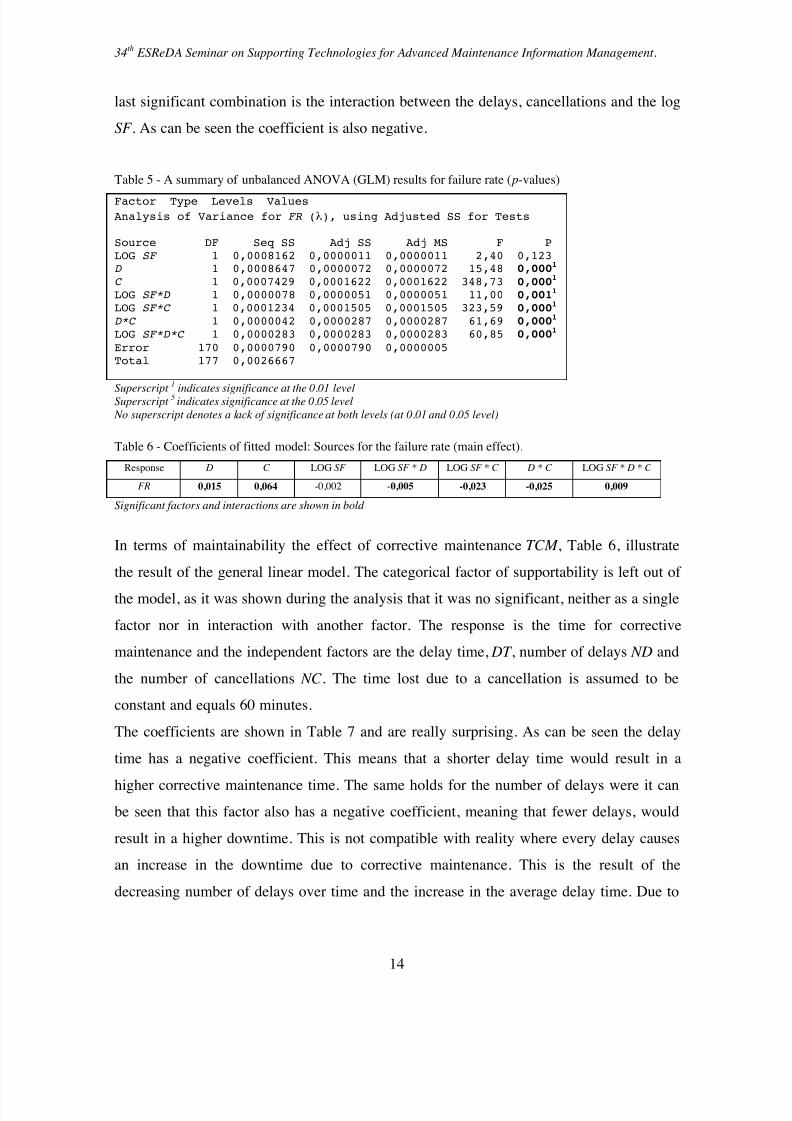
last significant combination is the interaction between the delays, cancellations and the log
SF . As can be seen the coefficient is also negative.
Table 5 - A summary of unbalanced ANOVA (GLM) results for failure rate ( p-values)
Factor Type Levels Values
Analysis of Variance for FR (λ), using Adjusted SS for Tests
Source DF Seq SS Adj SS Adj MS F P
LOG SF 1 0,0008162 0,0000011 0,0000011 2,40 0,123
D 1 0,0008647 0,0000072 0,0000072 15,48 0,0001
C 1 0,0007429 0,0001622 0,0001622 348,73 0,0001
LOG SF*D 1 0,0000078 0,0000051 0,0000051 11,00 0,0011
LOG SF*C 1 0,0001234 0,0001505 0,0001505 323,59 0,0001
D*C 1 0,0000042 0,0000287 0,0000287 61,69 0,0001
LOG SF*D*C 1 0,0000283 0,0000283 0,0000283 60,85 0,0001
Error 170 0,0000790 0,0000790 0,0000005
Total 177 0,0026667
Superscript
1
indicates significance at the 0.01 levelSuperscript 5 indicates significance at the 0.05 level
No superscript denotes a lack of significance at both levels (at 0.01 and 0.05 level)
Table 6 - Coefficients of fitted model: Sources for the failure rate (main effect).
Response D C LOG SF LOG SF * D LOG SF * C D * C LOG SF * D * C
FR 0,015 0,064 -0,002 -0,005 -0,023 -0,025 0,009
Significant factors and interactions are shown in bold
In terms of maintainability the effect of corrective maintenance TCM , Table 6, illustrate
the result of the general linear model. The categorical factor of supportability is left out of
the model, as it was shown during the analysis that it was no significant, neither as a single
factor nor in interaction with another factor. The response is the time for corrective
maintenance and the independent factors are the delay time, DT , number of delays ND and
the number of cancellations NC . The time lost due to a cancellation is assumed to be
constant and equals 60 minutes.
The coefficients are shown in Table 7 and are really surprising. As can be seen the delay
time has a negative coefficient. This means that a shorter delay time would result in a
higher corrective maintenance time. The same holds for the number of delays were it can
be seen that this factor also has a negative coefficient, meaning that fewer delays, would
result in a higher downtime. This is not compatible with reality where every delay causes
an increase in the downtime due to corrective maintenance. This is the result of the
decreasing number of delays over time and the increase in the average delay time. Due to
7/28/2019 Implementing Reliability, Availability, Maintainability and Supportability RAMS for the MRO Industry- A Case Study at European Airlines
http://slidepdf.com/reader/full/implementing-reliability-availability-maintainability-and-supportability 15/16
34th
ESReDA Seminar on Supporting Technologies for Advanced Maintenance Information Management.
15
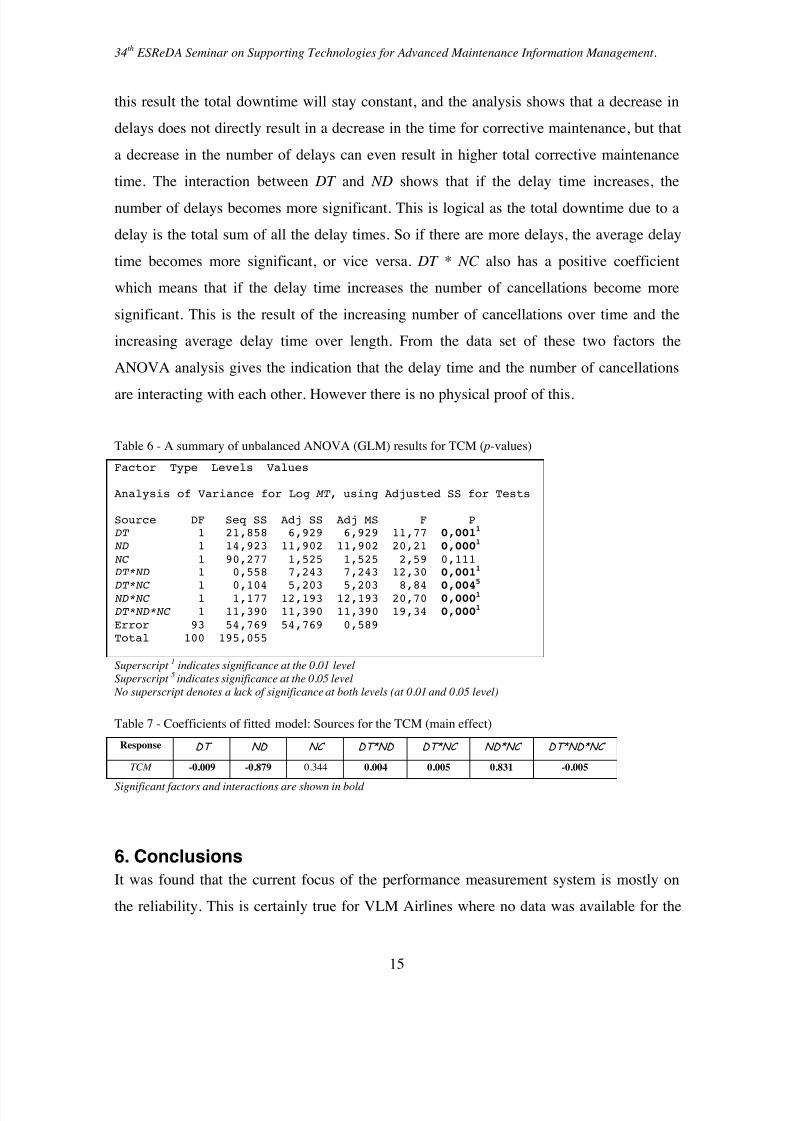
this result the total downtime will stay constant, and the analysis shows that a decrease in
delays does not directly result in a decrease in the time for corrective maintenance, but that
a decrease in the number of delays can even result in higher total corrective maintenance
time. The interaction between DT and ND shows that if the delay time increases, the
number of delays becomes more significant. This is logical as the total downtime due to a
delay is the total sum of all the delay times. So if there are more delays, the average delay
time becomes more significant, or vice versa. DT * NC also has a positive coefficient
which means that if the delay time increases the number of cancellations become more
significant. This is the result of the increasing number of cancellations over time and the
increasing average delay time over length. From the data set of these two factors the
ANOVA analysis gives the indication that the delay time and the number of cancellations
are interacting with each other. However there is no physical proof of this.
Table 6 - A summary of unbalanced ANOVA (GLM) results for TCM ( p-values)
Factor Type Levels Values
Analysis of Variance for Log MT , using Adjusted SS for Tests
Source DF Seq SS Adj SS Adj MS F P
DT 1 21,858 6,929 6,929 11,77 0,0011
ND 1 14,923 11,902 11,902 20,21 0,0001
NC 1 90,277 1,525 1,525 2,59 0,111
DT*ND 1 0,558 7,243 7,243 12,30 0,0011
DT*NC 1 0,104 5,203 5,203 8,84 0,004
5
ND*NC 1 1,177 12,193 12,193 20,70 0,0001
DT*ND*NC 1 11,390 11,390 11,390 19,34 0,0001
Error 93 54,769 54,769 0,589
Total 100 195,055
Superscript 1 indicates significance at the 0.01 level
Superscript 5 indicates significance at the 0.05 level
No superscript denotes a lack of significance at both levels (at 0.01 and 0.05 level)
Table 7 - Coefficients of fitted model: Sources for the TCM (main effect)
Response DT ND NC DT*ND DT*NC ND*NC DT*ND*NC
TCM -0.009 -0.879 0.344 0.004 0.005 0.831 -0.005
Significant factors and interactions are shown in bold
6. Conclusions
It was found that the current focus of the performance measurement system is mostly on
the reliability. This is certainly true for VLM Airlines where no data was available for the
7/28/2019 Implementing Reliability, Availability, Maintainability and Supportability RAMS for the MRO Industry- A Case Study at European Airlines
http://slidepdf.com/reader/full/implementing-reliability-availability-maintainability-and-supportability 16/16
34th
ESReDA Seminar on Supporting Technologies for Advanced Maintenance Information Management.
16
calculation of the maintenance time (maintainability) and the support process
(supportability). The measurement is mostly based on the output of the maintenance
process, namely the number of delays, cancellations, flight incidents. It can be concluded
from the field research that there is a demand for a development of a total performance
measurement system for the MRO industries, in which the processes are mapped and
performance indicators are set, according to the new model.
A new model for availability and maintainability has been developed. The GLM analysis
shows that the data from the simulation model gives the same significance to the
independent factors then the data provided by VLM Airlines. The preventive maintenance
time is the most significant factor. This is logical, as most of the downtime is due to
preventive maintenance. From the ANOVA analysis it can be concluded that the
simulation model is a good approach for a new performance measurement system.
References
[1] Eckels, D., (2007), KLM Cityhopper F50 Technical Reliability Report. KLM
Cityhopper, Amsterdam.
[2] Hessburg, J., (2000), Air Carrier MRO Handbook. McGraw Hill, USA.
[3] Jones, J. V., (2006), Supportability Engineering Handbook, Implementation,Measurement and Management. McGraw Hill, USA.
[4] Kinnison, H.A., (2004), Aviation Maintenance Management. McGraw Hill, USA.
[5] Locks, M. O., (1995), Reliability, Maintainability and Availability Assessment,
ASQC Quality Press, 2nd, USA.
[6] Murty, A. S. R., and Naikan, V. N. A., (1995), Availability and Maintenance Cost
Optimization of a Production Plant. International Journal of Quality and Reliability
Management , vol. 12, pp. 28-35.
[7] Romeu, J. L., (2004), Availability. Selected Topics in Assurance Related
Technologies, vol. 11, no. 6.
[8] Wu, H., Liu, Y., Ding Y., and Liu, J., (2004), Methods to Reduce the Direct
Maintenance Cost for Commercial Aircraft. Aircraft Engineering and Aerospace
Technology, vol. 76, pp. 15-18.