Embed Size (px)
Citation preview
Implementing the New York City
Macroscope Electronic Health Record
Surveillance System
Research In Progress WebinarWednesday, May 3, 2017 12:00-1:00pm ET/ 9:00-10:00am PT
Funded by the Robert Wood Johnson Foundation

TitleAgenda
Welcome: C.B. Mamaril, PhD, Systems for Action National Program Office,
and Research Assistant Professor, University of Kentucky College of Public
Health
Implementing the New York City Macroscope Electronic Health
Record Surveillance System
Presenters: Katharine H. (Tina) McVeigh, PhD, MPH, Division of Family
and Child Health [email protected] and Sharon Perlman, MPH, Division of
Epidemiology, [email protected], New York City Department of Health and
Mental Hygiene
Commentary: Sungwoo Lim, DrPH, MA, MS, Bureau of Epidemiology
Services [email protected] and
Jenny Smolen, MPH, Bureau of the Primary Care Information Project
New York City Department of Health and Mental Hygiene
Questions and Discussion2

Presenters
3
Katharine H. (Tina) McVeigh, PhD, MPH
Director of Research, Division of Family
and Child Health
New York City Department of Health and
Mental Hygiene [email protected]
Sharon Perlman, MPH
Director of Special Projects, Division of
Epidemiology
New York City Department of Health and
Mental Hygiene [email protected]
IMPLEMENTING THE NEW YORK CITY MACROSCOPE ELECTRONIC HEALTH RECORD SURVEILLANCE SYSTEM
Katharine H. McVeigh, PhD, MPHSharon E. Perlman, MPH
New York City Department of Health and Mental Hygiene
S4A Research in Progress Webinar Series, May 3, 2017, 12:00-1:00 PM (ET)

NYC Macroscope Team
Byron Alex1
Jay Bala1
Katherine Bartley1
Pui Ying Chan1
Claudia Chernov1
Andrew Fair 1
Amy Freeman 1
Ryan Grattan3
Carolyn Greene1
Charon Gwynn1
Candice Hamer2
Tiffany Harris1
Stephen Immerwahr 1
Laura Jacobson1
Jacqueline Kim3
Kevin Konty1
Ram Koppaka1
Sungwoo Lim1
Elizabeth Lurie-Moroni1
Nicola Madou2
Katharine McVeigh1
Remle Newton-Dame
Camelia Oros2
Katherine Otto3
Sharon Perlman1
Jesica Rodriguez-Lopez2
Matthew Romo2
Lauren Schreibstein1
Daniel Segrue3
Sarah Shih1
Jesse Singer 1
Jenny Smolen1
Elisabeth Snell1
Kathleen Tatem1
Lorna E. Thorpe2, 3
Leuk Woldeyohannes3
Yihong Zhao1
Organizational Partners
1NYC Department of Health
and Mental Hygiene (or
formerly)
2 City University of New York
School of Public Health
3NYU School of Medicine
Fund for Public Health in
New York
CUNY Research Foundation
Funders
Robert Wood Johnson
Foundation
de Beaumont Foundation
Robin Hood Foundation
NY State Health
Foundation
Doris Duke Charitable
Foundation
Centers for Disease
Control and Prevention
Acknowledgments
INTRODUCING THE NYC MACROSCOPE
Background
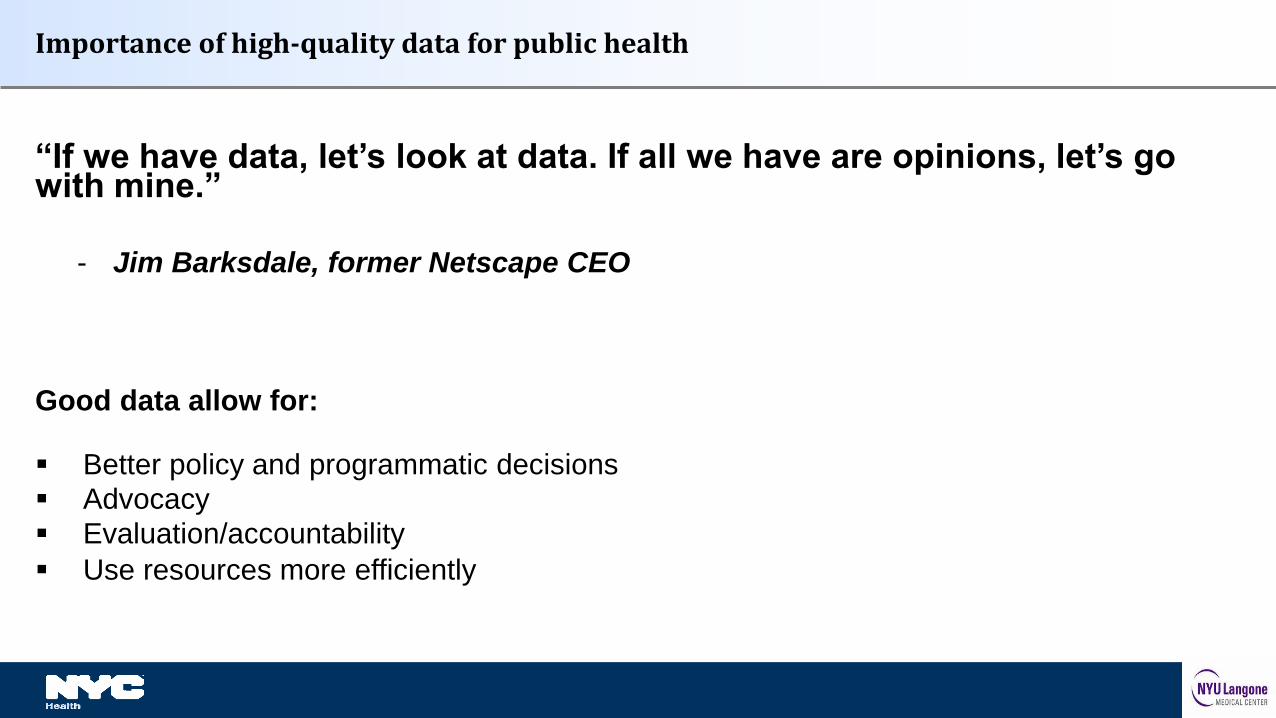
“If we have data, let’s look at data. If all we have are opinions, let’s go with mine.”
- Jim Barksdale, former Netscape CEO
Good data allow for:
Better policy and programmatic decisions
Advocacy
Evaluation/accountability
Use resources more efficiently
Importance of high-quality data for public health
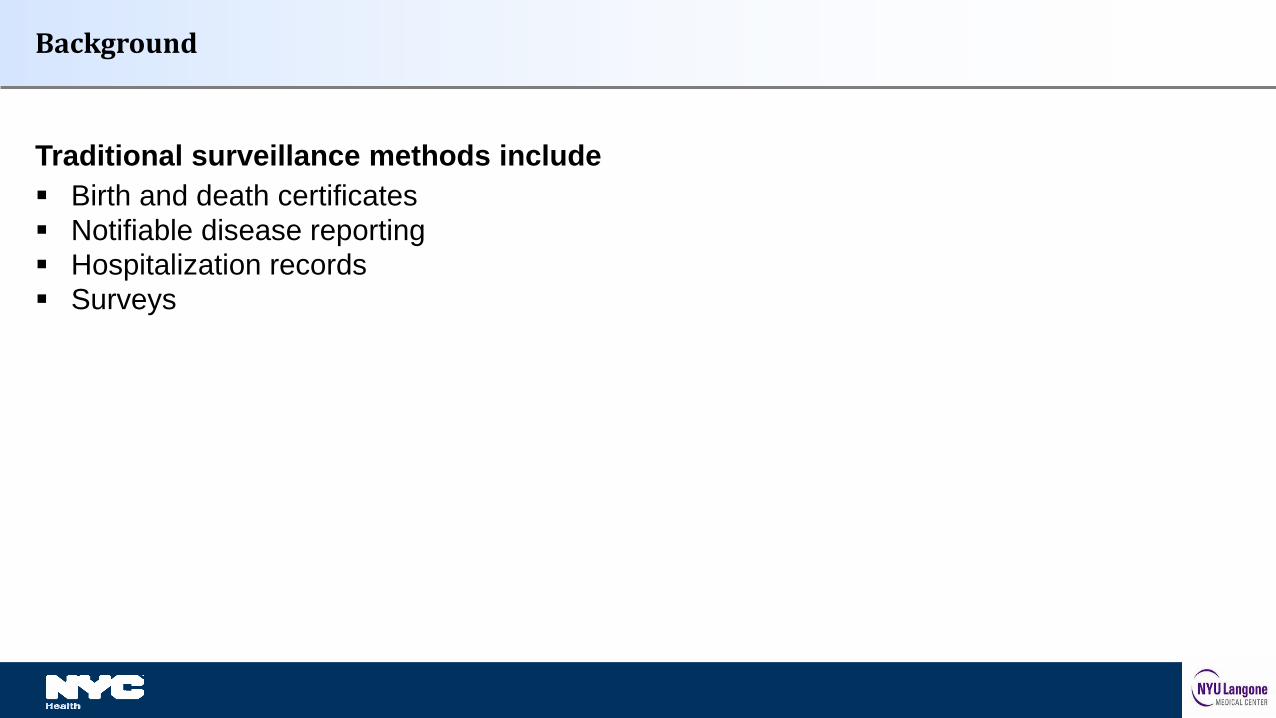
Traditional surveillance methods include
Birth and death certificates
Notifiable disease reporting
Hospitalization records
Surveys
Background
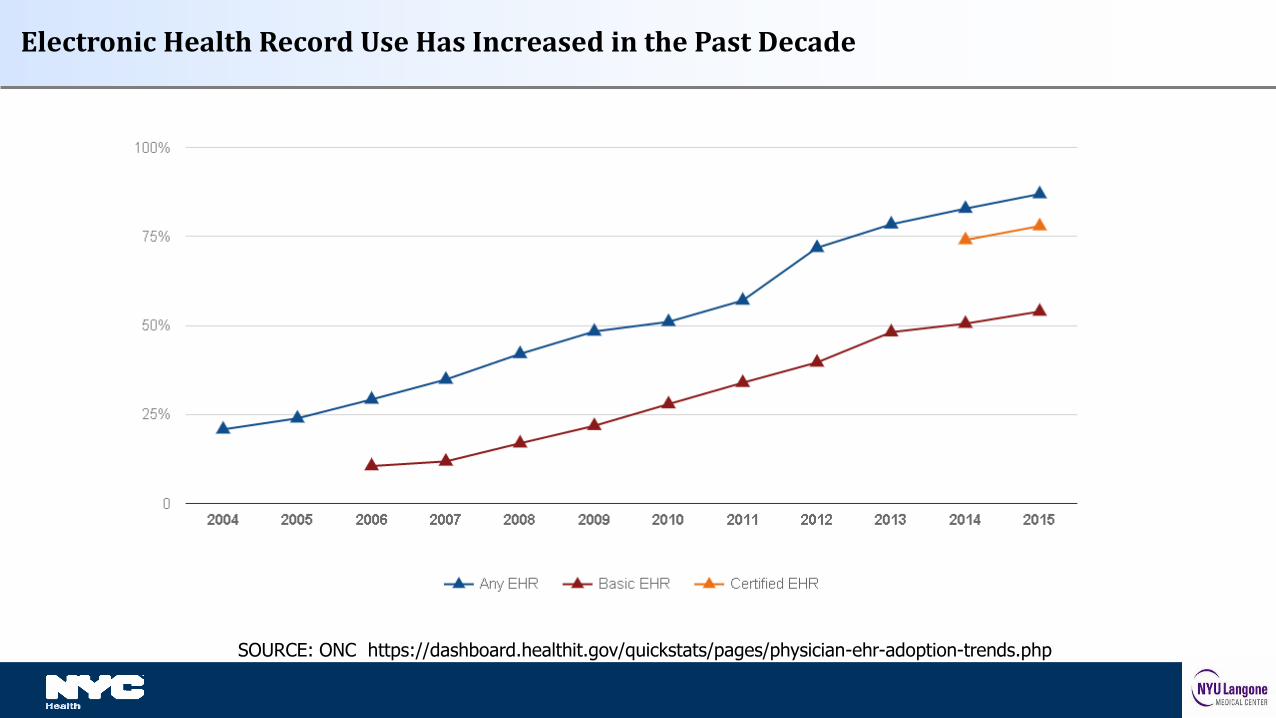
Electronic Health Record Use Has Increased in the Past Decade
SOURCE: ONC https://dashboard.healthit.gov/quickstats/pages/physician-ehr-adoption-trends.php

Traditional surveys are very valuable, but becoming more difficult to conduct.
Telephone survey response rates decreasing
Examination surveys are extremely expensive, labor intensive, often have lengthy lag times between data collection and dissemination.
EHR-based surveillance can complement existing surveillance systems.
May be only source of information in jurisdictions with limited local data.
Potential to Use EHRs for Population Health Surveillance
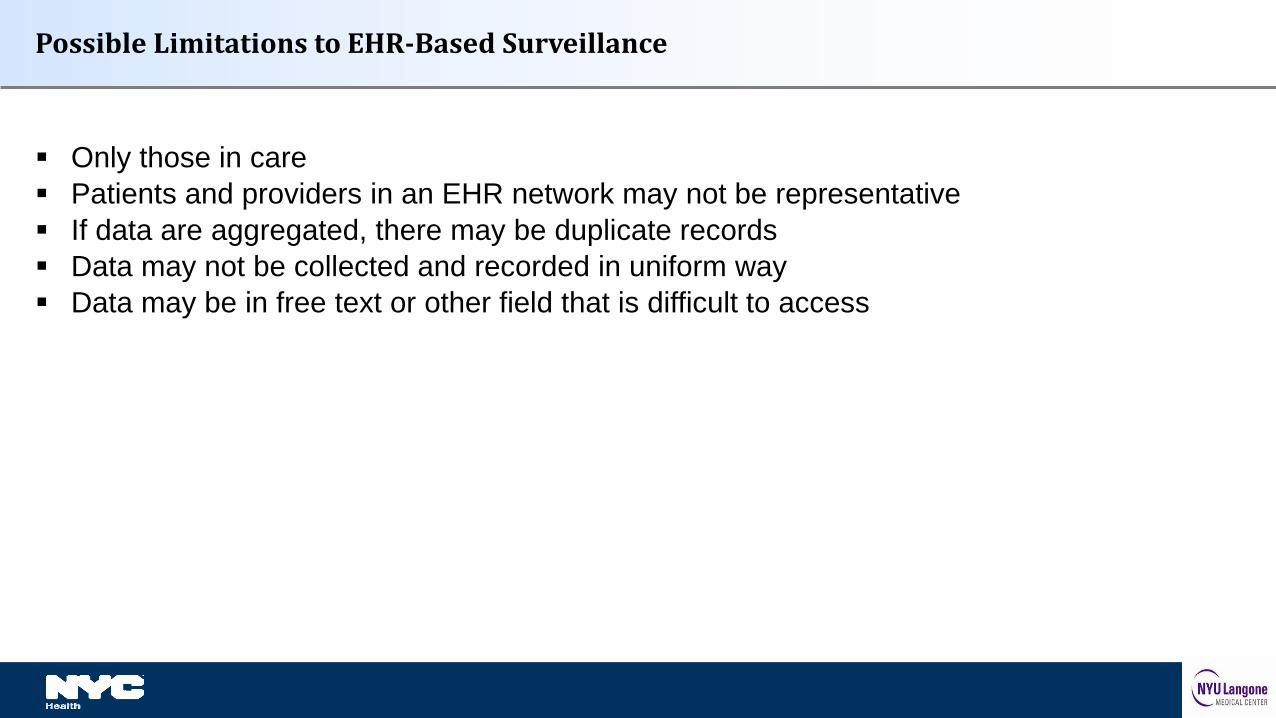
Only those in care
Patients and providers in an EHR network may not be representative
If data are aggregated, there may be duplicate records
Data may not be collected and recorded in uniform way
Data may be in free text or other field that is difficult to access
Possible Limitations to EHR-Based Surveillance
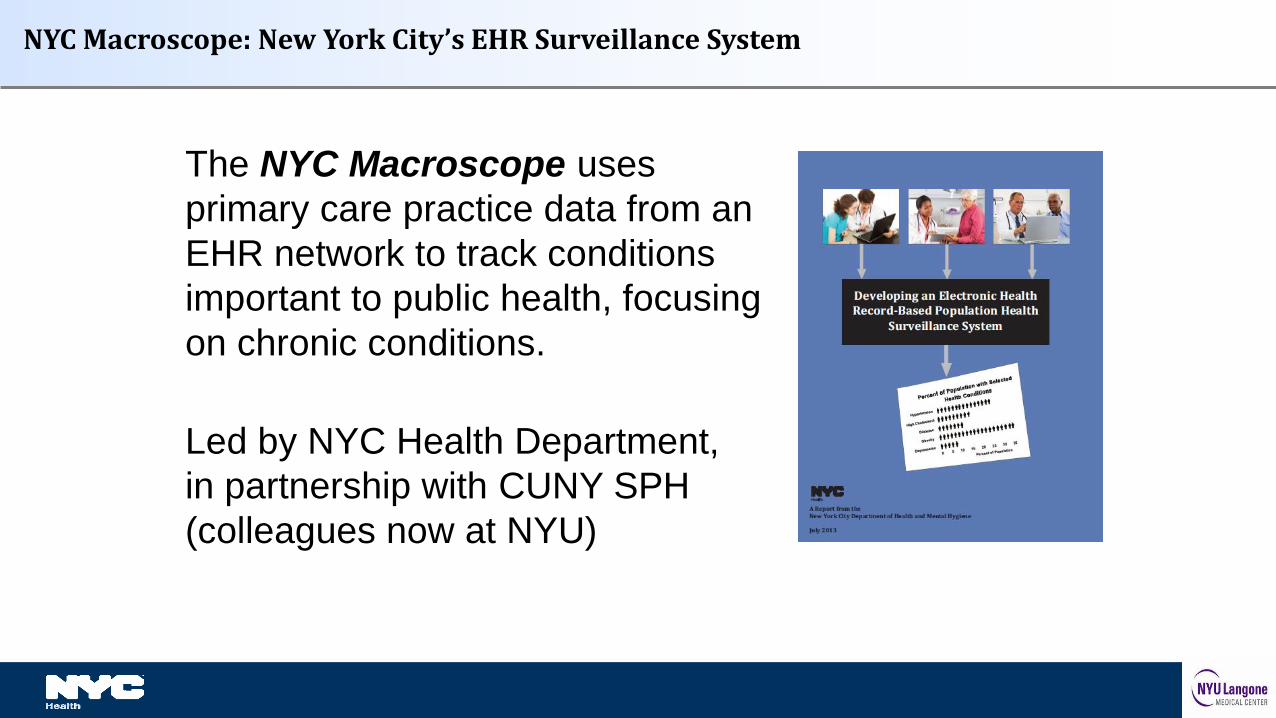
The NYC Macroscope uses
primary care practice data from an
EHR network to track conditions
important to public health, focusing
on chronic conditions.
Led by NYC Health Department,
in partnership with CUNY SPH
(colleagues now at NYU)
NYC Macroscope: New York City’s EHR Surveillance System
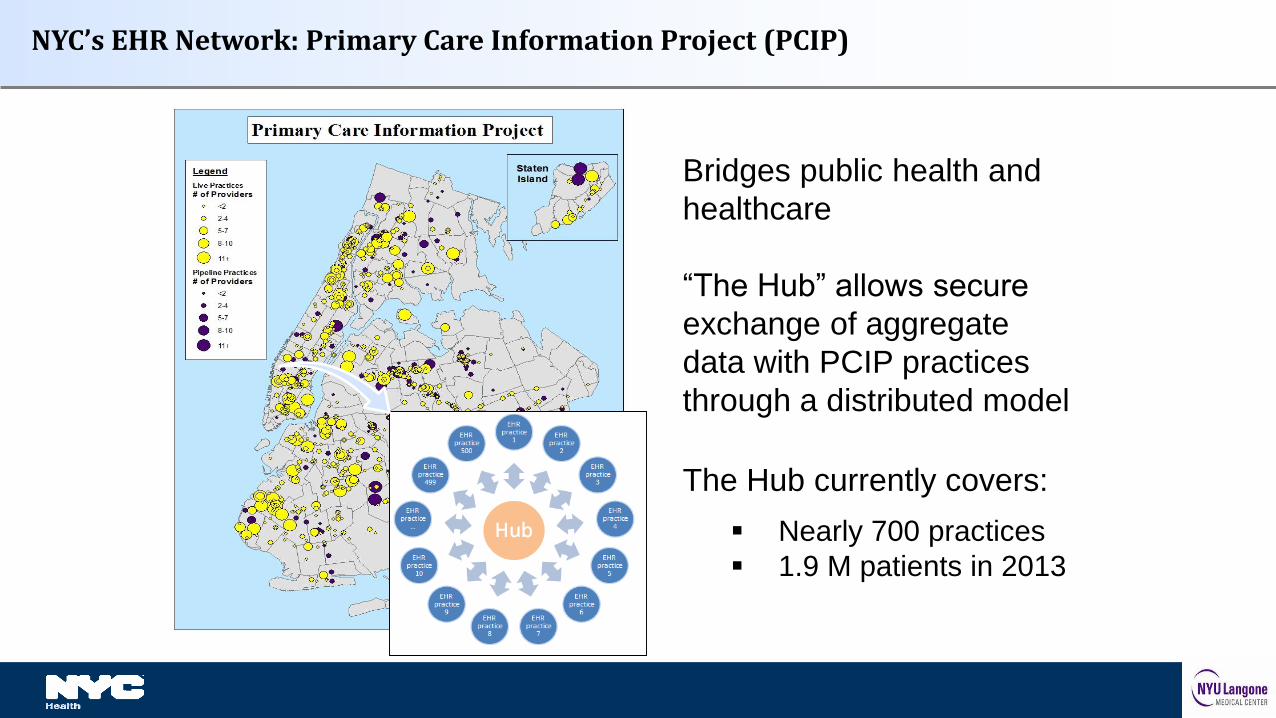
NYC’s EHR Network: Primary Care Information Project (PCIP)
Bridges public health and
healthcare
“The Hub” allows secure
exchange of aggregate
data with PCIP practices
through a distributed model
The Hub currently covers:
Nearly 700 practices
1.9 M patients in 2013
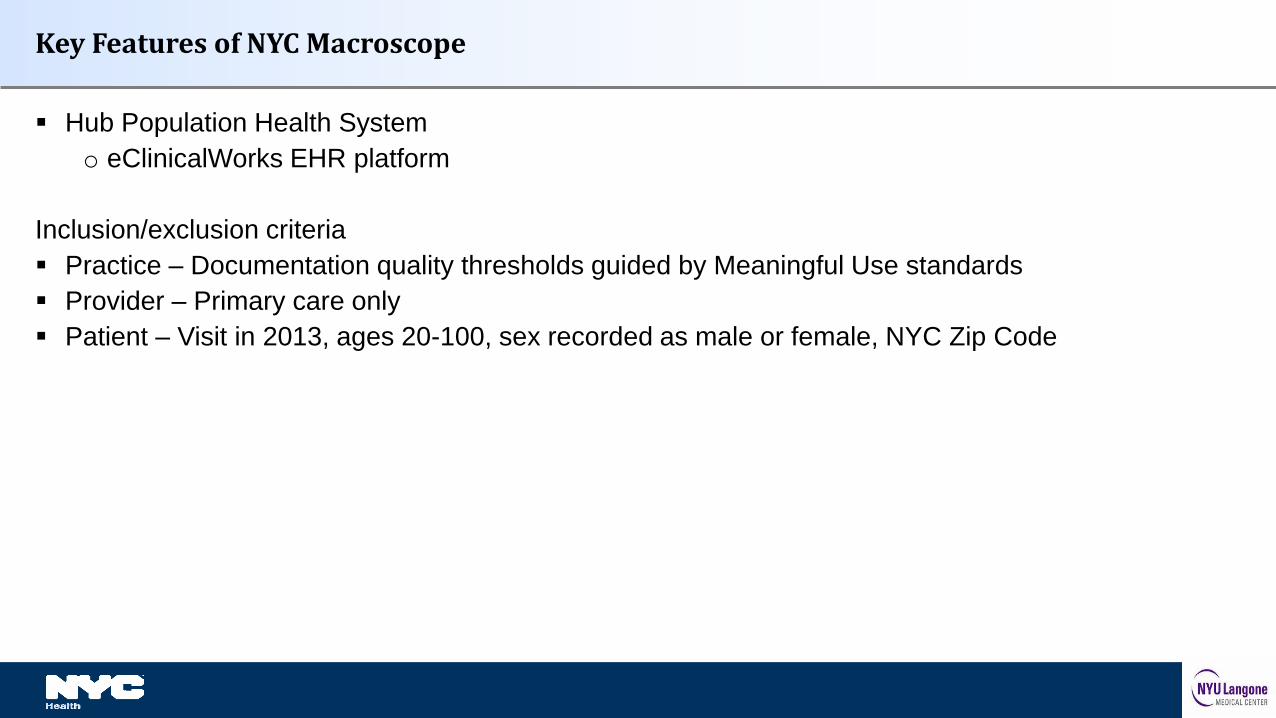
Hub Population Health System
o eClinicalWorks EHR platform
Inclusion/exclusion criteria
Practice – Documentation quality thresholds guided by Meaningful Use standards
Provider – Primary care only
Patient – Visit in 2013, ages 20-100, sex recorded as male or female, NYC Zip Code
Key Features of NYC Macroscope
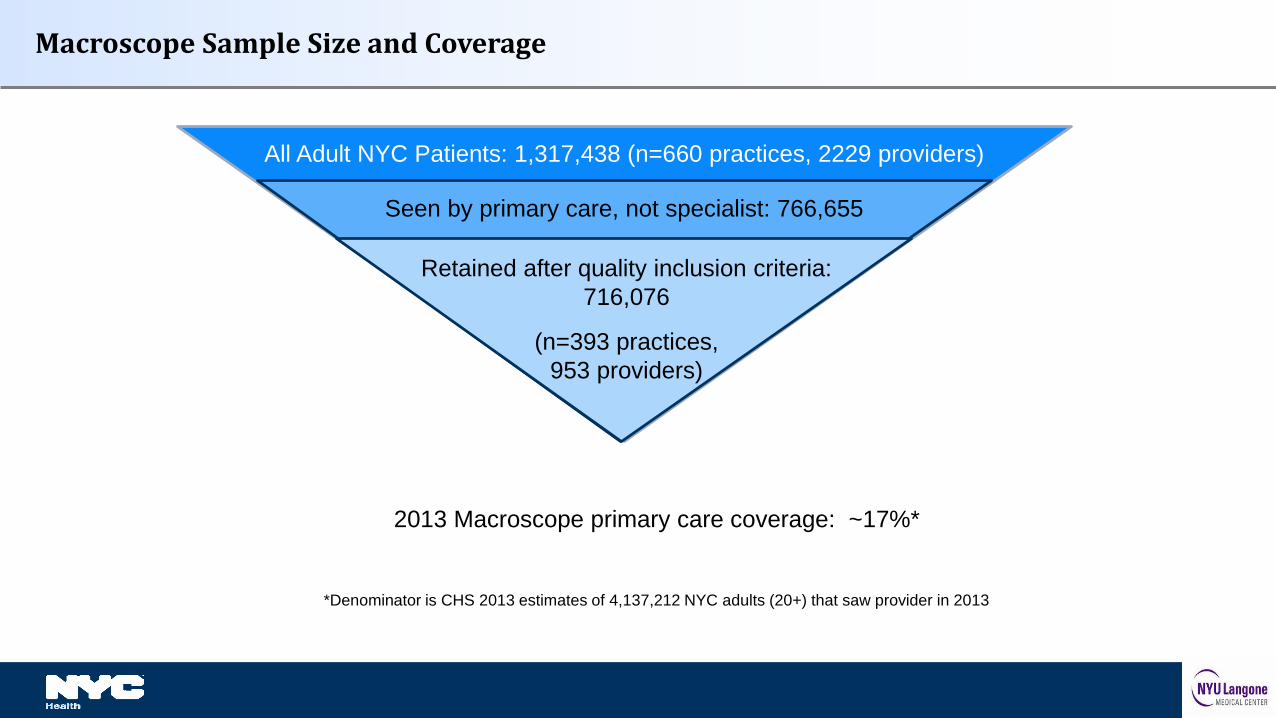
Macroscope Sample Size and Coverage
All Adult NYC Patients: 1,317,438 (n=660 practices, 2229 providers)
Seen by primary care, not specialist: 766,655
Retained after quality inclusion criteria:
716,076
(n=393 practices,
953 providers)
2013 Macroscope primary care coverage: ~17%*
*Denominator is CHS 2013 estimates of 4,137,212 NYC adults (20+) that saw provider in 2013
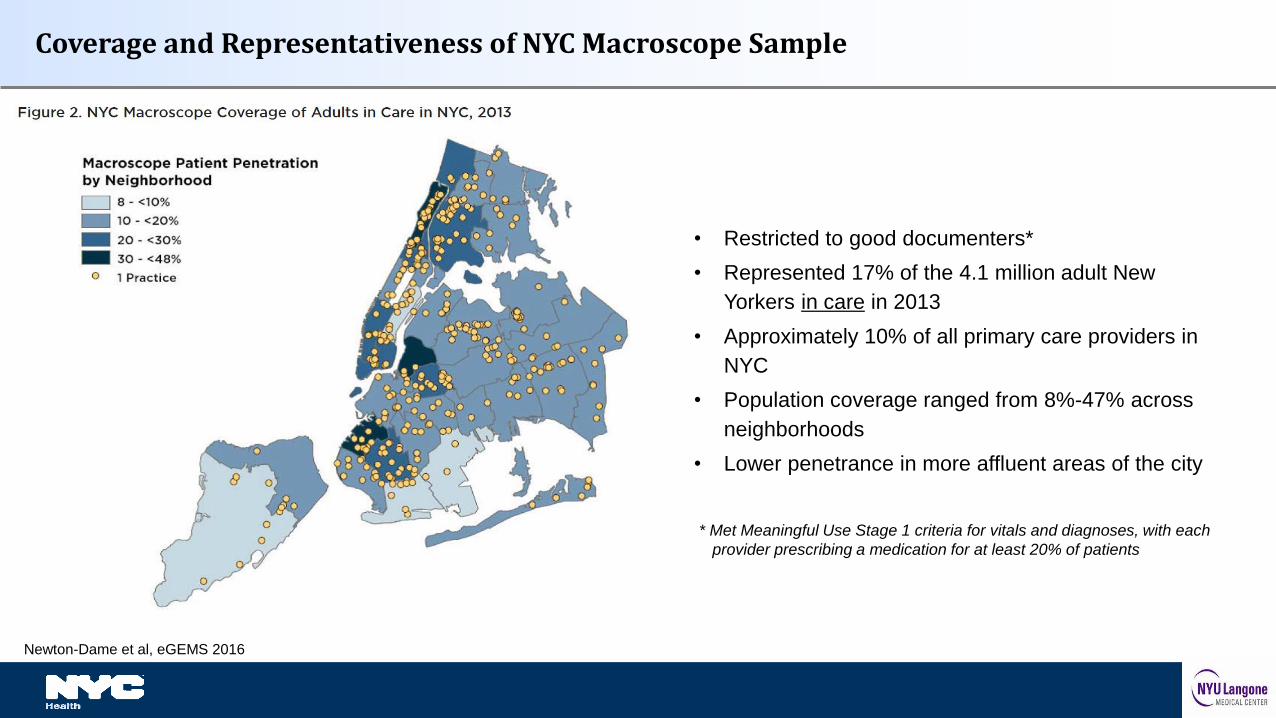
Coverage and Representativeness of NYC Macroscope Sample
• Restricted to good documenters*
• Represented 17% of the 4.1 million adult New
Yorkers in care in 2013
• Approximately 10% of all primary care providers in
NYC
• Population coverage ranged from 8%-47% across
neighborhoods
• Lower penetrance in more affluent areas of the city
* Met Meaningful Use Stage 1 criteria for vitals and diagnoses, with each
provider prescribing a medication for at least 20% of patients
Newton-Dame et al, eGEMS 2016
Weighted to the distribution of the NYC adult population that had seen a health provider in the past year
Validated against 2 population-based reference surveys
2013-14 NYC Health and Nutrition Examination Survey (NYC HANES)
N = 1,527; 1,135 in care
2013 NYC Community Health Survey (CHS)
N = 8,356; 6,166 in care
Key Features of NYC Macroscope, continued
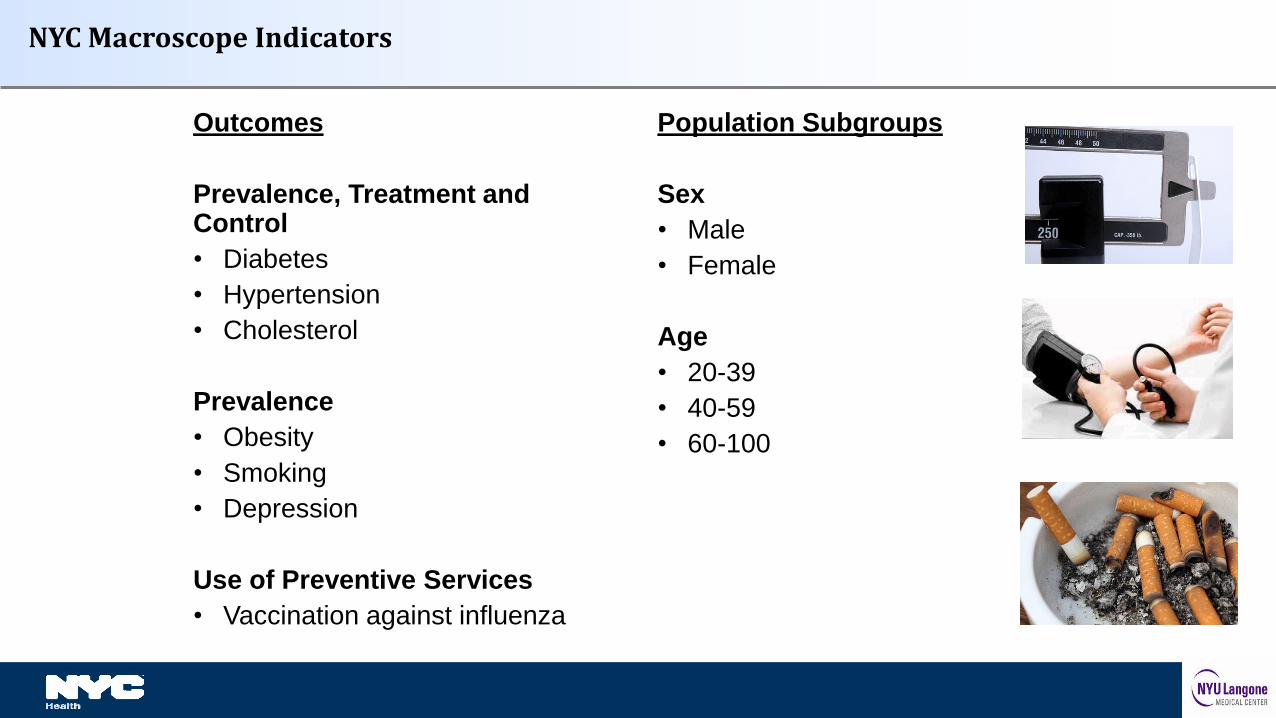
NYC Macroscope Indicators
Outcomes
Prevalence, Treatment and Control
• Diabetes
• Hypertension
• Cholesterol
Prevalence
• Obesity
• Smoking
• Depression
Use of Preventive Services
• Vaccination against influenza
Population Subgroups
Sex
• Male
• Female
Age
• 20-39
• 40-59
• 60-100
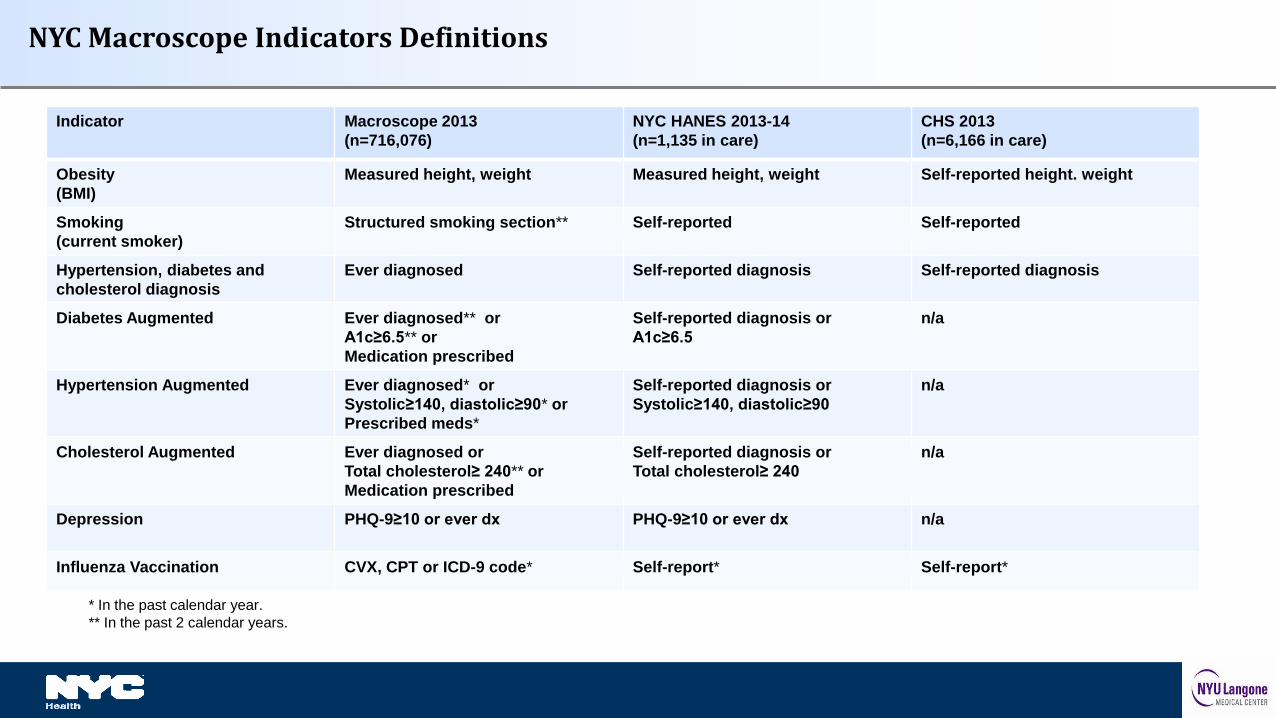
NYC Macroscope Indicators Definitions
Indicator Macroscope 2013
(n=716,076)
NYC HANES 2013-14
(n=1,135 in care)
CHS 2013
(n=6,166 in care)
Obesity
(BMI)
Measured height, weight Measured height, weight Self-reported height. weight
Smoking
(current smoker)
Structured smoking section** Self-reported Self-reported
Hypertension, diabetes and
cholesterol diagnosis
Ever diagnosed Self-reported diagnosis Self-reported diagnosis
Diabetes Augmented Ever diagnosed** or
A1c≥6.5** or
Medication prescribed
Self-reported diagnosis or
A1c≥6.5
n/a
Hypertension Augmented Ever diagnosed* or
Systolic≥140, diastolic≥90* or
Prescribed meds*
Self-reported diagnosis or
Systolic≥140, diastolic≥90
n/a
Cholesterol Augmented Ever diagnosed or
Total cholesterol≥ 240** or
Medication prescribed
Self-reported diagnosis or
Total cholesterol≥ 240
n/a
Depression PHQ-9≥10 or ever dx PHQ-9≥10 or ever dx n/a
Influenza Vaccination CVX, CPT or ICD-9 code* Self-report* Self-report*
* In the past calendar year.
** In the past 2 calendar years.
POPULATION-BASED PREVALENCE ESTIMATE COMPARISONS
Validation Study Results
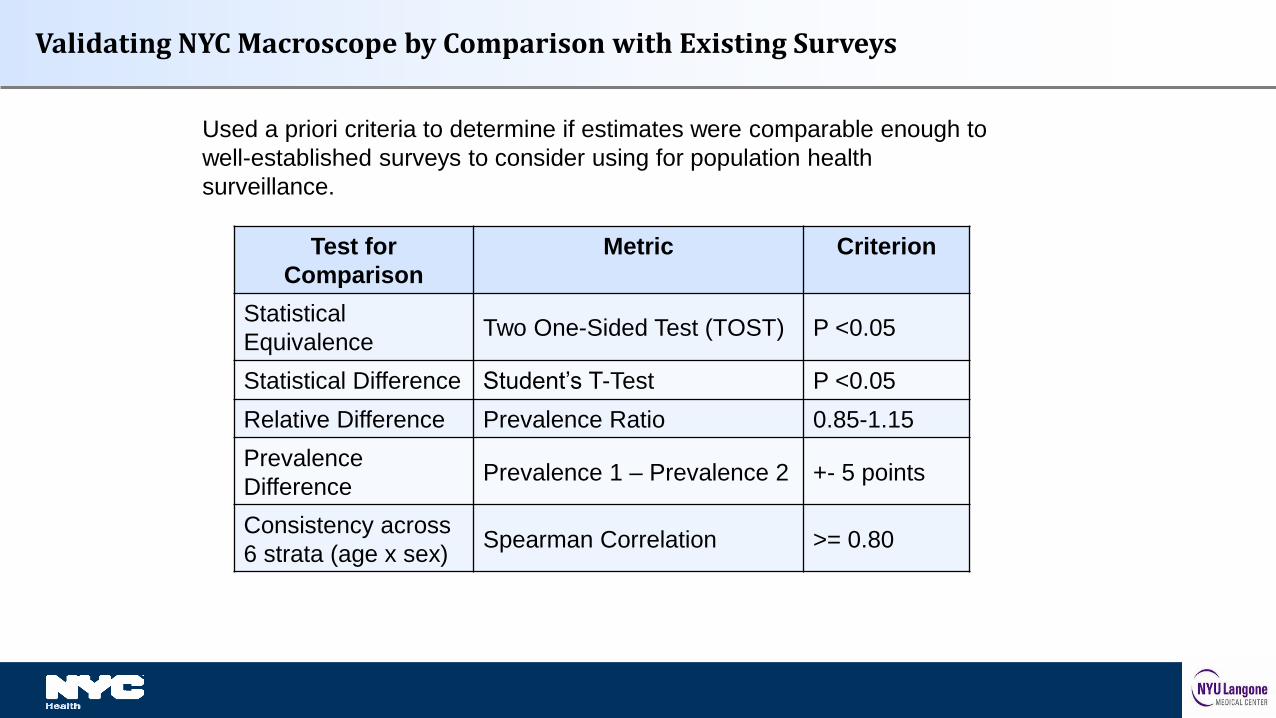
Test for
Comparison
Metric Criterion
Statistical
EquivalenceTwo One-Sided Test (TOST) P <0.05
Statistical Difference Student’s T-Test P <0.05
Relative Difference Prevalence Ratio 0.85-1.15
Prevalence
DifferencePrevalence 1 – Prevalence 2 +- 5 points
Consistency across
6 strata (age x sex)Spearman Correlation >= 0.80
Validating NYC Macroscope by Comparison with Existing Surveys
Used a priori criteria to determine if estimates were comparable enough to
well-established surveys to consider using for population health
surveillance.
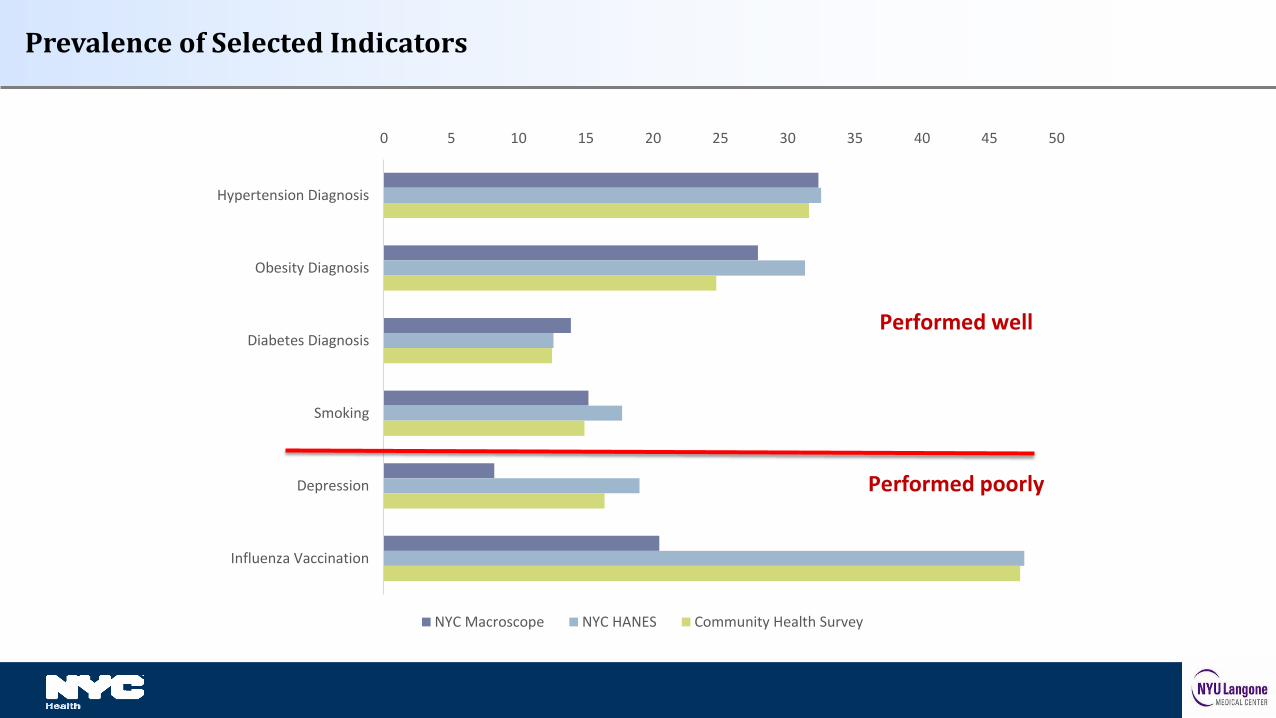
Prevalence of Selected Indicators
0 5 10 15 20 25 30 35 40 45 50
Hypertension Diagnosis
Obesity Diagnosis
Diabetes Diagnosis
Smoking
Depression
Influenza Vaccination
NYC Macroscope NYC HANES Community Health Survey
Performed well
Performed poorly
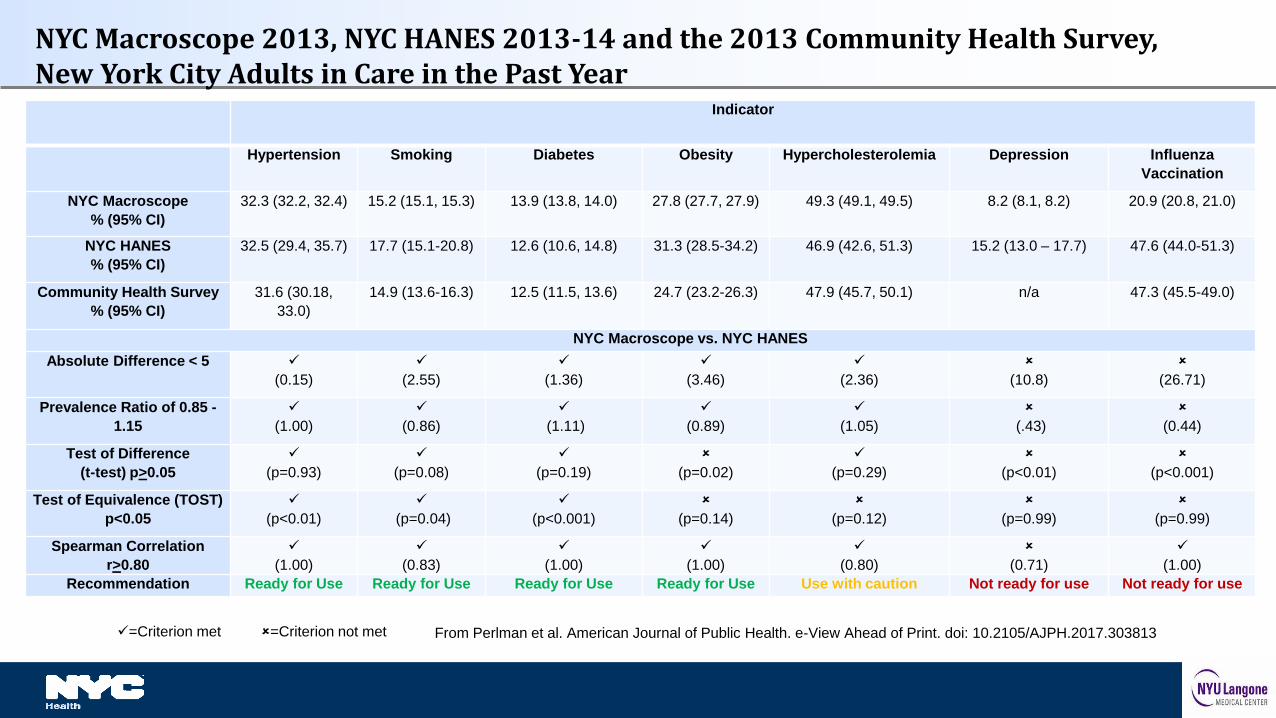
Indicator
Hypertension Smoking Diabetes Obesity Hypercholesterolemia Depression Influenza
Vaccination
NYC Macroscope
% (95% CI)
32.3 (32.2, 32.4) 15.2 (15.1, 15.3) 13.9 (13.8, 14.0) 27.8 (27.7, 27.9) 49.3 (49.1, 49.5) 8.2 (8.1, 8.2) 20.9 (20.8, 21.0)
NYC HANES
% (95% CI)
32.5 (29.4, 35.7) 17.7 (15.1-20.8) 12.6 (10.6, 14.8) 31.3 (28.5-34.2) 46.9 (42.6, 51.3) 15.2 (13.0 – 17.7) 47.6 (44.0-51.3)
Community Health Survey
% (95% CI)
31.6 (30.18,
33.0)
14.9 (13.6-16.3) 12.5 (11.5, 13.6) 24.7 (23.2-26.3) 47.9 (45.7, 50.1) n/a 47.3 (45.5-49.0)
NYC Macroscope vs. NYC HANES
Absolute Difference < 5
(0.15)
(2.55)
(1.36)
(3.46)
(2.36)
(10.8)
(26.71)
Prevalence Ratio of 0.85 -
1.15
(1.00)
(0.86)
(1.11)
(0.89)
(1.05)
(.43)
(0.44)
Test of Difference
(t-test) p>0.05
(p=0.93)
(p=0.08)
(p=0.19)
(p=0.02)
(p=0.29)
(p<0.01)
(p<0.001)
Test of Equivalence (TOST)
p<0.05
(p<0.01)
(p=0.04)
(p<0.001)
(p=0.14)
(p=0.12)
(p=0.99)
(p=0.99)
Spearman Correlation
r>0.80
(1.00)
(0.83)
(1.00)
(1.00)
(0.80)
(0.71)
(1.00)
Recommendation Ready for Use Ready for Use Ready for Use Ready for Use Use with caution Not ready for use Not ready for use
NYC Macroscope 2013, NYC HANES 2013-14 and the 2013 Community Health Survey, New York City Adults in Care in the Past Year
=Criterion met =Criterion not met From Perlman et al. American Journal of Public Health. e-View Ahead of Print. doi: 10.2105/AJPH.2017.303813
SENSITIVITY AND SPECIFICITY OF NYC
MACROSCOPE INDICATORS
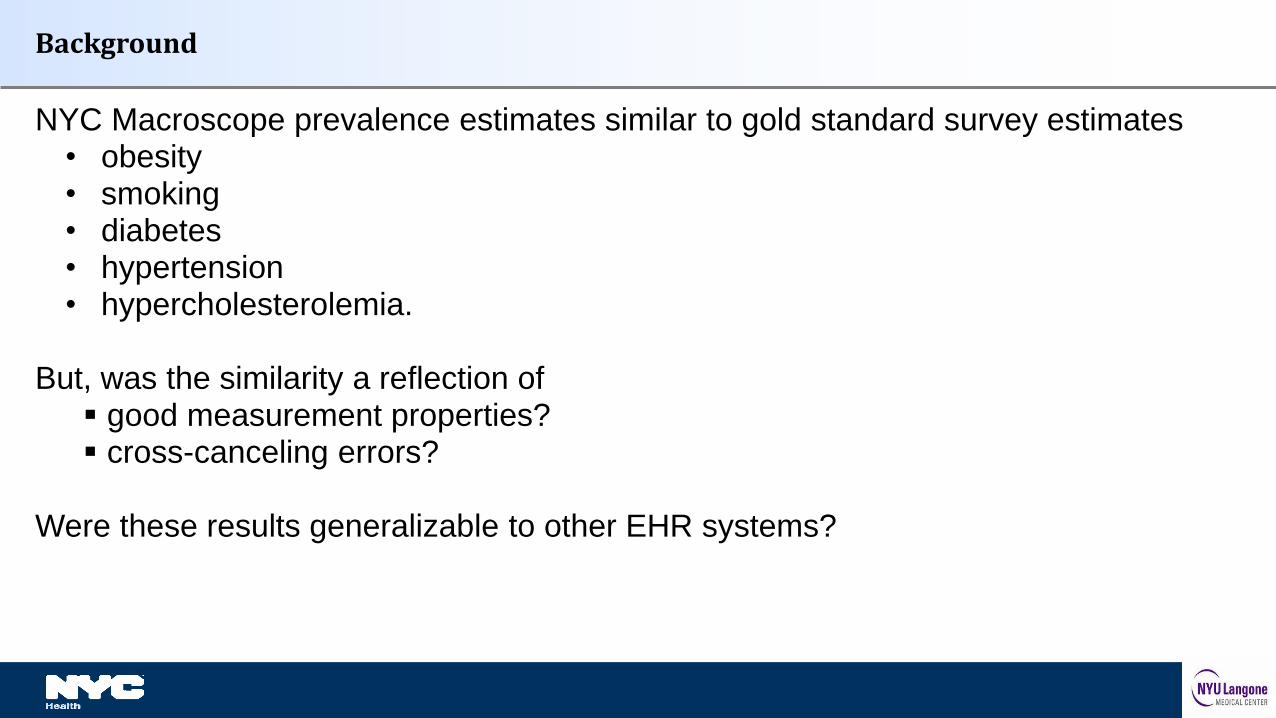
Background
NYC Macroscope prevalence estimates similar to gold standard survey estimates• obesity• smoking • diabetes• hypertension• hypercholesterolemia.
But, was the similarity a reflection of good measurement properties? cross-canceling errors?
Were these results generalizable to other EHR systems?
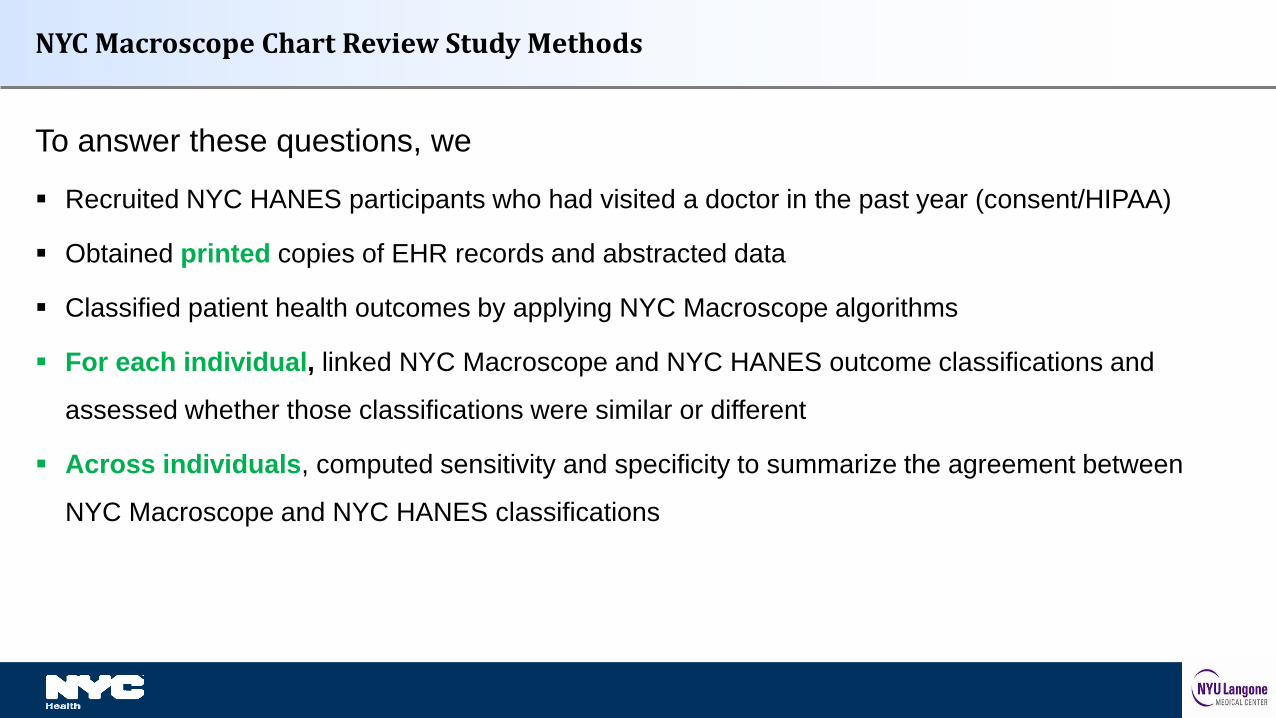
To answer these questions, we
Recruited NYC HANES participants who had visited a doctor in the past year (consent/HIPAA)
Obtained printed copies of EHR records and abstracted data
Classified patient health outcomes by applying NYC Macroscope algorithms
For each individual, linked NYC Macroscope and NYC HANES outcome classifications and
assessed whether those classifications were similar or different
Across individuals, computed sensitivity and specificity to summarize the agreement between
NYC Macroscope and NYC HANES classifications
NYC Macroscope Chart Review Study Methods
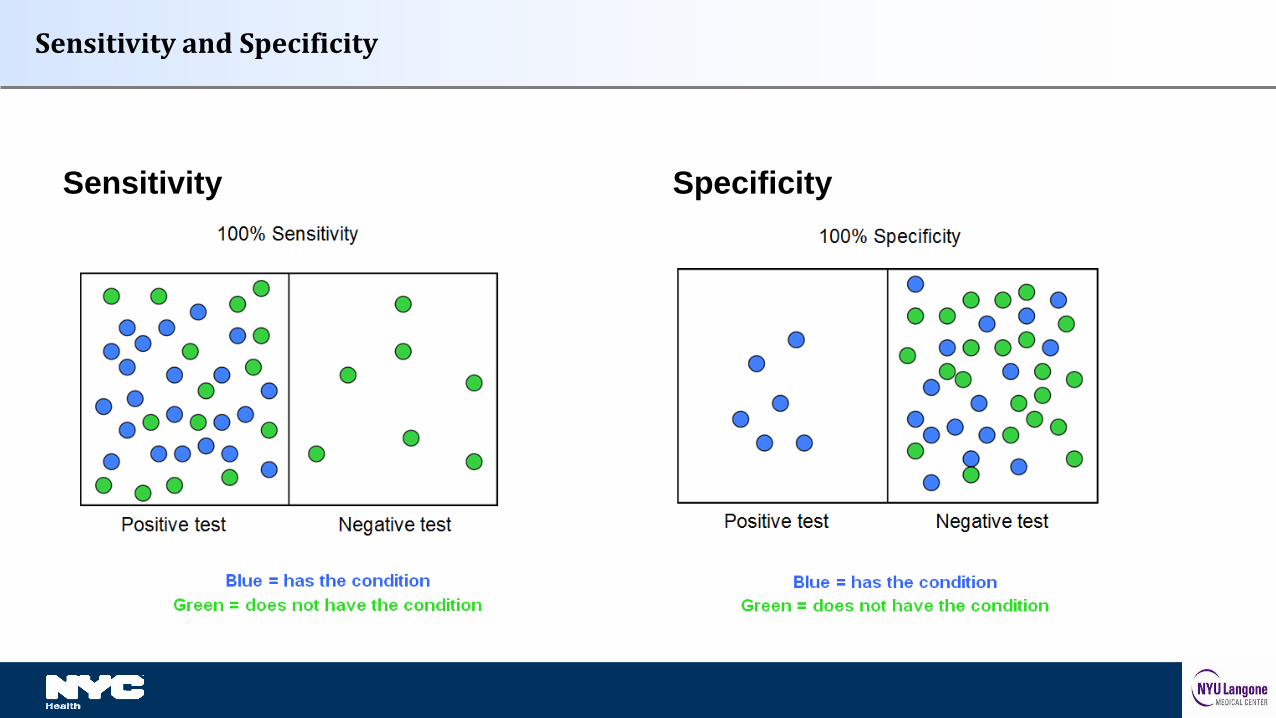
Sensitivity and Specificity
SpecificitySensitivity
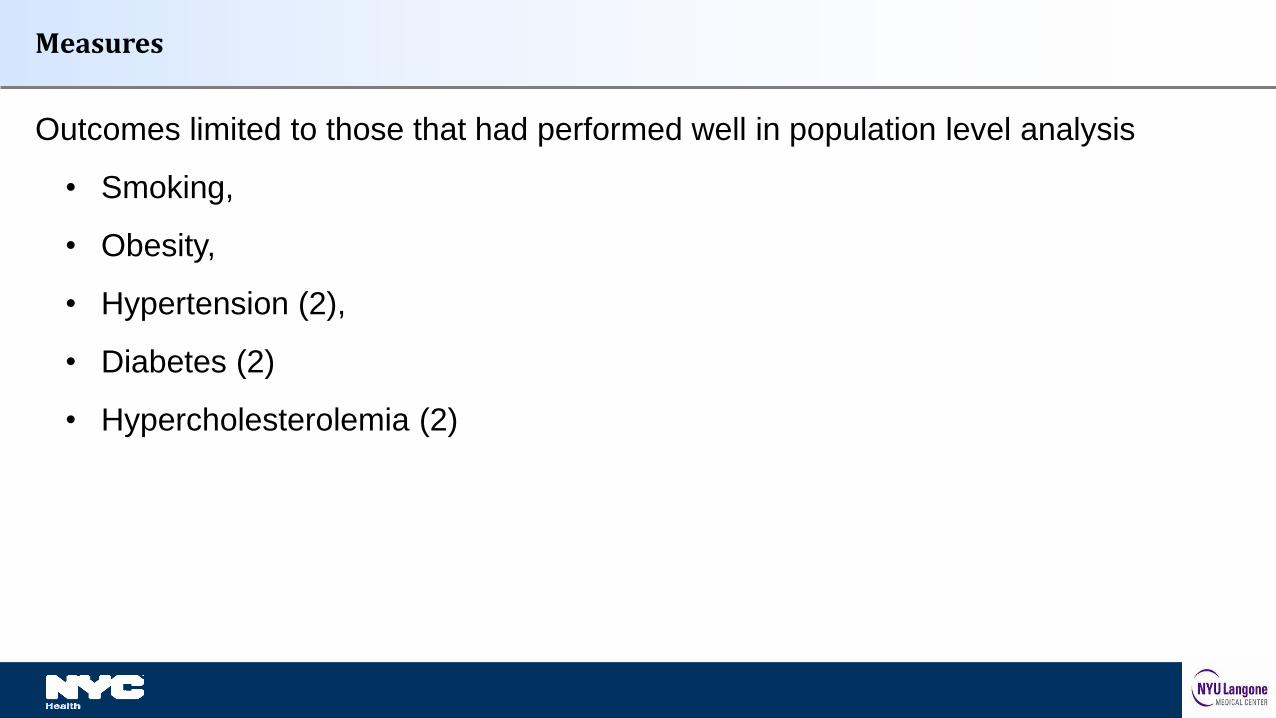
Measures
Outcomes limited to those that had performed well in population level analysis
• Smoking,
• Obesity,
• Hypertension (2),
• Diabetes (2)
• Hypercholesterolemia (2)
Statistical Analysis
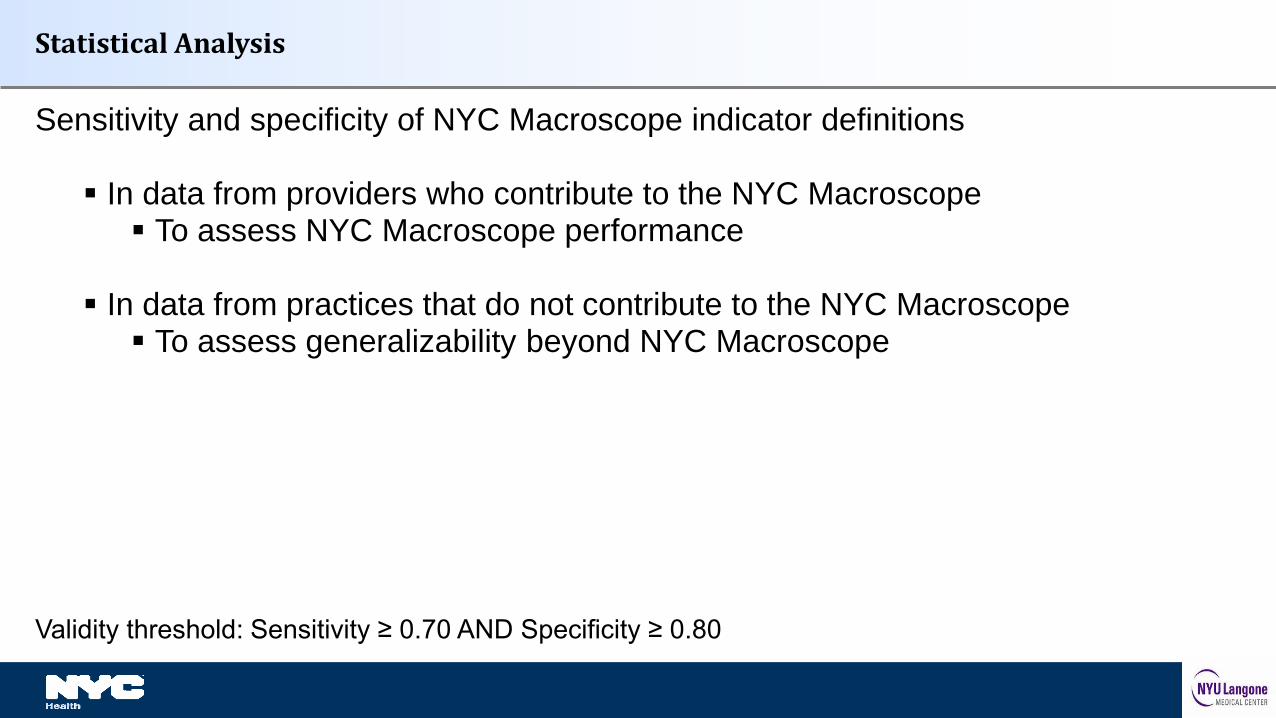
Sensitivity and specificity of NYC Macroscope indicator definitions
In data from providers who contribute to the NYC Macroscope To assess NYC Macroscope performance
In data from practices that do not contribute to the NYC Macroscope To assess generalizability beyond NYC Macroscope
Validity threshold: Sensitivity ≥ 0.70 AND Specificity ≥ 0.80
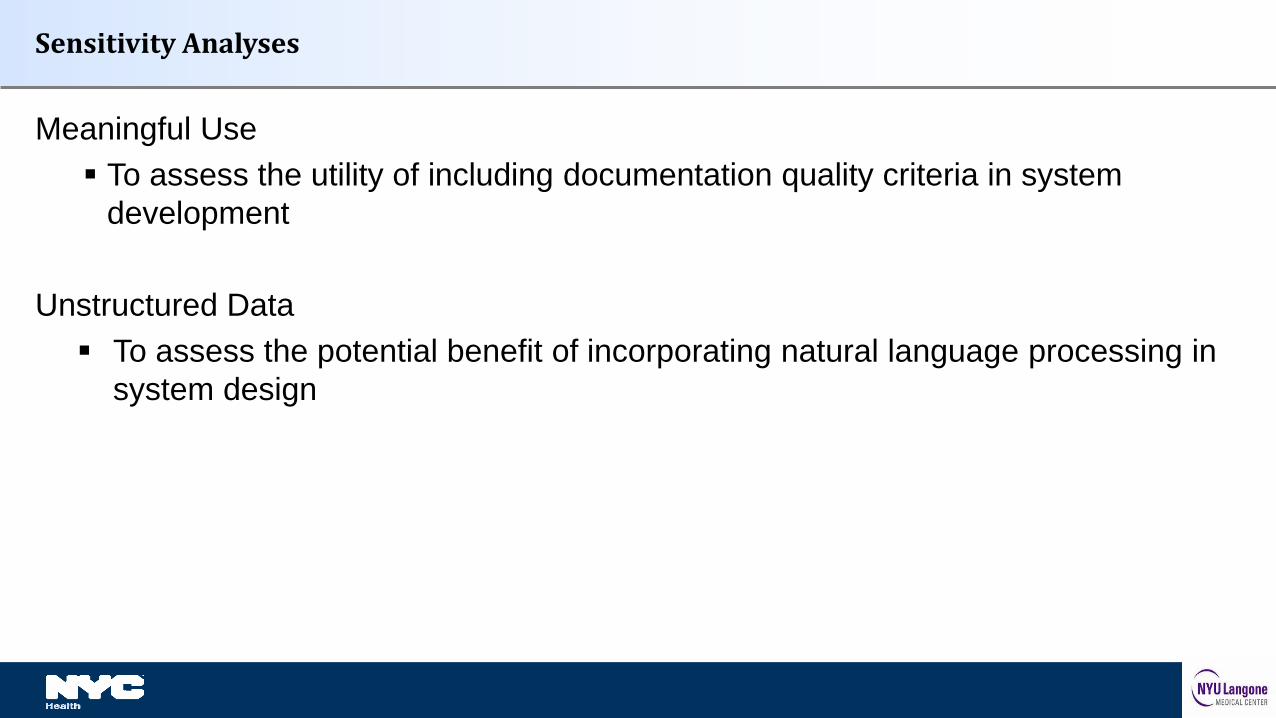
Sensitivity Analyses
Meaningful Use
To assess the utility of including documentation quality criteria in system
development
Unstructured Data
To assess the potential benefit of incorporating natural language processing in
system design
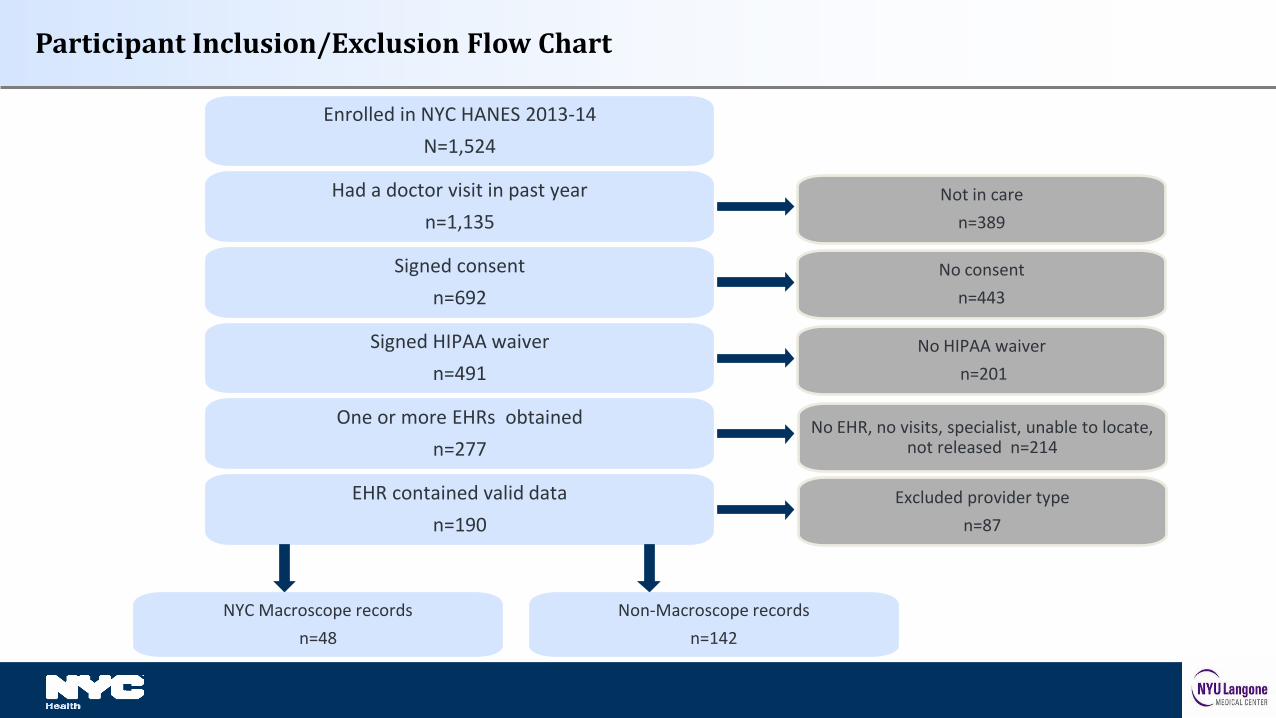
Participant Inclusion/Exclusion Flow Chart
Enrolled in NYC HANES 2013-14
N=1,524
Had a doctor visit in past year
n=1,135
Signed consent
n=692
Signed HIPAA waiver
n=491
One or more EHRs obtained
n=277
EHR contained valid data
n=190
Not in care
n=389
No consent
n=443
No HIPAA waiver
n=201
No EHR, no visits, specialist, unable to locate, not released n=214
Excluded provider type
n=87
NYC Macroscope records
n=48
Non-Macroscope records
n=142
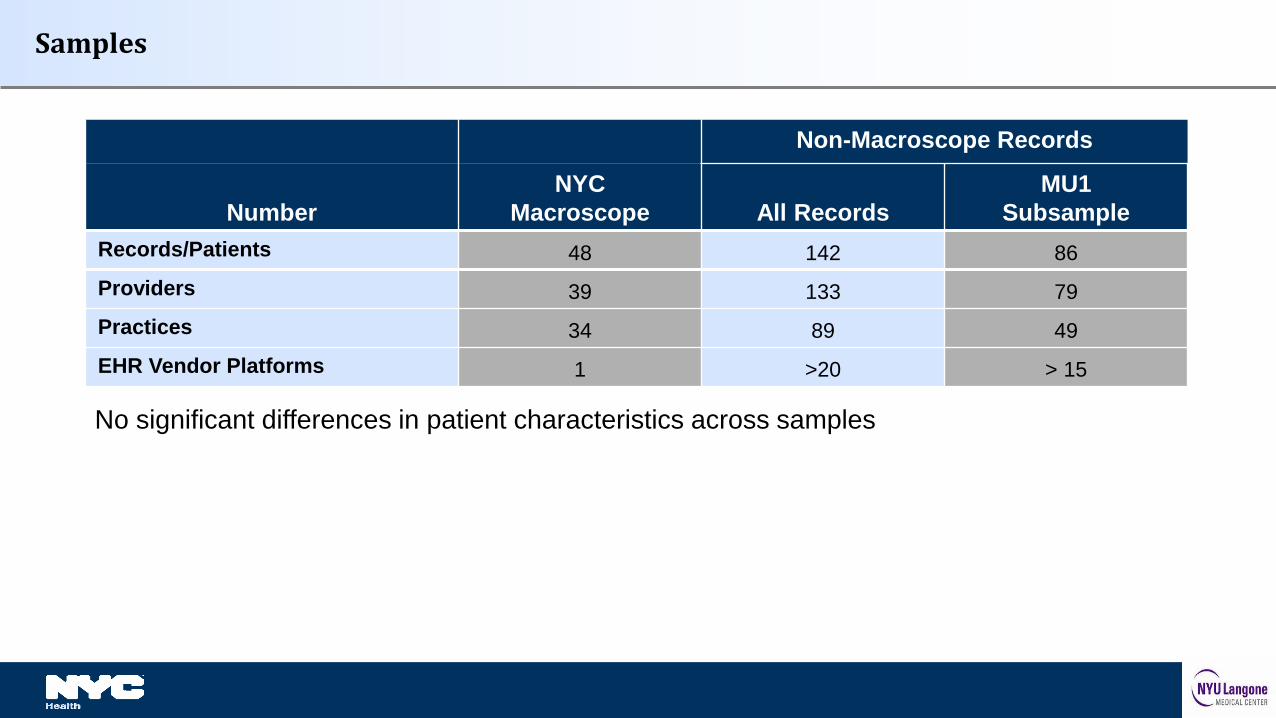
Samples
Non-Macroscope Records
Number
NYC
Macroscope All Records
MU1
Subsample
Records/Patients 48 142 86
Providers 39 133 79
Practices 34 89 49
EHR Vendor Platforms 1 >20 > 15
No significant differences in patient characteristics across samples
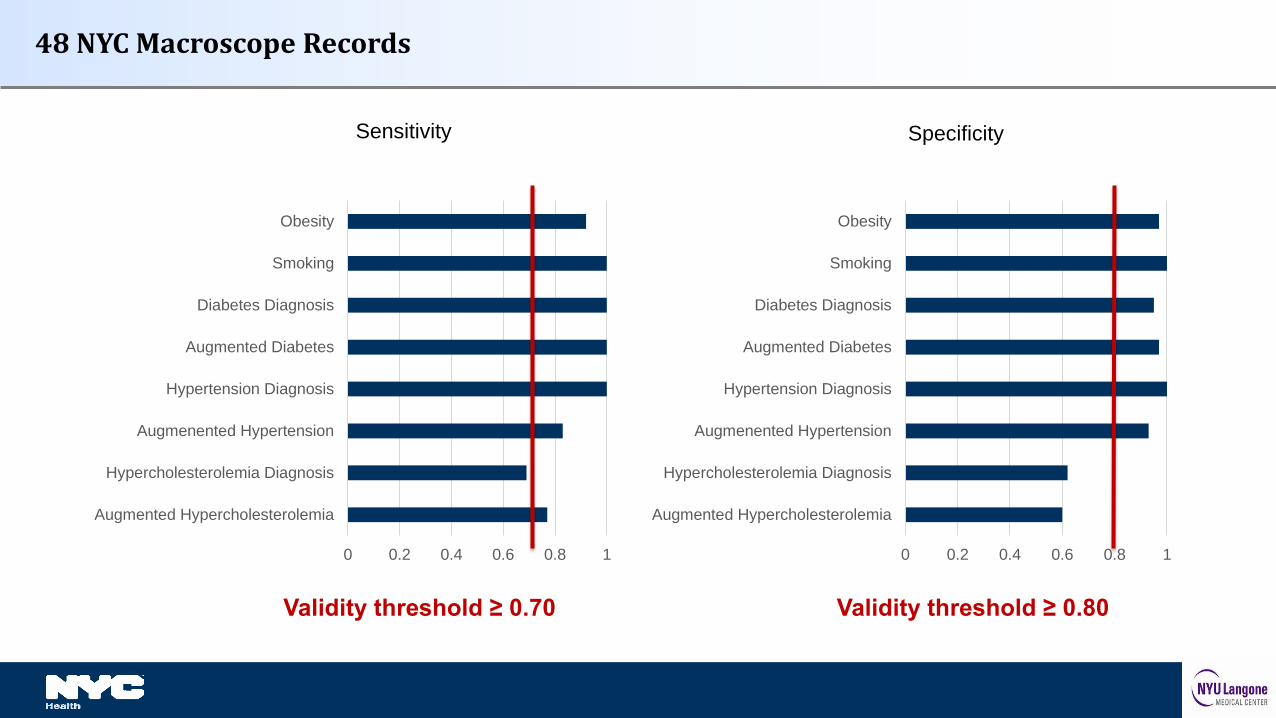
48 NYC Macroscope Records
Sensitivity Specificity
0 0.2 0.4 0.6 0.8 1
Augmented Hypercholesterolemia
Hypercholesterolemia Diagnosis
Augmenented Hypertension
Hypertension Diagnosis
Augmented Diabetes
Diabetes Diagnosis
Smoking
Obesity
0 0.2 0.4 0.6 0.8 1
Augmented Hypercholesterolemia
Hypercholesterolemia Diagnosis
Augmenented Hypertension
Hypertension Diagnosis
Augmented Diabetes
Diabetes Diagnosis
Smoking
Obesity
Validity threshold ≥ 0.70 Validity threshold ≥ 0.80
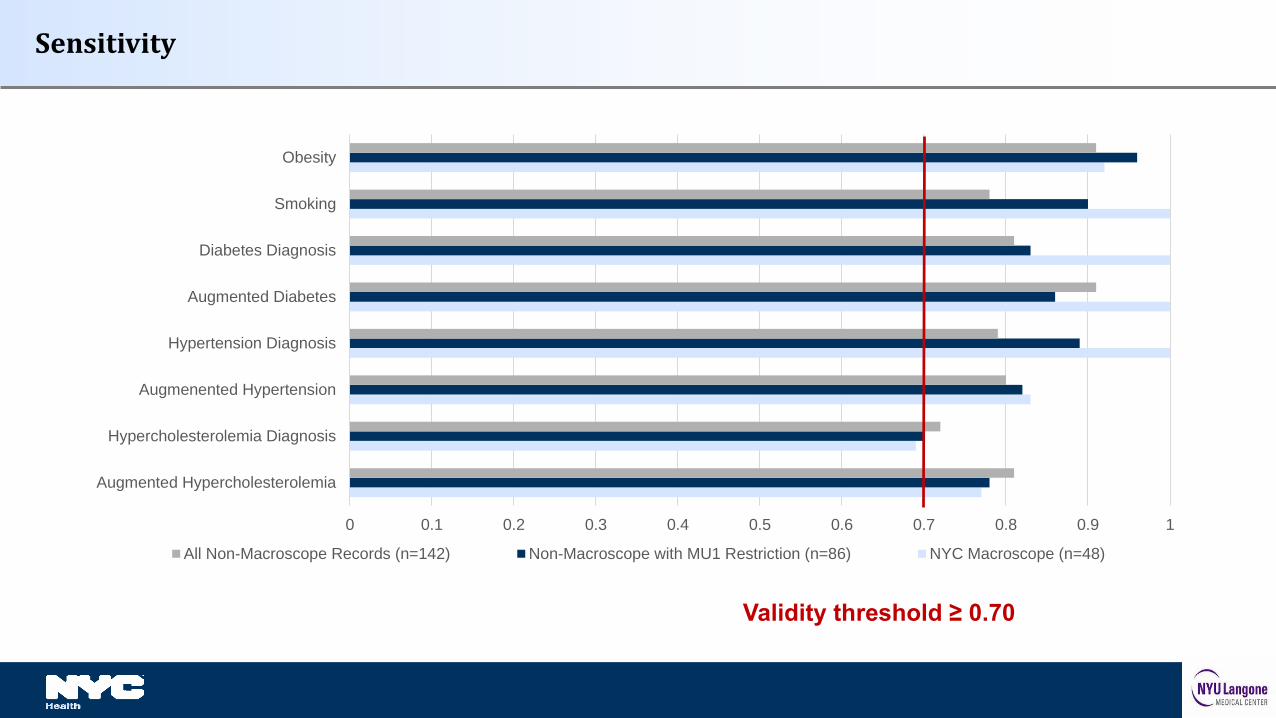
Sensitivity
0 0.1 0.2 0.3 0.4 0.5 0.6 0.7 0.8 0.9 1
Augmented Hypercholesterolemia
Hypercholesterolemia Diagnosis
Augmenented Hypertension
Hypertension Diagnosis
Augmented Diabetes
Diabetes Diagnosis
Smoking
Obesity
All Non-Macroscope Records (n=142) Non-Macroscope with MU1 Restriction (n=86) NYC Macroscope (n=48)
Validity threshold ≥ 0.70
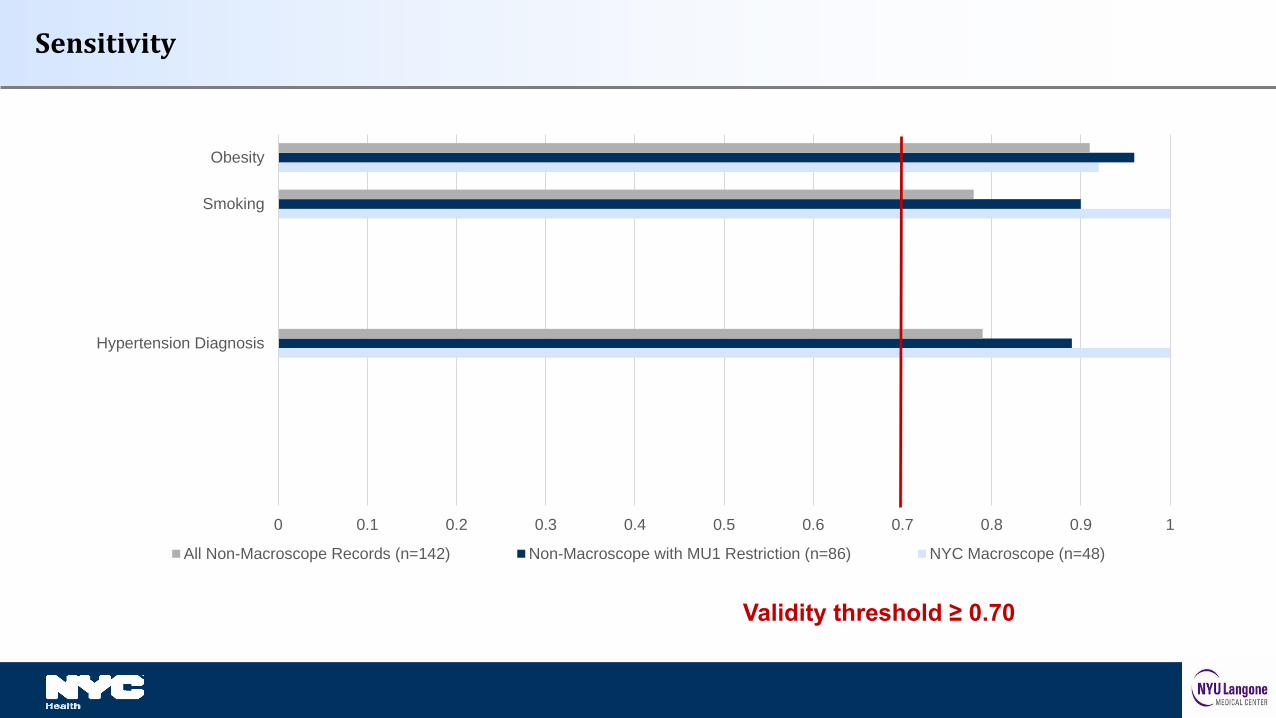
Sensitivity
0 0.1 0.2 0.3 0.4 0.5 0.6 0.7 0.8 0.9 1
Hypertension Diagnosis
Smoking
Obesity
All Non-Macroscope Records (n=142) Non-Macroscope with MU1 Restriction (n=86) NYC Macroscope (n=48)
Validity threshold ≥ 0.70
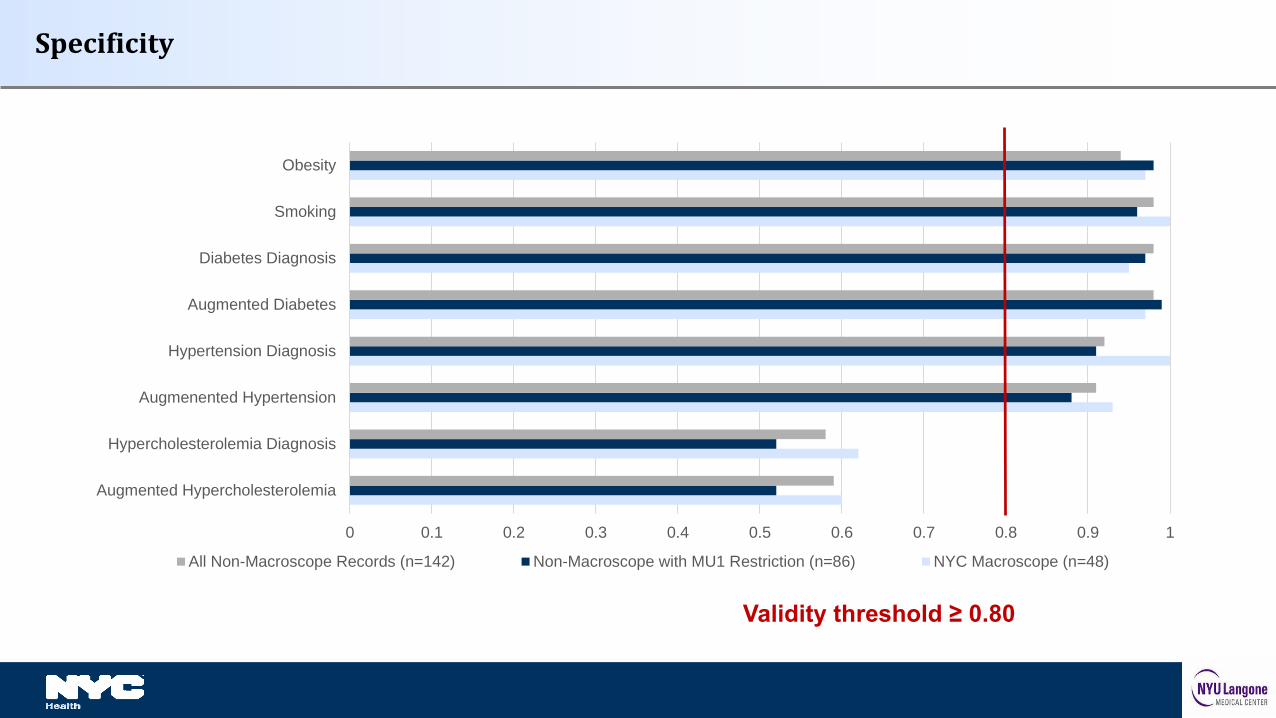
Specificity
0 0.1 0.2 0.3 0.4 0.5 0.6 0.7 0.8 0.9 1
Augmented Hypercholesterolemia
Hypercholesterolemia Diagnosis
Augmenented Hypertension
Hypertension Diagnosis
Augmented Diabetes
Diabetes Diagnosis
Smoking
Obesity
All Non-Macroscope Records (n=142) Non-Macroscope with MU1 Restriction (n=86) NYC Macroscope (n=48)
Validity threshold ≥ 0.80
Summary
Both indicators of hypercholesterolemia performed poorly
All other measures performed well
Consistency across NYC Macroscope and Non-Macroscope records
Restricting records to those from providers who have attested to Meaningful Use improved the sensitivity of obesity, smoking and hypertension diagnosis indicators
Strengths and Limitations
Strengths Heterogeneity of providers (N = 172) and EHR vendor platforms (N > 20) Innovative sample and gold standard criterion
Limitations Small sample size/large confidence intervals
Conclusions
NYC Macroscope indicators of obesity, smoking, diabetes and hypertension prevalence Are ready for use by NYC Macroscope Are generalizable to EHR data from other sources
Further work is required to develop valid indicators of hypercholesterolemia
We recommend incorporating meaningful use criteria into EHR surveillance system design to maximize validity
Assessment of methods to adjust for bias and missing data
Development and testing of approaches for small area estimation
Exploration of application of NYC Macroscope methods to other data sources (RHIO, CDRN)
Planning and fundraising for a child module
Next Steps
Perlman SE, McVeigh KH, Thorpe LE, Jacobson L, Greene CM, and Gwynn RC. Innovations in Population Health
Surveillance: Using Electronic Health Records for Chronic Disease Surveillance. American Journal of Public Health. e-
View Ahead of Print. doi: 10.2105/AJPH.2017.303813, 2017.
Newton-Dame R, McVeigh KH, Schreibstein L, Perlman S, Lurie-Moroni E, Jacobson L, Greene CM, Snell E, Thorpe LE. Design
of the New York City Macroscope: Innovations in Population Health Surveillance Using Electronic Health Records.
eGEMS (Generating Evidence & Methods to improve patient outcomes): Vol. 4: Iss.1, Article 26, 2016.
McVeigh KH, Newton-Dame R, Chan PY, Thorpe LE, Schreibstein L, Chernov C, Perlman SE. Can Electronic Health Records
Be Used for Population Health Surveillance? Validating Population Health Metrics Against Established Survey Data.
eGEMS (Generating Evidence & Methods to improve patient outcomes): Vol. 4: Iss.1, Article 27, 2016.
Thorpe LE, McVeigh KH, Perlman S, Chan PY, Bartley K, Schreibstein L, Rodriguez-Lopez J, Newton-Dame R. Monitoring
Prevalence, Treatment and Control of Metabolic Conditions in NYC Adults Using 2013 Primary Care Electronic Health
Records: A Surveillance Validation Study. eGEMS (Generating Evidence & Methods to improve patient outcomes): Vol 4: Iss.
1, Article 28, 2016.
Primary NYC Macroscope Publications
Romo ML, Chan PY, Lurie E, Perlman SE, Newton-Dame R, Thorpe LE, McVeigh KH. Characterizing Adults Receiving
Primary Medical Care in New York City: Implications for Using Electronic Health Records for Chronic Disease
Surveillance. Prev Chronic Dis. 2016;13:E56.
Anticipated Release – May 2017
Tatem KS, Romo ML, McVeigh KH, Chan PY, Lurie-Moroni E, Thorpe LE, Perlman SE. Comparing Prevalence Estimates in
Population-Based Surveys to Inform Chronic Disease Surveillance Using Electronic Health Records, 2013. Prev Chronic
Dis 2017;14:160516.
Under Review
McVeigh KH, Lurie-Moroni E, Chan P, Schreibstein L, Tatem K, Romo ML, Thorpe LE, Perlman SE. Generalizability of
Indicators from the New York City Macroscope Electronic Health Record Surveillance System.
Other NYC Macroscope Publications
n
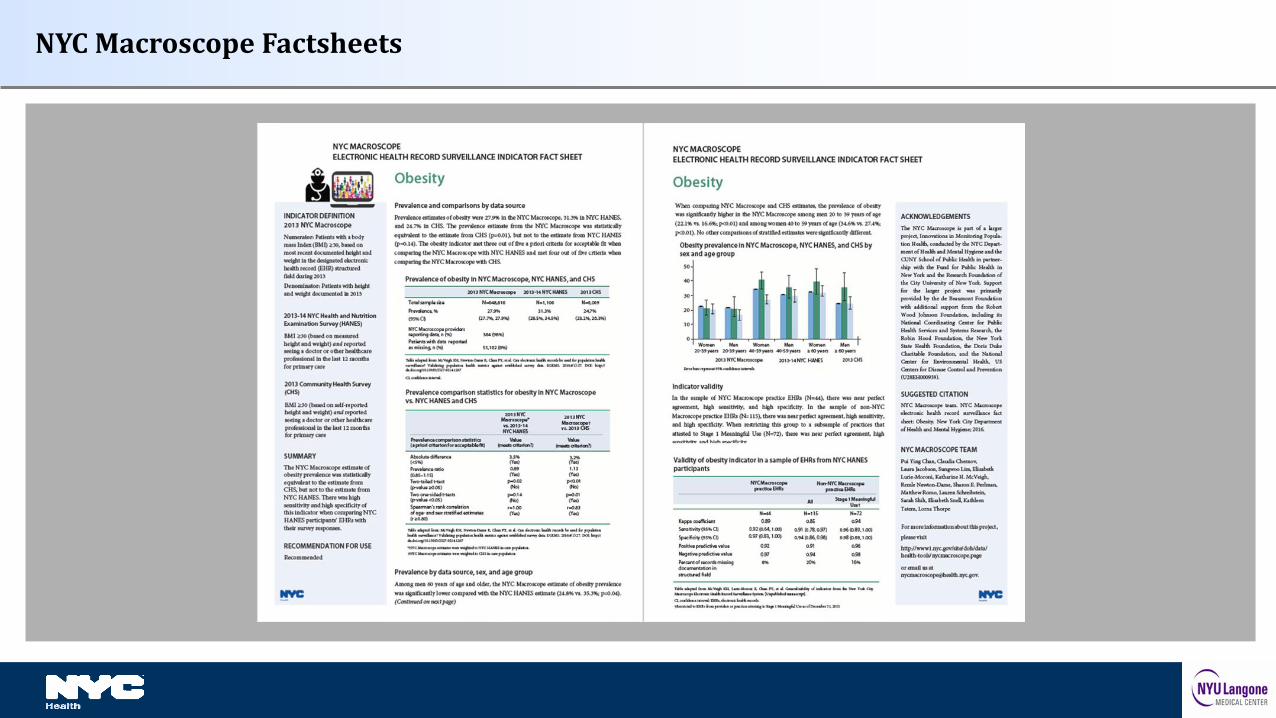
NYC Macroscope Factsheets
Contact Information
Tina McVeigh: [email protected]
Sharon Perlman: [email protected]
For more information, please visit our website
https://www1.nyc.gov/site/doh/data/health-tools/nycmacroscope.page
Thankyou!
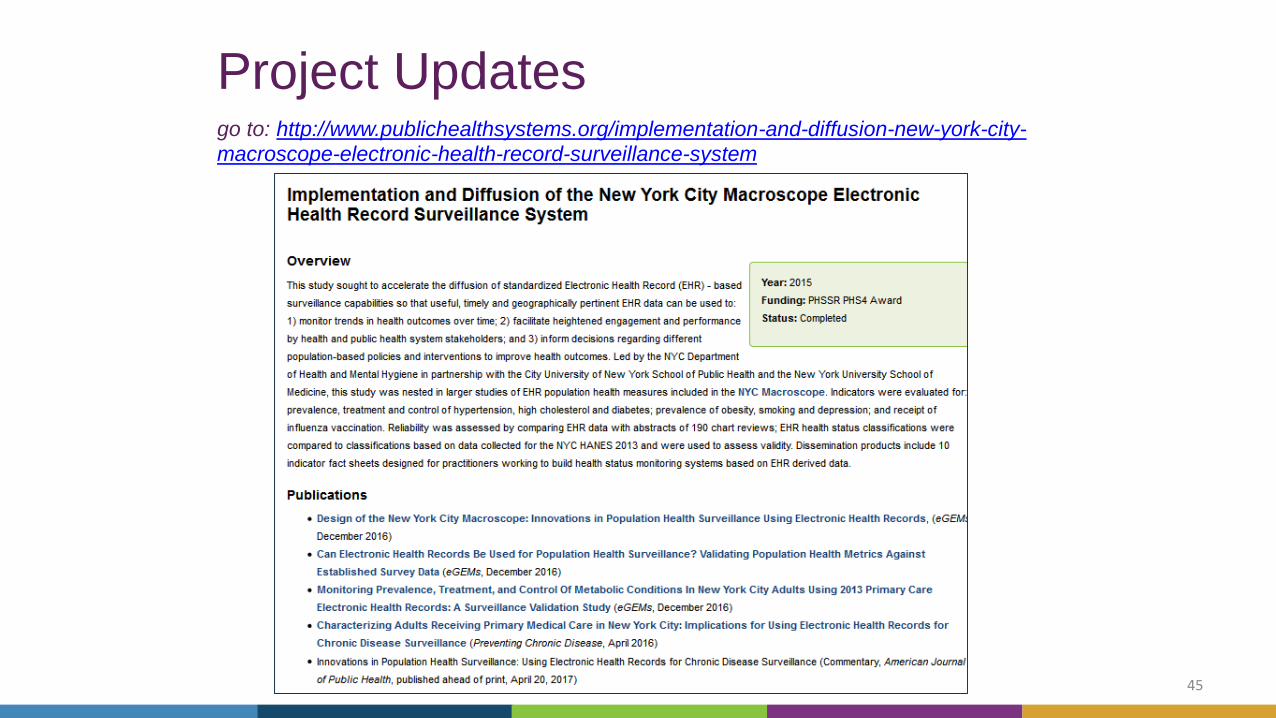
Project Updatesgo to: http://www.publichealthsystems.org/implementation-and-diffusion-new-york-city-
macroscope-electronic-health-record-surveillance-system
45

Commentary
Questions and Discussion46
Sungwoo Lim, DrPH, MA, MSDirector of Research, Evaluation & Methodology
Bureau of Epidemiology Services
New York City Department of Health and Mental Hygiene
Jenny Smolen, MPHResearch & Evaluation Data Analyst
Bureau of the Primary Care Information Project
New York City Department of Health and Mental [email protected]

Webinar Archives http://systemsforaction.org/research-progress-webinars
Upcoming WebinarsThursday, May 11, 1-2pm ET/ 10-11am PT
CROSS-JURISDICTIONAL RESOURCE SHARING AND THE SCOPE AND QUALITY OF PUBLIC HEALTH
SERVICES
Justeen Hyde, PhD, Investigator, VA Center for Healthcare Organization & Implementation Research
Debbie Humphries, PhD, MPH, Clinical Instructor in Epidemiology, Yale School of Public Health
-- a Public Health PBRN DIRECTIVE Project
Wednesday, June 14, 1-2pm ET/ 10-11am PT
CROSS-JURISDICTIONAL SHARING ARRANGEMENTS BETWEEN TRIBES AND COUNTIES FOR EMERGENCY
READINESS
Maureen Wimsatt, PhD, MSW, California Tribal Epidemiology Center, California Rural Indian Health
Board
Wednesday, June 21, 12-1pm ET/ 9-10am PT
ACCOUNTABLE COMMUNITY OF HEALTH STRUCTURES AND CROSS-SECTOR COORDINATION
Eli Kern, MPH, Public Health - Seattle and King County
47

Acknowledgements
Systems for Action is a National Program Office of the Robert
Wood Johnson Foundation
Based at the University of Kentucky in Lexington, it is a
collaboration of the:
• Center for Public Health Systems and Services Research in
the College of Public Health, and
• Center for Poverty Research in the Gatton College of
Business and Economics
Thank you for participating in today’s webinar!
www.systemsforaction.org
For more information about the webinars, contact:
Ann Kelly, Project Manager [email protected] 859.218.2317
111 Washington Avenue #201, Lexington, KY 40536
49
Twitter:
@ Systems4Action
#Sys4Act
Speaker BiosTina McVeigh is the Director of Research for the Division of Family and Child Health at the New
York City Department of Health and Mental Hygiene and the principal investigator of the NYC
Macroscope chart review study. Dr. McVeigh has a Master's degree in Public Health and a
Doctorate in measurement, evaluation and statistics, both from Columbia University, and has
worked on research and surveillance projects in the domains of maternal, infant and reproductive
health, HIV/AIDS, substance abuse, mental health, early childhood development and educational
outcomes, and the use of electronic health records for population health surveillance.
Sharon Perlman is Director of Special Projects for the Division of Epidemiology at the New York
City Department of Health and Mental Hygiene. She is co-principal investigator of the NYC Health
and Nutrition Examination Survey (NYC HANES) and a founder of the NYC Macroscope. Ms.
Perlman has a master’s degree in public health from Columbia University. Her research has focused
on chronic disease, mental health, health impact and disease modeling, and the interaction between
public health and primary care.
Sungwoo Lim is the Director of Research, Evaluation and Methodology for the Bureau of
Epidemiology Services at the New York City Department of Health and Mental Hygiene. He and his
team provide analytic support to DOHMH evaluation projects, and lead an effort to develop and
implement innovative methods to improve validity of survey and administrative data via modeling
and data matching. Dr. Lim has been using NYC Macroscope chart review study data for a variety of
new projects involving EHR estimate calibration, imputation of missing EHR data, and the creation
and validation of small area estimates from EHR data.
Jenny Smolen is a Research and Evaluation Data Analyst for the Primary Care Information Project
at the New York City Department of Health and Mental Hygiene. Jenny oversees the use of clinical
EHR data queried through the Hub Population Health System to support and evaluate internal
programs. Jenny serves as the liaison for collaborations that use Hub data, such as the NYC
Macroscope, and applies lessons learned from the Macroscope to Hub data analysis processes.
50


![Electronic Searches and Surveillance - ncids.org Training/2017SpringConf... · Electronic Searches and Surveillance “[T]he fantastic advances in the field of electronic ... the](https://img.pdfslide.net/doc/110x75/5af9e5f27f8b9a32348cfa86/electronic-searches-and-surveillance-ncids-training2017springconfelectronic.jpg)