Embed Size (px)
Citation preview

1
1
IMPLICATIONS OF AGRICULTURAL POLICY REFORMS ON RURAL FOOD
SECURITY AND POVERTY
K A S Murshid, Research Director, BIDS
SUMMARY Introduction Over the years SAP has generated considerable controversy regarding its impact on growth, employment, food security and poverty. The point of departure for this study is the impact on poverty and food security as a result of the various structural adjustment policies undertaken in the agricultural sector. In this context three broad areas of investigation were identified: • A review of SAPs in agriculture • Macro level trends in performance of the agriculture and food sector • Changes over time in the conditions of access to food, especially of the poor • An assessment of the link between the SAPs and changes in food security Methodology Taking clue from the SAPRI methodological guidelines an attempt was made to combine participatory methods with a more orthodox approach. The first task was to make an assessment of economic change. This was attempted in two ways: • An examination of macro (national) data on e.g. food availability, consumption,
wages and employment, to establish basic national level trends. Household expenditure surveys carried out in different years as well as labour market data from the Bangladesh Bureau of Statistics (BBS) have been used for the purpose.
• An in depth investigation of micro (household) panel data on rural households at two
points in time, namely 1988-89 (roughly corresponding to the initial years of SAP) and 1999-2000 (by which time most of the SAPs have been implemented). The sample size consisted of 50 rural households drawn from two green revolution villages in Bogra in the Northwest of the country.
The household panel data enabled detailed comparisons in living standards and livelihood conditions for the same set of households over a span of more than ten years. These changes are related to complex forces. There are, thus, considerable difficulties in trying to isolate the impact of the various SAPs on food security or poverty. A participatory approach combined with a logframe analysis was attempted in this connection. Sector-specific SAPs • Withdrawal/reduction of input subsidies (e.g. fertilizers) • Privatization of the fertilizer distribution system

2
2
• Withdrawal of ban on private sector imports of irrigation equipment in the late 1980s • Withdrawal of ban on rice/foodgrain imports by the private sector in 1995 • Rolling back of BADC - The largest parastatal in the agricultural sector - phased out
its operations from 1978, gradually from fertilizers (imports, sale, distribution), irrigation and seeds.
• Reform of the Public Food Distribution System in the 1980s - rural rationing was abandoned and there was a policy shift towards distribution through safety-nets (FFW, VGD). Subsidized sales from the PFDS have dwindled; stabilization operations like OMS were retained.
• Seed markets - the National Seed Policy, 1992 provided for privatization of seed production beyond the foundation stage; the GOB monopoly on five 'notified' crops have been retained (including rice).
Findings/Observations • The national food security regime improved significantly as a result of good
agricultural performance, removal of restrictions on food imports by the private sector and enhanced macro-economic stability, including a low inflation rate.
• At the micro level, access to food improved significantly (especially of the poor)
through growth in non-farm income, availability of credit, improved access to the land market and employment demand:
• Two serious types of market failures were observed:
(a) related to the inability of the market to ensure that farmers have access to adequate information about the quality of agricultural inputs like fertilizers and machinery;
(b) the inability of the market to take into account the substantial negative impacts on the environment, especially on soil, surface and ground water.
Overall food security and poverty has undoubtedly improved in Bangladesh in recent years (helped along by SAPs). Specifically, input liberalization (particularly for irrigation) has had a very significant impact in promoting the impetus of the Green Revolution. Liberalization of the government monopoly of the fertilizer distribution system and withdrawal of price subsidy has had mixed effects, although the overall situation, may have marked a slight improvement. On the output side, import liberalization of rice and wheat has had very major food-security impact enabling large foodgrain imports from India in recent years in record time, in the face of widespread domestic shortages. The other major dimension of SAP has been the restructuring of the Public Food Distribution System, which again has led to elimination of a wide range of subsidies and much superior targeting. Expansion of programs like Vulnerable Group Development (VGD) for poor female-headed households, Food for Works (FFW) to provide seasonal employment to both poor men and women, Rural Maintenance Programme (RMP) and Food for Education (FFW), for example, have had important food security impacts (see Choudhury and Ninno, 1998; Choudhury and Sen, 1997; Ninno and Roy, 1999).

3
3
Two serious types of market failures were observed:
• the inability of the market to ensure that farmers have access to adequate
information about the quality of agricultural inputs like fertilizers and machinery;
• the inability of the market to take into account the substantial negative impacts on the
environment, especially on soil, surface and ground water.

4
4
1. INTRODUCTION
SAPRI (Bangladesh) is a joint project of the government, the World Bank and a global
network of civil society organizations. Its goals are to improve the understanding of the
impact of adjustment policies and to seek ways of incorporating the participation of civil
society in future policy formulation. Bangladesh is one of eight countries where this
initiative has been launched.
Policy reforms (which subsequently came to be known as SAPs) began tentatively in the
early 1980s although not really taking off before the mid-1980s, in the wake of policy
based sectoral lending of the World Bank and contracts signed with IMF to enable
access to its Structural Adjustment (SAF) facility.
Over the years SAP has generated considerable controversy regarding its impact on
growth, employment, food security and poverty. Many studies, particularly in the context
of a number of sub-Saharan countries appeared to suggest that much of the impact has
either been small or even negative while the experience of many Asian countries appear
to have been much more mixed. It is in this context that SAPRI has been designed -
primarily as a major stock taking exercise to gain an insight into successes and failures,
and to draw lessons for future policy.
A criticism that has consistently been directed at the SAPs relates to the manner in
which policies have been set, implying that much of the time these have come from
above (i.e. powerful donors) and that there has been inadequate consultation with all
stakeholders. In general, there was no effort made to take on board the views and
concerns of poor people, women, small enterprises and so on - groups on whom the
impact of SAPs may have been especially hard. Part of the reason for this is of course
the absence of institutions or mechanisms (in addition to the lack of awareness) to
enable such an exercise(s) to be conducted in developing policy alternatives.

5
5
The point of departure for this study is the impact on poverty and food security1 as a
result of the various structural adjustment policies undertaken in the agricultural sector.
In this context three broad areas of investigation have been identified:
• A review of SAPs in agriculture
• Macro level trends in performance of the agriculture and food sector
• Changes over time in the conditions of access to food, especially of the poor2
• An assessment of the link between the SAPs and changes in food security
2 THEORETICAL CONSIDERATIONS
There are two distinct aspects of food security: food availability and food access. The
former primarily refers to a geographical space (e.g. the nation, a district or a Thana)
while the focus of the latter is on the individual and the household. It is clear that both
are important for food security and that the two need not always reinforce each other. In
fact a growing concern in countries like Bangladesh has been with the question of
access, and in particular whether better national level food availability was progressing
hand in hand with micro level access.
SAPs are likely to have a close bearing on both conditions of availability and of access.
For example, policies that contribute towards cheaper food imports or higher domestic
food production directly improve conditions of availability. To the extent that policies
affect incomes and asset-holdings of the poor, these also affect their access or food
entitlements. Policies that have an impact upon aggregate availability include macro
policies (e.g. the exchange rate and trade liberalization policies) as well as sectoral
policies that improve production incentives at the farm level (cheaper inputs, better
output prices). Policies that have a bearing on access on the other hand, include reforms
of the Public Food Distribution System and farm price support and credit policies. There
may also be quite significant indirect effects of the various reforms on access, primarily
1 Food security and poverty are major areas of focus for the Government of Bangladesh as well as donors. Major multilateral donors like the World Bank and the ADB have already identified these as over-arching concerns while many bilateral donors have (e.g. USAID) also followed suit (Murshid, 1998). 2 Including changes in labour market conditins and wages.

6
6
acting through changes in the land and labour markets. These linkages are
schematically outlined in Figure 1.
3 METHODOLOGICAL NOTES
Taking clue from the SAPRI methodological guidelines an attempt has been made to
combine participatory methods with a more orthodox approach. The first task is to make
an assessment of economic change, which was attempted in two ways:
• An examination of macro (national) data on e.g. food availability, consumption,
wages and employment, to establish basic national level trends. Household
expenditure surveys carried out in different years as well as labour market data from
the Bangladesh Bureau of Statistics (BBS) have been used for the purpose.
• An in depth investigation of micro (household) panel data on rural households at two
points in time, namely 1988-89 (roughly corresponding to the initial years of SAP)
and 1999-2000 (by which time most of the SAPs have been implemented).3 The
sample size consists of 50 rural households drawn from two green revolution villages
in Bogra in the Northwest of the country. The data includes information on production
conditions, consumption, land, labour and credit markets as well as access to safety
nets.
3 Data for 1988-89 is available from the BIDS-Open University research on foodgrain markets carried out in eight villages. The data for 1999-2000 was purposively generated for this study.

7
7
Figure 1
• Trade Liberalization (cheaper food; cheaper inputs) • Withdrawal of input subsidies • Privatization of fertilizer distribution • Elimination of rural rationing • Safety nets • Agricultural credit policies
• Agricultural inputs • Foodgrains • Credit • Labour • Land/tenancy market
STRUCTURAL ADJUSTMENT POLICIES
MARKETS Supply
Demand Terms (prices)
FOOD SECURITY

8
8
The macro data serves to provide the contextual background within which the results of
the micro panel data can be viewed. It is also useful to relate the findings of the micro
investigation (from a restricted sample) to the macro data to check whether broad trends
between the two are consistent or diverge greatly.
The household panel data has enabled detailed comparisons in living standards and
livelihood conditions for the same set of households over a span of more than ten years.
These changes, however, are likely to be related to complex forces - both SAPs as well
as non-SAP or independent factors, including life-cycle changes, weather and political
conditions, micro-credit interventions and rural infrastructure (roads and electrification).
There are thus considerable difficulties in trying to isolate the impact of the various SAPs
on food security or poverty. A participatory approach has been attempted in this
connection: In-depth discussion with groups of villagers using focus-group discussion
(FGD) techniques, in which each policy reform was taken up for detailed discussion and
an attempt made to assess causality and magnitude of impact;4
It was agreed early on in the methodological workshop that ".. investigation will use a
range of methods, but particularly those that the Bank has not traditionally used (e.g.
participatory).."5 sic . The main challenge is that of establishing a clear causality between
SAP and food security in a context of change driven by complex forces. If this challenge
has been even partly addressed, we would consider this exercise to have been
successful.
4 Where SAPs resulted in specific changes in input/output supply or prices, or led to easily identifiable outcomes (like introduction of safety nets), such an exercise proved productive. More general, economy -wide SAPs (like exchange rate changes) proved much more difficult to handle through such a participatory methodology. 5 See TOR, p.3.

9
9
4 STRUCTURAL ADJUSTMENT POLICIES (SAPS)
Macro and Sectoral Policy Regime Facing Agriculture Bangladesh has made substantial progress towards trade liberalization and macro-
economic adjustment policies, including rationalization of policies relating to agricultural
price support and input subsidies. These have significant implications for food production
and food security.
• Exchange rate policies - generally the Bangladesh currency has been edged towards
its equilibrium rate of exchange, making agricultural imports (inputs, food) more
expensive and exports cheaper (Forhad, 1998). More expensive inputs could slow
technological change while cheaper exports makes agriculture more competitive.
• Trade liberalization policies - reduction of tariffs and removal of quantity restrictions
have occurred across the board and has had a profound impact on agricultural input
imports and food security (the latter through private rice imports in the face of
shortages and the former through expanded irrigation coverage). Liberalization of
imports of irrigation equipment took place in the late 1980s while the ban on rice
imports by the private sector was lifted in 1994.6
• Monetary/Credit policies - official credit disbursed to agriculture has declined in the
face of strong donor criticism against poor recovery rates and frequent loan
forgiveness. The NGO sector has traditionally shied away from agricultural credit for
want of an effective institutional model of agricultural credit delivery.
Sector-specific SAPs
• Withdrawal/reduction of input subsidies (e.g. fertilizers) - this affected only locally
produced urea fertilizers, tending to raise its price. Other things remaining constant,
this would tend to lower usage and therefore yields.
• Privatization of the fertilizer distribution system - the fertilizer distribution system went
through major reforms in the late 80s-early 90s when the monopoly role of the BADC
was removed from wholesale trade and fertilizer distribution; non-urea imports were
also opened up to private imports and distribution. There was some reversal of policy
after the crisis of 1994-95, with the introduction of a system of distribution through

10
10
authorized (licensed) dealers operating within their own districts (and selected by a
National Coordination Committee). Policy reforms related to the fertiliser sector have
been the most challenging, commencing as early as 1978 (when the BADC first
began to withdraw from sales/distribution at the local level) to 1994-95 when, as
already noted, some policy reversals took place.7 It has also been observed that
while liberalization of the distribution system has improved availability, prices have
tended to be more volatile, especially for urea - an indication of monopoly elements
even in the new distributional arrangements (Shahabuddin and Rahman, 1998).
• Withdrawal of ban on private sector imports of irrigation equipment in the late 1980s -
this led to a surge of imports of irrigation equipment in the late eighties-early nineties
and a spurt of growth in the crop sector.
• Withdrawal of ban on rice/foodgrain imports by the private sector in 1995 - the
private sector has moved quickly and aggressively to this sector. In 1998-99, more
than 3 m MT of rice was imported from India privately.
• Rolling back of BADC - The largest parastatal in the agricultural sector - phased out
its operations from 1978, gradually from fertilizers (imports, sale, distribution),
irrigation and seeds.
• Reform of the Public Food Distribution System in the 1980s - rural rationing was
abandoned and there was a policy shift towards distribution through safety-nets
(FFW, VGD). Subsidized sales from the PFDS have dwindled; stabilization
operations like OMS have been retained.
• Seed markets - the National Seed Policy, 1992 provided for privatization of seed
production beyond the foundation stage; the GOB monopoly on five 'notified' crops
have been retained (including rice).
Given the fact that the 'relevant' SAPs are diverse and have been implemented over a
long period of time (early 1980s to mid-90s), often marked by fits and starts, and
sometimes characterized by policy reversals, a neat one-to-one cause and effect type
exercise would be very difficult to construct.8 A multi-modal approach is therefore
suggested, including use of orthodox techniques and use of participatory methods.
6 For a discussion of these impacts see Abdullah (1989) and Dorosh (1999). 7 For details see Zohir (2000). 8 See Appendix 1 for a more detailed review of SAPs.

11
11
Experience With Saps – Lessons Learnt An examination of an important World Bank document (World Bank 1993) serves to
highlight the issues related to successful SAP implementation. The more important ones
underscored include –
(a) The need for a strong political will, broad consensus and unwavering
commitment on the part of policy makers;
(b) Internalization of policy formulation rather than being driven by external leverage;
(c) Inertia and tentativeness on the part of the government, adoption of fitful
measures;
(d) Resistance from entrenched bureaucracies, especially in the context of
institutional reforms;
(e) Commissioning and review of studies supposed to provide inputs into the SAP
process are often deliberately delayed as a dilatory tactic.
With hindsight, it must be said that the reforms related to agriculture fared relatively
better than that of most other sectors – with the possible exception of the macro reforms.
Is it the case that there was greater political will or commitment for agricultural sector
reforms or that these originated internally from within the government? A more plausible
explanation relates to the level of donor pressure on the one hand and the ease with
which the government could 'sell' these to its different constituencies – including the
bureaucracy, the farmers, the academics and the opposition political parties. Clearly
where the government itself was inherently satisfied with the logic and the need for a
particular reform measure it would try that much harder to overcome the resistance from
different vested groups. Some reform measures entailed less resistance – e.g.
liberalization of irrigation equipment imports and rationalization of the PFDS to make it
more pro-poor. On the other hand withdrawal of input subsidies and proposals for
restructuring the BADC met with stiff resistance. In the case of the former, the
government was worried that this would be used as a political tool by the opposition
while in the case of the latter, the BADC itself lobbied strongly against it with a helping
hand from the 'entrenched' bureaucracy. The resistance against subsidy withdrawal (e.g.
from fertilizers) diminished only after other costs of production, especially irrigation costs
were brought down by irrigation sector reforms. Another area of heated debate was
12
12
privatization of the fertilizer distribution system which had been a monopoly of the
BADC. Implementation of this policy again, took a lot of effort involving persuasion,
studies and donor conditionalities before the government was convinced of its
desirability.
The pattern that emerges is that some reforms are relatively painless and easy to
conduct. Others are much more difficult, mainly due to strong vested interests, lobbies
and pressure groups, as well as political sensitivity. Perhaps the most important reason
why the agricultural reforms performed better was that the farmers as a group are not
well organized and are less well equipped to resist policy changes, compared to public
sector corporations or financial institutions with strong, vocal trade unions. Since no
major policy reform was internally generated, it must be assumed that external pressure
was the dominant if not the only reason why the government took these up. In some
cases, the government can have serious reservations or inhibitions about some policies.
A good example relates to the seed sector, e.g. regarding introduction of hybrids or
removing government controls like certification. In such cases the way to change is
dependent on being effectively able to allay fears and enable a change of hearts and
minds rather than for example, overcoming resistance from vested quarters.

13
13
5 AGRICULTURAL PERFORMANCE AND TRENDS
The abiding image of rural Bangladesh is one of stagnating socio-economic conditions
encumbered by a set of traditional values and institutions that thwart rapid development,
in the face of a high population growth rate, a rising land-constraint and acute poverty.
However, even a cursory glance at the Bangladesh economy suggests that important
structural changes are taking place and need explanation and interpretation. Thus, the
importance of agriculture has diminished significantly over the last two decades, with its
contribution to GDP falling to around 30 percent from earlier levels of around 50 percent,
in the 1970s. On the other hand, sectors like industry and services have become more
prominent. Again, the sub-sectoral composition of agriculture and the rural economy are
themselves being transformed, with the declining contribution of the crop sector, a sharp
rise in the importance of fisheries and livestock sectors, as well as in non-farm rural
activity. These trends beg the question of whether these reflect fundamental shifts in the
economy along classical lines of development exhibited by more advanced countries in
their earlier stages of growth.
Considerable progress has been made in the last two decades in raising agricultural
growth rates, especially over 1985-2000 resulting in a sharp up-turn of production,
heavily concentrated in foodgrains. Cropping intensity increased to over 175 percent
from 142 percent in 1970 while growth in the fisheries and livestock sub-sectors showed
a healthy trend at around 3.5-4.0 percent.
Foodgrain Sector Performance
Bangladesh achieved major gains in rice and wheat production in the 1970s and 1980s -
mainly a result of the spread of irrigation, fertilizer use and adoption of improved seeds.
Between 1980-90, rice output increased by 40 percent, falling off again in subsequent
years before picking up speed once again in the mid - 1990s (Table 1).

14
14
Table 1: Agricultural Performance, 1973-98
Sector 1997-98 to
1998-99
1995-96 to
1998-99
1990-91 to
1998-99
1973-74 to
1998-99
Agriculture 5.0 4.8 2.7 2.6
Crops 4.3 4.0 1.4 1.7
Forestry 4.1 4.2 3.8 3.8
Livestock 7.6 7.8 7.2 5.2
Fisheries 8.0 8.4 7.8 2.3
Non-agr 5.2 5.9 6.2 6.0
Source: BBS data compiled in Hossain (2000).
Three major factors accounted for the rapid growth of the 1980s: (a) improvements in
irrigation, and in particular the rapid expansion of shallow tube-wells that allowed rapid
expansion in Boro area, (b) complementary input use, especially improved seeds and
fertilizers, and c) appropriate market reforms that dramatically lowered costs. These
areas of reforms include removal of tariffs on the imports of irrigation equipment and
removal of the BADC monopoly on fertilizer imports, sale and distribution - roles that
were privatized. The principal factors explaining the rapid growth of the late -1980s were
undoubtedly the policy reforms and the resultant incentive regime that led to adoption of
modern cultural practices.
The slowdown in production in the early 1990s was reminiscent of the debate of the
early 1980s and begged the question of how this could be overcome. The moot question
then was whether there remained any further scope for policy reforms that could lead to
a second round of growth. In practice, the reality overtook the rhetoric and the experts
were confronted with successive bumper crops over the latter half of the 1990s. The
phenomenon remains to be adequately explained. The conclusion that seems to be
currently gaining ground is that while further growth in the foodgrain sector is possible, it
will increasingly have to confront and overcome challenges relating to greater and more
efficient use of resources (inputs, irrigation capacity). In the light of a growing demand
constraint, lack of export markets and declining real rice prices, the challenge is to shift
resources out of foodgrains to non -foodgrain crops and to the non-crop sector. Unlike
the earlier spurt in foodgrain production, this latest shift in the production frontier cannot
readily be explained in terms of policy reforms
15
15
Minor Crops and Cash Crops
Given the increasing difficulties likely to be entailed in sustaining rapid growth in
foodgrains (as well as a distinct shift in demand towards other foods and non-food
goods) in the wake of economic growth, the demand for minor crops would seem to be
excellent. There however, seems to be 'structural' constraints that prevent the potential
of the minor crops from being realized: technology, marketing, storage, transport and
credit. Decades of policy focus on rice and foodgrains has had a negative impact on a
host of non-rice crops - production and acreage declined for pulses and oilseeds, jute,
tobacco and sweet potatoes, while fruits and vegetables (including potatoes) have
performed slightly better (Hossain 2000).
Fisheries
The fisheries sector is very important for Bangladesh and despite its modest contribution
to GDP (3.3 percent), its growth rate has been spectacular (Table 2). It accounts for 11
percent of export earnings and 5 percent of employment. However, part-time seasonal
and subsistence fisher-folk number around 11 million. In addition there are pond owners,
processors and traders that could account for another 4-6 million people - so that
altogether, the employment impact is not small. Nutritionally speaking, fish is the second
most important food in the local diet after rice.
Livestock
Livestock and poultry production has grown rapidly with recent trends suggesting rates
of growth well above 7 percent. This sector has received a lot of attention from NGOs, in
the form of credit, skill-development and technology, and is an important source of
supplementary incomes and earnings for the rural poor.
Structural Change
In a recent paper, Hossain (2000) highlighted the nature of the structural transformation
that seems to have taken place in the agricultural sector. Thus, as a share of agricultural
value-added and incomes, the contribution of the crop sector has dwindled from 80

16
16
percent in the 1970s to around 70 percent in the late 1980s and further down to around
58 percent in the late 1990s. Conversely, the shares attributable to fisheries in particular
but also to livestocks has registered a sharp rise, particularly in the 1980s and 1990s.
(Table 2).
Table 2: Structural Change in Agriculture (Percent of Agricultural
Incomes)
1973-74 1989-90 1998-99 Annual gr. rate
Crops 80.0 71.5 47.0 1.7
Forestry 4.2 9.8 11.8 3.2
Livestock 7.6 9.3 19.9 5.0
Fisheries 8.2 9.5 21.3 3.5
Total 100 100 100 2.8
Source: BBS data compiled in Hossain (2000).

17
17
6 CHANGES IN FOOD SECURITY - THE MACRO EVIDENCE
Significant progress achieved in rice production has led to a situation when the country
is self-sufficient in food during years of normal weather (World Bank, 1998). In addition
import liberalization (of rice and wheat) has introduced another positive dimension
towards strengthening food security. The private sector has demonstrated its readiness
and efficiency in channeling a large volume of imports in the shortest possible time. This
was clearly demonstrated during the floods of 1998-99 when more than 3m MT of rice
was imported by the private sector, mainly from India, helping to stabilize supply and
prices. It was lucky of course that Indian rice production was excellent, making it easy for
India to liberalize rice export restrictions that were in place.9 Improvement in the food
security situation is also suggested by other available evidence, to which we now turn.
Food Consumption and Poverty
Data from the Household Expenditure Surveys carried out by the Bangladesh Bureau of
Statistics for different years provide data on food consumption and calories in addition to
information on incomes and expenditures by income-expenditure groups and land-
ownership categories. Table 3 below shows that cereal (and rice) consumption
increased steadily over the eighties, peaking off in 1991-92. A slight decrease in cereal
consumption may be noted in 1995-96 which could imply a tendency towards
substitution of more high-value, non-cereal foods. In fact, it will be observed that while
overall calorie intake has risen slowly, there has been a significant change in the
composition of the food consumption basket. Consumption of potatoes, vegetable, milk,
fish and fruits have increased steadily while oil and meat consumption has remained
steady and intake of pulses has declined. On the whole, these shifts mark a better and
more balanced diet. An examination of the disaggregated data suggests that these
broad changes can be seen even among the poorer rural groups (Table 4). The
evidence from the HES thus seems to point to a superior food security regime in the
1990s compared to the 1980s. The figures shown in Table 5 lends further support by
showing an improvement (in real terms) in expenditure levels (and by implication,
incomes).
9 There is some suggestion that rice production in Bangladesh and India are not closely correlated. If this is so then this is good for Bangladesh's food security (Dorosh, 1999).

18
18
Table 3: Daily per capita Consumption of Food (grams), Selected Periods 1983-84 1988-89 1991-92 1995-96 Cereals Rice
464 409
514 449
523 482
522 479
Potato 33 37 41 47 Vegetable 124 131 135 154 Pulses 28 21 17 13 Milk 16 21 19 30 Oils 4.7 9.0 9.1 8.4 Meat 12.3 11.6 11.3 12.0 Fish 27.1 32.5 32.5 42.2 Fruits 15.4 12.4 15.9 25.3 Total Calories 2112 2217 2268 2263 Note: Based on Household Expenditure Surveys (BBS), various years. Table 4: Per Capita Consumption of Major Food Items (kg.) - Bottom 50 percent of Households Item 1991-92 1995-96 Cereals 12.58 12.32 Fish .53 .709 Pulses .34 .234 Meat .134 .143 Fruit .237 .268 Milk .169 .332 Vegetable 4.0 4.93 Note: Based on HES 1991-92 and HES 1995-96. While all land-owning groups have registered an improvement, the 'absolute landless'
have improved the most, followed by the two richest land-owning groups. The increase
in the Gini inequality index during this period is related to the relatively weaker
performance of the middle land-owning groups.10
10 In addition, the Gini index tends to assign a higher weight to the middle ranges compared to the extremes - a characteristic that has led to a higher index despite substantial improvement of the landless.

19
19
Table 5: Change in Monthly Household Expenditures, 1991/92-1995/96 Taka/hh per month
(1991-92 prices) 1995-96
1991-92
Change (%) (constant prices)
Landless 2036 1511 41.1 .01-.04 1715 1618 7.2 .05-.49 2283 2157 7.0 .5-1.49 2918 2738 7.9 .51.5-2.49 3538 3487 1.8 2.5-7.49 4862 4185 19.4 7.5 + 8317 6915 24.3 All 2894 2721 7.6 Gini ratio .384 .364 Note: 1995-96 prices were deflated by the CPI for Rajshahi (which increased faster than those for the other three regions for which the CPI was available).
Given the macro trends noted above it would be logical to expect a decline in poverty.
Indeed, progress has been made even if its extent is somewhat controversial, especially
over the latter half of the 1990s (Table 6). Comparisons between the early 1980s and
mid-1990s show a decline in the headcount ratio as well as in indices like the poverty
gap index and its square. The improvement has been especially marked for the urban
areas, while the situation in the 1990s has been one of stagnation - the small
improvement suggested by the figures is likely to be statistically insignificant. The year to
year (short-term) variability is relatively large, making it difficult to assess small changes
in poverty estimates - specifically whether these can be attributed to trends over time.
Neverthless, it is clear that that there has been a significant impact on poverty reduction
over the main SAP period.11
Labour Market Conditions
The labour market has been quietly changing in several ways. Households selling
agricultural labour have declined from 22.6 percent to 16.9 percent between 1983-84
and 1995-96. There has been a shift out of agriculture to non-farm employment and self-
employment, as well as greater out-migration to towns. In particular there has been a
11 It has been observed however, that the rate of decline in poverty in the 1980s and 1990s has been slower than the preceding period (Khan, A.R., 2000).

20
20
huge expansion in employment (mostly self-employment) in the trade and transport
sector with the expansion of roads and better communication. The number of rural
households reporting ownership of rickshaws and rickshaw vans, for example, increased
from 55,000 to around 500,000 over 1983-84 to 1995-96 (Hossain, 2000).
Table 6: Some Estimates of Poverty, Selected Years
Head-count
Urban Rural
Poverty Gap
Urban Rural
Squared Poverty Gap
Urban Rural
Gini Ratio
Urban Rural
Est. A
1983-84 40.9 53.8 11.4 15.0 4.4 5.9 .298 .246
1985-86 30.8 45.9 7.3 10.9 2.5 3.6 .314 .246
1988-89 35.9 49.7 8.7 13.1 2.8 4.8 .326 .265
1991-92 33.6 52.9 8.4 14.6 2.8 5.6 .319 .255
1995-96 26.3 51.1 6.0 14.1 1.9 5.5 .367 .288
Est. B Poor (%) Very Poor (%)
1981 73.2 50.1
1986 51.7 21.7
1990 47.5 28.0
1994 46.0 -
Source: BIDS (1999); World Bank (1998).
Sectoral wage indices for agriculture and fisheries along with wage data of unskilled
agricultural workers are shown below (Table 7). The daily agricultural wage rate reported
by BBS shows a relatively small increase over 1987-88 to 1996-97, suggesting a fall in
real wages. It will be seen nevertheless that the real wage rate for Bogra (an important
green revolution area - and an area for which micro panel data was generated for this
study) has managed to keep pace with the rate of inflation.12
If we look at the sector -specific wage indices for agriculture and fisheries, we note a
substantial increase in the former, relative to the CPI. There is some ambiguity in the
wage data and the wage-index although it is quite clear that the green revolution belt, at
any rate, is likely to have witnessed rising real wages. The demand for hired labour is
higher in irrigated areas. One study estimates the differential impact on hired labour
between irrigated and non-irrigated areas at 68 percent, although its total impact on

21
21
employment (including self-employment) is ambigous. (Shahabuddin and Rahman,
1998). A review of different micro estimates of under-employment reveals however that
this has tended to decline over time.13 Again, a comparison of wage rates between
irrigated and non-irrigated areas brings out a clear wage differential ranging between 14-
30 percent. It would thus be reasonable to conclude that modern cultivation practices do
have a favourable impact on the labour market (employment and wages). These may
not be enough, however, to counteract countervailing forces, e.g. inter-regional labour
mobility for cross-section analysis or increase in labour supply over time to significantly
affect overall employment and wages for the country as a whole (Shahabuddin and
Rahman, 1998).
Land Tenure
The land tenure situation has also undergone substantial changes. The proportion of
cultivated area under tenancy has increased between 1983-84 and 1996 (the last two
periods for which relevant data is available) from 17 percent to 22 percent. Even more
significantly, the share of the poorer land-owning groups has increased. Thus the share
of 'marginal farms' increased from 3 to 5 percent while that of 'small farms' increased
from 26 to 37 percent (Hossain, 2000).
Another striking change in the tenurial situation relates to the type of contract that is now
becoming popular. The traditional 50-50 share system is on the decline and is being
rapidly replaced by fixed-rent (cash) contracts, especially where HYV-irrigation is
involved. Thus share tenancy has declined from 74 percent in 1983-84 to 62 percent in
1996 while fixed-rent contracts have risen (Table 8). The fixed-rent contracts allow the
tenants sufficient incentive to invest in modern farming methods allowing them to reap
the fruits of their investment. The traditional share-cropping system, however, is still
favoured under (more risky) rain-fed conditions.
12 Bogra wage rate increased in nominal terms by 55% while the relevant CPI (Rajshahi) increased by 52 %. 13 Thus Shahabuddin and Rahman (1998, p.133) point out: " ..the downward trend in the percentage of unemployment is quite clear and pronounced".

22
22
Table 7: Rural Wages and Inflation Daily agr. wage rate
(Tk/day, without food) BD Bogra
Agr. Sector wage index 1969-70=100
Fisheries sector wage index 1969-70=100
1987-88 32.3 25.3 1049 1189 1988-89 31.9 24.9 1115 1225 1989-90 30.3 25.5 1245 1403 1990-91 31.4 24.8 1321 1452 199192 31.2 25.1 1425 1547 1992-93 33.3 27.4 1523 1641 1993-94 34.6 28.9 1593 1699 1994-95 34.9 32.5 1653 1770 1995-96 35.7 37.0 1738 1882 1996-97 37.3 38.8 1804 - Change over period (%)
16.5 55.2 72.0 58.3
Change in CPI (National)
48.8
Change in CPI (Rajshai, Middle Income)
52.1
Change in CPI (Ind. Workers, N'ganj)
48.3
Table 8: Changes in Land Tenure Indicators 1983-84 1996 Owner farms ('000) Average size of owner farm (ha) Tenant farms ('000) Average size of tenant holdings (ha) Land rented-in ('000 ha) Percent of operated holdings under tenancy Traditional share-in area ('ooo ha) Area under fixed rent ('000 ha)
6239 0.86 3730 1.02 1541 16.8 1140 400
7250 0.65 4548 0.76 1837 21.6 1093 672
Number of farm holdings ('000 ha) Operated area ('000 ha)
9969 9180
11797 8181

23
23
The above review of macro trends in food consumption, poverty, land-tenancy and
labour markets reveals important changes between the 1980s and 1990s in terms of a
more congenial food security regime. The diet has become more balanced, poverty has
declined, the tenancy and labour markets, have moved in the right direction while rural
non-farm incomes have made very important strides. The next section looks at some
micro evidence to check for signs of a possible macro-micro mismatch.
7 HOUSEHOLD FOOD SECURITY: THE MICRO EVIDENCE
Sample Characteristics
Table 9 reports basic socio-economic data for the two periods. A number of interesting
points emerge:
• The average age of the head of household has increased - as expected
• The average education level of the head has declined (as well as that of his wife)
• There has been a significant drop in labour market involvement of the head. The
incidence of second and third occupation has declined dramatically
• The average education of male children has declined over time, and their position
compared to female children has worsened significantly
• The family size has decreased (from 5.94 to 4.86)
• There are more males in 2000 compared to 1989
• Land ownership per household has declined but has remained static in per capita
terms
• Wage rates have roughly doubled but the price of paddy at harvest increased slowly
by only around 25 percent.

24
24
Table 9: Selected Sample Characteristics
Characteristic 1988 2000
HH Head
Age 40.9 46.3
Education 5.1 3.42
Main occupation Owner cultivator (45%)
Labour & Transport (40.6)
Owner cultivator (54%)
Labour & trans (24%)
Second Occupation Reported by 63%
Sharecropper
Labour/ Transpt
Reported by 30%
Sharecropper
Labour/Transpt
Third Occupation Sharecropper (50%)
(reported by 20% of hhs)
None reported
Wife of HH Head
Age 33.7 36.9
Education 3.54 2.15
HH
Education (children 5-15, m) 4.15 3.48
Education (children, 5-15, f) 3.27 3.75
Family size 5.94 4.86
Gender ratio -m/f 51.1:48.9 52.3:46.9
Land owned
- Polipara
- Volta
2.63
0.82
2.10
0.75
Per capita land 0.29 0.29
Wage rate Tk 15-20 plus 3 meals Tk. 40-50 plus 3 meals
Rice price (received) Tk. 190-220 (Dec-Jan) Tk. 240-60 (Dec-Jan)
Food Consumption: 1988-89
We are able to examine food consumption in 1988-89 in some detail given that we have
15 periodic observations available for each household for this period. We are also able
to compare the data for January 1988 with that of January 2000. Average consumption

25
25
of rice and other foods is reported in table below, for the period 1988-89, by socio-
economic categories. Table 11 reports the same data for the post-harvest period of
January 1988.
What is immediately striking is the considerable variation in rice consumption by socio-
economic groups for 1988-89, with the non-farm labour group at the bottom of the pile.
On the other hand rice consumption is virtually evened out during the post harvest
period (with the farm labour group consuming the most) - see also graphs 1 and 2. In
part this is likely to be 'compensatory consumption' but in addition it could be due to
meals provided to farm labourers as part of payment and the additional calorie
requirement because of hard physical work involved. The basic point however is that
excessive variation in rice consumption across groups and over seasons is an indication
of food insecurity (since rice is the main staple). The tables below suggest that such
insecurity was significant in the late 1980s.
Table 10: Food Consumption (kg) per Adult Unit; 1988-89
.03 .04 .05 .02 .04 .04 .05 .04
.00 .01 .01 .01 .01 .02 .02 .01
.02 .05 .04 .08 .07 .04 .07 .06
.00 .01 .01 .01 .01 .01 .01 .01
.52 .51 .52 .55 .56 .56 .62 .56
.22 .20 .19 .23 .22 .19 .25 .22
.02 .01 .00 .00 .01 .00 .00 .01
MeanXFISH
MeanXMEAT
MeanXOCER
MeanXPULSE
MeanXRICE
MeanXVEG
MeanXWVOL
farm labnonfarm
labpoor
peasantnonfarm
poormed
peasant nf medrich farm
CATEGORY
Total

26
26
Table 11: Food Consumption (kg.) per Adult Unit; Jan 1988
.06 .00 .02 .00 .03 .08 .08 .05
.00 .00 .04 .00 .00 .07 .01 .01
.02 .00 .00 .57 .00 .04 .02 .06
.00 .00 .01 .00 .00 .00 .00 .00
.65 .62 .50 .47 .55 .57 .60 .57
.47 .31 .19 .17 .22 .17 .21 .24
.00 .00 .00 .00 .00 .00 .00 .00
MeanXFISH
MeanXMEAT MeanXOCER MeanXPULSE
MeanXRICE MeanXVEG MeanXWVOL
farm labnonfarm
labpoor
peasantnonfarm
poormed
peasant nf medrich farm
CATEGORY
Total
Table 12: Food Consumption per Adult Unit (March-April, 1988)
.01 .09 .03 .02 .04 .02 .04 .03
.02 .00 .00 .00 .04 .00 .02 .02
.04 .00 .12 .36 .02 .00 .04 .07
.00 .00 .01 .00 .00 .02 .02 .01
.45 .51 .48 .47 .53 .49 .66 .55
.24 .22 .21 .20 .28 .15 .63 .37
.07 .00 .00 .00 .05 .00 .01 .02
MeanXFISH
MeanXMEAT MeanXOCER MeanXPULSE
MeanXRICE MeanXVEG MeanXWVOL
farm labnonfarm
labpoor
peasantnonfarm
poormed
peasant nf medrich farm
CATEGORY
Total
The variation in vegetable consumption on average is small (graph 3). It is interesting to
note however that the poorer groups consume much more vegetable compared to the
rich during the post-harvest period. There is small variation across groups in fish
consumption as well, except during the post harvest period (graph 6).
Food Consumption: 2000
A comparison of Tables 11 and 13 shows that rice consumption has changed little for
most groups. For the farm labour group however, rice consumption has decreased
noticeably but appears to have been well compensated through consumption of other
foods. In fact the main change that appears to have occurred in the sample population is
a widening of the food consumption basket without much change in overall calories

27
27
consumed. Thus the increased consumption of meat, fish and pulses is a positive
development and an indication of improving food security and a more balanced diet.
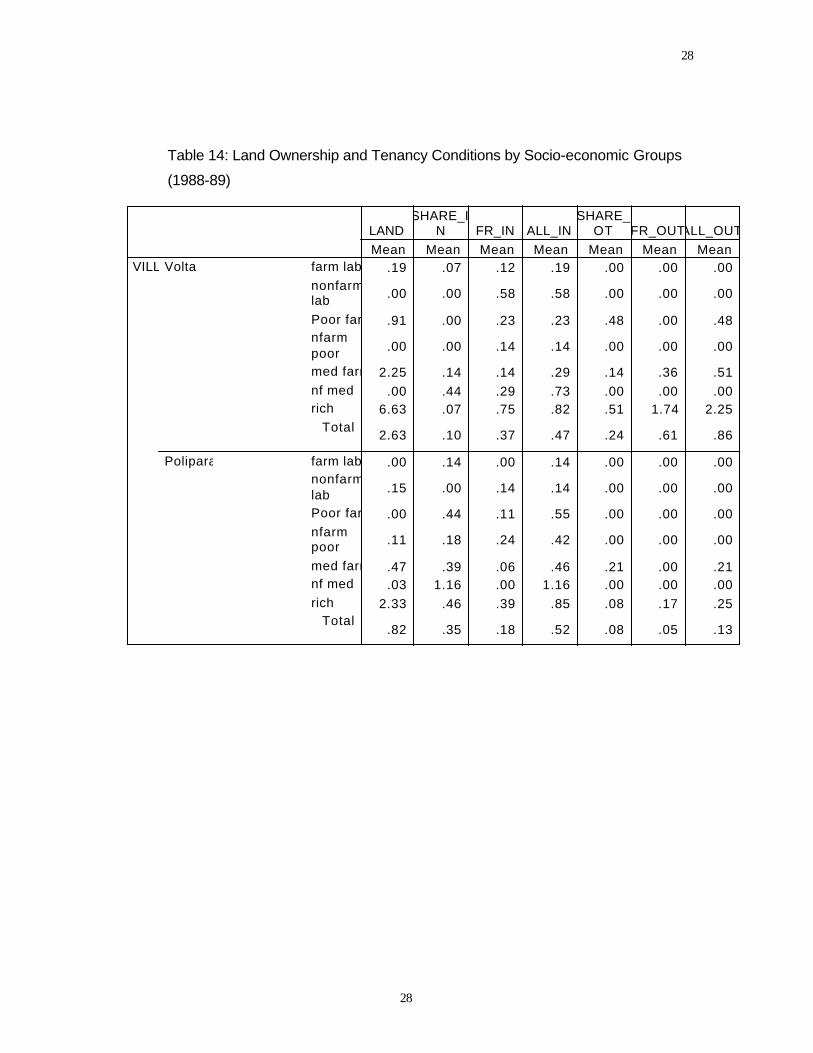
Land and Tenancy
The evidence shown in Table 14 point to the highly unequal land distribution status of
the sample households, both among household groups and between the two villages
(also see graph 1). There are some interesting differences between the two areas in
terms of the tenurial situation:
• Renting in and out of land (in cash) is the dominant mode of transactions in the land
market in Volta (which is also marked by a higher incidence of larger land- owners).
However, traditional share-in is more popular in Polipara.
• The large and medium farms principally rent or share out land but are also significant
buyers in the land-rent market. Sharecroppers are found in all socio-economic
groups
• From discussions with these households it emerged that traditional share-
arrangements were increasingly being replaced by a cash-rent system.
Table 13: Food Consumption (kg) per Adult Unit by Socio-economic Groups (Jan 2000) CAT farm lab Non-farm lab poor farm medium farm Non-farm
medium rich
rice 0.55 0.57 0.50 0.57 0.55 0.61 wheat . . 0.06 0.11 . . meat 0.10 0 0.04 0.07 0.08 0.25
fish 0.09 0.07 0.08 0.15 0.12 0.13
pulses 0.05 0 0.04 0.08 0.08 0.1
vegetable 0.18 0.13 0.13 0.16 0.18 0.21
potato 0.14 0.13 0.10 0.11 0.07 0.17
milk 0.12 . 0.13 0.23 0.1 .
eggs 0 0 1 2 0 .
eggplant 0 . 0 0.11 . .
chicken . . 0 0.11 . .
28
28
Table 14: Land Ownership and Tenancy Conditions by Socio-economic Groups
(1988-89)
.19 .07 .12 .19 .00 .00 .00
.00 .00 .58 .58 .00 .00 .00
.91 .00 .23 .23 .48 .00 .48
.00 .00 .14 .14 .00 .00 .00
2.25 .14 .14 .29 .14 .36 .51
.00 .44 .29 .73 .00 .00 .006.63 .07 .75 .82 .51 1.74 2.25
2.63 .10 .37 .47 .24 .61 .86
.00 .14 .00 .14 .00 .00 .00
.15 .00 .14 .14 .00 .00 .00
.00 .44 .11 .55 .00 .00 .00
.11 .18 .24 .42 .00 .00 .00
.47 .39 .06 .46 .21 .00 .21
.03 1.16 .00 1.16 .00 .00 .00
2.33 .46 .39 .85 .08 .17 .25
.82 .35 .18 .52 .08 .05 .13
farm lab
nonfarmlab
Poor farmnfarmpoormed farm
nf medrich
Total
farm labnonfarmlabPoor farm
nfarmpoor
med farmnf med
rich Total
Volta
Polipara
VILL Mean
LAND
Mean
SHARE_IN
Mean
FR_IN
Mean
ALL_IN
Mean
SHARE_OT
Mean
FR_OUT
Mean
ALL_OUT

29
29
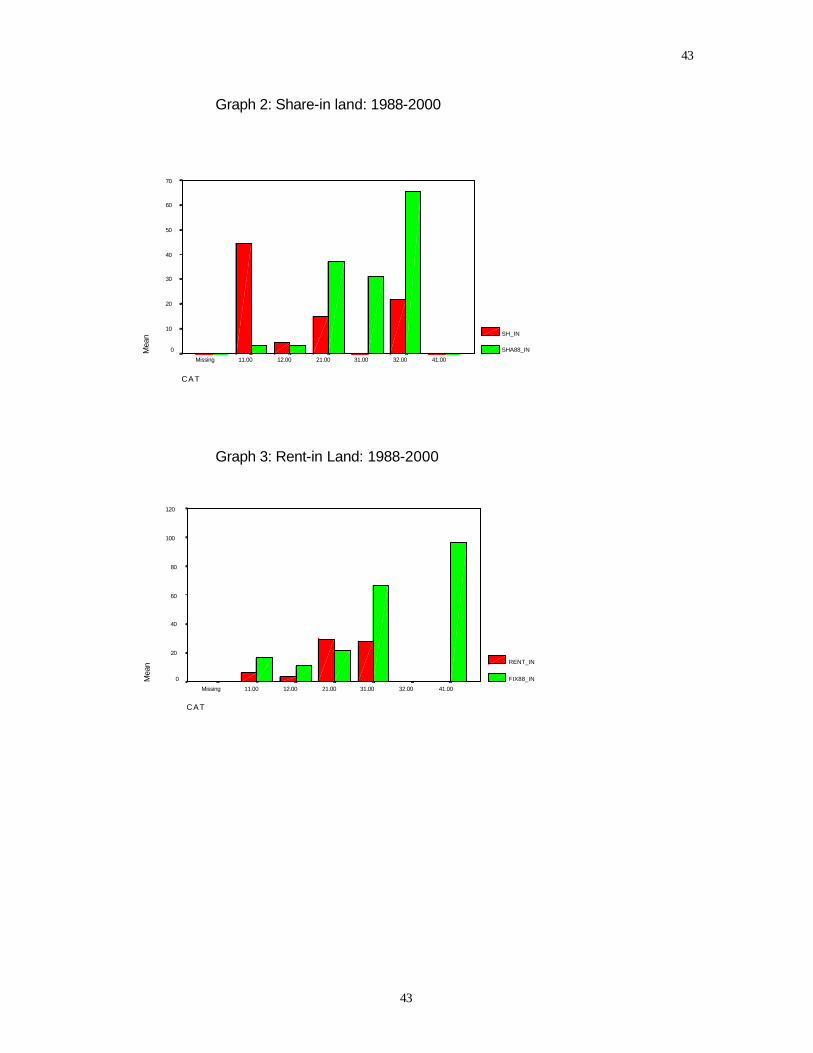
Table 15: Share-in and Rent-in by Groups (decimals/hh)
SH_IN SHA88_IN RENT_IN FIX88_IN Mean Mean Mean Mean
Volta 11 3.2 4 5.8 14.8 12 0 0 0 14.5 21 0 14.5 38.0 35.8 31 0 0 19.3 92.3 32 0 87 0 0 41 0 0 0 101.5
1.16 9.56 16.62 37.2 Polipara
11 232 22.0 7.2 22 12 5.6 0 3.8 10 21 31.2 63.14 20.7 6.7 31 0 58.0 36.5 63.0 32 29 29 0 0 41 0 0 0 87
346 31.3 12.5 18.6 Note: See previous table
The original household classification has been retained to permit direct comparison of
changes over time in land ownership, share-in, and rent-in of land over 19988 to 2000.
• All classes of households registered a decline in land owned but this was larger
amongst the poorer sections.14
• There has been a general decline in the incidence of land lease by the sample
households. Thus 47 percent and 33.3 percent reported renting-in and sharing-in
land in 1988 compared to 27.5 percent and 17.6 percent in 2000. Similarly, area
leased in also declined, especially in Volta.
• Both graphs 2 and 3 show that poorer groups have assumed a larger share of the
land lease market compared to the situation ten years ago.
14 However, as noted earlier, there was no decline in per capita terms.

30
30
Non-Land Assets
Table 16 provides data on asset ownership in current prices. For the period
under consideration the GDP deflator increased by around 52 percent while the CPI
(middle income group) increased by around 57 percent. As expected livestock are the
most valuable asset for a rural household after land, followed by 'equipment and
transport'. There has been quite a sharp decline in livestock wealth especially in Volta
where the value of livestock has fallen even in nominal terms (the fall in real terms is of
course much more severe). In Polipara livestock wealth appears to have remained
static.
Table 16: Non-Land Asset Distribution (Tk) by Socio-Economic Groups
LIVE POULV EQTRV
1988-89 2000 Ratio 1988-89 2000 Ratio 1988-89 2000 Ratio
Volta
Farm-lab 3584.8 5388.8 1.5 150.1 228.8 1.52 1030.2 922.2 0.89
Non-farm lab 137.5 0 0 191.7 650 3.39 191.5 3000 15.6
Poor farm 5508.2 4062.5 0.73 246.4 400 1.62 2273.5 343.7 0.15
Non-farm poor 20361.5 9866.6 0.48 349.5 426.6 1.22 2253.3 18933.3 8.4
Non-farm med 6300 0 0 237.2 0 0 600 300 0.5
Rich 12727.8 5750 0.45 285.3 400 1.40 853 225 0.26
6777.7 4884 0.72 222.5 345.6 1.55 1476.3 2984 2.0
Polipara
Farm -lab 806.81 2500 3.09 89.6 200 2.22 106 0 0
Non-farm lab 1926.4 4200 2.18 111.1 178.7 1.60 1354.4 937.5 0.69
Poor farm 7552.4 8428.5 1.12 367.0 404.2 1.10 3704.1 5450 1.47
Med farm 10634.3 18600 1.74 340.8 460 1.34 4157.5 10387.5 2.49
Non-farm med 5803.4 10500 1.80 180.0 396.6 2.20 262.3 3333.3 12.7
Rich 13113.4 14300 1.09 504.1 1280 2.53 20240 30450 1.50
5718.1 8712 1.52 241.8 358.8 1.48 2985.3 5106 1.71
It is however very interesting to note that the farm labour group in Volta managed to
retain the value of their livestock wealth while in Polipara the bottom groups have
managed to increase their livestock assets. In overall terms poultry stocks have

31
31
stagnated and the value of equipment and transport has increased. In the case of the
former, the poorer groups either managed to stabilize or improve their position while in
the case of the latter the improvement has been concentrated largely in the medium
farm category
The overall decline in animal holdings is also borne out by the per-household ownership
of various animals between the two time periods. Per household ownership of bulls,
cows and calves were 1.76, 1.76 and 1.39 in 1988 but declined to .54, .70 and .58 in
2000.
Labour Use and Employment
There are a number of interesting features that are revealed in Tables 17 and 18:
• Labour-selling households have declined over time
• Those households that sell labour are able to work more days than before
• The increase in wage rates has increased faster than the CPI or the GDP deflator -
nominal wages increased by around 100 percent while the CPI increased by around
55 percent.
• Contract labour has become the single most dominant category for hiring of labour,
replacing the traditional dominance of daily hired workers. The number of
households hiring daily workers has dropped substantially although total demand has
remained the same. On the other hand the demand for contract labour has expanded
significantly. Aggregate labour demand has increased.

32
32
Table 17: Family Labour Sale Volta
1988 Polipara 1988 Volta
2000 Polipara 2000
HHs selling Lab (no.) - Boro - Aman
7 9
12 6
6 6
7 6
Labour days/mo - Boro - Aman
5 4
4 6
9 7.2
6 5.5
Wage rate (cash) - Boro - Aman
24 21
26 28
46 47
56 56
Table 18: Household Labour Use (Sample Households)
Boro 1988 Boro 1999 Contract Lab Use - households using - days
22 660
22 1000
Hired labour use - households using - days
31 512
16 500
Non-Farm Incomes and Credit
In real terms access to credit, on average, has declined. It has declined even in nominal
terms for some groups of people (Table 19/graph 4). Interestingly however, access to
credit by the poorer groups has increased dramatically in real and nominal terms. With
regard to non-farm incomes, there has been a substantial increase for most people
although the better-off groups have tended to benefit more. This suggests that the poor
have benefited from micro credit and higher non-farm incomes. The non-poor groups
however, have been able to increase their access to non-farm incomes despite much
reduced availability of credit.

33
33
Table 19
2490.56 595.37 1244.44 436.73 17500.00 3833.33
2000.00 2146.15 3000.00 726.54 550.00 10750.00
3250.00 1922.47 1425.00 644.37 15284.38 3750.00
833.33 6750.00 200.00 760.56 13333.33 30666.673000.00 400.00 2000.00 1090.91 .00 .00
.00 .00 7500.00 1547.00 .00111100.00
2316.60 1827.22 1848.00 680.21 12835.00 16008.00
4500.00 118.75 200.00 187.50 .00 .00
1500.00 1060.69 1952.50 1006.93 2268.75 2312.50285.71 3531.49 857.14 765.12 28785.71 4064.29
5750.00 1098.33 2000.00 1225.97 12125.00 6900.00
.00 5705.67 2666.67 656.36 3166.67 14500.00
.00 .00 4500.00 2914.29 .00 27600.00
1840.00 2198.15 1700.80 942.94 11106.00 5826.00
11.00
12.00
21.0031.00
32.00
41.00
CAT
Total
11.00
12.0021.00
31.00
32.00
41.00
CAT
Total
1.00
2.00
VILL Mean
CRED2K
Mean
CRED88
Mean
MINC2K
Mean
MINC88
Mean
LOSS10
Mean
GAIN10
Credit and Non-Farm Incomesby Socio-Economic Groups
Notes: MINC refers to monthly non-farm incomes. Loss10/Gain10 refer to value of assets lost/gained over the last ten years
Household Mobility and Change: 1989-2000
Information on the changes experienced by all 50 households studied, over the period
1989-2000, is provided ijn Annex Table 1. What emerges is very interesting: Out of 50
households, 14 (28 percent) were worse off than before, 4 households (8 percent)
showed no appreciable change while the remaining 64 percent of households were
found to have improved their situation. Amongst the bottom 22 households (the poor), 6
declined and 3 showed no change.
Of those found to have become worse off over time, the main factors appear to be life-
cycle factors (old age, land fragmentation because of inheritance, marriage expenses of
daughters and inability to develop a non-farm income source). On the other hand, those

34
34
whose situation has improved appear to have better access to land (through renting-in
and sharing-in), to non-farm sources of incomes, and to credit.
8 SAP AND FOOD SECURITY - RESULTS OF FGD
Focus Group Discussion: Village - Volta, Bogra
A FGD was held on 15.12.99 at the local Madrasah premises. There were 25
participants in all coming from all sections of the community. The people present were
briefed about the government policies that have been pursued in the past relating to
input prices, subsidies, abolition of the rationing system and introduction of VGD and test
relief, and liberalization of food imports. The people present seemed to agree that these
changes have benefited them as job opportunities have increased and the poor are
better able to cope.
• With regard to fertilizer availability, it was observed that the situation has improved
greatly as it is now possible to get it quickly and easily, although the price was a little
"too high".
• It was however pointed out that there is great uncertainty about quality of fertilisers
available as there is no way farmers can ascertain this.
• Similarly, the farmers welcomed the new policy of privately owned tubewells that
replaced the old BADC-regulated system of cooperative ownership and block-
formation for distribution of irrigation water. However, they complained that costs of
irrigation were "too high" although over the years the price of agricultural equipment
had come done substantially because of import liberalization. Mechanization has
increased rapidly.
• The problem of determining quality is also acute in the case of equipment and
spares.
• Although in principle the policy of farm price support through paddy procurement by
the government is meant to stabilise farm prices, most participants felt that the
farmers do not get the benefit as most purchases are made from traders and millers.
• The participants noted that infrastructure has improved greatly, including roads and
schools

35
35
• There is more absentee landlords now than before resulting in more land available
for renting in at fixed rates - a form of access to land that has expanded relative to
the traditional 50 percent share-cropping system.
• Health-sanitation services and awareness has increased.
Focus Group Discussion: Village Polipara, Bogra
A FGD was held on 19.12.99 at the local mosque premises with a total of 21 participants
derived from all walks of life. As before the discussion was preceded by a brief
introduction to government policy changes in the food and agriculture sector over the
last ten years. The views of the participants are detailed below.
• The changed focus of food policy resulting in replacement of rural rationing by a
greater emphasis on Food for Works, Vulnerable Group Development, Test Relief
etc has benefited the poor
• The participants expressed their satisfaction with the fertiliser distribution system but
opined that its pricing policy should be reviewed taking into account farmer's
affordability. The problem of fertiliser quality was also considered serious.
• Satisfaction was also expresed with regard to the irrigation policy that allowed private
ownership and reduced prices of equipment and thereby serving to lower water
charges. However, it was noted that the system of operating deep tubewells was not
working well as too many people are involved in its management resulting in
conflicts.
• As before, the participants noted the severe constraints faced in selling paddy to
procurement centres.
• Rural infrastructure has improved tremendously including metalled roads, schools,
irrigation and electricity
• Agricultural yields have improved (both paddy and vegetables) and culture fisheries
have expanded significantly, However, the participants expressed their concern
about harmful environmental effects of chemical fertiliser and pesticide use,
especially on fisheries.
• Education and health service facilities have expanded although the participants
complained that they do not get access to medicine and treatment

36
36
• The main tenurial forms are cash rent for a season or some other period (e.g.
several years) - longer term agreements are now more popular. Traditional sharing in
(on 50 percent basis) has become rare.
• The participants felt that the incidence of poverty was "not very much" and the
number of landless is static. Employment opportunities in agricultural and non-
agricultural sectors are available, and the poverty situation is "tolerable".
• The law and order situation in the area was reported as being unchanged.
All the changes or impacts referred to above are of course not related to structural
adjustments. On the other hand many are, especially those relating to agricultural
production, input distribution and safety nets. Whether growing incidence of absentee
landlords (and greater supply of land for rent) is related to SAP is more difficult to
ascertain. The greater profitability and lower risk in agriculture (because of the better
availability of inputs/electrification) does mean that the demand for land for rent has
increased (as distinct from share-cropping).
There also appears to have been significant infrastructural investments (in part through
FFW). It is also possible that savings generated from reduced subsidies on e.g.
fertilisers may have indirectly helped to divert more resources to these sectors. In
addition, a better climate for credit availability (especially for the poor) and significant
generation of non-farm sources of income has been noted - perhaps in part due to
higher agricultural productivity and irrigation coverage. These together, have certainly
served to contain poverty even if all the credit cannot be given to SAP. Thus three
elements have worked together to improve the food security regime of the poor:
somewhat easier access to land, non-farm incomes, and credit. In addition food prices
have been low (declining in real terms) while wages and earnings have improved.
Provision of public goods (roads, schools, clinics) and safety-nets have also helped to
improve the situation.
On the negative side, adverse environmental effects were noted, especially on fisheries,
but also on soil productivity, susceptibility to pest attacks and diminishing ground-water
levels. The problem of arsenic was not mentioned - perhaps because of lack of
awareness or absence of the problem in these localities. However, the massive
37
37
exploitation of groundwater that has been encouraged by e.g. privatization and reduction
of import duties on irrigation equipment, has undoubtedly contributed to this potentially
massive problem.
There is an acute market failure that has affected the fertilizer and pesticide market, as
well as the agricultural equipment market, relating to product standardization and
product quality. This has introduced a new element of potentially serious risk to
agriculture. Differential pricing policy for different fertilizers has also led to excessive use
of urea (whose price is controlled by the government) at the cost of TSP and MP.
Anecdotal reports have also been received on the negative impact on SAP on rice/paddy
markets leading to shutdown of mills and trading firms and in general reducing the
demand for beparies and farias (subordinate traders). Much of the employment in the
paddy trade arose from the need to procure timely supplies of grain by millers and
traders requiring tying in arrangements with suppliers down the marketing chain. Import
liberalization has meant that these arrangements can now been dispensed with as
"supply is no problem" anymore.
9 CONCLUDING OBSERVATIONS AND DISCUSSION
The national food security regime has improved significantly as a result of good
agricultural performance, removal of restrictions on food imports by the private sector
and enhanced macro-economic stability, including a low inflation rate. Indeed low, stable
food prices have been central to containment of inflation. Foreign exchange reserves
have also been comfortable helped along by modest rise in exports and remittances,
allowing both the government and the private sector to channel food imports whenever
dictated by market forces.
At the micro level, access to food improved significantly (especially of the poor) through
growth in non-farm income, availability of credit, improved access to the land market and
employment demand:

38
38
• Rice consumption has changed little for most groups. For the farm labour group rice
consumption decreased noticeably but was found to have been well compensated
through consumption of other foods.
• There was no change in per capita land owned although in per household terms
inequality in land ownership increased
• Poorer groups have assumed a larger share of the land lease market compared to
the situation ten years ago.
• There has been quite a sharp decline in livestock wealth. However interestingly, farm
labour group in Volta managed to retain the value of their livestock wealth while in
Polipara the bottom groups have managed to increase their livestock assets.
• The increase in wage rates was faster than the CPI or the GDP deflator - nominal
wages increased by around 100 percent while the CPI increased by around 55
percent.
The macro evidence discussed is in broad agreement with the micro findings and serves
to bolster our faith in the latter. It is likely, however, that the micro-level changes
observed in the sample data may have tended to overstate the positive changes
because of the greater impact of the Green Revolution in the area from which the
sample is derived. Nevertheless, the trends identified are quite consistent with the
national and regional data.
Two serious types of market failures were observed:
(c) related to the inability of the market to ensure that farmers have access to adequate
information about the quality of agricultural inputs like fertilizers and machinery;
(d) the inability of the market to take into account the substantial negative impacts on the
environment, especially on soil, surface and ground water.
Overall food security and poverty has undoubtedly improved in Bangladesh in recent
years (helped along by SAPs). Specifically, input liberalization (particularly for irrigation)
has had a very significant impact in promoting the impetus of the Green Revolution.
Liberalization of the government monopoly of the fertilizer distribution system and
withdrawal of price subsidy has had mixed effects, although the overall situation, may
have marked a slight improvement. On the output side, import liberalization of rice and
wheat has had very major food-security impact enabling large foodgrain imports from

39
39
India in recent years in record time, in the face of widespread domestic shortages
(Dorosh,1999). The other major dimension of SAP has been the restructuring of the
Public Food Distribution System, which again has led to elimination of a wide range of
subsidies and much superior targeting. Expansion of programs like Vulnerable Group
Development (VGD) for poor female-headed households, Food for Works (FFW) to
provide seasonal employment to both poor men and women, Rural Maintenance
Programme (RMP) and Food for Education (FFW), for example, have had important
food security impacts (see Choudhury and Ninno, 1998; Choudhury and Sen, 1997;
Ninno and Roy, 1999). A logframe approach was conducted to validate these
conclusions (Annex Table 2).
The entire credit for all of the changes identified here cannot, of course, be attributed to
the SAPs - all one can say is that the SAPs, taken together, have had a significant and
positive impact on rural welfare. In particular, the critical (and enabling) role of NGOs
and the micro-credit revolution, as well as huge investments that have taken place in
infrastructure (roads, irrigation, flood-control structures), education and health, need to
be adequately recognized. Specific attribution to SAPs was attempted (Annex Table 2)
using a logframe approach. We have concluded that the impact of changes in the
distribution system of fertilisers have improved availability and access while reduced
subsidies does not appear to have led to any significant negative impacts. It is also clear
that import liberalization of irrigation equipment and foodgrains have had very significant
food security impacts through improved production, availability and more stable food
prices. Similarly, the reforms undertaken in the PFDS has led to better targeting while
seed market reforms have been too partial to have any significant impact.
The situation remains precarious, however, in the face of enormous emerging
environmental challenges,15 depletion of ground-water resources, and uncertainties in
terms of potential destabilization of macro variables due to declining exports, and
industrial growth, depletion of foreign-exchange reserves and increasing deficit financing
of government expenditures. At the sectoral level, the market failures identified need to
be urgently addressed.
15 Some of which may well be linked to SAPs.

40
40
REFERENCES
BIDS (2000) The Face of Human Deprivations - Bangladesh Human Development Report 1999, Dhaka Crow and Murshid (1994) Economic Returns to Social Power: Merchants' Finance and Interlinkage in the Grain Markets of Bangladesh, World Development, vol 22, number 7 Choudhury, O.H. and B. Sen (1997) "Role of Public Expenditure in Poverty Alleviation", (mimeo). BIDS, Dhaka Dorosh, P.A. (1999) Supply Shocks, Trade Liberalization and Cross-Border Trade, FMRSP-IFPRI, Dhaka FAO (1994) Follow-up to Bangladesh Agriculture Sector Review, Rome Hossain,M. (2000) Recent Development and Structural Changes in Bangladesh Agriculture: Issues for Reviewing Strategies and Policies, Centre for Policy Dialogue, July 2000 Hossain, M. and Quazi Shahabuddin (1997) Sustainable Agricultural Development in Bangladesh: Challenges and Issues, Dhaka (mimeo) K.A.S. Murshid (1998) Bangladesh: An Operational Strategy for Agriculture, ADB, Manila ____________ (1999) Trade Liberalization and Rice Imports: Evolution of the Rice Import Market in Bangladesh, FMRSP-IFPRI, Dhaka Mahmud, W. (1996) Macro Evidence: The "Push-Pull" Debate Reconsidered, BIDS-World Bank workshop on stimulating growth through rural non-farm activities in Bangladesh Ninno, C. and Paul Dorosh (1998) Government Policy, Markets and Food Security in Bangladesh (mimeo), Dhaka Ninno, C.d and P.A. D.K. Roy (1999) The Impact of the 1998 Floods on Labour Markets and Food Security and Effectiveness of Relief Operations, FMRSP-IFPRI, Dhaka Shahabuddin, Q. and R.I Rahman (1998) Agricultural Growth and Stagnation in Bangladesh, CIRDAP, Dhaka, July UNDP (1989) Bangladesh: Agriculture Sector Review, Dhaka United Nations (1999) The Common Country Assessment, Dhaka World Bank (1990) Review of the Experience with Policy Reforms in the 1980s, Report no. 8874

41
41
World Bank (1992) Bangladesh: Selected Issues in External Competitiveness and Economic Efficiency, Report no. 10265-BD World Bank (1992) Food Policy Review: Adjusting to the Green Revolution, Report no. 9641-BD World Bank (1994) Bangladesh - Privatization and Adjustment, Report no. 12318-BD World Bank (1998) Agricultural Policy Notes, Dhaka World Bank (1998) Bangladesh: Country Assistance Review, Report no. 17455-BD
World Bank (1998) Proposed Bangladesh Rural Development Strategy, Dhaka

42
42
Graphs
Graph 1: Land Ownership: 1988-2000
CAT
41.0032.0031.0021.0012.0011.00
Mea
n
7
6
5
4
3
2
1
0
LAN_1988
LAND_2K
.77 .09
.21 .101.31 .714.76 3.81
.88 .056.39 6.30
11.00
12.0021.0031.00
32.0041.00
CAT Mean
LAN_1988 Mean
LAND_2K
Note: 11 (farm lab) 12 (nfarm lab)
21 (poor farm) 31 (med farm)
32 (nf med) 41 (rich)
43
43
Graph 2: Share-in land: 1988-2000
CAT
41.0032.0031.0021.0012.0011.00Missing
Mea
n
70
60
50
40
30
20
10
0
SH_IN
SHA88_IN
Graph 3: Rent-in Land: 1988-2000
CAT
41.0032.0031.0021.0012.0011.00Missing
Mea
n
120
100
80
60
40
20
0
RENT_IN
FIX88_IN

44
44
Graph 4
Credit by Socio-economic Groups
CAT
41.0032.0031.0021.0012.0011.00
Mea
n5000
4000
3000
2000
1000
0
CRED2K
CRED88
Graph 5
Non-Farm Incomes by Socio-economic Groups
CAT
41.0032.0031.0021.0012.0011.00
Mea
n
7000
6000
5000
4000
3000
2000
1000
0
MINC2K
MINC88

45
45

46
46

47
47
Annex Table 1: Household Dynamics. 1989-2000
Socio - Economic Category Change Remarks
POOR
1 Ebarat Ali Pramanik - landless labour No change Owns plough/bullocks and earns Tk.80/day. His grandson sells labour at Tk
40/day plus food. Does not get employment all year round.
2. Md. Ali, landless and old Declined Children gone away; rents in .33 acres but finds difficulty to get
employment due to age
3. Nurul Islam, young but separated from joint family Declined Thinks he was better off when with the joint family. Very little land
depends on labour sale and salary from fire-man's job at brickfield (part
time)
4. Abul Hossain, marginal farmer "Better Off" Now o wns .3 decimals of land. Sold land and animals in the past to educate
children. One son now has a salaried job. He expects things to improve
5. Rahman Pramanik, marginal farmer Declined Has .24 decimal cultivable land; shares in some land; Has to buy food
four months in a year - ten years ago he did not need to
6. Jamal Uddin, petty trader "Better off" Quality of life unchanged - may be even worse but children educated
family hopeful they will get a job
7. Habibur Rahman, daily labourer Slightly better off Owns plough/bullock plus adult son; wife tok credit from BRAC; rented
some land
8. Shamsul Fakir, no land, labour sale No change In debt Tk.2000; survives purely through labour sale
9. Afzal Ali, landless, share-in Better off Owns spray machine - demand all year round; shares in some land; children
go to school
10. Nizam Mondol, landless, small trader Better off Bought .08 acres of land in last ten years; good profit from sweets sale; also
bought cassette
11. Aftab Ali, mason Better off Did not buy or sell land, owns .29 acres; shares
days a month; also owns bullocks and goats
12. Sobhan Sardar, landless labour Better off Rented in .145 acres; cattle trader; micro credit from ASA; bought cow
13. Shams ul Fakir, Van driver Better off No cultivable land; owns van (gift)
14. Ebad Ali, landless, trabsport worker Better off Bouight .12 acres land; rented in .31 acres; also pulls rickshaw; adult son
15. Ayub Ali and his son are rickshaw pullers; no land Better off Rented in some land but his rickshaw stolen; improved his house; managed
to absorb shock "somehow"
16. Abdur Razzak, fishing, share-in Better off Credit from ASA, shares-in small piece of land from father
17. Bhaben Burman, works in rice mill Declined Sold cows for marriage of daughter; wife raises cattle; mill not doing well
18. Rezaul Huq, rickshaw puller, owns a small plot No change Earns Tk.50-60/day from rickshaw; some paddy from land
19. Jagannath Barman, landless labour; silver smith Better off Shares-in land; good earnings from smithy
20. Delwar Hossain, silver smith, no land Declined Expenses have increased more rapidly than income
21. Abbas Ali, landless labour Better off Bought van for son on credit

48
48
22. Mizanur Rahman, sharecropper Declined Sold assets and in debt
SMALL FARM
23 Montaj Pramanik, small farmer Better off Children independent; no dependents except wife; owns 1.2 acres
24. Zillur Rahman, owns 1 acre, shares-in 1 acre No change Family size increased; involved in land litigation
25. Mofel Sardar, shares-in 1 acre + small business) Better off Small family
26. Shamsul Islam, small farmer Declined Sold land, for marriage and cow for debt
27. Siddiq Akhand Declined Sold land; debt; needs to buy food
28. Ismail Hossain, retired Decline? Used to be well off (Trade, cultivation) but now divided his land among
three sons
29. Abdul Mannan, share-in Declined Sold land, bought auto-tempo; children go to school
30 (Akkas son of Bulbul - the previous head Better off Owns .3 acres plus shares -in 1 acre; also works in brickfield; made
furniture; sold cows
31. Solaiman Hossain (UP Chair, rich) Improved Owns 14.5 acres - never sold
32. Dalil Uddin (large farmer) Better off Formed separate unit after his father's death; ow
share-in; productivity increased
33. Abdul Jalil, own land plus share-in Better off Modern agr./bought land
34. Abdur Rahman, rich owner-farmer Improved Easier access to irrigation, fertiliser
35. Ismail Hossain, rich/influentia l Improved Rents out, cultivates some himself; poultry farm; bought land
36. Ibarat Ali, rich farm Declined ? Sold land, married two daughters, son educated to SSC; no plough
37. Moffazzal Ali, cultivates .66 acre plus tailor) Declined Sold assets (land/cows); parental land divided up; children go to school
38. Badesh Pramanik Better off Got land through marriage; son pulls rickshaw
39. Md Ali Pk, agri and tailoring Better off Shares-out land; good earnings from tailoring
40. Tofazzal Hussain Declined Sold land; no non-land incomes
41. Shamsuddin Ahmed, rented-in land, micro-credit Better off Sold land but good earnings; also drives van
OTHER FARMS
42 Mojahar Ali, medium rich farm Improved Bought land irrigation equipment
43. Solaiman, owner-cult ivator Improved Sons educated; bought land
44. Alef Uddin, large, joint family Improved New wing in house, new tube-well
45. Yakub Ali (small trader, sharecropper) Better off Bilt small house and pucca latrine
46. Jewel Pk, (Shop owner/business) Improved No land but has other assets
47. Nasir Fakir, Large sharecropper Improved Shares-in 5 acres - brother in law of landlord; loans from BRAC, BRDB;
48. Milan Chandra, Silver smith Better off Bought small plot;
49. Barkat Ali, large joint family Better off Five male adult sons; hard-working
50. Mofazzal Pk, large farmer Decline Sold land; no non-farm incomes

49
49
Annex Table 2 SAP and Poverty - A Logframe Approach SAP Intended Effects Actual Impact Relationship to
Poverty Fertiliser pricing and distribution (i) Reduction of subsidy on
urea (ii) New distribution system
prevent smuggling; improve availability; improve efficiency; reduce pressure on the budget improve availability; stabilize prices
Availability improved; Prices increased. Availability improved
Poor farmers have better access; Use per acre fell a little - thus output not significantly affected
Import liberalization (i) Irrigation equipment (ii) Foodgrains
Lower import prices; increase consumer choice Lower prices for consumers; improve availability
Imports increased and irrigated area expanded rapidly Large private sector response, prices stabilized
Very positive output response; better availability; positive effect on labour market Availability greatly improved; Positive food security impact
Public food distribution system (i) Safety nets (ii) Subsidy reduction (iii) OMS
Direct targeting of the poorest, women Reduce budgetary pressure; reallocate subsidies to poor through safety nets Price stabilization of foodgrains
Able to reach the poorest groups, including poor women. Budgetary pressures eased; Distribution through safety nets increased. Positive
Good coveragtargeting; Lower prices during food crises
Seed market reforms
Allow private sector imports/production to improve availability, quality
Very part ial reforms - Government monopoly on main crops not removed
No impact

50
50

51
51


53
53
Appendix 1
A REVIEW OF EXPERIENCE WITH SAPS
Macro and Sectoral Policy Regime Facing Agriculture
Bangladesh has made substantial progress towards trade liberalization and macro-
economic adjustment policies, including rationalization of policies relating to agricultural
price support and input subsidies. These have significant implications for food production
and food security.
The Exchange Rate
An overvalued exchange rate implies that exports are more expensive relative to
imports, negatively affecting incentives for domestic producers, including farmers.
Recent estimates of the equilibrium exchange rate (the rate that is consistent with a
sustainable level of current account deficit for a given set of trade taxes and subsidies),
calculated on the basis of a number of plausible assumptions, suggest a sharp decline
from 41 percent in 1989-90 to 25 percent in 1991-92, coming down to as low as 10
percent in 1997-98 (Shilpi, 1998). Thus for much of the 1980s, overvaluation has been a
severe problem although its extent has now come down substantially.
The Trade Liberalization
Compared to industry and manufacturing, agriculture has historically received very little
protection. With the exception of sugar, tariff rates on most agricultural products are low.
On the other hand, the recent withdrawal of the ban on private sector imports of
foodgrains (including rice) has thrown the entire sector open to direct competition, e.g.
with Indian farmers. Thus, in the face of a supply shock, Bangladeshi consumers benefit
from lower import prices while in normal times, domestic prices tend to be below import-
parity.
Input Markets
a. Fertilizers

54
54
The fertilizer distribution system went through major reforms in the late 1980s to early
1990s when the monopoly role of the Bangladesh Agricultural Development Corporation
(BADC) in the wholesale trade and distribution of urea fertilizer was withdrawn. Non-urea
fertilizer trade and distribution was also opened up to the private sector. Subsidies on
TSP and MP were eliminated and urea prices were also raised to border price levels.
Some major policy reversals took place following the urea price crisis of 1994-95,
stemming from a large discrepancy that emerged between the domestic and the
international price.16 While the price differentials have narrowed since, there remains a
significant economic subsidy on urea. A financial subsidy is also implicit as the price of
gas used in urea production is lower than the world market price.
b. Minor Irrigation
The market for minor irrigation has undergone major reforms since 1987 that contributed
to an unprecedented spurt in area expansion under irrigation. This experience is well
documented (Ahmed, 1997). Irrigation equipment does not incur any import duties and
prices have fallen drastically over the last decade. However, a small but significant
subsidy has been retained for deep tube-wells (DTWs), on the ground that required
investments are lumpy and for certain agro-ecological zones, the only method
applicable.
Irrigation expansion has been a vital component of the government strategy for
increasing agricultural production. Thus, while the liberalization of trade and removal of
siting restrictions and standardization requirements on e.g. shallow tube-wells, led to a
burst in irrigation coverage between 1986-87 to 1989-90, fuel price hikes during the Gulf
War, withdrawal of input subsidies and re-introduction of siting restrictions led to the
observed slow-down of the early 1990s. This trend was further aggravated by the slump
in output prices.
c. Seed Markets
The government monopoly and seed imports and distribution has been relaxed
somewhat. Thus the National Seed Policy, 1992 has provided for privatization of seed
production beyond the foundation stage and has also closed down most retail centers
16 Abdullah et al (1995) observes that the urea price policy in the mid-1990s was inconsistent with the general orientation of trade and exchange rate liberalization, causing wide divergence between the domestic

55
55
operated by BADC. The Plan also envisaged phasing out of subsidies. The government
however, continues to retain its monopoly on five certified seeds (rice, wheat,
sugarcane, potato and jute) – implying that varietal development, evaluation,
maintenance, multiplication, quality control and distribution are conducted entirely by the
public sector. There is a great reluctance on the part of the government to liberalize this
sector, fearing that this could open up the flood gates to the import of cheap, poor quality
seeds that could potentially spell disaster for the food economy. On the other hand,
farmers currently continue to face a crisis of availability for quality seeds leading to large-
scale smuggling from India.
Service Delivery
The Bangladesh Agricultural Development Corporation (BADC) was the main vehicle
through which the government sought to modernize agriculture. Thus, it was mandated
amongst other things (a) to make arrangements on a commercial basis, for the
procurement, transport, storage and distribution of essential supplies such as seed,
fertilizer, plant protection equipment, pesticides and agricultural machines and
equipment, and (b) to promote the development of cooperatives with a view to handing
over to them its supply function in a phased program.17 BADC initially had great success
in making arrangements for input supplies, especially related to minor irrigation and
fertilizer distribution. However, these functions were never conducted on a commercial
basis, soon leading to huge costs and a burden on the exchequer. This led to an
insistence on institutional reforms and privatization from the late 1970s. Major reforms
were thus initiated in the 1980s, especially in the field of fertilizer pricing and distribution
and in the fielding, sale, distribution and maintenance of minor irrigation, resulting in a
greatly diminished role for the Bangladesh Agricultural Development Corporation
(BADC). However, attempts to restructure and downsize BADC met with stiff resistance
and involved a big effort well into the mid-1990s. Ultimately it found itself considerably
downsized, retaining a small presence in the irrigation sector (mainly in DTWs and large
projects) and in the seed sector – with much of its other roles taken over by the the
private sector.
market price and border price and leading to smuggling. 17 World Bank (1993, p. 55).

56
56
Social Safety Nets and Food Management
The reforms discussed above have implications for food security in terms of food
production and availability on the one hand and wages and employment generation
effects in agriculture, on the other. However, at around the same time as these reforms
were introduced, major changes were taking effect in the sphere of food management
policy in general and the role of the Public Food Distribution System in particular.
Half of all households in Bangladesh are said to be poor and unable to meet minimal
consumption requirements. In the long run, the hope is that economic growth will
generate sufficient employment and income to raise these people out of poverty. In the
short term safety nets are often proposed so that the worst symptoms of poverty are
tackled. The rationale for safety nets is also embedded in the logic of the growth process
envisaged – namely export-oriented, open-economy led growth, fueled by foreign
investment in labour-intensive sectors. The process of transition to such a high-growth
regime may be associated with significant (temporary) adjustment problems causing
poverty, unemployment and food insecurity to be further exacerbated.18
Safety Nets: targeted Programs
The Public Food Distribution System (PFDS) was set up in 1943 during the Great
Bengal Famine and expanded rapidly afterwards. In the early 1990s, it channeled
around 2.5 m MT of foodgrains (or 13 percent of all foodgrains consumed in the
country)19. It operated 12 different channels (2 relief channels, 4 targeted channels
serving the relatively better off and 2 untargeted channels). The PFDS was geared to a
number of objectives that included price stabilization, farm price support, providing food
to poor groups or groups in distress, as well as to certain 'priority' groups like industries
and the Army. The share of the various channels of the PFDS in the early 1990s is
shown below.
There has been a gradual trend towards reorientation and restructuring of the PFDS
evident from early 1980 leading to a change in the composition of beneficiaries. Non-
18 There is a huge body of literature on the impact of SAP on food security and poverty in the African and Latin American contexts.

57
57
monetized (targeted) programs like FFW, VGD and relief expanded rapidly from 0.4 m
MT in 1981 to 1.4 m MT by the end of the decade while their share in total distribution
climbed from around a quarter to more than half (World Bank, 1990) – a trend that
continued well into the 1990s with larger targeted programs and additional channels like
Food for Education. Entitlements to monetized channels like Statutory Rationing (SR)
and Priority Groups were phased out or reduced – SR was initially reformed into a rural
rationing program (Palli Rationing) in 1989 but even this was subsequently phased out
over the next few years.
Food Management Reforms
One of the major goals of the PFDS has been to stabilize prices and provide price
support to both consumers and producers. The former is conducted through Open
Market Sales while a policy of procurement at floor prices addresses the latter concern.
OMS is an effective tool and probably the only major tool available to the government to
restrain prices in the face of production shocks e.g. during floods. Given the high priority
that the government attaches to food price stabilization efforts have been made to
ensure that there are sufficient stocks available for the purpose. These stocks have
traditionally relied on aid imports, and increasingly on procurement supplies from
farmers. Thus, while the price support program has not been very effective in propping
up floor prices because of the modest scale of operations, the procurement system has
been useful in replenishing and building stocks – needed both for OMS and for targeted
programs.
The major reforms to take place in this sector relates to withdrawals on restrictions on
private trade (e.g. removal of anti-hoarding laws and stock-keeping rules), a shift from
mill-gate procurement by the PFDS to open tendering and further opening up of the
private market to trade, first by allowing private wheat imports and then extending this to
rice as well.
19 World Bank (1995).