Embed Size (px)
Citation preview
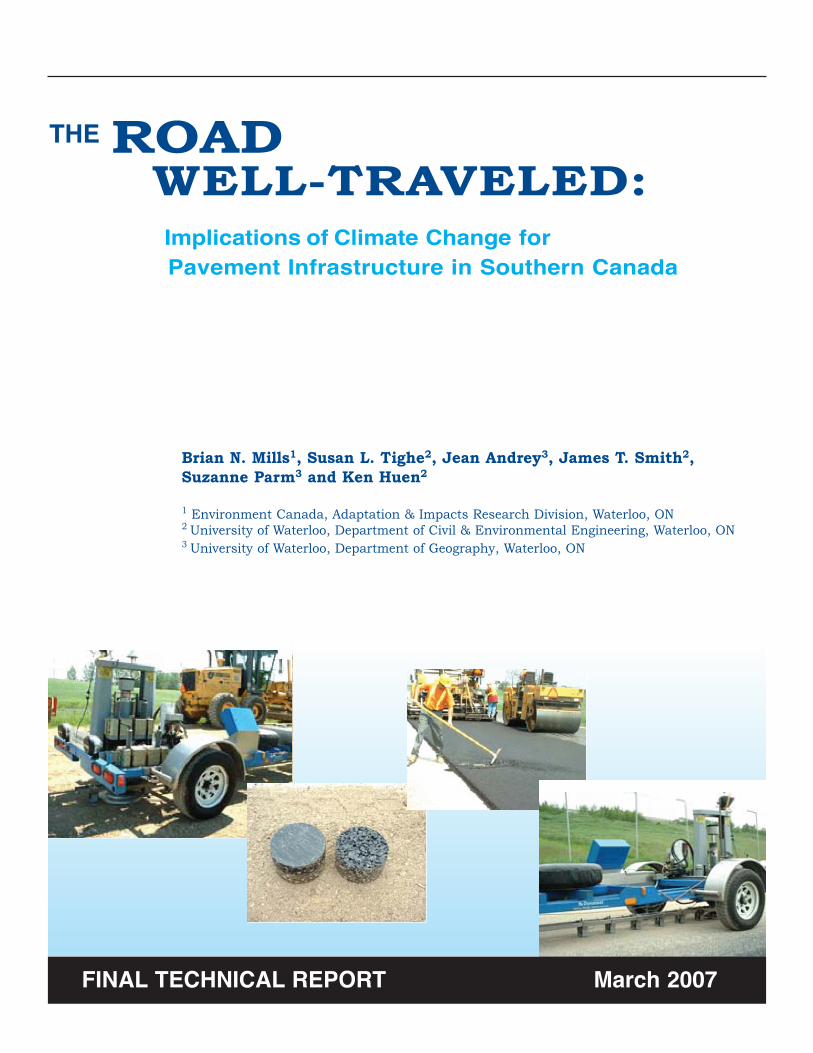
Brian N. Mills1, Susan L. Tighe2, Jean Andrey3, James T. Smith2, Suzanne Parm3 and Ken Huen2
1 Environment Canada, Adaptation & Impacts Research Division, Waterloo, ON2 University of Waterloo, Department of Civil & Environmental Engineering, Waterloo, ON 3 University of Waterloo, Department of Geography, Waterloo, ON
THE ROADWELL-TRAVELED:Implications of Climate Change for Pavement Infrastructure in Southern Canada
FINAL TECHNICAL REPORT March 2007

*cover photos courtesy of Dr. Susan Tighe Inquiries regarding this report should be directed to: Brian Mills Adaptation & Impacts Research Division Atmospheric Science & Technology Directorate Environment Canada c/o University of Waterloo, FES 200 University Avenue West Waterloo, Ontario, Canada N2L 3G1 Phone: (519) 888-4567 ext.35496 [email protected]
The Road Well-traveled: Implications of Climate Change for Pavement Infrastructure in Southern Canada i
TABLE OF CONTENTS Page
LIST OF TABLES……………………………………..………..…………………..…………………. ii
LIST OF FIGURES………………………….…………………………………………………………. iii
ACKNOWLEDGEMENTS……………………………………………………..................................... vi
SUMMARY…………………………………………………….………………………………..…….... vii
1.0 INTRODUCTION………………………………………..…………………………………….…… 1
2.0 LITERATURE REVIEW…………………………………………….…………………................ 4
2.1 Management of Pavements in Canada ………………………….................................. 4
2.2 Impact of Climate and Weather on Pavement Performance and Deterioration…… 13
2.3 Potential Impacts of Climate Change on Pavements ………………………………..… 17
3.0 IMPACT OF CLIMATE VARIABILITY AND CHANGE ON CANADIAN PAVEMENT PERFORMANCE: CASE STUDIES……………………………………………..…………..…. 21
3.1 Analysis of Deterioration-relevant Climate Indicators ……………............................. 21
3.2 Mechanistic-Empirical Pavement Design Guide (MEPDG) Application ….…………. 40
3.3 Discussion and Limitations…………………………………………………..…………… 64
4.0 SUMMARY AND RECOMMENDATIONS…………………………………………………..…... 66
4.1 Conclusions…………………………………………………………………..……………….. 66
4.2 Recommendations……………………………….………………….................................... 68
5.0 REFERENCES…………………………………………………………………………..………… 70
APPENDIX A: CLIMATE CHANGE SCENARIO INFORMATION FOR CASE STUDY SITES 78
APPENDIX B: DETERIORATION-RELEVANT CLIMATE INDICATOR RESULTS FOR ALL CASE STUDY SITES…………………….…………………………………………. 85
APPENDIX C: MATERIAL PROPERTY ASSUMPTIONS USED IN MEPDG ANALYSES…… 202
APPENDIX D: MEPDG SENSITIVITY ANALYSIS RESULTS………………………….……...…. 205

The Road Well-traveled: Implications of Climate Change for Pavement Infrastructure in Southern Canada ii
LIST OF TABLES Page
Table 1. Possible implications of climate change for Canadian transportation...………..…. 1
Table 2. Canadian road network distribution (2002)………………………………………............ 3
Table 3. Factor Effects on Road Deterioration and Costs: Paved Roads (Haas et al., 2004)…………………………………………………………………………………………..… 18
Table 4. Case study site locations and characteristics ………………………………………..… 23
Table 5. Example Performance Grades for asphalt binders/cements (USFHWA, 2002; OHMPA, 1999)………………………………………………………………………............... 26
Table 6. PG analysis summary of Superpave- and RWIS-based results …………………..…. 33
Table 7. Freeze and thaw analysis calculation assumptions adopted in the analysis ……... 34
Table 8. Summary of LTPP test sites in Canada…………………………..…………………..…... 41
Table 9. Case study site characteristics ……………………………………………………………. 42
Table 10. Analysis parameters used in MEPDG application (20-year design life)………….... 43
Table 11. MEPDG pavement performance results for all sites (climate change alone)…...... 44
Table 12. IRI performance results for all sites and scenarios …………………………………... 58
Table 13. Longitudinal cracking performance results for all sites and scenarios ……..…… 59
Table 14. Alligator cracking performance results for all sites and scenarios ……………..… 60
Table 15. Transverse cracking performance results for all sites and scenarios ……….….... 61
Table 16. AC rutting performance results for all sites and scenarios ……………..……….…. 62
Table 17. Total rutting performance results for all sites and scenarios ……………………… 63

The Road Well-traveled: Implications of Climate Change for Pavement Infrastructure in Southern Canada iii
LIST OF FIGURES Page
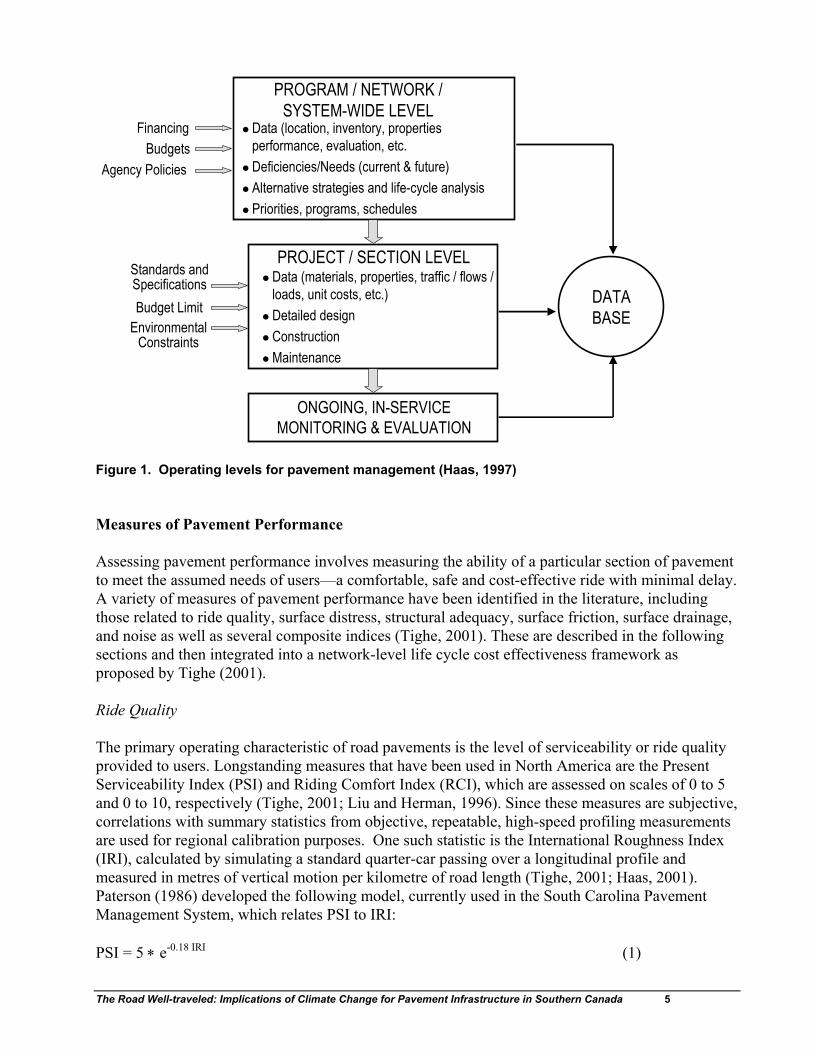
Figure 1. Operating Levels for Pavement Management (Haas, 1997)….………………………… 5
Figure 2. Manitoba motor vehicle collision injuries reported by road condition (1984-2000).. 8
Figure 3. Levels of aggregation for measures of customer benefits (Tighe, 2001)………….... 10
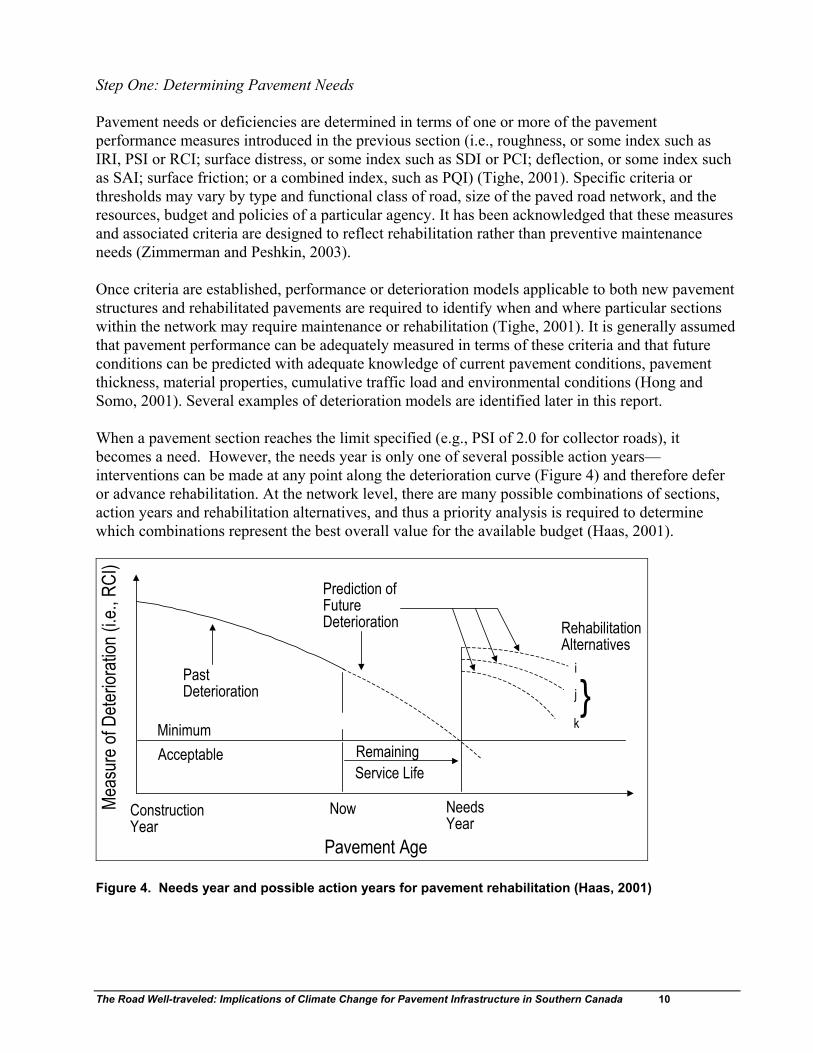
Figure 4. Needs year and possible action years for pavement rehabilitation (Haas, 2001)….. 11
Figure 5. Factors affecting road performance (Haas, 2004)…………………………...………….. 13
Figure 6. Roughness progression comparisons from Canadian strategic highway research program, Long Term Pavement Performance (C-LTPP) experiment (Tighe et al., 2001) …………………………………………………………………………………………….. 19
Figure 7. Steps in the analysis of climate change impacts ……………………….…………..…... 22
Figure 8. Scatterplot of potential changes in mean annual temperature and precipitation (Edmonton case study)……………………………………………………..………………... 24
Figure 9. Scatterplot of potential changes in mean annual temperature and precipitation (Windsor case study)…………………………………………………………..……………... 25
Figure 10. Relationship between 7-day mean maximum daily air and pavement temperatures …………….......................................................................................................... 27
Figure 11. Relationship between minimum daily air and pavement surface temperatures …. 28
Figure 12. Daily minimum air temperature statistics for Windsor site under baseline and future scenarios ………………................................................................................................ 28
Figure 13. Seven-day mean daily maximum air temperature statistics for Windsor site under baseline and future scenarios …………………….….............................................. 29
Figure 14. Annual extreme minimum daily air temperature statistics for Windsor site under baseline and future scenarios ............................................................................................... 29
Figure 15. Annual extreme 7-day mean maximum air temperature statistics for Windsor site under baseline and future scenarios ……………………………………………………... 30
Figure 16. Low PG rating thresholds estimated using the Superpave algorithm under baseline and future scenarios for all sites …………….……............................................ 31
Figure 17. Low PG rating thresholds estimated using the RWIS-based algorithm under baseline and future scenarios for all sites …………….……............................................ 31
Figure 18. High PG rating thresholds estimated using the Superpave algorithm under baseline and future scenarios for all sites ………..………………….…………….…... 32
Figure 19. High PG rating thresholds estimated using the RWIS-based algorithm under baseline and future scenarios for all sites ……………………………….…………….... 32
Figure 20. Days (from October 1) to reach critical freeze and thaw indices at the Winnipeg site under baseline and future scenarios ……………….….............................................. 35
Figure 21. Freeze season length at the Winnipeg site under baseline and future scenarios... 36

The Road Well-traveled: Implications of Climate Change for Pavement Infrastructure in Southern Canada iv
Page
Figure 22. Median number of days required to reach the critical freeze index for all sites under baseline and future climate scenarios …………………………………………... 37
Figure 23. Median number of days required to reach the critical thaw index for all sites under baseline and future climate scenarios …………………………………………... 37
Figure 24. Mean freeze season length for all sites under baseline and future climate scenarios …………………………………………………………………………...………..... 38
Figure 25. Standard deviation of freeze season length for all sites under baseline and future climate scenarios …………………………………………………...………….…….. 38
Figure 26. Occurrence of ‘freeze-free’ seasons for all sites under baseline and future climate scenarios …………………………………………………………………………... 39
Figure 27. CGCM2A2x and HadCM3B21 temperature and precipitation change scenarios (2050s) for the Manitoba site (Winnipeg)……………………………………..…………... 43
Figure 28a. Years to reach performance parameter limits (50% reliability maintenance thresholds) under no traffic growth scenario at the British Columbia site (Vancouver)…………………………………………………………………………………... 47
Figure 28b. Years to reach performance parameter limits (90% reliability maintenance thresholds) under no traffic growth scenario at the British Columbia site (Vancouver)…………………………………………………………………………………... 47
Figure 29a. Years to reach performance parameter limits (50% reliability maintenance thresholds) under no traffic growth scenario at the Alberta site (Edmonton)……………………………………………………………………….…………... 48
Figure 29b. Years to reach performance parameter limits (90% reliability maintenance thresholds) under no traffic growth scenario at the Alberta site (Edmonton)……………………………………………………………………….…………... 48
Figure 30a. Years to reach performance parameter limits (50% reliability maintenance thresholds) under no traffic growth scenario at the Manitoba site (Winnipeg)……………………………………………………………………..………….….. 49
Figure 30b. Years to reach performance parameter limits (90% reliability maintenance thresholds) under no traffic growth scenario at the Manitoba site (Winnipeg)…………………………………………………………………………..………... 49
Figure 31a. Years to reach performance parameter limits (50% reliability maintenance thresholds) under no traffic growth scenario at the Ontario site (Toronto)………………………………………………………………………..………..…... 50
Figure 31b. Years to reach performance parameter limits (90% reliability maintenance thresholds) under no traffic growth scenario at the Ontario site (Toronto)……………………………………………………………………………………... 50
Figure 32a. Years to reach performance parameter limits (50% reliability maintenance thresholds) under no traffic growth scenario at the Quebec site (Montreal)……………………………………………………………………………………... 51
Figure 32b. Years to reach performance parameter limits (90% reliability maintenance thresholds) under no traffic growth scenario at the Quebec site (Montreal)..... 51
The Road Well-traveled: Implications of Climate Change for Pavement Infrastructure in Southern Canada v
Page
Figure 33a. Years to reach performance parameter limits (50% reliability maintenance thresholds) under no traffic growth scenario at the Newfoundland site (St. John’s)…………………………………………………………………………..…………... 52
Figure 33b. Years to reach performance parameter limits (90% reliability maintenance thresholds) under no traffic growth scenario at the Newfoundland site (St. John’s)………………………………………………………………………………………… 52
Figure 34. Changes in IRI resulting from application of structure and traffic baselines from each study site to baseline climate and CGCM2A2x climate scenario data for Winnipeg, Manitoba……………………………………………………………………….. 53
Figure 35. Changes in longitudinal cracking resulting from application of structure and traffic baselines from each study site to baseline climate and CGCM2A2x climate scenario data for Winnipeg, Manitoba…………………………………………………… 54
Figure 36. Changes in alligator cracking resulting from application of structure and traffic baselines from each study site to baseline climate and CGCM2A2x climate scenario data for Winnipeg, Manitoba…………………………………………………… 54
Figure 37. Changes in AC rutting resulting from application of structure and traffic baselines from each study site to baseline climate and CGCM2A2x climate scenario data for Winnipeg, Manitoba…………………………………………………… 55
Figure 38. Changes in total rutting resulting from application of structure and traffic baselines from each study site to baseline climate and CGCM2A2x climate scenario data for Winnipeg, Manitoba…………………………………………………… 55
Figure 39. Changes in cumulative heavy trucks for no growth and 4 percent annual compound growth scenarios at Alberta, Ontario, and Manitoba sites…………….. 56
Figure 40. Changes in cumulative heavy trucks for no growth and 4 percent annual compound growth scenarios at Alberta, Ontario, and Manitoba sites…………….. 56

The Road Well-traveled: Implications of Climate Change for Pavement Infrastructure in Southern Canada vi
ACKNOWLEDGEMENTS The authors wish to thank the Government of Canada Climate Change Impacts and Adaptation Program (managed by Natural Resources Canada), Environment Canada, and the University of Waterloo for providing financial and in-kind contributions towards this project. This project would not have been accomplished without access to data or software from the Long Term Pavement Performance (LTPP) program (and contributing provincial agencies), National Cooperative Highway Research Program, and Environment Canada. The authors also acknowledge the efforts of Vimy Henderson, Patrick Leong, and Laurel Pentelow, who provided assistance with data analysis. This report does not necessarily represent the opinions or positions of the Government of Canada or of the University of Waterloo. Any errors and omissions are the responsibility of authors alone.

The Road Well-traveled: Implications of Climate Change for Pavement Infrastructure in Southern Canada vii
SUMMARY Relatively little research has been completed to investigate the potential impacts of climate change on pavement infrastructure despite the dependence of Canadian economic and social activity on road transport, and the documented influence of climate and other environmental factors on the deterioration of pavements. A review of pavement management practices and engineering models and approaches used to monitor, assess and predict flexible pavement performance revealed that climate—and thus potentially climate change—is an important consideration in at least three deterioration processes: thermal cracking, frost heave and thaw weakening, and rutting. As with other forms of infrastructure, the fundamental concern related to a changing climate in pavement management is the potential for premature design failure. Current and past designs generally assume a static climate whose variability can be adequately determined from records of weather conditions which normally span less than 30 years and often less than 10 years. The notion of anthropogenic climate change challenges this assumption and raises the possibility that the frequency, duration or severity of thermal cracking, rutting, frost heave and thaw weakening may be altered leading to premature deterioration. Two sets of case studies were undertaken in order to investigate these generalized impacts of climate change in greater detail. Results for both are contingent on the realization of mid-century changes in climate derived from the CGCM2A2x and HadCM3B21 global climate modeling experiments. These scenarios are moderate compared to those from other models. The first set of case studies examined deterioration-relevant climate indicators that are routinely applied or referenced in the management of pavement infrastructure. The analysis of minimum and maximum in-service pavement temperatures and freezing and thawing indices at 17 Canadian sites suggests that, over the next 50 years, low temperature cracking will become less problematic; structures will freeze later and thaw earlier with correspondingly shorter freeze season lengths; and higher extreme in-service pavement temperatures will raise the potential for rutting. The second set of case studies involved applying the newly developed Mechanistic-Empirical Pavement Design Guide (MEPDG) to assess the impact of pavement structure, material characteristics, traffic loads, and changes in climate on incremental and terminal pavement deterioration and performance. Evidence from the 6 Canadian sites that were evaluated was not as universal as that revealed through the first set of case studies but nonetheless suggested that rutting (asphalt, base and subbase layers) and cracking (longitudinal and alligator) issues will be exacerbated by climate change with transverse cracking becoming less of a problem. In general, maintenance, rehabilitation or reconstruction will be required earlier in the design life. The effect of climate change was found to be modest, both in absolute terms and relative to variability in pavement structure and baseline traffic loads. Pavement management systems in Canada are carefully engineered and adaptive. None of the potential impacts of climate change identified through the case studies fall beyond the range of conditions presently experienced in North America. Material and other construction, monitoring, and maintenance technologies exist to manage all of the identified problems and it is highly likely that agencies will make the necessary adjustments and investments (e.g., higher PGs) to preserve the primary paved network. However, the more significant impacts associated with changes in climate may well be realized on the secondary or tertiary networks of provincial and municipal agencies where weak pavement structures coincide with excessive traffic loads.

The Road Well-traveled: Implications of Climate Change for Pavement Infrastructure in Southern Canada viii
Results from this study should be thoroughly discussed within the engineering community. Moving from exploratory research that raises awareness of climate change to practical guidance aimed at reducing costs and safeguarding infrastructure will require additional effort and collaboration. To this end, the authors will continue to take advantage of opportunities to present and deliberate findings at meetings of the Transportation Association of Canada, Canadian Technical Asphalt Association, and the Transportation Research Board. Pavement engineers, with assistance from government and academic climate change experts, should be encouraged to develop a protocol or guide for considering potential climate change in the development and evaluation of future designs and maintenance programs. Such an activity might be initiated through the Transportation Association of Canada or other multi-stakeholder associations and leverage existing activities such as the implementation of MEPDG in Canada and the Canadian Climate Change Scenarios Network (CCSN). Incorporating other climate-related road infrastructure issues, for instance those associated with concrete pavements, surface-treated roads, airfields, bridges and culverts, would also be beneficial. Environment Canada and other agencies should work with pavement engineers to facilitate greater application of environmental data in the design process and operational management of road networks. At a minimum, long time series of historic climatic and road weather observations—ideally greater than 30 years in the case of climate—should be incorporated into analyses of pavement deterioration and applicability of Seasonal Load Restrictions (SLRs) and Winter Weight Premiums (WWPs) or assignment of performance graded materials. In terms of future research, more analysis is required to understand the interactive effects among environmental, structural, traffic, maintenance, and construction variables. Additional studies should be conducted to assess the implications of climate variability and change on the more vulnerable elements of the road network, including municipal roads and components of the provincial networks subject to SLRs. In particular, there is a need to further explore the influence of variable sequences of climate events from construction to reconstruction using a combination of simulation (i.e., MEPDG), laboratory material testing, and distress survey data. Where possible, this research should be conducted through partnerships with specific transportation agencies.

The Road Well-traveled: Implications of Climate Change for Pavement Infrastructure in Southern Canada 1
1.0 INTRODUCTION Anthropogenic climate change has been identified by the vast majority of atmospheric scientists and many world leaders as one of the most significant issues facing humanity. Human activities over the past two centuries, chiefly the large-scale combustion of fossil fuel, have raised the concentrations of greenhouse gases and aerosols in the atmosphere to levels that have measurably interfered with the planetary climate system (IPCC, 2001). Numerous efforts to model the impact of past and potential future global trends in emissions of carbon dioxide and other greenhouse gases have all arrived at the same conclusion—global mean temperature has and will continue to increase, perhaps as much as several degrees Celsius, over the next century. Accompanying this warming will be a substantive rise in sea levels and a net increase in global precipitation. The potential manifestations of global climate change at continental, regional, and local scales, and attendant impacts on ecosystems, society and economy, have been the subject of much study over the past two decades. A very small but growing portion of this literature has identified and examined potential implications for the demand, management, and operation of transportation systems and enabling infrastructure. In Canada, relevant research has been summarized by Irwin and Johnson (1990), Andrey and Snow (1998), Andrey and Mills (2003), and Andrey et al. (2004). A synthesis of potential Canadian impacts and sensitivities, conditioned by the amount of research completed and level of certainty in key climate change variables is presented in Table 1. The main conclusion from this research is that the effects of climate change on Canada’s transportation system will likely vary by region and mode. Table 1. Possible implications of climate change for Canadian transportation
Source: Mills and Andrey (2003)
The Road Well-traveled: Implications of Climate Change for Pavement Infrastructure in Southern Canada 2
Some northern settlements and coastal regions are expected to face serious challenges associated with changes in temperature and sea level, respectively; while there may be some benefits associated with milder winters in the more populated parts of Canada. All modes are expected to face some new problems, but each may also experience some reduced costs. There is also a growing awareness that public agencies and private industries need to consider adaptive strategies related to design and/or operational practices in response to changing conditions (Andrey et al., 2004). Road infrastructure and operations in southern Canada remain among the least studied of those sensitivities listed in Table 1. The Canadian road system is a valuable resource, both in absolute terms and relative to other transportation modes. Richardson (1996) estimated that the asset value of the system was about $100 billion. In 2002-03, Canadian local, provincial/territorial and federal government agencies invested over $14 billion in roads, roughly 72 percent of investment in all transportation modes (TC, 2003). Canadian economic and social activities are highly dependent on road surface transportation. By the late 1990s, revenue generated by commercial freight and passenger shipping via trucks and buses exceeded that of all other modes combined (TC, 2003). In 2002, trucks carried 63 percent of the $531 billion worth of goods traded with the United States while automobiles accounted for almost 92 percent of the 188 million domestic trips1 taken in Canada (TC, 2003). According to the Canadian Vehicle Survey, Canada’s 17.3 million light vehicles generated over 500 billion passenger-kilometres worth of travel in 2000 (TC, 2000). The distribution of travel is generally proportional to population, with concentrations in Ontario, Quebec, Alberta and British Columbia. Many of these benefits are concentrated along the high-volume paved road portion2 of the Canadian road network, broken down by jurisdiction and class in Table 2. Although high-volume paved roads represent about 15 percent of the 1.4 million kilometre road network, they are responsible for the vast majority of intra-provincial, inter-provincial and Canada-U.S. road movements (TC, 2002; TC, 2003). Traffic is especially concentrated on the 24,000 kilometres that constitute the National Highway System (TC, 2002). The mobility and wealth afforded by the road system is underwritten by substantive costs, including the direct capital and maintenance expenditures alluded to previously. More significant are externalized costs that include roughly 2,900 motor vehicle collision fatalities each year (Andrey, 2000) and a substantial portion of Canadian emissions that contribute to air pollution and global anthropogenic climate change. Given the considerable asset value of the road system, the dependence of Canadian economic and social activity on road transport, and the documented influence of climate and other environmental factors on the deterioration of pavements (Nix et al., 1992; Haas et al., 1999) Environment Canada, the University of Waterloo, and the Government of Canada Climate Impacts and Adaptation Program, proposed and supported a research project to examine the impacts of climate change on pavement infrastructure in southern Canada. This project focused on the management of flexible (i.e., asphalt) pavement infrastructure, which is most often encountered on roads and highways, but is also extensively used at airports, and for institutional and private industrial, commercial and residential applications (parking areas, drives, entrances, cycle paths, walkways, etc.). The emphasis in the project is on road infrastructure. 1 refers to same-day and overnight trips greater than or equal to 80km from usual place of residence, excluding those to work or school 2 includes: freeways, primary and secondary highways, arterial roads

The Road Well-traveled: Implications of Climate Change for Pavement Infrastructure in Southern Canada 3
Table 2. Canadian road network distribution (2002)
Two-lane equivalent km (thousands) Jurisdiction Freeway Primary
Highway Secondary
highway/major arterial
Local street/rural
road
Total
Newfoundland and Labrador
0.2 1.4 5.4 20.1 27.1
Prince Edward Island 0.0 1.3 2.2 2.9 6.5 Nova Scotia 1.6 2.8 3.3 40.9 48.7 New Brunswick 1.3 1.5 6.2 67.5 76.6 Quebec 5.0 10.9 15.1 197.3 228.3 Ontario 5.7 10.2 34.2 180.4 230.6 Manitoba 0.2 8.2 10.8 85.3 104.5 Saskatchewan 0.1 20.5 12.6 216.8 250.0 Alberta 1.4 15.5 17.3 171.1 205.3 British Columbia 1.3 9.9 5.2 188.5 204.8 Yukon Territory 0.0 2.6 0.9 12.5 16.1 Northwest Territories 0.0 0.8 1.3 8.1 10.1 Nunavut 0.0 0.0 0.0 0.1 0.1 Total 16.9 85.8 114.6 1191.6 1408.8 Percent Share 1.2 6.1 8.1 84.6 100.0 Source: TC 2003, Table A7-1 This report documents project findings. Section 2 provides a review of literature relevant to understanding the implications of climate change for pavement infrastructure in southern Canada. First, a general review of pavement management practices and approaches in Canada is provided. This is followed by a synthesis of research into weather and climate sensitivities and adjustments and finally an account of completed research into the impacts of climate change. Section 3 of the report documents the approach, methods, data, and findings of impact analyses informed by the literature review and consultations with the engineering community. Results, conclusions and recommendations are discussed and presented in Section 4.

The Road Well-traveled: Implications of Climate Change for Pavement Infrastructure in Southern Canada 4
2.0 LITERATURE REVIEW A literature review was conducted using standard Internet and library research tools supplemented by informal consultations with transportation engineering professionals. The synthesis and assessment of peer-reviewed journal articles and other technical literature was focused around the following themes which are elaborated in subsequent sections: • pavement management in Canada, including engineering models and approaches used to
monitor, assess and predict flexible pavement performance; • effects of weather and climate on road infrastructure and pavement performance; and • potential implications of anthropogenic climate change on pavement infrastructure. 2.1 Management of Pavements in Canada Traditionally, the Canadian road network has been largely funded, constructed, operated and maintained by provincial/territorial transport ministries and local or regional municipal authorities. These agencies accounted for over 96 percent of government expenditure on road transportation in 2002-03, the remainder coming from federal programs. Over the past 20 years, government agencies have devolved many functions to the private sector. Increasingly, the role of government agencies is to establish standards and to manage and assure the quality of work contracted to private consultants and companies for design, construction, operation and maintenance services. In some jurisdictions (e.g., Alberta, Ontario), multi-year contracts are tendered for the operation and maintenance of entire sections of road networks for the duration of their service life. While this shift in organization generates economic efficiencies, it introduces additional “players” into the management of pavements and places a greater emphasis on standards, guidelines and quality assurance. Industry, stakeholder and professional engineering associations (e.g., Transportation Association of Canada, Municipal Engineers Association, AASHTO, etc.) actively participate with government agencies to meet this challenge by developing new standards, tools and technologies to address this emerging need for performance-based management. Operationally, pavement management exists at the network and project (or section) levels for a given jurisdiction. The primary function at the network level is to acquire and evaluate data for component sections, determine needs and develop priority schedules for construction, maintenance and rehabilitation. As noted in Figure 1, network level decisions are driven by financing, budgets and agency policies (Haas, 1994). The project or section level is primarily concerned with evaluating in detail those sections identified as requiring attention at the network level. Detailed technical decisions and designs for construction and maintenance activities involve the collection and analysis of site-specific data and are heavily influenced by standards and specifications, budget limits and environmental constraints.
The Road Well-traveled: Implications of Climate Change for Pavement Infrastructure in Southern Canada 5
Data (location, inventory, propertiesperformance, evaluation, etc.Deficiencies/Needs (current & future)Alternative strategies and life-cycle analysisPriorities, programs, schedules
PROGRAM / NETWORK /SYSTEM-WIDE LEVEL
PROJECT / SECTION LEVELData (materials, properties, traffic / flows /loads, unit costs, etc.)Detailed designConstructionMaintenance
ONGOING, IN-SERVICEMONITORING & EVALUATION
DATABASE
FinancingBudgets
Agency Policies
Standards andSpecificationsBudget Limit
EnvironmentalConstraints
Figure 1. Operating levels for pavement management (Haas, 1997) Measures of Pavement Performance Assessing pavement performance involves measuring the ability of a particular section of pavement to meet the assumed needs of users—a comfortable, safe and cost-effective ride with minimal delay. A variety of measures of pavement performance have been identified in the literature, including those related to ride quality, surface distress, structural adequacy, surface friction, surface drainage, and noise as well as several composite indices (Tighe, 2001). These are described in the following sections and then integrated into a network-level life cycle cost effectiveness framework as proposed by Tighe (2001). Ride Quality The primary operating characteristic of road pavements is the level of serviceability or ride quality provided to users. Longstanding measures that have been used in North America are the Present Serviceability Index (PSI) and Riding Comfort Index (RCI), which are assessed on scales of 0 to 5 and 0 to 10, respectively (Tighe, 2001; Liu and Herman, 1996). Since these measures are subjective, correlations with summary statistics from objective, repeatable, high-speed profiling measurements are used for regional calibration purposes. One such statistic is the International Roughness Index (IRI), calculated by simulating a standard quarter-car passing over a longitudinal profile and measured in metres of vertical motion per kilometre of road length (Tighe, 2001; Haas, 2001). Paterson (1986) developed the following model, currently used in the South Carolina Pavement Management System, which relates PSI to IRI: PSI = 5 ∗ e-0.18 IRI (1)

The Road Well-traveled: Implications of Climate Change for Pavement Infrastructure in Southern Canada 6
Few studies have compared driver acceptability ratings or satisfaction with ride quality or surface distress indices (Hall, 2001)—and those that have show mixed results. For instance, Shafizadeh and Mannering (2003) observed that IRI values and maintenance thresholds match well to driver acceptability ratings in Washington State. However, based on a series of focus groups and sample surveys in three Midwest states, Giese et al. (2001) found that IRI and other pavement condition variables explained less than 5 percent of the variation in driver satisfaction. Surface Distress Most road and airport authorities periodically measure and evaluate the surface distress of their pavements. Distresses include ruts, various forms of cracks (longitudinal, transverse, alligator, block), patches, potholes, and ravelling. Many agencies have developed distress survey manuals (e.g., Texas DoT, Chen et al., 2003) that establish protocols for measuring the type, severity, extent and location of the distresses. These should contain a comprehensive description and photograph of each distress type (typically 10-15), severity level (usually slight, moderate and severe), and density or extent (normally 2-5 levels). One of the more comprehensive manuals was developed through the Strategic Highway Research Program (SHRP, 1990). Surface distress data can be used to establish a maintenance program whereby feasible treatment decisions are defined and prioritized in terms of the specific type, severity and density of distress (or combination of distresses). However, road, airfield, off-road area and other users generally place a low to medium level of importance on this measure, unless severe levels of rutting, pot holes, surface distortions, or cracking are encountered. For an aggregate picture of paved sections, or the network as a whole, it is common to use a Surface Distress Index measure (SDI), on a scale of 0 to 10 or 0 to 5. Some agencies use a Pavement Condition Index measure (PCI), on a scale of 0 to 100. All of these indices use a “deduct number” approach, where any distresses that appear are deducted (on a weighted basis) from the maximum or perfect scores. As with ride quality indices, efforts have been made to understand the variability in subjective surface distress ratings (Goodman, 2001; Landers et al., 2003) and to relate these indices to more objective standard measures like IRI (e.g., Dewan and Smith, 2002). Structural Adequacy Except in extreme cases of pavement collapse, the driving public and most other users are insensitive to changes in structural adequacy. However, structural adequacy measures are critical tools for engineers who manage pavements. The common procedure for evaluating structural adequacy is deflection testing, with the major device of choice being the Falling Weight Deflectometer (FWD) (AASHTO, 1993). While this mechanism is non-destructive to the pavement, FWD deflection data must be interpreted carefully to account for variations in damaged layers, pavement thickness and temperature (Mehta and Roque, 2003). Deflection data are often used directly in the design of rehabilitation strategies. For evaluation purposes at the section or network level, deflection data can also be transformed into a Structural Adequacy Index (SAI) (Haas, 1994). The transformation works through establishing a maximum tolerable deflection (MTD) for the expected number of equivalent single axle loads (ESALs), and then comparing the measured deflection to the MTD. If they are equal, the SAI of the pavement is 5

The Road Well-traveled: Implications of Climate Change for Pavement Infrastructure in Southern Canada 7
(on a 0 to 10 scale). Deductions are assigned where measured deflections are greater than MTD (SAI<5) thus indicating a structurally inadequate pavement. Additions or bonuses are assigned when measured deflections are less than MTD (SAI>5), indicating a structurally adequate pavement. The SAI thus provides an aggregated measure for summarizing the structural status of a section or network. Similar in concept, the structural condition index also provides a relative measure of adequacy (Zhang et al., 2003). Surface Friction, Drainage and Safety Surface friction is a measure of pavement safety and therefore of high importance to road and airfield users and managers. A function of the macrotexture and microtexture of the pavement, surface friction can be measured by a number of different methods (e.g., ASTM3, AASHTO4 and RILEM5 standards). Over the past decade, efforts have been made to develop an integrated International Friction Index (IFI) (Fülöp et al., 2000). While surface friction data is important to pavement managers, particularly as a stand-alone “trigger” for maintenance or rehabilitation, few agencies publish minimum thresholds because of litigation risk. Many do not even collect such data on a network-wide basis. Instead, they identify and evaluate sections that may be more likely to develop low friction factors—as determined by examining accident history, historical skid resistance data, pavement material, road geometry, or reports from maintenance staff or the public (Innes et al., 1998). Effective surface and internal pavement drainage are important to pavement performance and for reducing long-term maintenance costs (Birgisson and Ruth, 2003). While pavement engineers are concerned about both surface and internal drainage, drivers are most sensitive to the former, whether related to rainfall or melting snow. Standing water and visibility-impairing spray from other vehicles are perceived as factors that reduce the quality of the ride and affect safety (e.g., greater risk of dynamic hydroplaning) (Black and Jackson, 2000; Hassan et al., 1998; Andrey et al. 2001). Normally, effective drainage is accomplished with sufficient crossfall and adequate slope to a drainage outlet—specific geometric design criteria are generally well-established (e.g., TAC, 1999). In addition, porous or open surface courses have found considerable use in that they can substantially reduce the amount of splash created by vehicles (Ranieri, 2002). While assessments of surface drainage characteristics are conducted as a normal part of post-construction or rehabilitation quality assurance, agencies do not systematically monitor for surface drainage problems over the long-term but rather rely upon reports from staff and the public to identify problem sections. Surprisingly few studies have demonstrated a strong link between surface road condition and safety (Tighe et al., 2000; Andrey et al., 2001) let alone defined the independent, confounding or synergistic effects of weather (e.g., road wetness, snowcover, ice, etc.) and non-weather (e.g., pre-existing macrotexture, microtexture, rutting, etc.) elements. This is partly attributable to the fact that primary network roads are maintained to standards above minimum threshold friction levels. For instance, collision data derived from police accident reports for Manitoba imply that more than 96 percent of injuries (and injury collisions) occur on good roads (Figure 2). While there is evidence of an inverse, statistically significant relationship between collision incidence and friction, regression models are limited in their capability to explain wet-weather collision incidence for small spatial and temporal units (Herman, 1984; Xiao et al., 2000, Andrey et al., 2001). In addition to friction, 3 American Society for Testing and Materials (now ASTM International) 4 American Association of State Highway and Transportation Officials 5 'Réunion Internationale des Laboratoires et Experts des Matériaux, Systèmes de Constructions et Ouvrages

The Road Well-traveled: Implications of Climate Change for Pavement Infrastructure in Southern Canada 8
researchers have examined the effects of rutting and surface roughness on collisions. Start et al. (1998) analyzed rut depth, traffic volume and collision data for rural highways in Wisconsin and reported significant increases in accident rates as average rut depths6 exceeded 7.6mm. A Jordanian study of rural roads revealed significant positive and negative relationships between IRI levels and multi-vehicle and single-vehicle accident rates, respectively (Al-Masaeid, 1997).
Manitoba (1984-2000) - % All Injuries by Road Condition
96.82%
0.91%
1.31%
0.96%
GoodDefectivePothole/Rut/BumpUnder Repair
Source: TRAID (Transport Canada) Figure 2. Manitoba motor vehicle collision injuries reported by road condition (1984-2000) Noise Noise levels are important to vehicle occupants and to people living or working in buildings and neighbourhoods adjacent to roads (Walton et al., 2004; Kaku et al., 2004; Ohrstrom, 2004). The degree of noise is a function of vehicle type (including tire qualities), operating speed and acceleration, and characteristics of the road surface (roughness, texture pattern and degree of porosity) (Phillips, 2002). Several methods have been developed to evaluate and predict road noise, including standardized instrumented roadside and tire measurements (e.g., statistical pass-by, Phillips, 2002) and simulation software designed to model noise as a function of vehicle type, traffic flow, pavement characteristics, topography, weather and a range of noise-buffering interventions (e.g., FHWA TNM®, Lee and Rochat, 2002; Berengier and Anfosso-Ledee, 1998). The most commonly used unit of sound measurement is the A-weighted pressure level (dBA) which corresponds to the range of frequencies to which humans are most sensitive (about 1,000 to 10,000 Hz). It is usually expressed as an accumulation of sound energy over the period of interest and normalized to 1 second. Increasingly, new pavement technologies and rehabilitation/maintenance procedures are being developed to control excessive noise (e.g., porous asphalt, Gołebiewski et al., 2003).
6 average rut depth for both directions of 1.8km segments was unit of analysis

The Road Well-traveled: Implications of Climate Change for Pavement Infrastructure in Southern Canada 9
A Combined Index to Measure Customer Benefits Tighe (2001) proposed aggregating data acquired from many of the in-service measurements reviewed previously into a multi-level index to measure benefits to drivers and other customers (Figure 3). The first level consists of direct field measurements, while the second level involves a transformation of these values into a series of indices which are explained in detail by Haas (1994). The final level consists of aggregating all three individual indices into an overall composite, such as Pavement Quality Index (PQI). Due to its significance for safety concerns, surface friction is maintained as a stand-alone measurement. Although information is lost at each level of aggregation, a single composite index serves as an effective tool for communications with senior administrators, elected officials and the public.
Level 1 (Basic Measurement) Level 2 (Index) Level 3 (Index)
Roughness
Surface Distress
Deflection
Surface Friction
PSI, RCI, etc.
SDI, PCI, etc.
SAI, etc.
PavementQuality
Index, PQIApplication of Deduct Values
Summary Statistic and CorrelationWith Subjective (User) Rating
Application of Deduct Values
Friction Factoror Skid Number
Friction Factoror Skid Number
Notes: PSI (Pavement Serviceability Index ), RCI (Ride Comfort Index), PCI (Pavement Condition Index), SAI (Structural Adequacy Index), PQI (Pavement Quality Index)
Figure 3. Levels of aggregation for measures of customer benefits (Tighe, 2001) Life Cycle Cost Effectiveness Measures of pavement performance are important inputs to Life-Cycle Cost Analysis (LCCA). LCCA provides a means to establish the relative cost-effectiveness of flexible pavement maintenance and rehabilitation options at the project and network scales and is thus an important aspect of pavement asset management (Haas et al., 1994; Vadakpat et al., 2000). General best practices or recommended procedures for conducting LCCA have been published (e.g., FWHA, Wall and Smith, 1998) and other researchers have described complementary or alternative probabilistic and optimization approaches (Tighe, 2001; Ouyang and Madanat, 2004; Abaza, 2002; Li and Madanat, 2002). Recent advances in information technologies are making the entire process of LCCA and pavement management more efficient, cost-effective, standardized and thus operational at the provincial, state and local agency or operator levels (e.g., Tsai and Lai, 2002). For public transportation agencies, an appropriate way to maximize customer benefits is to maximize life-cycle cost effectiveness of funds expended on the entire pavement network, as summarized by Tighe (2001) in the following four key steps: 1. determining pavement needs, 2. identifying treatment alternatives, 3. calculating life-cycle cost-effectiveness, and 4. optimizing and identifying priority programs.
The Road Well-traveled: Implications of Climate Change for Pavement Infrastructure in Southern Canada 10
Step One: Determining Pavement Needs Pavement needs or deficiencies are determined in terms of one or more of the pavement performance measures introduced in the previous section (i.e., roughness, or some index such as IRI, PSI or RCI; surface distress, or some index such as SDI or PCI; deflection, or some index such as SAI; surface friction; or a combined index, such as PQI) (Tighe, 2001). Specific criteria or thresholds may vary by type and functional class of road, size of the paved road network, and the resources, budget and policies of a particular agency. It has been acknowledged that these measures and associated criteria are designed to reflect rehabilitation rather than preventive maintenance needs (Zimmerman and Peshkin, 2003). Once criteria are established, performance or deterioration models applicable to both new pavement structures and rehabilitated pavements are required to identify when and where particular sections within the network may require maintenance or rehabilitation (Tighe, 2001). It is generally assumed that pavement performance can be adequately measured in terms of these criteria and that future conditions can be predicted with adequate knowledge of current pavement conditions, pavement thickness, material properties, cumulative traffic load and environmental conditions (Hong and Somo, 2001). Several examples of deterioration models are identified later in this report. When a pavement section reaches the limit specified (e.g., PSI of 2.0 for collector roads), it becomes a need. However, the needs year is only one of several possible action years—interventions can be made at any point along the deterioration curve (Figure 4) and therefore defer or advance rehabilitation. At the network level, there are many possible combinations of sections, action years and rehabilitation alternatives, and thus a priority analysis is required to determine which combinations represent the best overall value for the available budget (Haas, 2001).
Prediction ofFutureDeterioration
PastDeterioration
MinimumAcceptable Remaining
Service Life
ConstructionYear
Now NeedsYear
Pavement Age
Meas
ure o
f Dete
riora
tion (
i.e., R
CI)
i
j
k}
RehabilitationAlternatives
Figure 4. Needs year and possible action years for pavement rehabilitation (Haas, 2001)

The Road Well-traveled: Implications of Climate Change for Pavement Infrastructure in Southern Canada 11
Step Two: Identifying Treatment Alternatives Treatment alternatives for deteriorated pavements include rehabilitation, preventive maintenance (such as chip seals, slurry seals, crack sealing, thin overlays), and corrective maintenance (such as hot- and cold-mix patching). Preventive and corrective actions are usually taken at levels of pavement deterioration considerably above or below the tolerable limits, respectively. Because the number of practical or feasible treatment alternatives for any particular situation is usually limited, a decision process ranging from simple judgement to a decision tree or expert systems approach is commonly used for screening purposes. Those treatments that are feasible are then considered in the priority analysis (Tighe, 2001). Step Three: Life-Cycle Cost-Effectiveness Calculations In order to compare any set of treatment alternatives for a given section and timing combination, a life cycle analysis is required. The following types of costs have been identified and considered in the literature (Tighe, 2001; NCHRP, 2004a): 1. Cost of the actual rehabilitation and maintenance work that occurs within the life cycle, minus
the residual value at the end of the life cycle; 2. Vehicle operating costs; 3. User delay costs; 4. Accident costs due to traffic hazards or interruptions associated with the rehabilitation or
maintenance; and 5. Environmental damage (e.g., air, water, and noise pollution). The direct costs of rehabilitation and maintenance are relatively straightforward to calculate as they can be estimated from actual capital, material, equipment and labour expenditures made by agencies. Vehicle operating costs (VOCs) consist of fuel, oil, maintenance, tires, and mileage-related depreciation (Vadakpat et al., 2000) and vary with road roughness. For example, Dewan and Smith (2002) estimated IRI from pavement distress data (PCI) to calculate vehicle operating costs for the San Francisco Bay area. Although related to roughness, VOCs are also influenced by differences in vehicle fleets and factors that affect travel demand and thus must be calibrated to specific regions (Tighe, 2001). User delay costs can be substantial for interruptions on high volume roads—even greater than the cost of the rehabilitation or maintenance project (Haas, 2001). Costs may be broken into three main components: 1) time costs and inconvenience to road users, vehicle occupants and others who detoured or were denied use of the road; 2) extra shipment or inventory-carrying costs; and 3) extra VOCs (Tighe, 2001; Vadakpat et al., 2000). Al Assar (2000) described a simplified user delay cost model that can be used to assess various traffic management plans, traffic volumes, and other scenarios. Orders of magnitude differences in costs (US$250-375,000) were demonstrated for a typical 2-lane highway resurfacing project by comparing two traffic control plans and two Annual Daily Traffic (AADT) volumes (5k and 10k vehicles/day). Accident costs, environmental damage and non-user costs in general are very difficult to reliably quantify in economic terms at scales appropriate for inclusion in pavement LCCA (Vadakpat et al., 2000). While undoubtedly real, in the absence of credible estimates, most agencies omit or only qualitatively refer to these costs when performing LCCA (Tighe, 2001).
The Road Well-traveled: Implications of Climate Change for Pavement Infrastructure in Southern Canada 12
When comparing various options, most road agencies express costs and benefits on a present worth basis (NCHRP, 2004a) whereby all future costs are discounted back to the present, as follows: Present Worth of Costs=Future costs x PWF (2)
Where: PWF= present worth factor = 1/(1+i)n n = number of years to when the cost or benefit is incurred i = discount rate
For example, if the cost of alternative k at year A is $100,000 per lane-km, A is 3 years from now and i = 5%, then the present worth of cost would be $100,000 x [1/(1+0.05)3] = $80,600. The relative effectiveness between a rehabilitation treatment and deferred rehabilitation option can be considered as the net area beneath the deterioration curve, as illustrated in Figure 4, multiplied by section length and by traffic volume. It is, therefore, directly proportional to benefits, and can be used as a surrogate. If effectiveness is divided by cost, it can be used as a “cost-effectiveness” measure (Haas, 1994). Step 4: Optimization and Priority Programs True optimization would identify the best possible combinations of treatment alternatives for the identified sections and timing over a specified program period and for a specified budget (e.g., Ouyang and Madanat, 2004). Priorities can also be defined using less sophisticated methods, including the simple ranking of sections on a subjective basis. However, this may result in programs that are far from optimal. A particularly convenient method, which is close enough to true optimization for practical purposes, is that of marginal cost-effectiveness (FHWA, 1990). It considers all of the possible combinations and is being used by a substantial number of state, provincial and local agencies.

The Road Well-traveled: Implications of Climate Change for Pavement Infrastructure in Southern Canada 13
2.2 Impact of Climate and Weather on Pavement Performance and Deterioration Weather and climate factors interact with traffic, construction, structural and maintenance characteristics to influence pavement deterioration and performance (Figure 5). Theoretically, it should be possible to discern the relative and interactive effects of these variables; however, in practice this remains a significant research challenge (Haas, 2001). Nevertheless, engineers have developed many empirical and mechanistic-empirical approaches to model pavement performance or underlying deterioration mechanisms as a partial function of these variables. Climate has been identified as an important consideration in three processes: thermal cracking, frost heave and thaw weakening, and rutting.
Figure 5. Factors affecting road performance (Haas, 2004) Thermal Cracking Thermal cracking is a type of distress that affects the structural (load-carrying capacity) performance of a pavement. There are two main types of thermal cracking. The first type is low-temperature transverse cracking where cracks follow a course approximately at right angles to the pavement centre-line and tend to be regularly spaced along the length of the road (Shenoy, 2002). The second type is thermal fatigue cracking which is triggered by the degradation of pavement material properties due to aging and accumulated residual stresses due to a large number of thermal loading cycles. Extensive cracking leads to reductions in ride quality and facilitates the movement of water, air and fine particles through the pavement structure, thereby accelerating deterioration, further reducing ride quality and increasing maintenance and rehabilitation requirements (Sebaaly et al., 2002; Tighe, 2001; Epps, 2000; Shen and Kirkner, 2001; Konrad and Shen, 1997). Cracking is an important component of surface distress indices—in deterioration models it is most often measured in terms of total crack length per unit of road length or area. Field data are often

The Road Well-traveled: Implications of Climate Change for Pavement Infrastructure in Southern Canada 14
complemented with laboratory tests such as the Thermal Stress Restrained Specimen Test (TSRST) and Indirect Tensile Creep Strength Test (ITCST) (Raad et al., 1998). Thermal cracking is significantly influenced by material homogeneity, ductility of asphalt concrete, frictional constraint on the interface between pavement layers, and the rate of cooling (Shen and Kirkner, 2001). As temperatures cool and pavement contracts, frictional constraint and tensile stress build up until the stress exceeds the tensile strength of the pavement resulting in cracking (Raad et al., 1998; Sebaaly et al., 2002). Asphalt thickness, minimum temperature, coefficient of thermal contraction, and temperature susceptibility of the AC have been shown to significantly affect the spacing of cracks (Haas et al., 1997; Raad et al., 1998). While critical temperature thresholds will vary depending on pavement characteristics, Epps (2000) observed that low temperature cracking generally occurs at temperatures below -7°C, especially when the rate of cooling is rapid, while thermal fatigue cracking most commonly occurs through the accumulation of daily thermal cycles or loads between -7°C and 21°C. The extreme fracture temperature of a pavement hardened through age may be 10°C warmer than for new asphalt (Konrad and Shen, 1997; Kliewer, 1996). Age-hardening can be exacerbated by extreme maximum pavement temperature. While extreme minimum temperature and thermal load cycle thresholds seem to trigger cracking, some have observed that the maximum temperature reached in pavements during service may be a major factor controlling the ultimate level of age-hardening in the field (Kliewer et al., 1996). Higher temperatures potentially lead to premature age-hardening and a more brittle pavement that is more prone to low temperature cracking. Easa et al. (1996) caution that aging, penetration and softening point models may not be reliable beyond 8 years of pavement life. Others note the significance of a related process, micro-cracking, which is largely a function of differing thermal contraction coefficients between the asphalt matrix and aggregate at low temperatures (El Hussein et al., 1998). Pavement durability is reduced as hairline cracks deteriorate the asphalt-aggregate interface and lower the fracture toughness of AC. Extensive stripping is possible once moisture gains entry through hairline cracks (Hussein et al., 1998; TRB, 2004). Weather conditions also influence maintenance activities, especially the effectiveness of sealants used to repair cracked pavements. Cold temperatures have been associated with increased frequencies of premature de-bonding and pullout of bituminous crack sealant (Masson et al. 1999). Frost Heave and Thaw Weakening Frost heave and associated thaw weakening are likely the most important climate-related processes that affect pavement deterioration in Canada. However, there is no up-to-date, comprehensive review7 of the implications of freeze-thaw cycles and deep-frost penetration for pavement performance—from either a methodological or costing perspective. Frost heave is the rise in a pavement surface caused by the freezing of pore water and/or the creation of ice lenses in the underlying layers (TAC, 1997). Heaving is mostly an issue for poorly 7 A study that considers the effects of multiple freeze cycles and deep frost penetration on pavement performance is currently being conducted by Nichols Consulting Engineers, under contract U.S. DTFH61-02-D-00139, using Longterm Pavement Performance (LTPP) data.
The Road Well-traveled: Implications of Climate Change for Pavement Infrastructure in Southern Canada 15
constructed primary or secondary roads that have fine-grained subgrades and are located in regions that experience frequent freeze-thaw cycles and high amounts of precipitation (Haas et al., 2004; Tighe et al., 2001). Low-volume roads in seasonal frost areas8 are particularly vulnerable (Kestler, 2003). Doré (1995) developed a cracking model for frost conditions that takes into consideration the frost susceptibility of the subgrade soil, freezing index, precipitation, and the total thickness of the structure. He suggested that cracking in frost conditions is a two-phase phenomenon. The first phase is initiation during which pavement resists frost heave induced stresses. The second phase is crack propagation, which begins as soon as the first crack appears. Heaving-related damage is also reflected in surface roughness which can be interpreted from the longitudinal profiles of pavement sections (Fradette et al., 2005). Doré (2002) studied the profile wavelengths of 24 Canadian Long Term Pavement Performance (C-LTPP) sites. He observed that longer wavelength distortions (>8m) were common for sections with high fines content and indicative of frost-related subgrade deformation or displacement (Doré, 2002). Few, if any, road deterioration models incorporate the number of freeze-thaw cycles as an independent variable9, despite its obvious importance in frost-related action (Haas et al., 2004). A notable exception is an analysis of results from the AASHTO road tests (White and Coree, 1990). Many models do make use of a “freezing or frost index”, which provides a measure of the air temperature throughout the freezing period. The freezing index, along with soil properties (e.g., porosity, density, saturated permeability, coefficient of uniformity/curvature, hydraulic conductivity, moisture retention), can be used to predict depth of frost penetration (e.g., through the modified Berggren equation, CRRL, 2002), extent of frost cracking (e.g., Joint CSHRP/Quebec Bayesian Application Project, 2000a) and site effects in pavement deterioration models (e.g., Raymond et al., 2003). In most applications, the frost index is calculated as an additive value based on seasonal data or longer-term climatic averages: FI = Σ (0°C – Td), (3)
where: FI (frost index); Td<0; Td (mean daily temperature).
Early work showed that there was a logarithmic relationship between the index calculated in this way and depth of frost penetration (e.g., Brown, 1964). Alternatively, Boutonnet et al. (2003) and others have calculated the frost index as the difference between the maximum and the minimum of the cumulative degree-C days below zero for a season. One limitation of the frost index, and other environmental variables derived from climatic data, is that it does not adequately capture the sequencing of weather events (Uzan, 2004). Indeed, it is possible to obtain the same index value when a site experiences one long cold spell as when it experiences several short cold spells (Sherwood and Roe, 1986)—despite the fact that these different weather scenarios have different implications for pavement performance. The treatment of climate data in design (i.e., sampling frequency, averaging) also may have important effects on pavement design life. Zuo et al. (2002) showed that pavement life could be overestimated by 50-75 percent if hourly temperatures are aggregated into monthly averages. Thus, additional research is
8 In Kestler (2003), seasonal frost areas defined as areas that experience an average T <=0°C in any calendar month at least once in 10 years; or where frost penetrates to a depth of 0.3m at least once in 10 years 9 it is most often handled through regional calibration (Haas et al. 2004)

The Road Well-traveled: Implications of Climate Change for Pavement Infrastructure in Southern Canada 16
required to critically assess the relevance of the frost index and other variables to vulnerability assessments and pavement performance practices, and possibly to develop modified/alternative indices. There is growing evidence that a large proportion of frost-related damage occurs during the thawing period. Many empirical and mechanistic-empirical models have been developed to predict the strength of pavements and constituent layers—all invariably demonstrate that minimum pavement strength, usually measured in terms of resilient moduli based on FWD data, corresponds with spring thawing and heightened water content of the unbound layers (Samson and Fréchette, 1995; Simonsen et al. 1997; Jong et al. 1998; Watson and Rajapakse, 2000; Birgisson et al., 2000; Marshall et al., 2001; Heydinger, 2003; Uzan, 2004; Haas et al., 2004). Conversely, the strongest pavement conditions are realized when the pavement structure is completely frozen and relatively free of moisture. Precipitation (total accumulation and event frequency) has been shown to be important for damage because it affects water availability (e.g., CSHRP/Quebec roughness models (2000) were found to be sensitive to precipitation amount). Several jurisdictions currently use a “thawing index” to predict the penetration of thaw and the onset of thaw weakening as a basis for SLRs and WWPs (e.g., C-SHRP, 2000; Manitoba Transportation and Government Services, 2004; Minnesota DOT, 2004; Clayton et al., 2006, Montufar et al., 2006; Huen et al., 2006). Others recommend a mechanistic approach based on in-situ measurements (Montufar and Clayton, 2002). The implications of not posting SLRs or removing WWPs are significant—Minnesota research suggests that being one week late in posting SLRs or one week late in removing WWPs could shorten pavement life by 4-12 percent (Montufar and Clayton, 2002). Thawing indices are a relatively recent management tool and tend to be region-specific. There is a need to critically assess their usefulness in pavement performance and to develop a rigorous approach for regional calibration and comparison. For Manitoba conditions, Watson and Rajapakse (2000) related resilient moduli of the asphalt concrete, base and subbase layers to air and pavement temperature. Once thawing commenced, a summation of hourly temperature values above 0°C produced a suitable index—the inclusion of below-zero temperatures resulted in very poor correlations with resilient moduli. They concluded that the strength of pavement varies considerably when temperatures are below 0°C (5000 times stronger at -20°C relative to 0°C) and only weakens slightly as temperature increases beyond freezing. The most critical period of weakest pavement conditions was found to occur when the asphalt temperature exceeds 0°C and the unbound (base) layers are melting—a condition that developed in the case study after the thawing index reached 823°C•h (Watson and Rajapakse, 2000). Several studies have attempted to develop empirical relationships between environmental variables and pavement performance measures. Hong and Somo (2001) examined data from Brampton, Ontario and showed that mean RCI was significantly affected by uncertainties in subgrade modulus and the actions of traffic and environment. Insufficient consideration of these uncertainties could lead to unrealistic estimates for timing of appropriate maintenance or rehabilitation actions.
The Road Well-traveled: Implications of Climate Change for Pavement Infrastructure in Southern Canada 17
Rutting Rutting is a distortion occurring in the wheel paths of an asphalt concrete (AC) pavement (TAC, 1997). It results from densification and permanent deformation under the load, combined with displacement of pavement materials, and affects the “functional” performance (i.e., ride quality and safety) of a pavement (NCHRP, 2004). It has also been used as a primary indicator of the structural performance of pavement (Archilla and Madanet, 2001). In deterioration models (e.g., NCHRP, 2002a, 2002b; NBDOT, 1995, Ramia et al., 1995; Collop et al., 1992), rutting is normally expressed as a depression depth relative to the plane of the pavement surface. Rutting may be caused by several factors, including unstable asphalt mixes resulting from high temperatures, high asphalt content, or low binder viscosity (MTO, 1989; Archilla and Madanat, 2001). Rutting is a common form of distress where heavy traffic loads coincide with high in-service temperatures (Nikolaides, 2000; Uzan, 2004). As asphalt temperatures increase, the stiffness of the AC decreases making it more prone to deformation under wheel loads (Marshall et al., 2001; Prozzi and Madanat, 2003). The effect of temperature on pavement strength (AC moduli) exhibits hysteretic qualities—it varies depending on whether the profile is cooling (lower layers remain relatively soft) or heating (lower layers remain relatively stiff) (Park et al., 2001). Rutting may also initiate within base and subbase layers underlying the asphalt and serve as the primary form of distortion when thaw-weakened pavements, as described in the previous section, are subjected to heavy loads. As suggested earlier, the timing and sequence of environmental conditions may play a significant role in determining long-term deterioration patterns. For example, Mishalani and Kumar (2005) observed that both warmer and colder temperatures during the first few years after initial construction positively impacted long-term rutting due to the less hardened pavement in the early stages of its life. Moreover, the sensitivity of rutting to design grows with increasing early warm temperature and decreasing early cold temperature, while the sensitivity to material quality decreases. These results imply that for a constant long-term average temperature, the higher year-to-year variation in temperature, the more likely that the adoption of a higher design level would be more beneficial. 2.3 Potential Impacts of Climate Change on Pavements Members of the research team have spent considerable time reviewing the issue of climate change and potential impacts on transportation in Canada (Andrey and Snow 1998, Andrey et al. 1999, Andrey et al., 2004, Mills and Andrey 2003). This work suggests that relatively little or no research has been conducted linking climate change to the future state of Canadian road and pavement infrastructure despite the substantial asset value of the road system, the dependence of Canadian economic and social activity on road transport, and the documented influence of climate and other environmental factors on the deterioration of pavements (e.g., see previous section; Nix et al. 1992, Haas et al. 1999). Building on the findings and recommendations of the research noted above and other sector scoping studies (e.g., Irwin, 1988; Moreno 1995), much of the attention regarding possible climate change impacts on Canadian roads has focused on infrastructure underlain by sensitive permafrost (e.g., Beaulac et al., 2006; Arenson et al., 2006; Ciro and Alfaro, 2006; Wright et al., 2002; Smith et al.,

The Road Well-traveled: Implications of Climate Change for Pavement Infrastructure in Southern Canada 18
2001; Brennan et al., 2001). Regional analyses of varying levels of sophistication on the impacts of temperature changes for seasonal (snow/ice) roads and seasonal load restrictions on paved highways have also been initiated (e.g., Hinzman et al., 2005; Instanes et al., 2005; Clayton et al., 2006; Montufar and McGregor, 2006). Haas et al. (2004) provide an overview of these and other climate change-related issues for the maintenance and lifecycle costs of paved and other road infrastructure. While many factors affect the onset, rate, nature and impacts of pavement deterioration (summarized in Figure 5), it is still possible to isolate climate-related influences as generally shown in Table 3.
Table 3. Factor Effects on Road Deterioration and Costs: Paved Roads (Haas et al., 2004) Factor Remarks Maintenance
Costs Life-Cycle Costs
Increased freeze-thaw cycles
Increased rate of deterioration and shortened service life, particularly in areas of fine grained (frost susceptible) soils
Higher Higher
Increased flooding and wash-out
More frequent replacement
Higher
Higher
Increased slope failures More frequent repairs Higher Higher Thermal degradation
a. Existing discontinuous perma-frost zone will be reduced
Little change
Little change
b. Existing continuous perma-frost zone will be reduced (part will become discontinuous)
Higher
Higher
Precipitation increase More skidding accidents and accelerated moisture damage to pavement
Higher
Higher
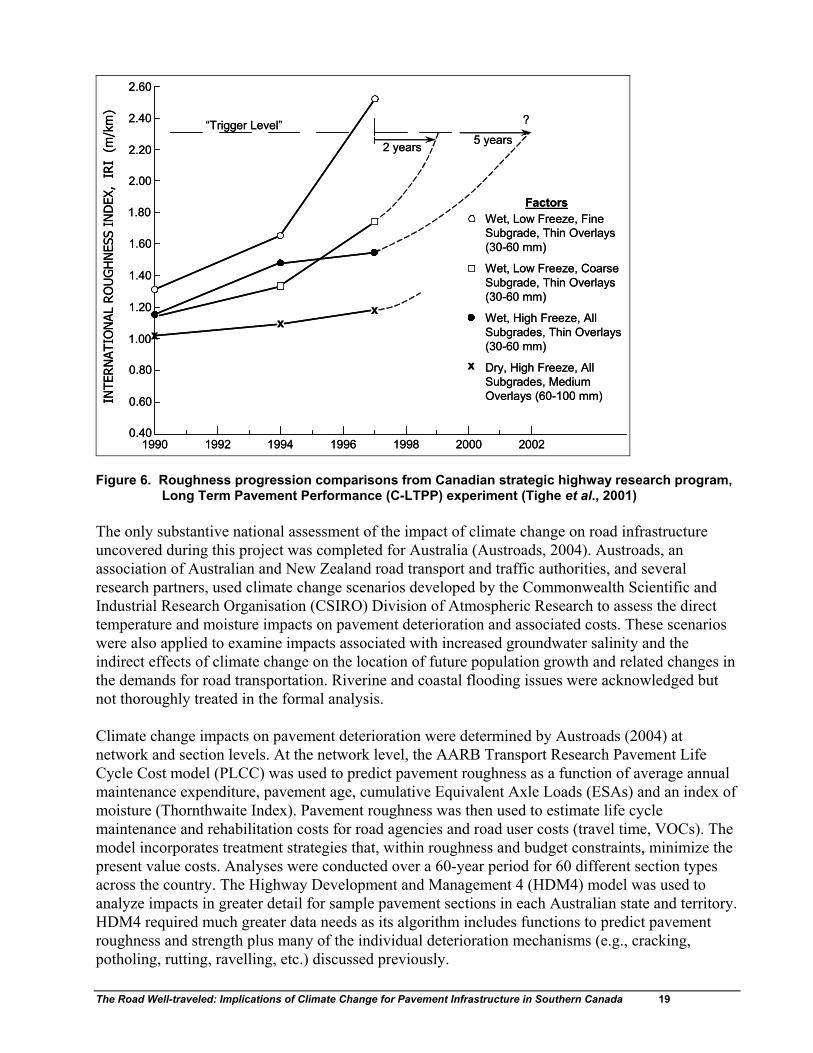
Precipitation decrease Less of above Lower Lower Icing increase More accidents Little change Little change Icing decrease Less accidents Little change Little change Haas et al. (2004) state that the major climate change-related factor affecting road deterioration and in turn costs, is freeze-thaw cycles associated with changes in temperature. It is well recognized that a high number of freeze-thaw cycles can accelerate road deterioration (He et al., 1997). This is particularly the case where a frost susceptible subgrade and a high amount of precipitation exist, as shown in results presented in Figure 6 from a study by Tighe et al. (2001). The study initiated through the Canadian Strategic Highway Research Program Long Term Pavement Performance experiment (C-LTPP) examined multiple pavement sections of various thicknesses in 24 provincial sites. Performance trends, in terms of roughness progression10 and associated trigger levels for repair/rehabilitation, were examined in terms of several factors, including climatic zone. Should conditions under climate change trend from a dry, high freeze environment (e.g., typical of northern Alberta) to a wet, low freeze environment (e.g., typical of southern Ontario) then more rapid pavement deterioration might be expected assuming no counter-measures are taken.
10 Roughness profile measurements are transformed into a summary statistic, International Roughness Index (IRI) using a quarter car simulation and appropriate filters (TAC 1997).
The Road Well-traveled: Implications of Climate Change for Pavement Infrastructure in Southern Canada 19
xx
x
2 years 5 years
?“Trigger Level”
2.60
2.40
2.20
2.00
1.80
1.60
1.40
1.20
1.00
0.80
0.60
0.401990 1992 1994 1996 1998 2000 2002
FactorsWet, Low Freeze, FineSubgrade, Thin Overlays(30-60 mm)
Wet, Low Freeze, CoarseSubgrade, Thin Overlays(30-60 mm)
Wet, High Freeze, All Subgrades, Thin Overlays(30-60 mm)
Dry, High Freeze, AllSubgrades, MediumOverlays (60-100 mm)
x
INTE
RN
ATIO
NAL
RO
UG
HN
ESS
IND
EX,
IRI
(m
/km
)
Figure 6. Roughness progression comparisons from Canadian strategic highway research program,
Long Term Pavement Performance (C-LTPP) experiment (Tighe et al., 2001) The only substantive national assessment of the impact of climate change on road infrastructure uncovered during this project was completed for Australia (Austroads, 2004). Austroads, an association of Australian and New Zealand road transport and traffic authorities, and several research partners, used climate change scenarios developed by the Commonwealth Scientific and Industrial Research Organisation (CSIRO) Division of Atmospheric Research to assess the direct temperature and moisture impacts on pavement deterioration and associated costs. These scenarios were also applied to examine impacts associated with increased groundwater salinity and the indirect effects of climate change on the location of future population growth and related changes in the demands for road transportation. Riverine and coastal flooding issues were acknowledged but not thoroughly treated in the formal analysis. Climate change impacts on pavement deterioration were determined by Austroads (2004) at network and section levels. At the network level, the AARB Transport Research Pavement Life Cycle Cost model (PLCC) was used to predict pavement roughness as a function of average annual maintenance expenditure, pavement age, cumulative Equivalent Axle Loads (ESAs) and an index of moisture (Thornthwaite Index). Pavement roughness was then used to estimate life cycle maintenance and rehabilitation costs for road agencies and road user costs (travel time, VOCs). The model incorporates treatment strategies that, within roughness and budget constraints, minimize the present value costs. Analyses were conducted over a 60-year period for 60 different section types across the country. The Highway Development and Management 4 (HDM4) model was used to analyze impacts in greater detail for sample pavement sections in each Australian state and territory. HDM4 required much greater data needs as its algorithm includes functions to predict pavement roughness and strength plus many of the individual deterioration mechanisms (e.g., cracking, potholing, rutting, ravelling, etc.) discussed previously.

The Road Well-traveled: Implications of Climate Change for Pavement Infrastructure in Southern Canada 20
The Austroads (2004) analysis revealed that the direct impacts of climate change on future road infrastructure maintenance and rehabilitation costs will be marginal, whether in the Northern Territory, where a warmer and much wetter climate can be expected, or elsewhere where the warmth may be accompanied by much drier conditions. Indirect impacts of climate change, through changes in traffic, lead to greater absolute road user costs in some states. However, it must be noted that future population growth was assigned to different regions subjectively using changes in future comfort index (i.e., changing climate drives migration which then influences traffic loads).

The Road Well-traveled: Implications of Climate Change for Pavement Infrastructure in Southern Canada 21
3.0 IMPACT OF CLIMATE VARIABILITY AND CHANGE ON CANADIAN PAVEMENT PERFORMANCE: CASE STUDIES
General methods for assessing the potential impacts of climate change on various aspects of society, economy and environment have been developed over the past two decades, largely based on approaches rooted in applied climatology or the hazards and risk assessment literature (Kates, 1985; Burton et al., 1993; Bruce et al., 2001). The leading international source of guidance on climate change impact assessment is the Intergovernmental Panel on Climate Change (IPCC), an organization that is responsible for periodic reviews of the scientific literature on aspects of climate change science, impacts and adaptation assessment, and emissions mitigation (IPCC, 2001, 2007). Carter et al. (1994) and IPCC-TGCIA (1999) propose several generic steps in a framework to guide climate impacts and adaptations assessment: 1) problem definition, 2) selection of method, 3) testing of method, 4) selection of scenarios, 5) assessment of biophysical and socio-economic impacts, 6) assessment of autonomous adjustments, 7) evaluation of adaptation strategies. While this study implicitly focuses on steps 1 through 5, important adaptation issues are introduced in the discussion, conclusion and recommendation sections (Sections 3.3., 4.1., 4.2). The review of pavement design and management practices and engineering models and approaches used to monitor, assess and predict flexible pavement performance revealed that climate—and thus potentially climate change—is an important consideration in at least three deterioration processes: thermal cracking, frost heave and thaw weakening, and rutting. Two sets of case studies were undertaken in this research to investigate these generalized impacts of climate change in greater detail. The first involved examining deterioration-relevant climate indicators that are routinely applied or referenced in the management of pavement infrastructure. The second set of case studies were conducted using the Mechanistic-Empirical Pavement Design Guide (MEPDG) and software, a new tool developed through the Unites States NCHRP/AASHTO. A description of each set of studies, including underlying methods, data requirements, and results is provided below. 3.1 Analysis of Deterioration-relevant Climate Indicators Three deterioration-relevant climate indicators were chosen to illustrate the potential effects of climate change on an aspect of each of the processes outlined in the previous section:
• extreme minimum daily temperature; • 7-day average maximum daily temperature; and • freezing and thawing indices.
The first two are important indicators of climatic conditions conducive to thermal cracking and rutting, respectively, and are applied in the selection of appropriate asphalt binders. Freezing and thawing indices are useful indicators of frost/thaw depths and thus pavement strength; they are particularly important in managing traffic loads.

The Road Well-traveled: Implications of Climate Change for Pavement Infrastructure in Southern Canada 22
Analysis of Climate Change Impacts The analysis of potential climate change impacts consisted of several steps that are outlined in Figure 7 beginning with the identification of 17 Canadian study sites (Table 4). The primary criteria for selection were location (southern Canada), proximity to test sections in the Long Term Pavement Performance (LTPP) program (more relevant for the MEPDG analyses), and availability of daily records of temperature11. Most of the selected sites are airport locations. Collectively the Census Metropolitan Areas (CMAs) or Census Agglomerations (CAs) represented by the sites include over 53 percent of the Canadian population and encompass a wide range of the environmental conditions experienced in southern Canada. Baseline time series of daily minimum, maximum and mean temperature data for the period 1951-2001 were obtained from the Environment Canada climate archive for each of the sites listed in Table 4.
Figure 7. Steps in the analysis of climate change impacts
11 Additional stations in Ontario were analyzed for use in other research projects.

The Road Well-traveled: Implications of Climate Change for Pavement Infrastructure in Southern Canada 23
Table 4. Case study site locations and characteristics
City (MSC Observing Station reference)
Latitude Longitude Elevation (m)
Mean Annual Temperature*
(°C)
Mean Total Precipitation*
(mm)
Vancouver (1108447) 49.2 123.1 4.3 10.1 1199.0 Kelowna (1123970) 49.9 119.4 429.5 7.7 380.5 Calgary (3031093) 51.0 114.0 1084.1 4.1 412.6 Edmonton (3012205) 53.5 113.5 723.3 2.4 482.7 Regina (4016560) 50.5 104.6 577.3 2.8 388.1 Winnipeg (5023222) 50.0 97.2 238.7 2.6 513.7 Thunder Bay (6048261) 48.4 89.3 199.0 2.5 711.6 North Bay (6085700) 46.4 78.4 370.3 3.8 1007.7 Muskoka (6115525) 44.9 79.3 281.9 4.9 1098.6 Windsor (6139525) 42.3 82.9 189.6 9.4 918.3 Toronto (6158733) 43.7 79.6 173.4 7.5 792.7 Ottawa (6106000) 45.3 75.7 114.0 6.0 943.5 Montreal (7025250) 45.5 73.6 35.7 6.2 978.9 Quebec (7016294) 46.8 71.2 74.4 4.0 1207.7 Fredericton (8101500) 46.0 66.7 20.7 5.3 1143.3 Halifax (8202250) 44.6 63.6 145.4 6.3 1452.2 St. John’s (8403506) 47.6 52.7 140.5 4.7 1513.7
*from 1971-2000 climate normals (Environment Canada http://www.climate.weatheroffice.ec.gc.ca/climate_normals/index_e.html)
Climate Change Scenarios Coupled general circulation models of the atmosphere and ocean (AOGCMs) are the only credible tools presently available to quantitatively estimate the transient global climate response to scenarios of future greenhouse gases, sulphate aerosols and other elements that affect climate forcing (IPCC-TGCIA, 1999). While the scientific community is quite confident that anthropogenic activities will lead to significant warming of global air temperature and a general increase in precipitation over the next century, there remains considerable uncertainty concerning potential climatic changes at local and regional scales and at specific points in time (Houghton et al., 2001). It is therefore recommended that scenarios from multiple AOGCM experiments (different models and assumptions concerning future emission patterns) be considered in analyses of climate impacts. After considering available resources, required levels of effort, and choices made in recent comparable climate impact assessments, two climate change scenarios were adopted for analysis in the current study: one based on the A2x12 emission experiment from the Canadian Centre for Climate Modelling and Analysis Coupled Global Climate Model 2 (CGCM2A2x), the other from the B21 experiment run through the Hadley Climate Model 3 (HadCM3B21). More information 12 the CGCM2 A2x scenario is actually an ensemble or average of three separate A2 experiments for which the model was initialized differently. Similarly, the HadCM3 B21 scenario is the first experiment in its B2 series.

The Road Well-traveled: Implications of Climate Change for Pavement Infrastructure in Southern Canada 24
concerning the basis of the emission scenarios, which are grouped into four families (A1, A2, B1, B2) having similar demographic, societal, political, economic and technological assumptions over the next century, is provided in IPCC (2000). The specifications of the CGCM2 and HadCM3 climate models, and performance in relation to other internationally recognized models, are also well-documented elsewhere (Flato et al., 2000; Flato and Boer, 2001; Gordon et al., 2000; CMIP, 2001). Raw scenario surface temperature (minimum, maximum, mean) and precipitation (total) data for each model and experiment were obtained through the Canadian Climate Scenarios Network (CCSN, 2005). Monthly data were available for baseline (1961-1990) and three future 30-year temporal windows centred on the 2020s, 2050s, and 2080s. Given that the average design life of pavement infrastructure is about 20-30 years, only the 2050s scenarios were examined in the current study. The data consisted of output for climate model grid cells, each of which spans 2.5 (HadCM3) to 3.75 (CGCM2) degrees latitude and 3.75 (both models) degrees longitude (i.e., over 100,000 km2). Each site in Table 4 was assigned to the model grid cell in which it was located, except when the cell was designated as ‘water’ in the model specifications; in these cases, the nearest ‘land’ cell was used. Scatterplots of potential changes in annual and seasonal mean temperature and precipitation were prepared to indicate the position or severity of the CGCM2A2x and HadCM3B21 experiment results relative to other AOGCM scenarios for each site. Examples of annual scatterplots for the most northern (Edmonton) and southern (Windsor) study sites are provided in Figures 8-9. In general the CGCM2A2x and HadCM3B21 scenarios are average and conservative, respectively, when compared to other AOGCMs and experiments. Tables of the monthly values for the CGCM2Ax and HadCM3B21 that were used for each site are provided in Appendix A.
Edmonton (Annual 2050s)
0.9
0.95
1
1.05
1.1
1.15
1.2
0 0.5 1 1.5 2 2.5 3 3.5 4 4.5 5 5.5
Temperature Change (baseline-2050s)
Prec
ipita
tion
Cha
nge
(rat
io o
f 205
0s:b
asel
ine)
Other AOGCMs CGCM2A2x HadCM3B21
Figure 8. Scatterplot of potential changes in mean annual temperature and precipitation (Edmonton case study)
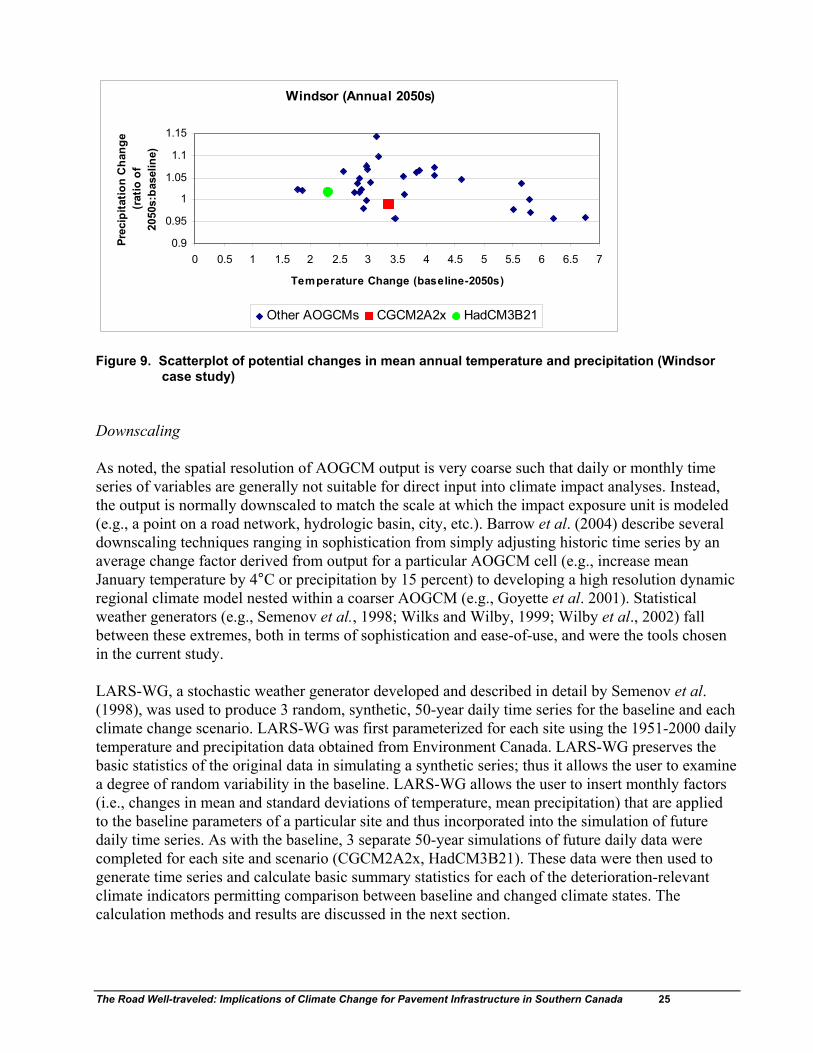
The Road Well-traveled: Implications of Climate Change for Pavement Infrastructure in Southern Canada 25
Windsor (Annual 2050s)
0.9
0.95
1
1.05
1.1
1.15
0 0.5 1 1.5 2 2.5 3 3.5 4 4.5 5 5.5 6 6.5 7
Temperature Change (baseline-2050s)
Prec
ipita
tion
Cha
nge
(rat
io o
f 20
50s:
base
line)
Other AOGCMs CGCM2A2x HadCM3B21
Figure 9. Scatterplot of potential changes in mean annual temperature and precipitation (Windsor
case study) Downscaling As noted, the spatial resolution of AOGCM output is very coarse such that daily or monthly time series of variables are generally not suitable for direct input into climate impact analyses. Instead, the output is normally downscaled to match the scale at which the impact exposure unit is modeled (e.g., a point on a road network, hydrologic basin, city, etc.). Barrow et al. (2004) describe several downscaling techniques ranging in sophistication from simply adjusting historic time series by an average change factor derived from output for a particular AOGCM cell (e.g., increase mean January temperature by 4°C or precipitation by 15 percent) to developing a high resolution dynamic regional climate model nested within a coarser AOGCM (e.g., Goyette et al. 2001). Statistical weather generators (e.g., Semenov et al., 1998; Wilks and Wilby, 1999; Wilby et al., 2002) fall between these extremes, both in terms of sophistication and ease-of-use, and were the tools chosen in the current study. LARS-WG, a stochastic weather generator developed and described in detail by Semenov et al. (1998), was used to produce 3 random, synthetic, 50-year daily time series for the baseline and each climate change scenario. LARS-WG was first parameterized for each site using the 1951-2000 daily temperature and precipitation data obtained from Environment Canada. LARS-WG preserves the basic statistics of the original data in simulating a synthetic series; thus it allows the user to examine a degree of random variability in the baseline. LARS-WG allows the user to insert monthly factors (i.e., changes in mean and standard deviations of temperature, mean precipitation) that are applied to the baseline parameters of a particular site and thus incorporated into the simulation of future daily time series. As with the baseline, 3 separate 50-year simulations of future daily data were completed for each site and scenario (CGCM2A2x, HadCM3B21). These data were then used to generate time series and calculate basic summary statistics for each of the deterioration-relevant climate indicators permitting comparison between baseline and changed climate states. The calculation methods and results are discussed in the next section.

The Road Well-traveled: Implications of Climate Change for Pavement Infrastructure in Southern Canada 26
Performance Grade Asphalt Cement Selection Extreme minimum daily temperature and 7-day average maximum daily temperature indicators are used to assist in the selection of performance grade (PG) asphalt binders or asphalt cements (PGAC) (USFHWA, 2002; OHMPA, 1999) that have been appropriately rated using extensive laboratory material testing. A suitable PGAC will minimize thermal cracking under cold temperatures while simultaneously minimizing traffic-induced rutting under hot temperatures. A reliability factor, most often 98 percent over the design life of the pavement structure, is associated with each PGAC and is determined as part of the calculations for each design. Grades are assigned in 6°C increments for both minimum and maximum pavement temperatures as illustrated in Table 5. Table 5. Example performance grade asphalt binders/cements (USFHWA, 2002; OHMPA, 1999)
7-day Maximum Pavement Temperature (°C) Extreme Minimum Pavement Temperature (°C) 40 46 52 58 64 70
-40 PG 40-40 PG 46-40 PG 52-40 PG 58-40 PG 64-40 PG 70-40
-34 PG 40-34 PG 46-34 PG 52-34 PG 58-34 PG 64-34 PG 70-34
-28 PG 40-28 PG 46-28 PG 52-28 PG 58-28 PG 64-28 PG 70-28
-22 PG 40-22 PG 46-22 PG 52-22 PG 58-22 PG 64-22 PG 70-22
-16 PG 40-16 PG 46-16 PG 52-16 PG 58-16 PG 64-16 PG 70-16
-10 PG 40-10 PG 46-10 PG 52-10 PG 58-10 PG 64-10 PG 70-16
For example, a PG 58-28 asphalt cement meets a minimum daily surface pavement temperature requirement of -28°C, and an average 7-day maximum temperature of 58°C, with 98 percent reliability over its design life (Haas et al., 2004). The minimum PG threshold refers to surface pavement temperatures while the maximum PG threshold refers to a temperature within the pavement, normally about 20mm from the surface (OHMPA, 1999). In practice, maximum temperature PG thresholds are adjusted upward one or more increments to account for traffic and load considerations (e.g., sections of Highway 401 in southern Ontario that are subject to stopped or slow moving heavy truck traffic) (USFHWA, 2002; OHMPA, 1999). While continuous 50-year records of air temperature data are available throughout North America, similarly extensive datasets for pavement temperature are not as common or reliable. Several empirical formulae relating air and pavement temperatures have been developed through the Superpave and Long Term Pavement Performance (LTPP) programs to assist engineers in the design and binder selection process. The most recent equations cited by the USFHWA (2002) are described below: For maximum pavement temperature: Tpmax = 54.3254.32+0.78Tairmax-0.0025Lat2-15.14log10(H+25)+z(9+0.61σTairmax
2)0.5 (4) where: Tpmax = maximum pavement temperature at depth, °C Tairmax = average annual extreme 7-day mean maximum daily air temperature, °C Lat = latitude of location, decimal degrees H = depth from surface, mm z = z-score for appropriate level of reliability assuming standard normal distribution (z=2.055, 98% reliability) σTairmax = standard deviation of annual extreme 7-day mean maximum daily air temperature, °C

The Road Well-traveled: Implications of Climate Change for Pavement Infrastructure in Southern Canada 27
For minimum pavement temperature: Tpmin = -1.56+0.72Tairmin-0.004Lat2+6.26log10(H+25)-z(4.4+0.52σTairmin
2)0.5 (5) where: Tpmin = minimum pavement temperature at depth, °C Tairmin = average annual extreme minimum daily air temperature, °C Lat = latitude of location, decimal degrees H = depth from surface, mm z = z-score for appropriate level of reliability assuming standard normal distribution (z=2.055, 98% reliability) σTairmin = standard deviation of annual extreme minimum daily air temperature, °C
While more sophisticated heat-balance and finite-difference models have been developed to determine temperatures throughout the pavement structure (e.g., Yavuzturk et al., 2005), the Superpave formulae are more commonly used in practice and are based on LTPP climate and pavement data from over 30 North American sites. Nevertheless, for comparison the authors also applied two additional formulae derived from 3 years of Road Weather Information System (RWIS) pavement and air temperature data from 3 sites in Ontario (MTO, 2006). These RWIS stations better capture the latitudes of the Canadian sites examined in the current study. The data are plotted in Figures 10-11 and the best fit (approximate r-squared values of 0.97) second-order, polynomial equations are noted below for each relationship. For maximum pavement temperature: Tpmax = 3.0305+0.007Tairmax
2+1.1715Tairmax (6) where: Tpmax = maximum pavement temperature (~20mm depth), °C Tairmax = 7-day mean maximum daily air temperature, °C
For minimum pavement temperature: Tpmin = 2.0722+0.0051Tairmin
2+1.0453Tairmin (7) where: Tpmin = minimum pavement surface temperature, °C Tairmin = minimum daily air temperature, °C
y = 0.007x2 + 1.1715x + 3.0305
R2 = 0.9684
-30.0
-20.0
-10.0
0.0
10.0
20.0
30.0
40.0
50.0
60.0
-30.0 -20.0 -10.0 0.0 10.0 20.0 30.0 40.0
7 day Mean Maximum Daily Air Temperature (°C)
7 da
y M
ean
Max
imum
Dai
ly
Pave
men
t Tem
pera
ture
(°C
)
Figure 10. Relationship between 7-day mean maximum daily air and pavement temperatures

The Road Well-traveled: Implications of Climate Change for Pavement Infrastructure in Southern Canada 28
y = 0.0051x2 + 1.0453x + 2.0722R2 = 0.9673
-40
-30
-20
-10
0
10
20
30
40
-50 -40 -30 -20 -10 0 10 20 30
Minimum Daily Air Temperature (°C)
Min
imum
Dai
ly P
avem
ent
Sur
face
Tem
pera
ture
(°C
)
Figure 11. Relationship between minimum daily air and pavement surface temperatures Performance Grade Analysis Results Daily minimum and 7-day mean maximum temperatures are expected to increase with climate change at all of the sites examined. In general, the CGCM2A2x scenarios yield the greater changes in both minimum and 7-day mean maximum temperature variables. For example, Figures 12-13 show the distribution of all daily minimum and 7-day mean maximum temperatures for the Windsor site under baseline and future climate conditions. Every day in each of the 3, 50-year simulations for the baseline, CGCM2A2x, and HadCM3B21 scenarios is represented in Figures 12-13. Comparable results for all sites are included in Appendix B. From this daily data, time series of the minimum temperature and the highest 7-day mean maximum temperature observed in each year of the simulation are extracted for the calculation of performance grades. These variables are referred to as the annual extreme minimum daily temperature and annual extreme 7-day mean maximum temperature throughout this report. Minimum, maximum, and quartile statistics of these variables for the Windsor site are presented in Figures 14-15.
0
2000
4000
6000
8000
10000
12000
-40 -35 -30 -25 -20 -15 -10 -5 0 5 10 15 20 25 30
Daily Minimum Temperature (°C)
Coun
t (da
ys)
Baseline CGCM2A2x HADCM2B21
Notes: 1) based on 3, 50-year synthetic series (54750 days) 2) x-axis labels refer to upper limit (i.e., 0 category includes values greater than -5 and less than or equal to 0) Figure 12. Daily minimum air temperature statistics for Windsor site under baseline and future
scenarios

The Road Well-traveled: Implications of Climate Change for Pavement Infrastructure in Southern Canada 29
0
2000
4000
6000
8000
10000
12000
14000
-35 -30 -25 -20 -15 -10 -5 0 5 10 15 20 25 30 35 40
7-day Mean Maximum Temperature (°C)
Cou
nt (d
ays)
Baseline CGCM2A2x HADCM2B21
Notes: 1) based on 3, 50-year synthetic series (54750 days) 2) x-axis labels refer to upper limit (i.e., 0 category includes values greater than -5 and less than or equal to 0) Figure 13. Seven-day mean daily maximum air temperature statistics for Windsor site under baseline
and future scenarios
-60
-50
-40
-30
-20
-10
0
Base CGCM2A2x HADCM3B21
Annu
al E
xtre
me
Min
imum
Dai
ly
Tem
pera
ture
(°C
)
Minimum Low er Quartile Median Upper Quartile Maximum
Notes: based on 3, 50-year synthetic series (150 values) Figure 14. Annual extreme minimum daily air temperature statistics for Windsor site under baseline
and future scenarios
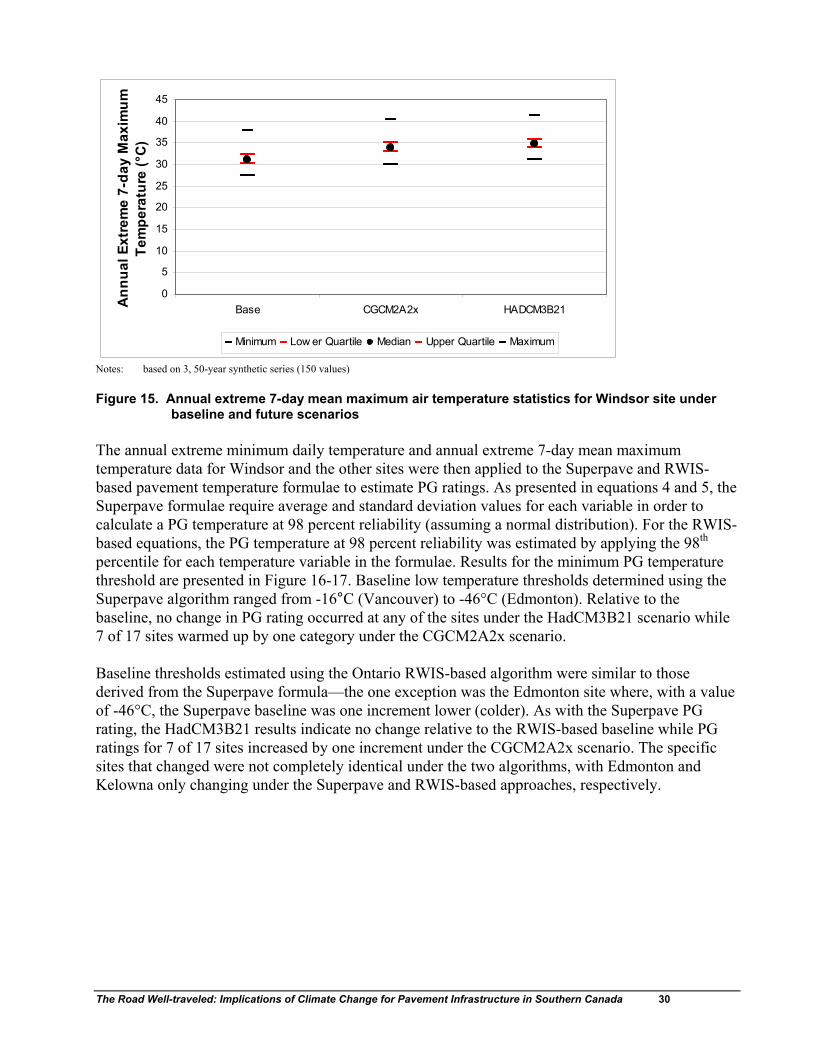
The Road Well-traveled: Implications of Climate Change for Pavement Infrastructure in Southern Canada 30
0
5
10
15
20
25
30
35
40
45
Base CGCM2A2x HADCM3B21Ann
ual E
xtre
me
7-da
y M
axim
um
Tem
pera
ture
(°C
)
Minimum Low er Quartile Median Upper Quartile Maximum
Notes: based on 3, 50-year synthetic series (150 values) Figure 15. Annual extreme 7-day mean maximum air temperature statistics for Windsor site under
baseline and future scenarios The annual extreme minimum daily temperature and annual extreme 7-day mean maximum temperature data for Windsor and the other sites were then applied to the Superpave and RWIS-based pavement temperature formulae to estimate PG ratings. As presented in equations 4 and 5, the Superpave formulae require average and standard deviation values for each variable in order to calculate a PG temperature at 98 percent reliability (assuming a normal distribution). For the RWIS-based equations, the PG temperature at 98 percent reliability was estimated by applying the 98th percentile for each temperature variable in the formulae. Results for the minimum PG temperature threshold are presented in Figure 16-17. Baseline low temperature thresholds determined using the Superpave algorithm ranged from -16°C (Vancouver) to -46°C (Edmonton). Relative to the baseline, no change in PG rating occurred at any of the sites under the HadCM3B21 scenario while 7 of 17 sites warmed up by one category under the CGCM2A2x scenario. Baseline thresholds estimated using the Ontario RWIS-based algorithm were similar to those derived from the Superpave formula—the one exception was the Edmonton site where, with a value of -46°C, the Superpave baseline was one increment lower (colder). As with the Superpave PG rating, the HadCM3B21 results indicate no change relative to the RWIS-based baseline while PG ratings for 7 of 17 sites increased by one increment under the CGCM2A2x scenario. The specific sites that changed were not completely identical under the two algorithms, with Edmonton and Kelowna only changing under the Superpave and RWIS-based approaches, respectively.

The Road Well-traveled: Implications of Climate Change for Pavement Infrastructure in Southern Canada 31
-46-40-34-28-22-16-10-4
Vanco
uver
Kelowna
Calgary
Edmon
ton
Regina
Winnipe
g
Thund
er Bay
Windso
r
Musko
ka
Toronto
North B
ay
Ottawa
Montre
al
Quebe
c
Frederic
ton
Halifax
St. Joh
n's
Supe
rpav
e M
inim
um P
avem
ent
Tem
pera
ture
Gra
de (°
C)
Baseline CGCM2A2x HADCM3B21
Figure 16. Low PG rating thresholds estimated using the Superpave algorithm under baseline and
future scenarios for all sites
-46-40-34-28-22-16-10-4
Vanco
uver
Kelowna
Calgary
Edmon
ton
Regina
Winnipe
g
Thund
er Bay
Windso
r
Musko
ka
Toronto
North B
ay
Ottawa
Montre
al
Quebe
c
Frederic
ton
Halifax
St. Joh
n'sRW
IS-d
eriv
ed M
inim
um P
avem
ent
Tem
pera
ture
Gra
de (°
C)
Baseline CGCM2A2x HADCM3B21
Figure 17. Low PG rating thresholds estimated using the RWIS-based algorithm under baseline and future scenarios for all sites
Results for the maximum PG temperature threshold are presented in Figure 18-19. Baseline high temperature thresholds determined using the Superpave algorithm were either 52°C (Vancouver, Calgary, Edmonton, North Bay, Halifax, St. John’s) or 58°C (Kelowna, Regina, Winnipeg, Thunder Bay, Windsor, Muskoka, Toronto, Ottawa, Montreal, Fredericton). The upper limit of this range expanded to 64°C (Kelowna, Windsor) after results from the climate change scenarios were considered. PG ratings for 6 of 17 sites increased by one category under the HadCM3B21 scenario relative to the baseline; ratings for four of these sites also increased by one increment under the CGCM2A2x scenario. Baseline thresholds estimated using the Ontario RWIS-based algorithm ranged from 46°C (Vancouver, North Bay, Halifax, St. John’s) to 58°C (Kelowna, Regina, Windsor). Results were one category lower than those derived from the Superpave formula for 12 sites and identical for the

The Road Well-traveled: Implications of Climate Change for Pavement Infrastructure in Southern Canada 32
remaining 5 locations. The climate change scenarios produced thresholds ranging from 46°C (Vancouver) to 70°C (Kelowna). PG ratings at 13 sites increased by at least one increment under the HadCM3B21 climate change scenario (Kelowna increased by two categories) and eleven of these sites also increased by one increment under the CGCM2A2x scenario. The higher PG estimates under the RWIS-based formula are likely a product of the limited range of data upon which the equation was derived. As shown in Figure 7, the highest 7-day mean maximum air temperature considered in the 3-year dataset is less than 35°C which is much lower than the 98th percentile values that were analysed in the baseline and climate change scenarios. This issue is not apparent for the extreme minimum equation as the RWIS data captured the full range of values in the baseline and climate change scenarios. Regardless, the differences illustrate the importance of using long time series of data whenever possible when developing empirical relationships.
40
46
52
58
64
70
76
Vanco
uver
Kelowna
Calgary
Edmon
ton
Regina
Winnipe
g
Thund
er Bay
Windso
r
Musko
ka
Toronto
North B
ay
Ottawa
Montre
al
Quebe
c
Frederic
ton
Halifax
St. Joh
n's
Supe
rpav
e A
vera
ge 7
-day
Max
imum
Pa
vem
ent T
empe
ratu
re G
rade
(°C
)
Baseline CGCM2A2x HADCM3B21
Figure 18. High PG rating thresholds estimated using the Superpave algorithm under baseline and
future scenarios for all sites
40
46
52
58
64
70
76
Vanco
uver
Kelowna
Calgary
Edmon
ton
Regina
Winnipe
g
Thund
er Bay
Windso
r
Musko
ka
Toronto
North B
ay
Ottawa
Montre
al
Quebe
c
Frederic
ton
Halifax
St. Joh
n's
RW
IS-d
eriv
ed A
vera
ge 7
-day
Max
imum
Pa
vem
ent T
empe
ratu
re G
rade
(°C
)
Baseline CGCM2A2x HADCM3B21
Figure 19. High PG rating thresholds estimated using the RWIS-based algorithm under baseline and
future scenarios for all sites
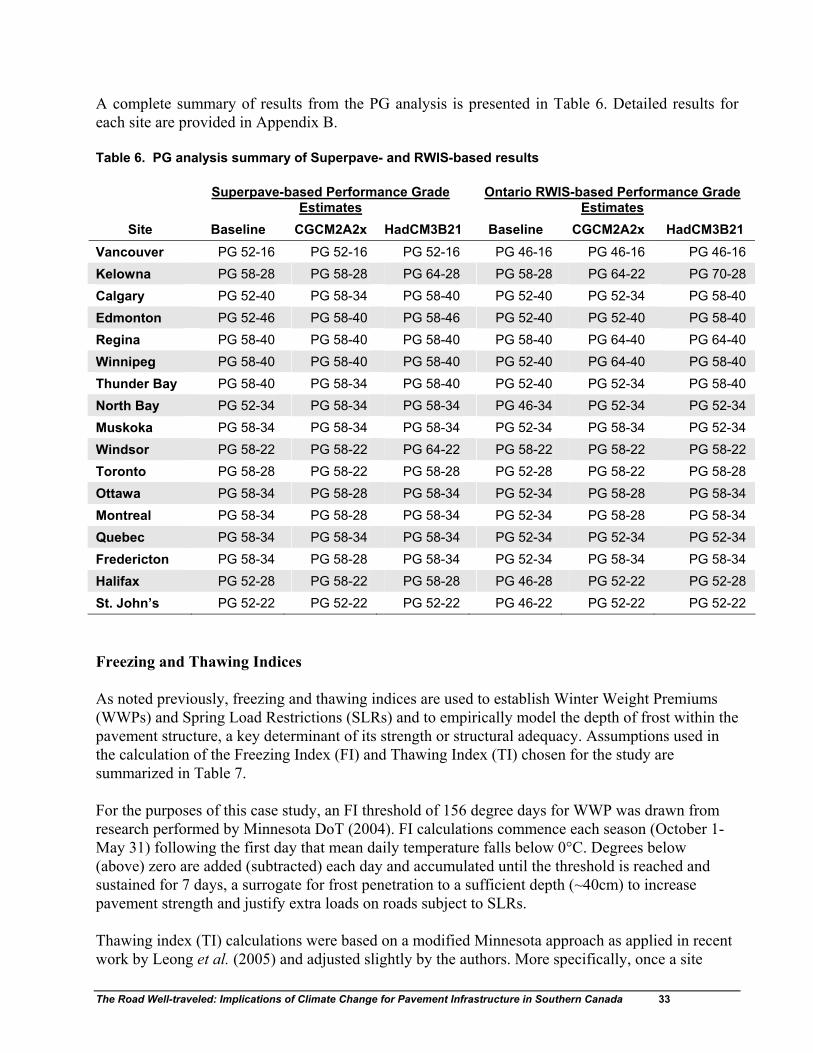
The Road Well-traveled: Implications of Climate Change for Pavement Infrastructure in Southern Canada 33
A complete summary of results from the PG analysis is presented in Table 6. Detailed results for each site are provided in Appendix B. Table 6. PG analysis summary of Superpave- and RWIS-based results
Superpave-based Performance Grade Estimates
Ontario RWIS-based Performance Grade Estimates
Site Baseline CGCM2A2x HadCM3B21 Baseline CGCM2A2x HadCM3B21 Vancouver PG 52-16 PG 52-16 PG 52-16 PG 46-16 PG 46-16 PG 46-16 Kelowna PG 58-28 PG 58-28 PG 64-28 PG 58-28 PG 64-22 PG 70-28 Calgary PG 52-40 PG 58-34 PG 58-40 PG 52-40 PG 52-34 PG 58-40 Edmonton PG 52-46 PG 58-40 PG 58-46 PG 52-40 PG 52-40 PG 58-40 Regina PG 58-40 PG 58-40 PG 58-40 PG 58-40 PG 64-40 PG 64-40 Winnipeg PG 58-40 PG 58-40 PG 58-40 PG 52-40 PG 64-40 PG 58-40 Thunder Bay PG 58-40 PG 58-34 PG 58-40 PG 52-40 PG 52-34 PG 58-40 North Bay PG 52-34 PG 58-34 PG 58-34 PG 46-34 PG 52-34 PG 52-34 Muskoka PG 58-34 PG 58-34 PG 58-34 PG 52-34 PG 58-34 PG 52-34 Windsor PG 58-22 PG 58-22 PG 64-22 PG 58-22 PG 58-22 PG 58-22 Toronto PG 58-28 PG 58-22 PG 58-28 PG 52-28 PG 58-22 PG 58-28 Ottawa PG 58-34 PG 58-28 PG 58-34 PG 52-34 PG 58-28 PG 58-34 Montreal PG 58-34 PG 58-28 PG 58-34 PG 52-34 PG 58-28 PG 58-34 Quebec PG 58-34 PG 58-34 PG 58-34 PG 52-34 PG 52-34 PG 52-34 Fredericton PG 58-34 PG 58-28 PG 58-34 PG 52-34 PG 58-34 PG 58-34 Halifax PG 52-28 PG 58-22 PG 58-28 PG 46-28 PG 52-22 PG 52-28 St. John’s PG 52-22 PG 52-22 PG 52-22 PG 46-22 PG 52-22 PG 52-22 Freezing and Thawing Indices As noted previously, freezing and thawing indices are used to establish Winter Weight Premiums (WWPs) and Spring Load Restrictions (SLRs) and to empirically model the depth of frost within the pavement structure, a key determinant of its strength or structural adequacy. Assumptions used in the calculation of the Freezing Index (FI) and Thawing Index (TI) chosen for the study are summarized in Table 7. For the purposes of this case study, an FI threshold of 156 degree days for WWP was drawn from research performed by Minnesota DoT (2004). FI calculations commence each season (October 1-May 31) following the first day that mean daily temperature falls below 0°C. Degrees below (above) zero are added (subtracted) each day and accumulated until the threshold is reached and sustained for 7 days, a surrogate for frost penetration to a sufficient depth (~40cm) to increase pavement strength and justify extra loads on roads subject to SLRs. Thawing index (TI) calculations were based on a modified Minnesota approach as applied in recent work by Leong et al. (2005) and adjusted slightly by the authors. More specifically, once a site

The Road Well-traveled: Implications of Climate Change for Pavement Infrastructure in Southern Canada 34
reached the critical freezing index noted previously, a daily thawing index (degree day count) was calculated for those days when the mean daily air temperature exceeded a reference value (-2°C). This value approximately corresponds to a temperature of 0°C at the base of the asphalt layer (i.e., to account for pavement response to radiation even though air temperatures are below 0°C). SLRs are assumed to be required in order to mitigate pavement damage when the cumulative daily TI reaches and sustains a critical value (13 degree days). To ensure that the thaw is prolonged sufficiently to affect the structure, additional criteria—attainment of at least 30 degree-days within seven days and an average TI of 21.5 degree-days—were applied to establish the recommended SLR date. It should be noted that the specific thresholds or constants used in calculating freezing and thawing indices vary by jurisdiction and/or practice. Complementary studies are being completed by the authors in order to explore the implications of these, using sensitivity analysis. More specifically, the following decision points are being explored:
• Should the freezing index be adjusted for winter thaws? • How much freezing is required to change the moduli of the pavement? • When there is enough freezing, at what temperature should the thawing index calculation be
initiated? • How should low temperatures be treated after the thawing index calculation has been
initiated? • How should the first possible date for thaw-related damage be determined? • When should SLRs/WWPs be implemented and monitored to minimize pavement damage?
The results of this work, as applied to two sites—Edmonton International Airport and Toronto Pearson International Airport for the months of September through April, from 1971 to 2000—will be reported in a Master’s thesis in Geography at the University of Waterloo (Parm, 2007). A separate study, initiated by the University of Waterloo in partnership with the Ministry of Transportation of Ontario, is also examining these issues within the context of utilizing Road Weather Information Systems (RWIS) to control load restrictions on gravel and surface treated highways (Huen et al., 2006). Table 7. Freeze and thaw analysis calculation assumptions adopted in the analysis VARIABLE CONDITION Freezing Index (FI) Calculations Season begins/ends October 1/May 31Reference Temperature 0°C FI threshold (day 1) ≥156 FI threshold (day 2-7 mean) ≥156 Thawing Index Calculations Season begins/ends October 1/May 31Reference Temperature -2°C TI threshold (day 1) ≥13 TI threshold (day 2-7 minimum) ≥13 TI threshold (day 2-7 maximum) ≥30 TI threshold (day 2-7 mean) ≥21.5
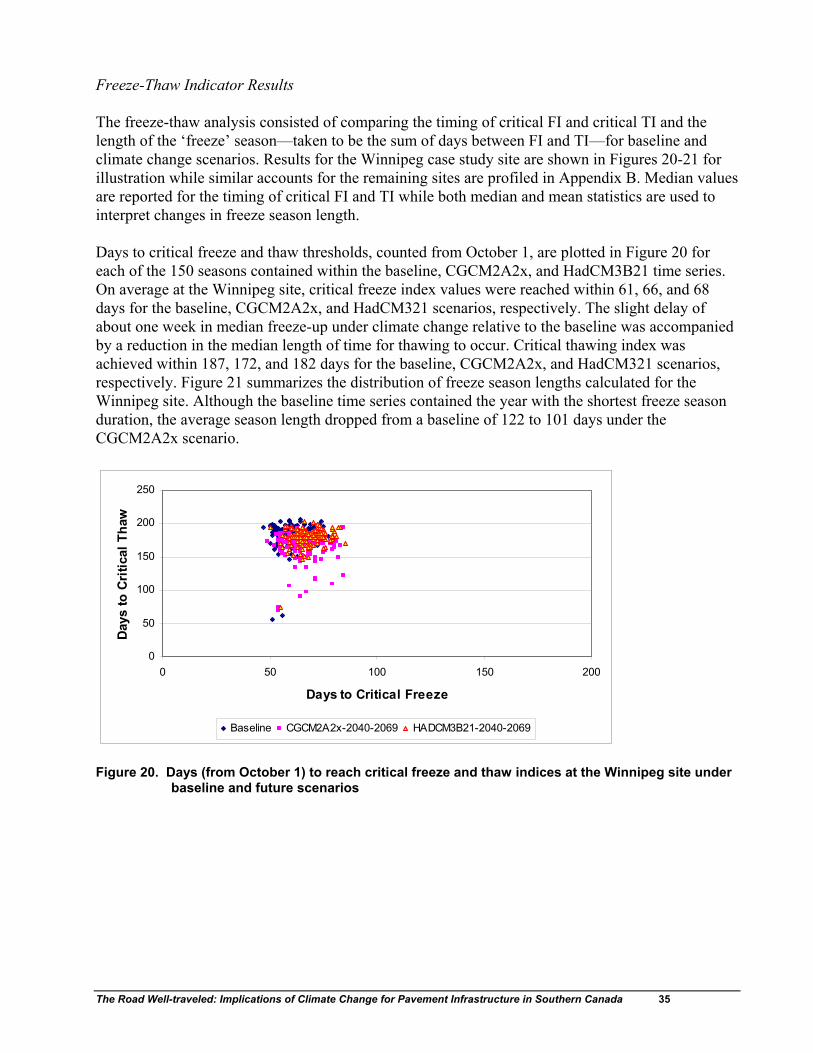
The Road Well-traveled: Implications of Climate Change for Pavement Infrastructure in Southern Canada 35
Freeze-Thaw Indicator Results The freeze-thaw analysis consisted of comparing the timing of critical FI and critical TI and the length of the ‘freeze’ season—taken to be the sum of days between FI and TI—for baseline and climate change scenarios. Results for the Winnipeg case study site are shown in Figures 20-21 for illustration while similar accounts for the remaining sites are profiled in Appendix B. Median values are reported for the timing of critical FI and TI while both median and mean statistics are used to interpret changes in freeze season length. Days to critical freeze and thaw thresholds, counted from October 1, are plotted in Figure 20 for each of the 150 seasons contained within the baseline, CGCM2A2x, and HadCM3B21 time series. On average at the Winnipeg site, critical freeze index values were reached within 61, 66, and 68 days for the baseline, CGCM2A2x, and HadCM321 scenarios, respectively. The slight delay of about one week in median freeze-up under climate change relative to the baseline was accompanied by a reduction in the median length of time for thawing to occur. Critical thawing index was achieved within 187, 172, and 182 days for the baseline, CGCM2A2x, and HadCM321 scenarios, respectively. Figure 21 summarizes the distribution of freeze season lengths calculated for the Winnipeg site. Although the baseline time series contained the year with the shortest freeze season duration, the average season length dropped from a baseline of 122 to 101 days under the CGCM2A2x scenario.
0
50
100
150
200
250
0 50 100 150 200
Days to Critical Freeze
Day
s to
Cri
tical
Tha
w
Baseline CGCM2A2x-2040-2069 HADCM3B21-2040-2069
Figure 20. Days (from October 1) to reach critical freeze and thaw indices at the Winnipeg site under
baseline and future scenarios

The Road Well-traveled: Implications of Climate Change for Pavement Infrastructure in Southern Canada 36
0
20
40
60
80
100
120
140
160
Base CGCM2A2x HADCM3B21
Free
ze S
easo
n Le
ngth
(day
s)
Minimum Low er Quartile Median Upper Quartile Maximum
Figure 21. Freeze season length at the Winnipeg site under baseline and future scenarios. The relative results for Winnipeg are similar to those analyzed for the other sites. In principle, warmer (or warming) climates are associated with greater lengths of time until critical FI is achieved and shorter periods until critical TI conditions are met. The median number of days to attain critical FI and TI are presented for all sites in Figures 22-23. With exception of Vancouver, where freeze thresholds were never satisfied in any of the baseline or future scenarios, the baseline median duration until freeze ranged from 58 days (Edmonton) to 116 days (St. John’s). The corresponding baseline median number of days until thaw ranged from 131 (Kelowna) to 187 (Winnipeg). Under the climate change scenarios studied, the number of days required to achieve critical FI and TI substantially increased and decreased, respectively. Assuming that CGCM2A2x conditions prevail, Kelowna, Windsor, Toronto and St. John’s join Vancouver in the subset of sites where over 50 percent of all seasons fail to reach critical FI (and therefore TI); elsewhere the median duration before reaching critical FI increases from 4 days (North Bay) to 27 days (Halifax) while critical TI is achieved 10 days (Thunder Bay) to 31 days (Muskoka) earlier. Critical FI is reached under the HadCM3B21 scenario in at least 50 percent of seasons at all sites (except Vancouver). Under this scenario, median values for most sites increase by about 1-2 weeks relative to the baseline, except for Kelowna, Toronto, Windsor, Halifax and St. John’s, where the median increased by up to 28 days. Critical TI is reached earlier in the season under the HadCM3B21 scenario at all sites except Kelowna, with median values ranging from 2 (Regina) to 14.5 (Halifax) less than the baseline. Median values increased at Kelowna by 3 days.

The Road Well-traveled: Implications of Climate Change for Pavement Infrastructure in Southern Canada 37
020406080
100120140160
Vanco
uver
Kelowna
Calgary
Edmon
ton
Regina
Winnipe
g
Thund
er Bay
Windso
r
Musko
ka
Toronto
North B
ay
Ottawa
Montre
al
Quebe
c
Frederic
ton
Halifax
St. Joh
n's
Med
ian
Day
s to
Crit
ical
Fre
eze
(sta
rtin
g 1-
Oct
)
Baseline CGCM2A2x HADCM3B21
Figure 22. Median number of days required to reach the critical freeze index for all sites under baseline and future climate scenarios.
020406080
100120140160180200
Vanco
uver
Kelowna
Calgary
Edmon
ton
Regina
Winnipe
g
Thund
er Bay
Windso
r
Musko
ka
Toronto
North B
ay
Ottawa
Montre
al
Quebe
c
Frederic
ton
Halifax
St. Joh
n's
Med
ian
Day
s to
Crit
ical
Tha
w (s
tart
ing
1-O
ct)
Baseline CGCM2A2x HADCM3B21
Figure 23. Median number of days required to reach the critical thaw index for all sites under baseline and future climate scenarios.
Combining the FI and TI results allows examination of changes in the duration of the freeze season. Mean and standard deviation freeze season lengths for all of the study sites are presented in Figures 24-25. Baseline mean values ranged from 0 days in Vancouver to 122 days in Winnipeg. Vancouver, Kelowna and Windsor were the only sites that experienced ‘freeze-free’ seasons under baseline conditions (Figure 26). Baseline standard deviations were similar for most sites (generally 15-20 days) except for Vancouver (no freeze seasons therefore no variability) and Calgary and Edmonton where the influence of periodic winter chinook conditions likely introduces greater variability. The mean duration of the freeze season dropped substantially under the climate change scenarios examined, from roughly 8 percent at Winnipeg (HadCM3B21) to 98 percent at the St. John’s and Windsor sites (CGCM2A2x). The CGCM2A2x scenario consistently produced greater reductions in

The Road Well-traveled: Implications of Climate Change for Pavement Infrastructure in Southern Canada 38
season length than the HadCM3B21 scenario. At least one in three seasons might be ‘freeze-free’ under the CGCM2A2x at the Vancouver, Kelowna, Toronto, Halifax and St. John’s sites while rare (~1 in 100) occurrences might also occur in Calgary, Muskoka and Ottawa. As expected, where the mean season length remained relatively long under the climate change scenarios (i.e., > 50 days), the standard deviation increased relative to the baseline. At sites where the mean season length was less than 50 days, the standard deviation under climate change was reduced relative to the baseline.
0
2040
60
80
100120
140
Vanco
uver
Kelowna
Calgary
Edmon
ton
Regina
Winnipe
g
Thund
er Bay
Windso
r
Musko
ka
Toronto
North B
ay
Ottawa
Montre
al
Quebe
c
Frederic
ton
Halifax
St. Joh
n'sMea
n Fr
eeze
Sea
son
Leng
th (d
ays)
Baseline CGCM2A2x HADCM3B21
Figure 24. Mean freeze season length for all sites under baseline and future climate scenarios.
05
10152025303540
Vanco
uver
Kelowna
Calgary
Edmon
ton
Regina
Winnipe
g
Thund
er Bay
Windso
r
Musko
ka
Toronto
North B
ay
Ottawa
Montre
al
Quebe
c
Frederic
ton
Halifax
St. Joh
n's
Stan
dard
Dev
iatio
n of
Fre
eze
Seas
on L
engt
h (d
ays)
Baseline CGCM2A2x HADCM3B21
Figure 25. Standard deviation of freeze season length for all sites under baseline and future climate scenarios.

The Road Well-traveled: Implications of Climate Change for Pavement Infrastructure in Southern Canada 39
0102030405060708090
100
Vanco
uver
Kelowna
Calgary
Edmon
ton
Regina
Winnipe
g
Thund
er Bay
Windso
r
Musko
ka
Toronto
North B
ay
Ottawa
Montre
al
Quebe
c
Frederic
ton
Halifax
St. Joh
n'sPerc
enta
ge o
f Fre
eze-
free
Sea
sons
Baseline CGCM2A2x HADCM3B21
Figure 26. Occurrence of ‘freeze-free’ seasons for all sites under baseline and future climate scenarios.
The Road Well-traveled: Implications of Climate Change for Pavement Infrastructure in Southern Canada 40
3.2 Mechanistic-Empirical Pavement Design Guide (MEPDG) Application The analysis of deterioration-relevant climate indicators revealed important implications that may result from climate change. However, the analysis was conducted independent of adjustments in several factors important in determining future patterns of deterioration, including other environmental variables (e.g., moisture) and those related to pavement structure, traffic, construction, and maintenance. The next set of case studies were designed to begin probing how the combination of such factors might affect the deterioration and performance of pavement sections over time as measured in terms of International Roughness Index (IRI), cracking (both load- and environment-related), and permanent deformation or rutting. The United States NCHRP/AASHTO Mechanistic-Empirical Pavement Design Guide (MEPDG) and software were used to conduct the case studies, in part because of the interest in applying MEPDG in Canada. The Transportation Association of Canada has established a pooled fund study, with representation from all provincial departments of transportation as well as several large Canadian municipalities, in order to adapt the MEPDG for Canadian conditions. Methods and Data MEPDG is being developed to assist engineers in making decisions about asphalt and concrete pavement design and rehabilitations based on the application of state-of-the-practice mechanistic-empirical principles (NCHRP, 2004b). It allows the user to test various assumptions or scenarios concerning the variables noted above. In doing so, it provides output concerning the progression of pavement deterioration and performance and the adequacy of various pavement designs. The primary inputs required to run MEPDG include:
• general site and project information (e.g., design type, design life, construction and opening dates);
• analysis parameters (e.g., initial and terminal IRI, various forms of cracking, permanent deformation), critical values, and reliability (used to account for error in predictions of various distresses);
• traffic assumptions (e.g., lane alignment, baseline volume and future growth and distribution of truck traffic);
• pavement structure (e.g., specification of layer thicknesses and material properties); and • climate (e.g., station location and elevation, groundwater table level, hourly temperature
data). A comprehensive description of all of these inputs and underlying mechanistic-empirical engineering principles, methods, and assumptions is beyond the scope of this report but is accessible from NCHRP (2004b). In addition to the incorporation of mechanistic approaches and the flexible user interface software, a key improvement in MEPDG from past design guides (e.g., AASHTO, 1993) is the development of the Enhanced Integrated Climate Model (EICM). The EICM is a one-dimensional coupled heat and moisture flow program that simulates changes in the behaviour and characteristics of pavement and subgrade material in response to climatic conditions (ARA Inc., 2004; NCHRP 2004b). This feature permits the calculation of transient distresses throughout the life of the pavement that are not tied to one particular test site or location. It must be noted that MEPDG is still being refined and improved and, although useful for exploratory studies such as the current investigation, it is not yet suitable as the primary decision input for pavement construction and rehabilitation (NCHRP, 2006a, 2006b).

The Road Well-traveled: Implications of Climate Change for Pavement Infrastructure in Southern Canada 41
Six test sites were selected from the Long Term Pavement Performance (LTPP) program (U.S. Department of Transportation, 2007) for analysis. The LTPP is composed of American, Canadian, and Danish test sites that are used to study the effect of different factors on the long term performance of pavements. There are approximately 129 test sites and 285 test sections across Canada (Table 8). Although each Canadian province is represented, almost 90 percent of sites are located in Alberta, Manitoba, Ontario, Quebec and Saskatchewan. The selected test sites are profiled in Table 9 and represent a range of pavement structures and materials that are found in Canada. Baseline traffic, pavement structure, and pavement material characteristics were extracted from the LTPP database (U.S. Department of Transportation, 2007) while climate data for the nearest suitable climate observing station were obtained from Environment Canada. The climate data consisted of hourly records of air temperature, relative humidity, cloud amount, and wind speed, and 6-hourly or daily records of precipitation for the period 1990-2005. Since MEPDG requires hourly data, the 6-hourly and daily precipitation amounts were distributed evenly across respective periods13. The percent sunshine variable required by MEPDG was derived from hourly cloud amount information. A detailed account of the material properties, default values, and assumptions used for each site is provided in Appendix C. Table 8. Summary of LTPP test sites in Canada Province
Total test sites
Percent of total test sites
Total test sections
Percent of total test sections
Alberta 19 14.7 32 11.2 British Columbia 4 3.1 9 3.2 Manitoba 23 17.8 85 29.8 New Brunswick 4 3.1 9 3.2 Newfoundland 3 2.3 5 1.8 Nova Scotia 1 0.8 5 1.8 Ontario 27 20.9 45 15.8 Prince Edward Island 3 2.3 9 3.2 Quebec 18 14.0 29 10.2 Saskatchewan 27 20.9 57 20.0
Total 129 100.0 285 100.0 A 20-year design life, commencing during the month of August, was chosen for the analysis of pavement performance for all MEPDG applications. The key analysis parameters and associated design thresholds are defined in Table 10. Limits, for example an IRI value of 2.7 m/km, are used as triggers for pavement repair, rehabilitation, and reconstruction decisions. A reliability factor is also assigned to each parameter to account for the various uncertainties in predicting future pavement deterioration. Results for the standard MEPDG output (average or 50 percent reliability) and 90 percent reliability level are reported in the current project. A reliability of 50 percent might represent a typical design criterion for a local or collector road while a reliability of 90 percent would be applied to a principal arterial or freeway.
13 Tests were conducted to determine the effect of different downscaling approaches. MEPDG results were found to be insensitive to different approaches to distributing precipitation amounts thus the simple method was adopted.
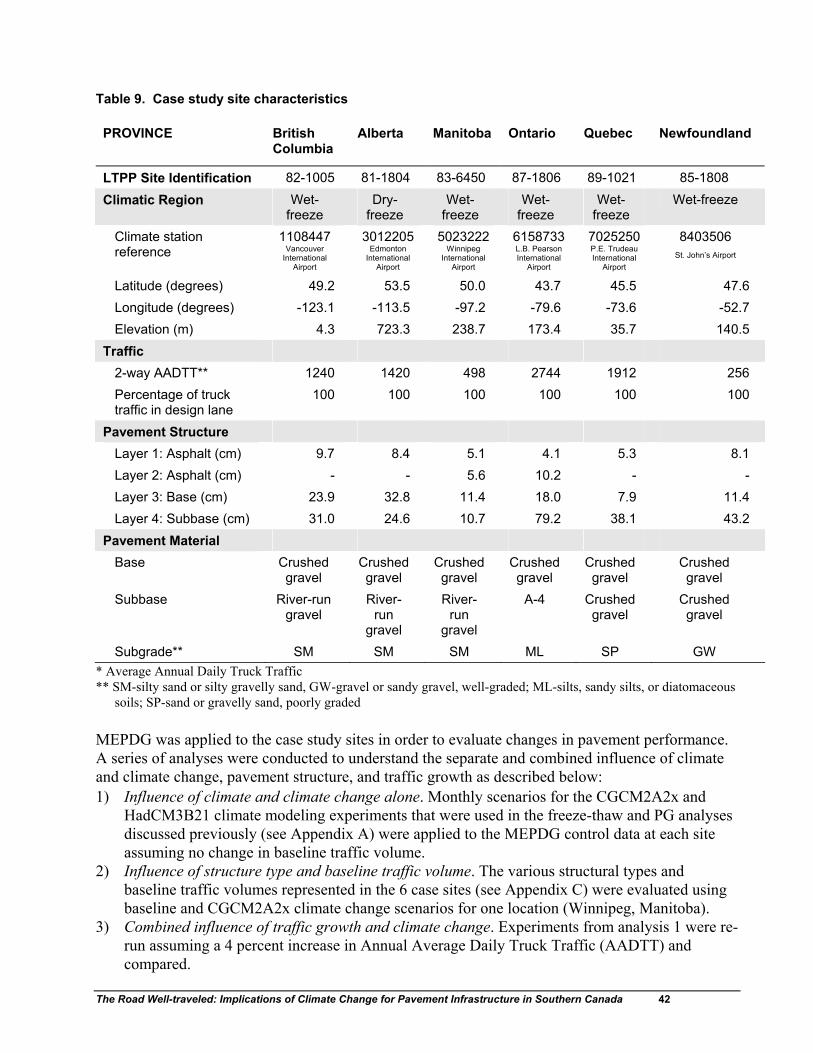
The Road Well-traveled: Implications of Climate Change for Pavement Infrastructure in Southern Canada 42
Table 9. Case study site characteristics PROVINCE
British Columbia
Alberta Manitoba Ontario Quebec Newfoundland
LTPP Site Identification 82-1005 81-1804 83-6450 87-1806 89-1021 85-1808
Climatic Region Wet-freeze
Dry-freeze
Wet-freeze
Wet-freeze
Wet-freeze
Wet-freeze
Climate station reference
1108447 Vancouver
International Airport
3012205 Edmonton
International Airport
5023222 Winnipeg
International Airport
6158733 L.B. Pearson International
Airport
7025250 P.E. Trudeau International
Airport
8403506
St. John’s Airport
Latitude (degrees) 49.2 53.5 50.0 43.7 45.5 47.6 Longitude (degrees) -123.1 -113.5 -97.2 -79.6 -73.6 -52.7 Elevation (m) 4.3 723.3 238.7 173.4 35.7 140.5
Traffic 2-way AADTT** 1240 1420 498 2744 1912 256 Percentage of truck traffic in design lane
100 100 100 100 100 100
Pavement Structure Layer 1: Asphalt (cm) 9.7 8.4 5.1 4.1 5.3 8.1 Layer 2: Asphalt (cm) - - 5.6 10.2 - - Layer 3: Base (cm) 23.9 32.8 11.4 18.0 7.9 11.4 Layer 4: Subbase (cm) 31.0 24.6 10.7 79.2 38.1 43.2
Pavement Material Base Crushed
gravel Crushed gravel
Crushed gravel
Crushed gravel
Crushed gravel
Crushed gravel
Subbase River-run gravel
River-run
gravel
River-run
gravel
A-4 Crushed gravel
Crushed gravel
Subgrade** SM SM SM ML SP GW * Average Annual Daily Truck Traffic ** SM-silty sand or silty gravelly sand, GW-gravel or sandy gravel, well-graded; ML-silts, sandy silts, or diatomaceous
soils; SP-sand or gravelly sand, poorly graded MEPDG was applied to the case study sites in order to evaluate changes in pavement performance. A series of analyses were conducted to understand the separate and combined influence of climate and climate change, pavement structure, and traffic growth as described below: 1) Influence of climate and climate change alone. Monthly scenarios for the CGCM2A2x and
HadCM3B21 climate modeling experiments that were used in the freeze-thaw and PG analyses discussed previously (see Appendix A) were applied to the MEPDG control data at each site assuming no change in baseline traffic volume.
2) Influence of structure type and baseline traffic volume. The various structural types and baseline traffic volumes represented in the 6 case sites (see Appendix C) were evaluated using baseline and CGCM2A2x climate change scenarios for one location (Winnipeg, Manitoba).
3) Combined influence of traffic growth and climate change. Experiments from analysis 1 were re-run assuming a 4 percent increase in Annual Average Daily Truck Traffic (AADTT) and compared.
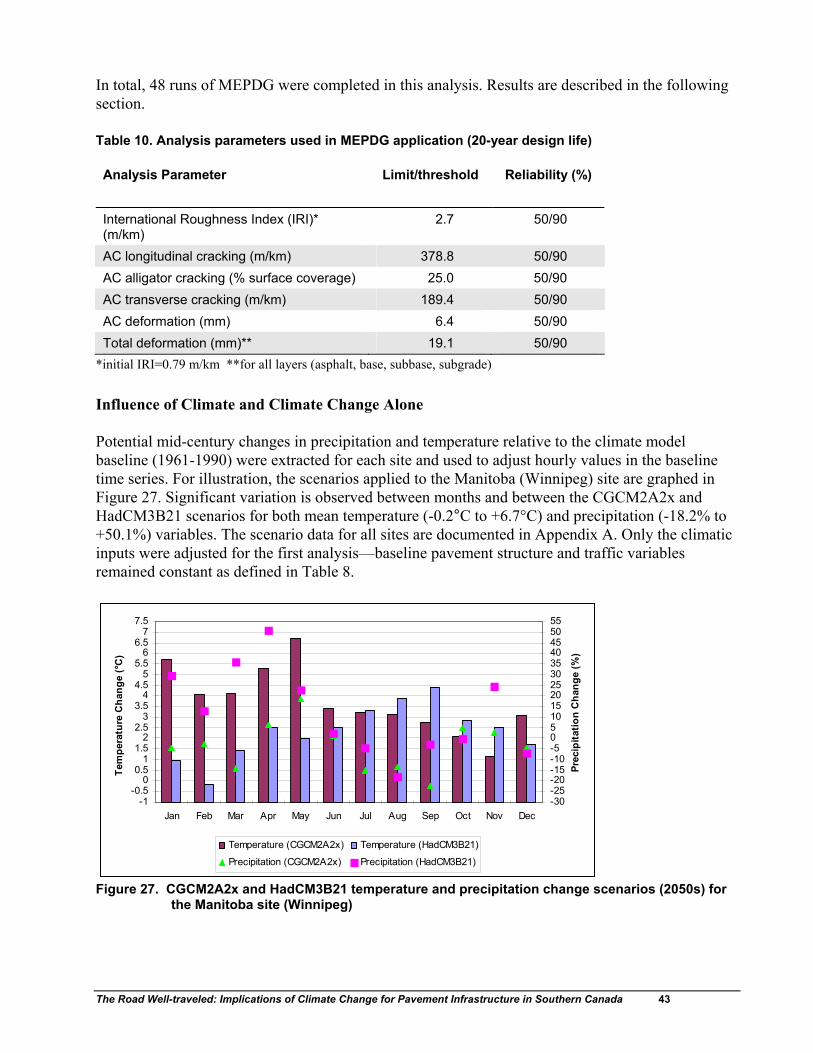
The Road Well-traveled: Implications of Climate Change for Pavement Infrastructure in Southern Canada 43
In total, 48 runs of MEPDG were completed in this analysis. Results are described in the following section. Table 10. Analysis parameters used in MEPDG application (20-year design life) Analysis Parameter
Limit/threshold Reliability (%)
International Roughness Index (IRI)* (m/km)
2.7 50/90
AC longitudinal cracking (m/km) 378.8 50/90 AC alligator cracking (% surface coverage) 25.0 50/90 AC transverse cracking (m/km) 189.4 50/90 AC deformation (mm) 6.4 50/90 Total deformation (mm)** 19.1 50/90
*initial IRI=0.79 m/km **for all layers (asphalt, base, subbase, subgrade) Influence of Climate and Climate Change Alone Potential mid-century changes in precipitation and temperature relative to the climate model baseline (1961-1990) were extracted for each site and used to adjust hourly values in the baseline time series. For illustration, the scenarios applied to the Manitoba (Winnipeg) site are graphed in Figure 27. Significant variation is observed between months and between the CGCM2A2x and HadCM3B21 scenarios for both mean temperature (-0.2°C to +6.7°C) and precipitation (-18.2% to +50.1%) variables. The scenario data for all sites are documented in Appendix A. Only the climatic inputs were adjusted for the first analysis—baseline pavement structure and traffic variables remained constant as defined in Table 8.
-1-0.5
00.5
11.5
22.5
33.5
44.5
55.5
66.5
77.5
Jan Feb Mar Apr May Jun Jul Aug Sep Oct Nov Dec
Tem
pera
ture
Cha
nge
(°C
)
-30-25-20-15-10-50510152025303540455055
Prec
ipita
tion
Cha
nge
(%)
Temperature (CGCM2A2x) Temperature (HadCM3B21)
Precipitation (CGCM2A2x) Precipitation (HadCM3B21)
Figure 27. CGCM2A2x and HadCM3B21 temperature and precipitation change scenarios (2050s) for the Manitoba site (Winnipeg)

The Road Well-traveled: Implications of Climate Change for Pavement Infrastructure in Southern Canada 44
Changes in Pavement Deterioration Baseline and climate change scenario results for all performance parameters and all sites are summarized in Table 11. Baseline values (reported in either m/km or mm) and relative percent changes for each climate scenario represent conditions at the completion of the 20-year design life (i.e., terminal results). Performance parameter values under baseline conditions varied considerably among the sites. For example, IRI values ranged from 1.55 m/km at the B.C. site to 2.54 m/km at the Manitoba site, reflecting differences in structure, traffic loads, and climate. The only distress variable that remained relatively constant across most sites was transverse cracking. Initiated by extreme cold temperatures, transverse cracking lengths quickly reached maximum values of about 400 m/km at all sites except the British Columbia (Vancouver) location which experiences the mildest climate among the sites analyzed. This result likely indicates an over-prediction of this particular form of cracking and underlying issues with the distress algorithms and assumptions within the MEPDG. In practice, it is believed that by adopting the PGAC, a significant portion of the transverse thermal cracking can be addressed. Table 11. MEPDG pavement performance results for all sites (climate change alone) Case Study Site IRI (%
change)* Cracking (% change)* Deformation (%
change)* Longitudinal Alligator Transverse AC Total**
British Columbia (baseline) 1.55 m/km 6.8 m/km 0.7% 19.1 m/km 2.1 mm 10.7 mm
CGCMA2x -0.7 -1.9 7.5 -96.9 16.9 3.8
HadCM3B21 1.9 0.0 10.5 87.1 19.3 4.8
Alberta (baseline) 2.34 m/km 551.1 m/km 28.9% 399.6 m/km 5.5 mm 19.0 mm
CGCMA2x 1.3 9.3 11.4 0.0 22.7 -0.5
HadCM3B21 1.7 5.8 7.3 0.0 31.8 4.7
Manitoba (baseline) 2.54 m/km 450.8 m/km 48.2% 399.6 m/km 2.9 mm 14.5 mm
CGCMA2x 2.0 2.9 6.0 0.0 35.9 -0.9
HadCM3B21 2.4 2.9 5.8 0.0 34.1 2.3
Ontario (baseline) 1.92 m/km 33.3 m/km 4.6% 399.6 m/km 4.2 mm 12.1 mm
CGCMA2x 1.0 1.7 10.5 0.0 27.0 9.0
HadCM3B21 1.6 5.7 13.1 0.0 28.9 10.3
Quebec (baseline) 2.12 m/km 1647.7 m/km 0.5% 399.6 m/km 5.3 mm 21.8 mm
CGCMA2x -0.9 0.0 4.4 0.0 13.9 -3.2
HadCM3B21 -0.5 -0.7 2.2 0.0 16.8 -0.8
Newfoundland (baseline) 1.79 m/km 5.3 m/km 0.1% 399.6 m/km 1.2 mm 9.1 mm
CGCMA2x -1.1 5.4 14.3 0.0 21.9 -1.1
HadCM3B21 -0.6 4.3 14.3 0.0 21.9 0.6
*results rounded to one decimal (except absolute IRI values) **includes all layers (asphalt, base, subbase, and subgrade) As noted, the primary objective of the MEPDG analysis was to evaluate relative, not absolute, changes in pavement performance between baseline and future climate change scenarios. The most significant differences between baseline and future climate scenarios were observed for the asphalt concrete (AC) rutting parameter. AC rutting increased at all sites, from a minimum of 14 percent at the Quebec site (CGCM2A2x scenario) to a maximum of 36 percent at the Manitoba location (CGCM2A2x scenario). Increases relative to the baseline were similar (within in a few percent) for
The Road Well-traveled: Implications of Climate Change for Pavement Infrastructure in Southern Canada 45
both climate change scenarios except for the Alberta site where the HadCM3B21 scenario produced about 9 percent more AC rutting than the CGCM2A2x scenario. Much less change was observed for the total rutting parameter which suggests that deformation was reduced in the lower layers thus compensating for AC rutting. Changes in total rutting ranged from a reduction of 3 percent at the Quebec site (CGCM2A2x scenario) to an increase of about 10 percent at the Ontario site (HadCM3B21 scenario). As with rutting in the AC layer, the changes relative to the baseline for both climate scenarios were consistently within a few percentage points of each other. However, the direction of the changes differed for the Alberta, Manitoba, and Newfoundland sites with slight reductions under the CGCM2A2x climate and small increases in total rutting under HadCM3B21 conditions. In general, modest increases under climate change conditions were observed for the various cracking parameters relative to the baseline. A slight rise in longitudinal cracking was reported for most sites except for British Columbia and Quebec, where no change or small decreases were recorded. Somewhat larger increases, from 2 (Quebec site, HadCM3B21 scenario) to 14 (Newfoundland site, CGCM2A2x scenario) percent, were observed for alligator cracking. The high relative changes at the Newfoundland site are associated with very small absolute changes in baseline cracking though. In terms of transverse cracking, deterioration reached maximum values of approximately 400 m/km under each of the climate change scenarios tests as it did for the baseline run at 5 of the 6 sites, resulting in a zero net change. At the warmer British Columbia site, transverse cracking was virtually eliminated under the CGCM2A2x scenario (97 percent reduction) and almost doubled (87 percent increase) under HadCM3B21 conditions. Despite issues with this form of cracking in MEPDG, the British Columbia results for the CGCM2A2x scenario are intuitively consistent with our understanding of cracking processes and may be more representative of future patterns in much of southern Canada than results from the other sites. The increase in cracking stemming from the HadCM3B21 scenario is coincident with a regional area of relative cooling during the early winter period that is somewhat anomalous when compared to most areas in Canada. The least amount of change between baseline and future climate scenarios was observed for the IRI performance parameter. Very small changes (i.e., less than 3 percent) in terminal IRI were observed under the CGCM2A2x and HadCM3B21 climate scenarios examined. Slight decreases in roughness were apparent at the two eastern (both scenarios) and British Columbia (CGCM2A2x scenario) sites while slight increases were apparent at the remaining locations. Changes in the Timing of Maintenance Requirements Terminal values of performance indicate the state of a pavement at the end of its service life. Just as important is the time-dependent evolution of deterioration relative to maintenance, rehabilitation and reconstruction thresholds. Parameter limits associated with a 20-year design life as defined in Table 10 were used to explore changes in the timing of maintenance requirements. Figures 28a-33b summarize when these limits were exceeded at the various sites for baseline and climate change scenarios. Figures denoted with an “a” or “b” show results obtained at the 50 and 90 percent reliability levels, respectively. At the 50 percent reliability level, 11 out of 36 possible parameter limits (6 sites x 6 parameters) were exceeded at some point during the 20-year design life under baseline climate conditions.

The Road Well-traveled: Implications of Climate Change for Pavement Infrastructure in Southern Canada 46
Thresholds were not achieved for any parameter at the British Columbia site or for the IRI and AC rutting parameters at any of the sites. Total rutting (all layers), longitudinal cracking, and alligator cracking criteria were met at 1 (Quebec, 10.9 years), 3 (Alberta, 14.8 years; Manitoba, 17.1 years; Quebec, 2.8 years), and 2 (Alberta, 17 years; Manitoba, 8.1 years) sites, respectively. With the exception of British Columbia, all sites reached transverse cracking thresholds early during the first winter season. As noted previously, transverse cracking would be negligible based on a proper PG selection. After analyzing the climate change scenarios, two parameter limits (13 of 36) were added to those exceeded under baseline conditions. As with the baseline, no parameter limits were reached for the British Columbia site and IRI criteria were not met at any site under the CGCM2A2x or HadCM3B21 climate change scenarios. For most other parameters and sites, the general influence of climate change was to reduce the amount of time until maintenance, rehabilitation or reconstruction thresholds were met. The reductions ranged from less than 1 year (Manitoba, alligator cracking, CGCM2A2x and HadCM3B21 scenarios) to over 5 years (Alberta, AC rutting, HadCM3B21 scenario). Results for the Quebec site (total rutting, longitudinal cracking) and for the transverse cracking parameter were just the opposite, with climate change inducing a slight delay in the timing when limits were reached. General results similar to those noted for the 50 percent reliability level were also realized at the 90 percent level. As expected, the more stringent failure criterion produced a greater number of exceedances (16 out of 3014) much earlier during the design life under baseline conditions, but the overall patterns remained similar. For example, no limits were reached at the British Columbia site. While IRI thresholds were not met at any site at the 50 percent reliability level, 3 sites exceeded thresholds at 90 percent reliability (Alberta, 14.3 years; Manitoba, 12.4 years; Quebec, 17.8 years). Total rutting, longitudinal cracking, and alligator cracking criteria were met at 2 (Alberta, 8 years; Quebec, 4.3 years), 4 (Alberta, 1.8 years; Manitoba, 1.8 years; Ontario, 11.8 years; Quebec, 0.7 years), and 2 (Alberta, 5.2 years; Manitoba, 2.1 years) sites, respectively. All sites other than British Columbia reached transverse cracking thresholds early during the first winter season. The parameter limits reached under the climate change scenarios were identical to those achieved under baseline conditions at the 90 percent reliability level. Once again, no thresholds were exceeded at the British Columbia site. At the remaining sites and consistent with observations at the 50 percent reliability level, the general effect of the climate change scenarios at the 90 percent reliability level was to shorten the length of time before IRI, longitudinal cracking, and alligator cracking thresholds were met and to delay the timing of reaching transverse cracking and total rutting limits. This pattern was not followed at the Alberta site, where total rutting thresholds were met earlier under the HadCM3B21 scenario, and at the Quebec site where additional time was required to meet IRI thresholds under both climate change scenarios. In all cases, the relative change between the baseline and climate change scenarios was less than one year.
14 MEPDG does not provide an output for the AC rutting parameter for reliability levels other than the standard 50 percent level thus the total number of parameter limits is 30 (6 sites x 5 parameters).

The Road Well-traveled: Implications of Climate Change for Pavement Infrastructure in Southern Canada 47
02468
101214161820
Baseline CGCM2A2x HadCM3B21
Climate Change Scenario
Year
s to
reac
h m
aint
enan
ce li
mit
IRI Longitudinal cracking Alligator cracking
Transverse cracking AC rutting Total rutting
*values greater than 20 years indicate parameter limits not reached during design life Figure 28a. Years to reach performance parameter limits (50% reliability maintenance thresholds)
under no traffic growth scenario at the British Columbia site (Vancouver)
02468
101214161820
Baseline CGCM2A2x HadCM3B21
Climate Change Scenario
Year
s to
reac
h m
aint
enan
ce li
mit
(at 9
0% re
liabi
lity)
IRI Longitudinal cracking Alligator cracking Transverse cracking Total rutting
*values greater than 20 years indicate parameter limits not reached during design life Figure 28b. Years to reach performance parameter limits (90% reliability maintenance thresholds)
under no traffic growth scenario at the British Columbia site (Vancouver)
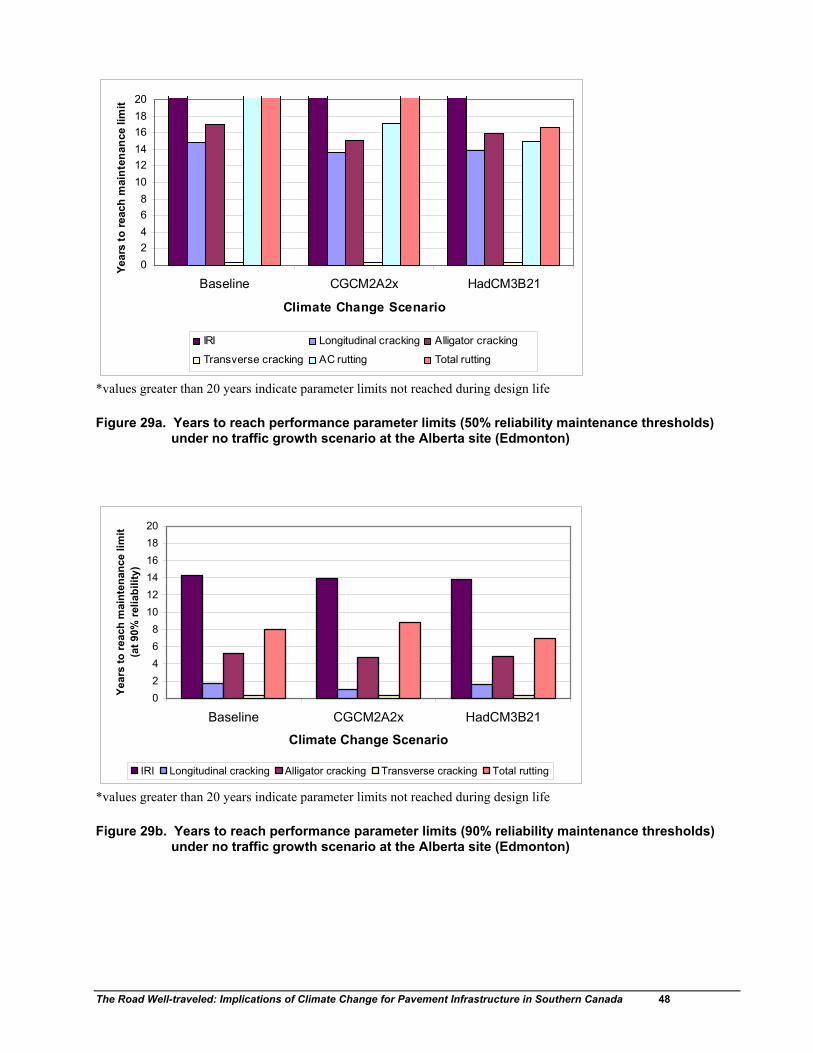
The Road Well-traveled: Implications of Climate Change for Pavement Infrastructure in Southern Canada 48
02468
101214161820
Baseline CGCM2A2x HadCM3B21
Climate Change Scenario
Year
s to
reac
h m
aint
enan
ce li
mit
IRI Longitudinal cracking Alligator cracking
Transverse cracking AC rutting Total rutting
*values greater than 20 years indicate parameter limits not reached during design life Figure 29a. Years to reach performance parameter limits (50% reliability maintenance thresholds)
under no traffic growth scenario at the Alberta site (Edmonton)
02468
101214161820
Baseline CGCM2A2x HadCM3B21
Climate Change Scenario
Year
s to
reac
h m
aint
enan
ce li
mit
(at 9
0% re
liabi
lity)
IRI Longitudinal cracking Alligator cracking Transverse cracking Total rutting
*values greater than 20 years indicate parameter limits not reached during design life Figure 29b. Years to reach performance parameter limits (90% reliability maintenance thresholds)
under no traffic growth scenario at the Alberta site (Edmonton)

The Road Well-traveled: Implications of Climate Change for Pavement Infrastructure in Southern Canada 49
02468
101214161820
Baseline CGCM2A2x HadCM3B21
Climate Change Scenario
Year
s to
reac
h m
aint
enan
ce li
mit
IRI Longitudinal cracking Alligator cracking
Transverse cracking AC rutting Total rutting
*values greater than 20 years indicate parameter limits not reached during design life Figure 30a. Years to reach performance parameter limits (50% reliability maintenance thresholds)
under no traffic growth scenario at the Manitoba site (Winnipeg)
02468
101214161820
Baseline CGCM2A2x HadCM3B21
Climate Change Scenario
Year
s to
reac
h m
aint
enan
ce li
mit
(at 9
0% re
liabi
lity)
IRI Longitudinal cracking Alligator cracking Transverse cracking Total rutting
*values greater than 20 years indicate parameter limits not reached during design life Figure 30b. Years to reach performance parameter limits (90% reliability maintenance thresholds)
under no traffic growth scenario at the Manitoba site (Winnipeg)
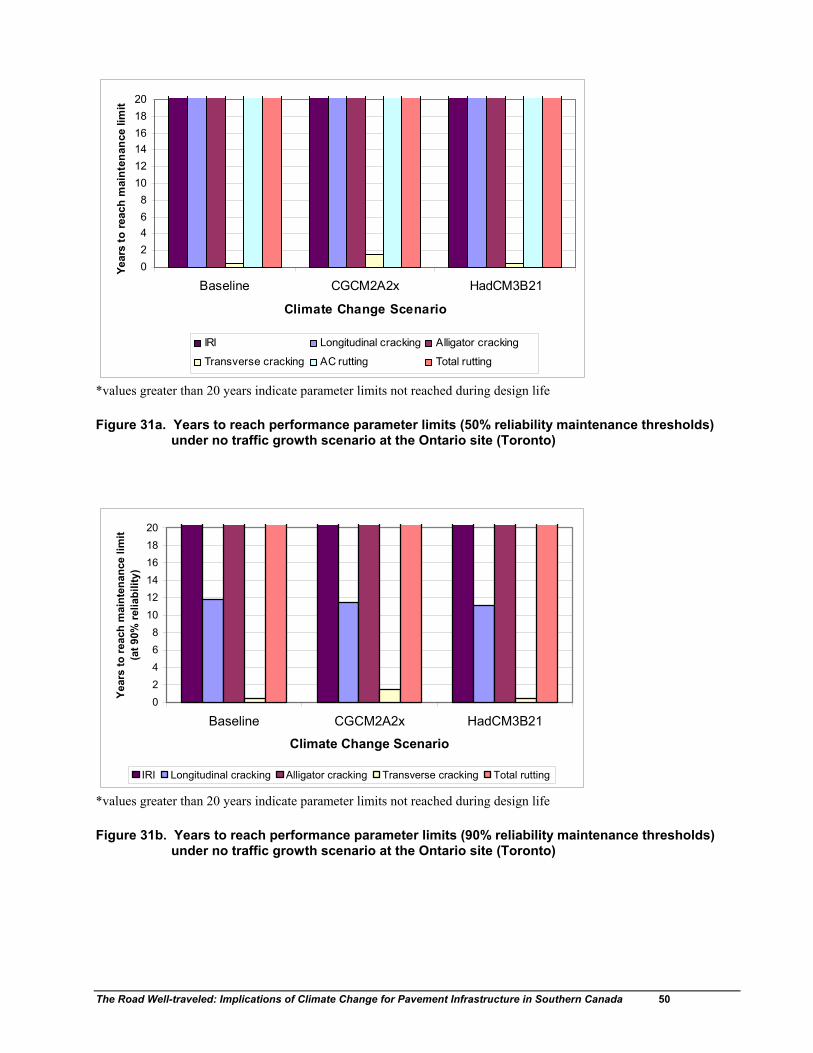
The Road Well-traveled: Implications of Climate Change for Pavement Infrastructure in Southern Canada 50
02468
101214161820
Baseline CGCM2A2x HadCM3B21
Climate Change Scenario
Year
s to
reac
h m
aint
enan
ce li
mit
IRI Longitudinal cracking Alligator cracking
Transverse cracking AC rutting Total rutting
*values greater than 20 years indicate parameter limits not reached during design life Figure 31a. Years to reach performance parameter limits (50% reliability maintenance thresholds)
under no traffic growth scenario at the Ontario site (Toronto)
02468
101214161820
Baseline CGCM2A2x HadCM3B21
Climate Change Scenario
Year
s to
reac
h m
aint
enan
ce li
mit
(at 9
0% re
liabi
lity)
IRI Longitudinal cracking Alligator cracking Transverse cracking Total rutting
*values greater than 20 years indicate parameter limits not reached during design life Figure 31b. Years to reach performance parameter limits (90% reliability maintenance thresholds)
under no traffic growth scenario at the Ontario site (Toronto)

The Road Well-traveled: Implications of Climate Change for Pavement Infrastructure in Southern Canada 51
02468
101214161820
Baseline CGCM2A2x HadCM3B21
Climate Change Scenario
Year
s to
reac
h m
aint
enan
ce li
mit
IRI Longitudinal cracking Alligator cracking
Transverse cracking AC rutting Total rutting
*values greater than 20 years indicate parameter limits not reached during design life Figure 32a. Years to reach performance parameter limits (50% reliability maintenance thresholds)
under no traffic growth scenario at the Quebec site (Montreal)
02468
101214161820
Baseline CGCM2A2x HadCM3B21
Climate Change Scenario
Year
s to
reac
h m
aint
enan
ce li
mit
(at 9
0% re
liabi
lity)
IRI Longitudinal cracking Alligator cracking Transverse cracking Total rutting
*values greater than 20 years indicate parameter limits not reached during design life Figure 32b. Years to reach performance parameter limits (90% reliability maintenance thresholds)
under no traffic growth scenario at the Quebec site (Montreal)

The Road Well-traveled: Implications of Climate Change for Pavement Infrastructure in Southern Canada 52
02468
101214161820
Baseline CGCM2A2x HadCM3B21
Climate Change Scenario
Year
s to
reac
h m
aint
enan
ce li
mit
IRI Longitudinal cracking Alligator cracking
Transverse cracking AC rutting Total rutting
*values greater than 20 years indicate parameter limits not reached during design life Figure 33a. Years to reach performance parameter limits (50% reliability maintenance thresholds)
under no traffic growth scenario at the Newfoundland site (St. John’s)
02468
101214161820
Baseline CGCM2A2x HadCM3B21
Climate Change Scenario
Year
s to
reac
h m
aint
enan
ce li
mit
(at 9
0% re
liabi
lity)
IRI Longitudinal cracking Alligator cracking Transverse cracking Total rutting
*values greater than 20 years indicate parameter limits not reached during design life Figure 33b. Years to reach performance parameter limits (90% reliability maintenance thresholds)
under no traffic growth scenario at the Newfoundland site (St. John’s)
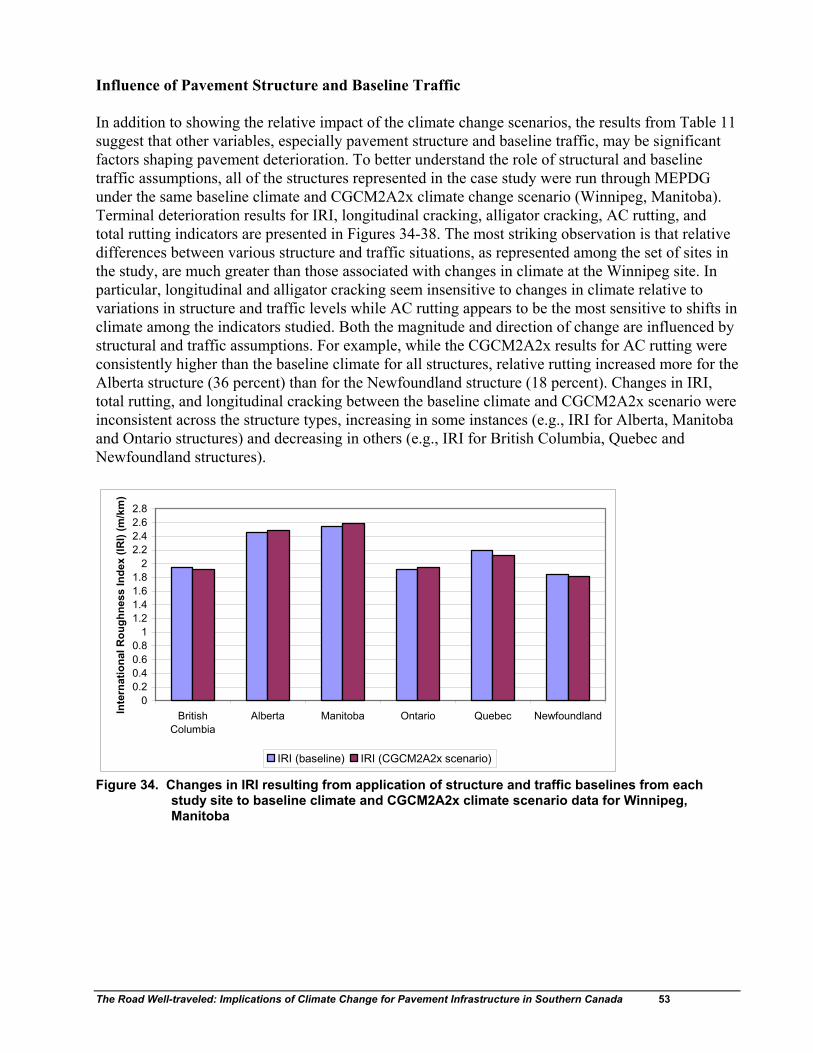
The Road Well-traveled: Implications of Climate Change for Pavement Infrastructure in Southern Canada 53
Influence of Pavement Structure and Baseline Traffic In addition to showing the relative impact of the climate change scenarios, the results from Table 11 suggest that other variables, especially pavement structure and baseline traffic, may be significant factors shaping pavement deterioration. To better understand the role of structural and baseline traffic assumptions, all of the structures represented in the case study were run through MEPDG under the same baseline climate and CGCM2A2x climate change scenario (Winnipeg, Manitoba). Terminal deterioration results for IRI, longitudinal cracking, alligator cracking, AC rutting, and total rutting indicators are presented in Figures 34-38. The most striking observation is that relative differences between various structure and traffic situations, as represented among the set of sites in the study, are much greater than those associated with changes in climate at the Winnipeg site. In particular, longitudinal and alligator cracking seem insensitive to changes in climate relative to variations in structure and traffic levels while AC rutting appears to be the most sensitive to shifts in climate among the indicators studied. Both the magnitude and direction of change are influenced by structural and traffic assumptions. For example, while the CGCM2A2x results for AC rutting were consistently higher than the baseline climate for all structures, relative rutting increased more for the Alberta structure (36 percent) than for the Newfoundland structure (18 percent). Changes in IRI, total rutting, and longitudinal cracking between the baseline climate and CGCM2A2x scenario were inconsistent across the structure types, increasing in some instances (e.g., IRI for Alberta, Manitoba and Ontario structures) and decreasing in others (e.g., IRI for British Columbia, Quebec and Newfoundland structures).
00.20.40.60.8
11.21.41.61.8
22.22.42.62.8
BritishColumbia
Alberta Manitoba Ontario Quebec NewfoundlandInte
rnat
iona
l Rou
ghne
ss In
dex
(IRI)
(m/k
m)
IRI (baseline) IRI (CGCM2A2x scenario)
Figure 34. Changes in IRI resulting from application of structure and traffic baselines from each study site to baseline climate and CGCM2A2x climate scenario data for Winnipeg, Manitoba
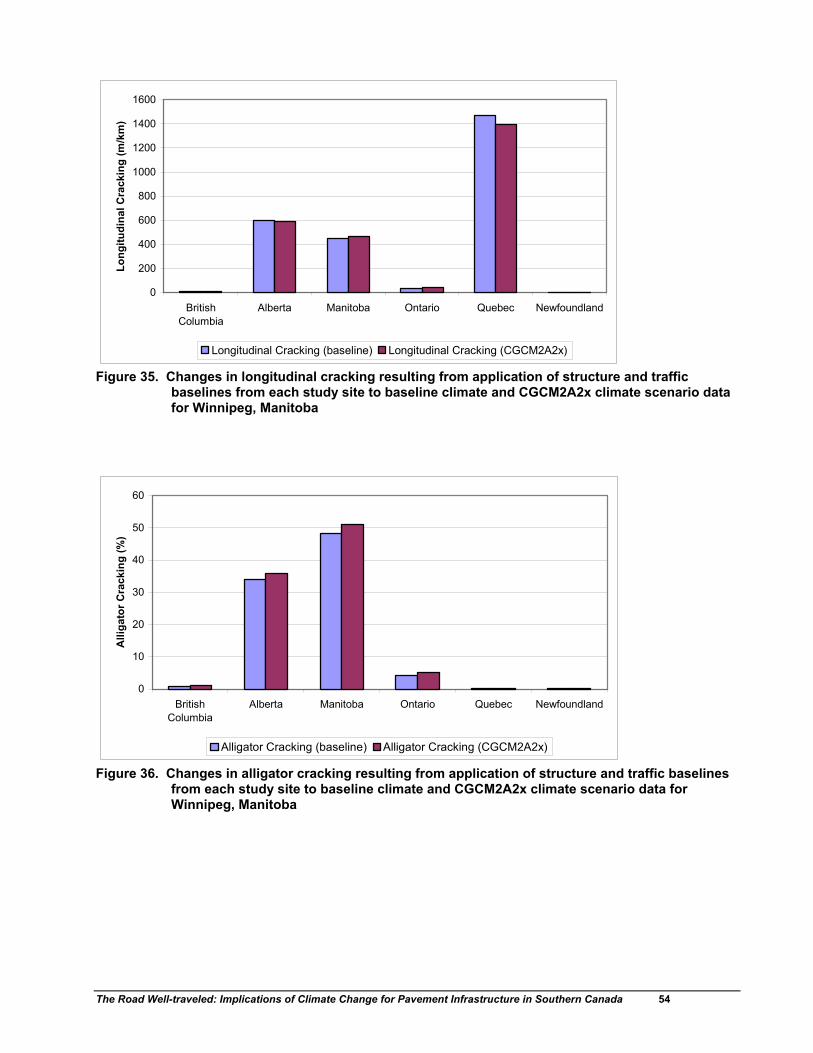
The Road Well-traveled: Implications of Climate Change for Pavement Infrastructure in Southern Canada 54
0
200
400
600
800
1000
1200
1400
1600
BritishColumbia
Alberta Manitoba Ontario Quebec Newfoundland
Long
itudi
nal C
rack
ing
(m/k
m)
Longitudinal Cracking (baseline) Longitudinal Cracking (CGCM2A2x)
Figure 35. Changes in longitudinal cracking resulting from application of structure and traffic baselines from each study site to baseline climate and CGCM2A2x climate scenario data for Winnipeg, Manitoba
0
10
20
30
40
50
60
BritishColumbia
Alberta Manitoba Ontario Quebec Newfoundland
Alli
gato
r Cra
ckin
g (%
)
Alligator Cracking (baseline) Alligator Cracking (CGCM2A2x)
Figure 36. Changes in alligator cracking resulting from application of structure and traffic baselines from each study site to baseline climate and CGCM2A2x climate scenario data for Winnipeg, Manitoba

The Road Well-traveled: Implications of Climate Change for Pavement Infrastructure in Southern Canada 55
0
1
2
3
4
5
6
7
8
9
10
BritishColumbia
Alberta Manitoba Ontario Quebec Newfoundland
AC
Rut
ting
(mm
)
AC Rutting (baseline) AC Rutting (CGCM2A2x)
Figure 37. Changes in AC rutting resulting from application of structure and traffic baselines from each study site to baseline climate and CGCM2A2x climate scenario data for Winnipeg, Manitoba
02468
10121416182022242628
BritishColumbia
Alberta Manitoba Ontario Quebec Newfoundland
Tota
l Rut
ting
(mm
)
Total Rutting (baseline) Total Rutting (CGCM2A2x)
Figure 38. Changes in total rutting resulting from application of structure and traffic baselines from each study site to baseline climate and CGCM2A2x climate scenario data for Winnipeg, Manitoba
Combined Influence of Climate Change and Traffic Growth While many structural factors or assumptions remain constant throughout the pavement design life, the amount of traffic does not. Loads in most regions of southern Canada are likely to increase through time in conjunction with trends in population and economic growth. In order to understand the effect of increasing traffic on baseline results, the MEPDG control data sets for each site were
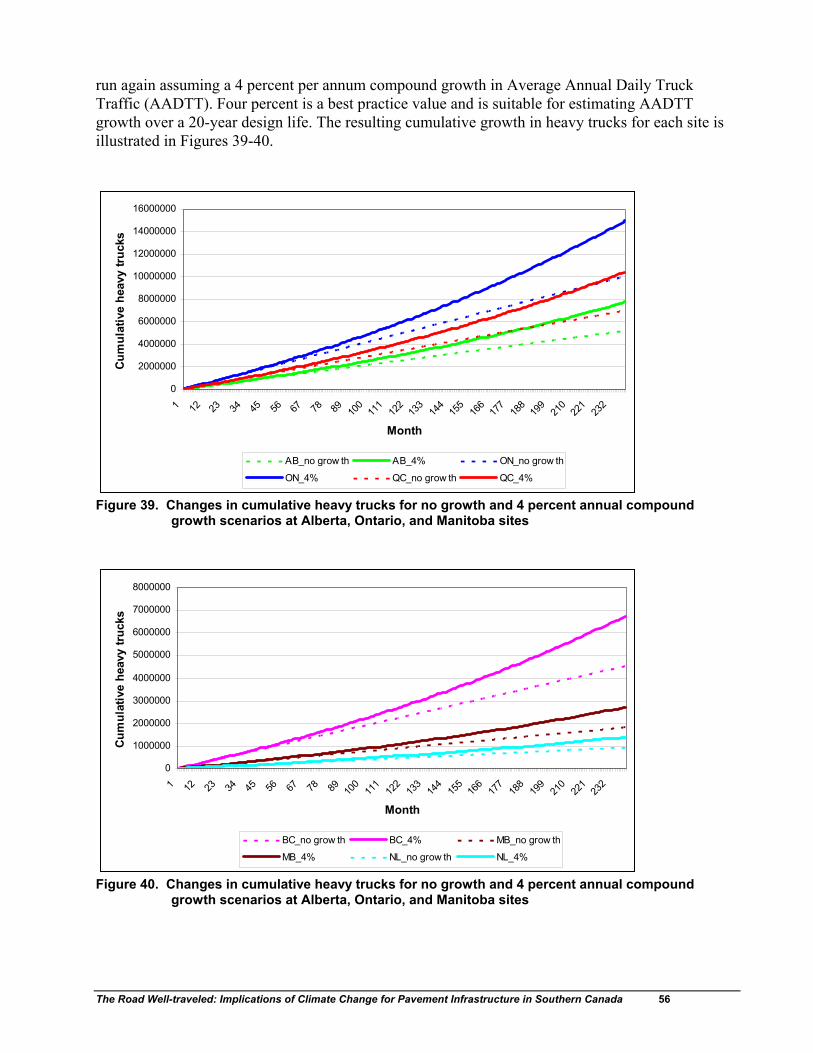
The Road Well-traveled: Implications of Climate Change for Pavement Infrastructure in Southern Canada 56
run again assuming a 4 percent per annum compound growth in Average Annual Daily Truck Traffic (AADTT). Four percent is a best practice value and is suitable for estimating AADTT growth over a 20-year design life. The resulting cumulative growth in heavy trucks for each site is illustrated in Figures 39-40.
0
2000000
4000000
6000000
8000000
10000000
12000000
14000000
16000000
1 12 23 34 45 56 67 78 89 100
111
122
133
144
155
166
177
188
199
210
221
232
Month
Cum
ulat
ive
heav
y tru
cks
AB_no grow th AB_4% ON_no grow th
ON_4% QC_no grow th QC_4%
Figure 39. Changes in cumulative heavy trucks for no growth and 4 percent annual compound growth scenarios at Alberta, Ontario, and Manitoba sites
0
1000000
2000000
3000000
4000000
5000000
6000000
7000000
8000000
1 12 23 34 45 56 67 78 89 100
111
122
133
144
155
166
177
188
199
210
221
232
Month
Cum
ulat
ive
heav
y tr
ucks
BC_no grow th BC_4% MB_no grow th
MB_4% NL_no grow th NL_4%
Figure 40. Changes in cumulative heavy trucks for no growth and 4 percent annual compound growth scenarios at Alberta, Ontario, and Manitoba sites

The Road Well-traveled: Implications of Climate Change for Pavement Infrastructure in Southern Canada 57
Results for both the static no growth and annual 4 percent growth scenarios, under baseline climate and climate change conditions, are presented in Tables 12-17. The tables are organized by performance parameter and include estimates of terminal deterioration and the timing of achieving maintenance-related thresholds. Terminal deterioration is expressed in absolute terms and as a relative percent of the control (no traffic growth, baseline climate) for each scenario combination. The timing of reaching critical thresholds is specified for both 50 and 90 percent reliability levels as determined by MEPDG. As expected, greater loads induced greater terminal deterioration and earlier achievement of maintenance-related thresholds for all pavement distress indicators except for transverse cracking which is influenced primarily by climatic and material factors. Relative increases in AC and total rutting were consistent across all sites although somewhat less than the relative increase in terminal truck growth (49 percent). Increases in IRI and especially longitudinal and alligator cracking exhibited more variability across the sites. This observation is likely a function of the variability in pavement structures and baseline traffic volumes that was previously discussed. The impacts of the CGCM2A2x and HadCM3B21 climate change scenarios relative to the no growth baseline that were described in detail for the first set of MEPDG analyses were generally unaffected by the application of a 4 percent per annum growth in traffic. While higher traffic loads increased the absolute deterioration and resulted in earlier achievement of maintenance-related thresholds, the relative changes from the CGCM2A2x or HadCM3B21 scenario to respective no growth and 4 percent growth traffic baseline climate scenarios did not deviate by more than 3 percent. This suggests that there is no significant synergistic effect between climate and traffic growth, as simulated through MEPDG.

The Road Well-traveled: Implications of Climate Change for Pavement Infrastructure in Southern Canada 58
Table 12. IRI performance results for all sites and scenarios
Case Study Site International Roughness Index (IRI) m/km Change relative to
control (%)* Years to 2.7 m/km maintenance threshold (50/90% reliability)* **
British Columbia CONTROL: Baseline climate + no traffic growth 1.55 - nr/nr
CGCM2A2x + no traffic growth 1.54 -0.7 nr/nr HadCM3B21 + no traffic growth 1.58 1.9 nr/nr Baseline climate + 4% annual AADTT growth 1.58 1.9 nr/nr CGCM2A2x + 4% annual AADTT growth 1.57 1.3 nr/nr HadCM3B21 + 4% annual AADTT growth 1.61 3.9 nr/nr
Alberta CONTROL: Baseline climate + no traffic growth 2.34 - nr/14.3
CGCM2A2x + no traffic growth 2.37 1.3 nr/13.9 HadCM3B21 + no traffic growth 2.38 1.7 nr/13.8 Baseline climate + 4% annual AADTT growth 2.53 8.1 nr/12.9 CGCM2A2x + 4% annual AADTT growth 2.59 10.7 nr/12.3 HadCM3B21 + 4% annual AADTT growth 2.60 11.1 nr/12.1
Manitoba CONTROL: Baseline climate + no traffic growth 2.54 - nr/12.4
CGCM2A2x + no traffic growth 2.59 2.0 nr/12.0 HadCM3B21 + no traffic growth 2.60 2.4 nr/11.9 Baseline climate + 4% annual AADTT growth 2.85 12.2 18.9/11.0 CGCM2A2x + 4% annual AADTT growth 2.92 15.0 18.2/10.8 HadCM3B21 + 4% annual AADTT growth 2.95 16.1 18.1/10.8
Ontario CONTROL: Baseline climate + no traffic growth 1.92 - nr/nr
CGCM2A2x + no traffic growth 1.94 1.0 nr/nr HadCM3B21 + no traffic growth 1.95 1.6 nr/nr Baseline climate + 4% annual AADTT growth 1.97 2.6 nr/nr CGCM2A2x + 4% annual AADTT growth 1.99 3.7 nr/nr HadCM3B21 + 4% annual AADTT growth 2.01 4.7 nr/nr
Quebec CONTROL: Baseline climate + no traffic growth 2.12 - nr/17.8
CGCM2A2x + no traffic growth 2.10 -0.9 nr/18.3 HadCM3B21 + no traffic growth 2.11 -0.5 nr/17.9 Baseline climate + 4% annual AADTT growth 2.19 3.3 nr/16.8 CGCM2A2x + 4% annual AADTT growth 2.16 1.9 nr/17.1 HadCM3B21 + 4% annual AADTT growth 2.18 2.8 nr/16.8
Newfoundland CONTROL: Baseline climate + no traffic growth 1.79 - nr/nr
CGCM2A2x + no traffic growth 1.77 -1.1 nr/nr HadCM3B21 + no traffic growth 1.78 -0.6 nr/nr Baseline climate + 4% annual AADTT growth 1.81 1.1 nr/nr CGCM2A2x + 4% annual AADTT growth 1.79 0.0 nr/nr HadCM3B21 + 4% annual AADTT growth 1.80 0.6 nr/nr
*results rounded to one decimal place **nr (not reached during 20-year design life)

The Road Well-traveled: Implications of Climate Change for Pavement Infrastructure in Southern Canada 59
Table 13. Longitudinal cracking performance results for all sites and scenarios
Case Study Site Longitudinal Cracking* m/km Change relative to
control (%) Years to 378.8 m/km maintenance
threshold (50/90% reliability)** British Columbia
CONTROL: Baseline climate + no traffic growth 6.8 - nr/nr CGCM2A2x + no traffic growth 6.7 -1.9 nr/nr HadCM3B21 + no traffic growth 6.8 0.0 nr/nr Baseline climate + 4% annual AADTT growth 12.0 76.3 nr/nr CGCM2A2x + 4% annual AADTT growth 11.7 72.9 nr/nr HadCM3B21 + 4% annual AADTT growth 12.0 76.8 nr/nr
Alberta
CONTROL: Baseline climate + no traffic growth 551.1 - 14.8/1.8
CGCM2A2x + no traffic growth 602.3 9.3 13.7/1.0 HadCM3B21 + no traffic growth 583.3 5.8 13.8/1.7 Baseline climate + 4% annual AADTT growth 818.2 48.5 11.8/1.8 CGCM2A2x + 4% annual AADTT growth 873.1 58.4 10.8/1.0 HadCM3B21 + 4% annual AADTT growth 854.2 55.0 11.1/1.7
Manitoba
CONTROL: Baseline climate + no traffic growth 450.8 - 17.1/1.8
CGCM2A2x + no traffic growth 464.0 2.9 16.8/1.8 HadCM3B21 + no traffic growth 464.0 2.9 16.9/1.8 Baseline climate + 4% annual AADTT growth 683.7 51.7 13.1/1.8 CGCM2A2x + 4% annual AADTT growth 697.0 54.6 12.9/1.8 HadCM3B21 + 4% annual AADTT growth 698.9 55.0 12.9/1.8
Ontario
CONTROL: Baseline climate + no traffic growth 33.3 - nr/11.8 CGCM2A2x + no traffic growth 33.9 1.7 nr/11.5 HadCM3B21 + no traffic growth 35.2 5.7 nr/11.1 Baseline climate + 4% annual AADTT growth 58.9 76.7 nr/9.8 CGCM2A2x + 4% annual AADTT growth 59.7 79.0 nr/9.4 HadCM3B21 + 4% annual AADTT growth 61.9 85.8 nr/9.2
Quebec
CONTROL: Baseline climate + no traffic growth 1647.7 - 2.8/0.7 CGCM2A2x + no traffic growth 1647.7 0.0 3.0/0.6 HadCM3B21 + no traffic growth 1636.4 -0.7 3.0/0.6 Baseline climate + 4% annual AADTT growth 1789.8 8.6 2.8/0.7 CGCM2A2x + 4% annual AADTT growth 1789.8 8.6 2.9/0.6 HadCM3B21 + 4% annual AADTT growth 1784.1 8.3 2.9/0.6
Newfoundland
CONTROL: Baseline climate + no traffic growth 5.3 - nr/nr CGCM2A2x + no traffic growth 5.6 5.4 nr/nr HadCM3B21 + no traffic growth 5.6 4.3 nr/nr Baseline climate + 4% annual AADTT growth 9.7 81.7 nr/nr CGCM2A2x + 4% annual AADTT growth 10.2 91.2 nr/nr HadCM3B21 + 4% annual AADTT growth 10.1 88.8 nr/nr
*results rounded to one decimal place **nr (not reached during 20-year design life)
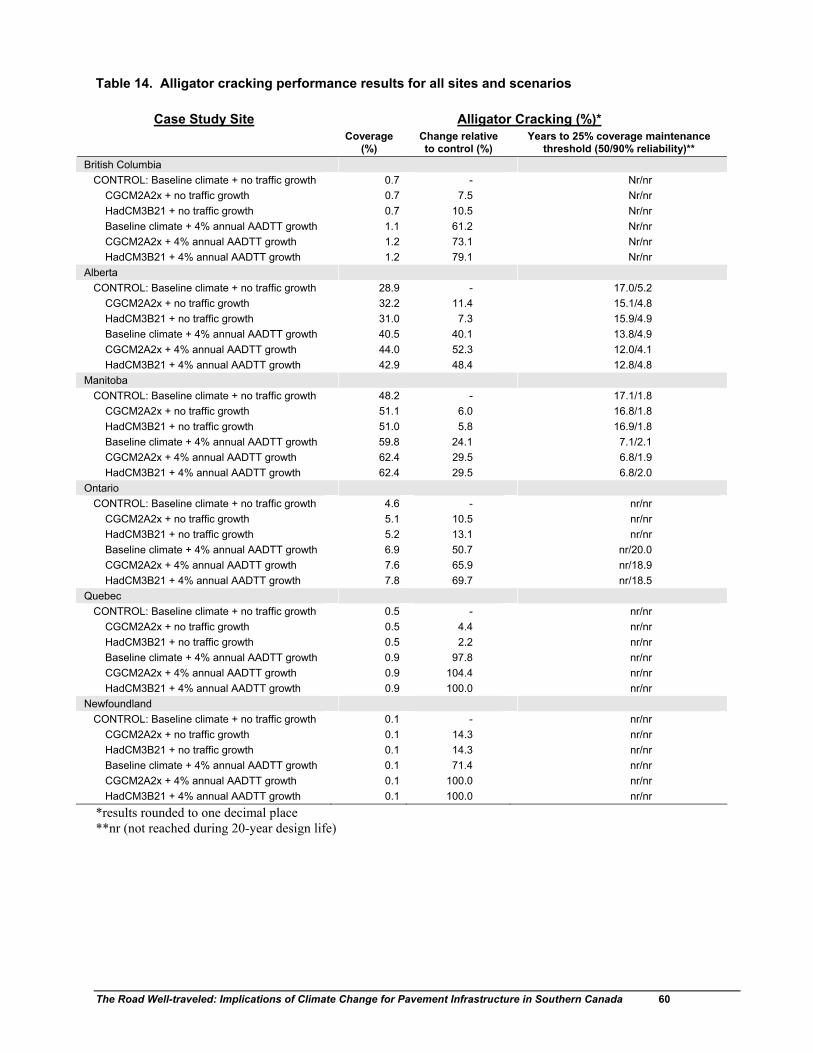
The Road Well-traveled: Implications of Climate Change for Pavement Infrastructure in Southern Canada 60
Table 14. Alligator cracking performance results for all sites and scenarios
Case Study Site Alligator Cracking (%)* Coverage
(%) Change relative to control (%)
Years to 25% coverage maintenance threshold (50/90% reliability)**
British Columbia CONTROL: Baseline climate + no traffic growth 0.7 - Nr/nr
CGCM2A2x + no traffic growth 0.7 7.5 Nr/nr HadCM3B21 + no traffic growth 0.7 10.5 Nr/nr Baseline climate + 4% annual AADTT growth 1.1 61.2 Nr/nr CGCM2A2x + 4% annual AADTT growth 1.2 73.1 Nr/nr HadCM3B21 + 4% annual AADTT growth 1.2 79.1 Nr/nr
Alberta CONTROL: Baseline climate + no traffic growth 28.9 - 17.0/5.2
CGCM2A2x + no traffic growth 32.2 11.4 15.1/4.8 HadCM3B21 + no traffic growth 31.0 7.3 15.9/4.9 Baseline climate + 4% annual AADTT growth 40.5 40.1 13.8/4.9 CGCM2A2x + 4% annual AADTT growth 44.0 52.3 12.0/4.1 HadCM3B21 + 4% annual AADTT growth 42.9 48.4 12.8/4.8
Manitoba CONTROL: Baseline climate + no traffic growth 48.2 - 17.1/1.8
CGCM2A2x + no traffic growth 51.1 6.0 16.8/1.8 HadCM3B21 + no traffic growth 51.0 5.8 16.9/1.8 Baseline climate + 4% annual AADTT growth 59.8 24.1 7.1/2.1 CGCM2A2x + 4% annual AADTT growth 62.4 29.5 6.8/1.9 HadCM3B21 + 4% annual AADTT growth 62.4 29.5 6.8/2.0
Ontario CONTROL: Baseline climate + no traffic growth 4.6 - nr/nr
CGCM2A2x + no traffic growth 5.1 10.5 nr/nr HadCM3B21 + no traffic growth 5.2 13.1 nr/nr Baseline climate + 4% annual AADTT growth 6.9 50.7 nr/20.0 CGCM2A2x + 4% annual AADTT growth 7.6 65.9 nr/18.9 HadCM3B21 + 4% annual AADTT growth 7.8 69.7 nr/18.5
Quebec CONTROL: Baseline climate + no traffic growth 0.5 - nr/nr
CGCM2A2x + no traffic growth 0.5 4.4 nr/nr HadCM3B21 + no traffic growth 0.5 2.2 nr/nr Baseline climate + 4% annual AADTT growth 0.9 97.8 nr/nr CGCM2A2x + 4% annual AADTT growth 0.9 104.4 nr/nr HadCM3B21 + 4% annual AADTT growth 0.9 100.0 nr/nr
Newfoundland CONTROL: Baseline climate + no traffic growth 0.1 - nr/nr
CGCM2A2x + no traffic growth 0.1 14.3 nr/nr HadCM3B21 + no traffic growth 0.1 14.3 nr/nr Baseline climate + 4% annual AADTT growth 0.1 71.4 nr/nr CGCM2A2x + 4% annual AADTT growth 0.1 100.0 nr/nr HadCM3B21 + 4% annual AADTT growth 0.1 100.0 nr/nr
*results rounded to one decimal place **nr (not reached during 20-year design life)

The Road Well-traveled: Implications of Climate Change for Pavement Infrastructure in Southern Canada 61
Table 15. Transverse cracking performance results for all sites and scenarios
Case Study Site Transverse Cracking* m/km Change relative to
control (%) Years to 189.4 m/km maintenance
threshold (50/90% reliability)** British Columbia
CONTROL: Baseline climate + no traffic growth 19.1 - nr/nr CGCM2A2x + no traffic growth 0.6 -96.9 nr/nr HadCM3B21 + no traffic growth 35.8 87.1 nr/nr Baseline climate + 4% annual AADTT growth 19.1 0.0 nr/nr CGCM2A2x + 4% annual AADTT growth 0.6 -96.9 nr/nr HadCM3B21 + 4% annual AADTT growth 35.8 87.1 nr/nr
Alberta CONTROL: Baseline climate + no traffic growth 399.6 - 0.3/0.3
CGCM2A2x + no traffic growth 399.6 0.0 0.3/0.3 HadCM3B21 + no traffic growth 399.6 0.0 0.3/0.3 Baseline climate + 4% annual AADTT growth 399.6 0.0 0.3/0.3 CGCM2A2x + 4% annual AADTT growth 399.6 0.0 0.3/0.3 HadCM3B21 + 4% annual AADTT growth 399.6 0.0 0.3/0.3
Manitoba CONTROL: Baseline climate + no traffic growth 399.6 - 0.3/0.3
CGCM2A2x + no traffic growth 399.6 0.0 0.4/0.3 HadCM3B21 + no traffic growth 399.6 0.0 0.4/0.4 Baseline climate + 4% annual AADTT growth 399.6 0.0 0.3/0.3 CGCM2A2x + 4% annual AADTT growth 399.6 0.0 0.4/0.3 HadCM3B21 + 4% annual AADTT growth 399.6 0.0 0.4/0.4
Ontario CONTROL: Baseline climate + no traffic growth 399.6 - 0.5/0.5
CGCM2A2x + no traffic growth 399.6 0.0 1.5/1.4 HadCM3B21 + no traffic growth 399.6 0.0 0.5/0.5 Baseline climate + 4% annual AADTT growth 399.6 0.0 0.5/0.5 CGCM2A2x + 4% annual AADTT growth 399.6 0.0 1.5/1.4 HadCM3B21 + 4% annual AADTT growth 399.6 0.0 0.5/0.5
Quebec CONTROL: Baseline climate + no traffic growth 399.6 - 0.4/0.4
CGCM2A2x + no traffic growth 399.6 0.0 0.4/0.4 HadCM3B21 + no traffic growth 399.6 0.0 0.5/0.5 Baseline climate + 4% annual AADTT growth 399.6 0.0 0.4/0.4 CGCM2A2x + 4% annual AADTT growth 399.6 0.0 0.4/0.4 HadCM3B21 + 4% annual AADTT growth 399.6 0.0 0.5/0.4
Newfoundland CONTROL: Baseline climate + no traffic growth 399.6 - 0.5/0.5
CGCM2A2x + no traffic growth 399.6 0.0 1.6/1.4 HadCM3B21 + no traffic growth 399.6 0.0 0.6/0.5 Baseline climate + 4% annual AADTT growth 399.6 0.0 0.5/0.5 CGCM2A2x + 4% annual AADTT growth 399.6 0.0 1.6/1.4 HadCM3B21 + 4% annual AADTT growth 399.6 0.0 0.6/0.5
*results rounded to one decimal place **nr (not reached during 20-year design life)
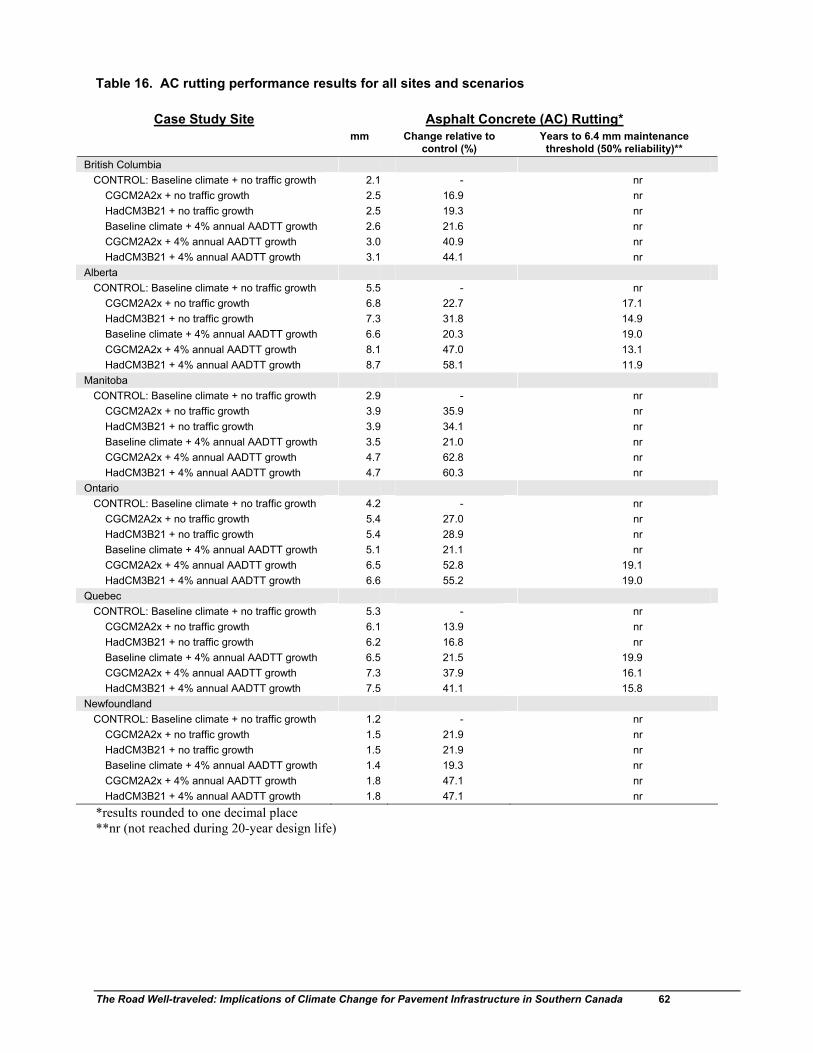
The Road Well-traveled: Implications of Climate Change for Pavement Infrastructure in Southern Canada 62
Table 16. AC rutting performance results for all sites and scenarios
Case Study Site Asphalt Concrete (AC) Rutting* mm Change relative to
control (%) Years to 6.4 mm maintenance
threshold (50% reliability)** British Columbia
CONTROL: Baseline climate + no traffic growth 2.1 - nr CGCM2A2x + no traffic growth 2.5 16.9 nr HadCM3B21 + no traffic growth 2.5 19.3 nr Baseline climate + 4% annual AADTT growth 2.6 21.6 nr CGCM2A2x + 4% annual AADTT growth 3.0 40.9 nr HadCM3B21 + 4% annual AADTT growth 3.1 44.1 nr
Alberta CONTROL: Baseline climate + no traffic growth 5.5 - nr
CGCM2A2x + no traffic growth 6.8 22.7 17.1 HadCM3B21 + no traffic growth 7.3 31.8 14.9 Baseline climate + 4% annual AADTT growth 6.6 20.3 19.0 CGCM2A2x + 4% annual AADTT growth 8.1 47.0 13.1 HadCM3B21 + 4% annual AADTT growth 8.7 58.1 11.9
Manitoba CONTROL: Baseline climate + no traffic growth 2.9 - nr
CGCM2A2x + no traffic growth 3.9 35.9 nr HadCM3B21 + no traffic growth 3.9 34.1 nr Baseline climate + 4% annual AADTT growth 3.5 21.0 nr CGCM2A2x + 4% annual AADTT growth 4.7 62.8 nr HadCM3B21 + 4% annual AADTT growth 4.7 60.3 nr
Ontario CONTROL: Baseline climate + no traffic growth 4.2 - nr
CGCM2A2x + no traffic growth 5.4 27.0 nr HadCM3B21 + no traffic growth 5.4 28.9 nr Baseline climate + 4% annual AADTT growth 5.1 21.1 nr CGCM2A2x + 4% annual AADTT growth 6.5 52.8 19.1 HadCM3B21 + 4% annual AADTT growth 6.6 55.2 19.0
Quebec CONTROL: Baseline climate + no traffic growth 5.3 - nr
CGCM2A2x + no traffic growth 6.1 13.9 nr HadCM3B21 + no traffic growth 6.2 16.8 nr Baseline climate + 4% annual AADTT growth 6.5 21.5 19.9 CGCM2A2x + 4% annual AADTT growth 7.3 37.9 16.1 HadCM3B21 + 4% annual AADTT growth 7.5 41.1 15.8
Newfoundland CONTROL: Baseline climate + no traffic growth 1.2 - nr
CGCM2A2x + no traffic growth 1.5 21.9 nr HadCM3B21 + no traffic growth 1.5 21.9 nr Baseline climate + 4% annual AADTT growth 1.4 19.3 nr CGCM2A2x + 4% annual AADTT growth 1.8 47.1 nr HadCM3B21 + 4% annual AADTT growth 1.8 47.1 nr
*results rounded to one decimal place **nr (not reached during 20-year design life)
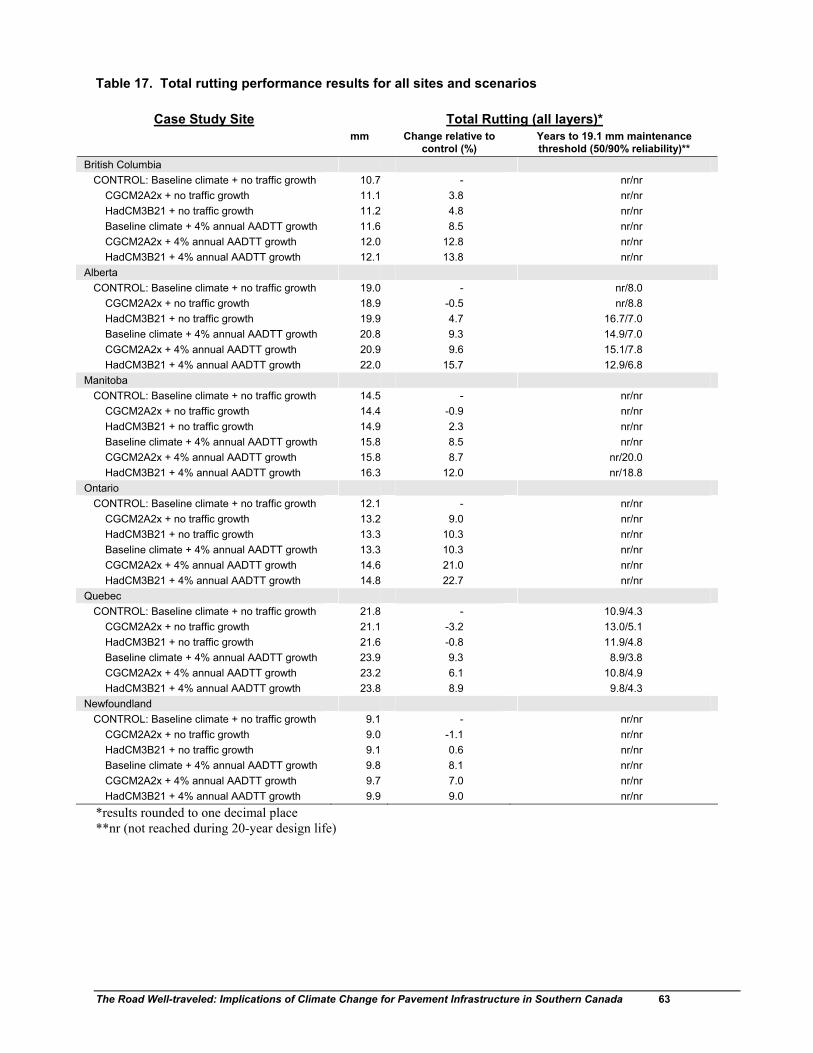
The Road Well-traveled: Implications of Climate Change for Pavement Infrastructure in Southern Canada 63
Table 17. Total rutting performance results for all sites and scenarios
Case Study Site Total Rutting (all layers)* mm Change relative to
control (%) Years to 19.1 mm maintenance threshold (50/90% reliability)**
British Columbia CONTROL: Baseline climate + no traffic growth 10.7 - nr/nr
CGCM2A2x + no traffic growth 11.1 3.8 nr/nr HadCM3B21 + no traffic growth 11.2 4.8 nr/nr Baseline climate + 4% annual AADTT growth 11.6 8.5 nr/nr CGCM2A2x + 4% annual AADTT growth 12.0 12.8 nr/nr HadCM3B21 + 4% annual AADTT growth 12.1 13.8 nr/nr
Alberta CONTROL: Baseline climate + no traffic growth 19.0 - nr/8.0
CGCM2A2x + no traffic growth 18.9 -0.5 nr/8.8 HadCM3B21 + no traffic growth 19.9 4.7 16.7/7.0 Baseline climate + 4% annual AADTT growth 20.8 9.3 14.9/7.0 CGCM2A2x + 4% annual AADTT growth 20.9 9.6 15.1/7.8 HadCM3B21 + 4% annual AADTT growth 22.0 15.7 12.9/6.8
Manitoba CONTROL: Baseline climate + no traffic growth 14.5 - nr/nr
CGCM2A2x + no traffic growth 14.4 -0.9 nr/nr HadCM3B21 + no traffic growth 14.9 2.3 nr/nr Baseline climate + 4% annual AADTT growth 15.8 8.5 nr/nr CGCM2A2x + 4% annual AADTT growth 15.8 8.7 nr/20.0 HadCM3B21 + 4% annual AADTT growth 16.3 12.0 nr/18.8
Ontario CONTROL: Baseline climate + no traffic growth 12.1 - nr/nr
CGCM2A2x + no traffic growth 13.2 9.0 nr/nr HadCM3B21 + no traffic growth 13.3 10.3 nr/nr Baseline climate + 4% annual AADTT growth 13.3 10.3 nr/nr CGCM2A2x + 4% annual AADTT growth 14.6 21.0 nr/nr HadCM3B21 + 4% annual AADTT growth 14.8 22.7 nr/nr
Quebec CONTROL: Baseline climate + no traffic growth 21.8 - 10.9/4.3
CGCM2A2x + no traffic growth 21.1 -3.2 13.0/5.1 HadCM3B21 + no traffic growth 21.6 -0.8 11.9/4.8 Baseline climate + 4% annual AADTT growth 23.9 9.3 8.9/3.8 CGCM2A2x + 4% annual AADTT growth 23.2 6.1 10.8/4.9 HadCM3B21 + 4% annual AADTT growth 23.8 8.9 9.8/4.3
Newfoundland CONTROL: Baseline climate + no traffic growth 9.1 - nr/nr
CGCM2A2x + no traffic growth 9.0 -1.1 nr/nr HadCM3B21 + no traffic growth 9.1 0.6 nr/nr Baseline climate + 4% annual AADTT growth 9.8 8.1 nr/nr CGCM2A2x + 4% annual AADTT growth 9.7 7.0 nr/nr HadCM3B21 + 4% annual AADTT growth 9.9 9.0 nr/nr
*results rounded to one decimal place **nr (not reached during 20-year design life)

The Road Well-traveled: Implications of Climate Change for Pavement Infrastructure in Southern Canada 64
3.3 Discussion and Limitations As with other forms of infrastructure, the fundamental concern related to a changing climate in pavement design and management is the potential for premature design failure. Current and past designs generally assume a static climate whose variability can be adequately determined from records of weather conditions which normally span less than 30 years and often less than 10 years. The notion of anthropogenic climate change challenges this assumption and raises the possibility that the frequency, duration or severity of thermal cracking, rutting, frost heave and thaw weakening may be altered leading to premature deterioration as indicated by trends in one or more of the performance indicators described earlier. The case studies provided empirical evidence to support this contention for several sites in Canada. The analysis of deterioration-relevant climate indicators at 17 sites suggests that, over the next 50 years, low temperature cracking will become less problematic; structures will freeze later and thaw earlier with correspondingly shorter freeze season lengths; and higher extreme in-service pavement temperatures will raise the potential for rutting. Evidence from the 6 sites examined in the MEPDG analysis was not as universal but nonetheless suggests that rutting (AC and total) and cracking (longitudinal and alligator) issues will be exacerbated by climate change with transverse cracking becoming less of a problem. In general, maintenance, rehabilitation or reconstruction will be required earlier in the design life. As important, the MEPDG analysis indicates that the absolute impacts of climate change are intimately tied to the type of structure, materials, and traffic conditions experienced at a particular site—to such an extent that a formal aggregate analysis of economic impacts was beyond the scope of the current investigation. The results of this study are dependent on many assumptions, particularly those concerning representativeness of sites and manipulation of climate scenarios. Site selection for both case studies was driven by data availability (e.g., LTPP, Environment Canada) and engineering expertise. Every effort was made to select sections that were representative of climates typically experienced in southern Canada. Additional sites that capture an even broader range of climates and pavement structures found within Canada could have been analyzed and a greater number of climate change scenarios, and alternative or more sophisticated means of downscaling scenario data, could have been incorporated into the research—with concomitant increases in costs. While such additions would no doubt contribute to greater confidence in the results, it is likely that the general findings would not change significantly. Accordingly, the discussion turns to an interpretation of results into practical recommendations for adaptation—the final steps in the climate impact assessment model proposed by Carter et al. (1999). The literature review and stakeholder discussions confirmed that technologies already exist to adequately manage any of the impacts uncovered in this study. By purposely applying design tools or thresholds presently used in pavement engineering research and practice (e.g., PGAC, freeze-thaw indices, MEPDG) to assess impacts, the authors also confirmed their efficacy at detecting changes associated with climate. None of the potential impacts suggested through this study fall beyond the range of conditions presently experienced in North America—analogous pavement structures and environmental and traffic situations abound among the agencies represented in the LTPP database. PG ratings and other material properties can be adjusted and structural designs can be strengthened for new asphalt pavements. Maintenance schedules can be advanced (or deferred) and systems can be put in place to monitor and predict freezing and thawing effects on pavement strength and restrict traffic accordingly.

The Road Well-traveled: Implications of Climate Change for Pavement Infrastructure in Southern Canada 65
For large, well-funded road authorities that manage much of the primary paved road network in Canada, the key adaptation issues will surround not how to deal with potential impacts but rather when to modify current design and maintenance practices. The basis for such decisions often falls back to an assessment of relative costs (between status quo and various designs or interventions) borne by the public, road users and, to the extent permitted in contractual agreements, by private sector construction and maintenance providers. As introduced in the literature review, pavement management systems and tools such as Life Cycle Cost Analysis (LCCA) are available to determine when a particular maintenance (e.g., crack sealing, patching, etc.), rehabilitation (e.g., AC overlay, cold in place recycling, etc.) or reconstruction activity should be implemented for a given network and section. The addition of climate change scenarios to typical 20+ year design evaluations into the LCCA process—essentially an extension of the MEPDG applications used in the current study—could be readily used to support future decisions. Regardless of future climate change, the reliability of such design evaluations could be improved by considering longer time series of climatic data to capture more variability. Unfortunately, not all road authorities are equal in terms of the financial resources, technical expertise, and monitoring and information infrastructure available to implement and sustain a modern pavement management system. This concern may apply to secondary and tertiary low volume road networks that receive lower priority in larger agencies but is likely most relevant to rural and small urban local or municipal agencies where monitoring and modeling capacity may be limited and where engineering judgement is the basis for most decisions. Municipal partnerships and associations (e.g., Ontario Good Roads Association) and less formal collaborations will be critical in ensuring that these important elements of the road transportation system become aware of, monitor, and manage potential climate change impacts through emerging best practices.

The Road Well-traveled: Implications of Climate Change for Pavement Infrastructure in Southern Canada 66
4.0 CONCLUSIONS AND RECOMMENDATIONS 4.1 Conclusions Relatively little research has been completed to investigate the potential impacts of climate change on pavement infrastructure despite the dependence of Canadian economic and social activity on road transport, and the documented influence of climate and other environmental factors on the deterioration of pavements. The influence of environmental factors has received considerable attention. The review of pavement management practices and engineering models and approaches used to monitor, assess and predict flexible pavement performance revealed that climate—and thus potentially climate change—is an important consideration in at least three deterioration processes: thermal cracking, frost heave and thaw weakening, and rutting. As with other forms of infrastructure, the fundamental concern related to a changing climate in pavement management is the potential for premature design failure. Two sets of case studies were undertaken in order to investigate these generalized impacts of climate change in greater detail. Results for both are contingent on the realization of mid-century changes in climate derived from the CGCM2A2x and HadCM3B21 scenarios. These scenarios are moderate compared to those from other models. The first case study examined deterioration-relevant climate indicators that are routinely applied or referenced in the management of pavement infrastructure for 17 Canadian sites. Main conclusions are noted below: • Extreme annual minimum and 7-day mean maximum temperatures increased at all 17 sites under
climate change scenarios relative to the baseline. Greater changes were apparent under the CGCM2A2x scenario as compared to the HadCM3B21 scenario.
• Increases in extreme annual minimum and 7-day mean maximum pavement temperatures derived from Superpave and RWIS-based equations were also observed, roughly proportional to changes in air temperature. This has important implications to the determination of appropriate Performance Grade (PG) ratings for asphalt cements.
• Minimum PG design temperature ratings as determined through the Superpave equation did not change relative to the baseline under the HadCM3B21 scenario. However, 7 of 17 sites warmed up by one PG category when CGCM2A2x scenario conditions were considered. Results were similar when based on the RWIS-derived pavement temperature equation.
• Maximum PG design temperature ratings as determined through the Superpave equation increased relative to the baseline by one increment at 6 of 17 sites under the HadCM3B21 scenario and at 4 sites under CGCM2A2x conditions.
• The RWIS-derived maximum pavement temperature equation produced more extreme results than the Superpave model. PG ratings at 13 sites increased by at least one increment under the HadCM3B21 climate change scenario and eleven of these sites also increased by one increment under the CGCM2A2x scenario. The inconsistency between RWIS and Superpave findings most likely relates to limitations in the range of air and pavement temperatures contained in the dataset used to derive the RWIS-equation.
• Large changes are also expected in the timing of the seasonal freeze and thaw and duration of the freeze season. Under the more extreme CGCM2A2x scenario, significant penetrations of frost into road structures may occur less than 50 percent of years in the B.C. Interior, southern Ontario, and coastal areas of Atlantic Canada. At other locations, freeze-up may be delayed from

The Road Well-traveled: Implications of Climate Change for Pavement Infrastructure in Southern Canada 67
1-4 weeks compared to current experience. The timing of critical thaw conditions will also be affected, in general occurring much earlier (10-31 days) than at present for the sites evaluated.
• More conservative results were associated with the HadCM3B21 scenario. Median critical freeze-up occurred 1-2 weeks later relative to the baseline for most sites and up to 28 days later for Kelowna, Windsor, Toronto, Halifax and St. John’s. Critical thaw conditions occurred from 2 days to 2 weeks earlier than the baseline.
• The net effect of later freeze-up and earlier thaw is a reduced freeze season. Average freeze seasons were shortened by 8 percent at the Winnipeg site (HadCM3B21 scenario) to 98 percent at the Windsor and St. John’s site (CGCM2A2x scenario). Where mean season length remained relatively long under the climate change scenarios (i.e., > 50 days), the standard deviation increased relative to the baseline. The greater variability between years may make management of SLRs and WWPs much more difficult as conditions transition under climate change.
The second set of case studies were conducted using the Mechanistic-Empirical Pavement Design Guide (MEPDG) and software, a new tool developed through the NCHRP/AASHTO. MEPDG was used to examine the relative impact of assumptions concerning pavement structure, material characteristics, traffic loads, and changes in climate on pavement performance. Main conclusions from the 6 sites studied include the following: • Terminal pavement deterioration as modeled through MEPDG for 6 sites and reported in terms
of IRI, AC and total rutting, and longitudinal, alligator, and transverse cracking, is sensitive to changes in climate.
• Differences between baseline and future climate scenarios were greatest for AC rutting (14-36 percent increase) across the sites. The increase in AC rutting was offset by decreased rutting in lower layers which resulted in small increases (1-10 percent) or slight reductions (1-3 percent) in total rutting relative to the baseline. This result is consistent with the combined effects of higher asphalt temperatures and less penetration of frost into lower layers. The differences between the CGCM2A2x and HadCM3B21 scenarios were generally less than 3 percent.
• Modest increases were generally observed for the various cracking parameters under climate change conditions relative to the baseline. Slight reductions (0-2 percent) in longitudinal cracking were observed for the Quebec and British Columbia sites with somewhat larger increases (0-9 percent) at the other sites. Alligator cracking increased at all locations from 2-14 percent. Minimal differences (3 percent or less) existed between the climate change scenarios except for transverse cracking at the British Columbia site.
• Very small changes in terminal IRI were observed between the baseline and future climate scenarios for all sites (-1 to 2 percent).
• Changes in terminal deterioration were reflected in the amount of estimated time required to reach critical maintenance thresholds for each performance parameter at 50 and 90 percent reliability levels. For both the baseline and future climate scenarios, about one-third of the total possible parameter limits were reached at the 50 percent reliability level while just over one-half of the thresholds were met at the 90 percent reliability level. At most sites, the general effect of the climate change scenarios was to reduce the amount of time until thresholds were met for longitudinal cracking, alligator cracking, IRI, and AC rutting, and to delay achievement of total rutting and transverse cracking limits. Relative changes between the baseline and climate change scenarios were typically small, ranging from 1-5 years at 50 percent reliability and generally less than 1 year at the 90 percent reliability level.
• The 4 percent per annum traffic growth scenario increased the absolute levels of pavement deterioration and resulted in earlier achievement of maintenance-related thresholds. However, the relative impact of climate change when evaluated under a scenario of increasing traffic was

The Road Well-traveled: Implications of Climate Change for Pavement Infrastructure in Southern Canada 68
found to be similar to that observed with no growth in traffic (less than 3 percent difference). This suggests that there is no substantive synergistic effect between climate and traffic growth, as simulated through MEPDG.
• The combined differences in pavement structure, materials, and baseline traffic, are relatively more important than climate in determining pavement deterioration and performance over its design life. The analysis of all 6 structures using baseline climate and future climate scenarios for Winnipeg, Manitoba also revealed that the AC rutting parameter is the most sensitive to shifts in climate relative to variations in structure and traffic levels; longitudinal and alligator cracking were least-sensitive. Both the magnitude and direction of pavement deterioration impacts associated with climate change were influenced by structural and traffic assumptions which suggests an interactive effect. Not surprisingly, weaker structures subject to relatively high base loads seem most vulnerable to changes in climate.
Pavement management systems in Canada are carefully engineered and adaptive. None of the potential impacts of climate change suggested through this study fall beyond the range of conditions presently experienced in North America. Material and other construction, monitoring, and maintenance technologies exist to manage all of the identified problems and it is highly likely that agencies will make the necessary adjustments and investments (e.g., higher PGs) to preserve the primary paved network. However, the more significant impacts associated with changes in climate may well be realized on the secondary or tertiary networks of provincial and municipal agencies where weak pavement structures coincide with excessive traffic loads. 4.2 Recommendations Results from this study should be thoroughly discussed within the engineering community. Moving from exploratory research that raises awareness of climate change to practical guidance aimed at reducing costs and safeguarding infrastructure will require additional effort and collaboration. To this end, the authors will continue to take advantage of opportunities to present and deliberate findings at meetings of the Transportation Association of Canada, Canadian Technical Asphalt Association, and Transportation Research Board. Pavement engineers, with assistance from government and academic climate change experts, should be encouraged to develop a protocol or guide for considering potential climate change in the development and evaluation of future designs and maintenance programs. Such an activity might be initiated through the Transportation Association of Canada or other multi-stakeholder association and leverage existing activities such as the implementation of MEPDG in Canada and the Canadian Climate Change Scenarios Network (CCSN). Incorporating other climate-related road infrastructure issues, for instance those associated with concrete pavements, surface-treated roads, airfields, bridges and culverts, would also be beneficial. Environment Canada and other agencies should work with pavement engineers to facilitate greater application of environmental data in the design process and operational management of road networks. At a minimum, long time series of historic climatic and road weather observations—ideally greater than 30 years in the case of climate—should be incorporated into analyses of pavement deterioration and applicability of SLRs and WWPs or assignment of performance graded materials.
The Road Well-traveled: Implications of Climate Change for Pavement Infrastructure in Southern Canada 69
In terms of future research, more analysis is required to understand the interactive effects among environmental, structural, traffic, maintenance, and construction variables. Additional studies should be conducted to assess the implications of climate variability and change on the more vulnerable elements of the road network, including municipal roads and components of the provincial networks subject to SLRs. In particular, there is a need to further explore the influence of variable sequences of climate events from construction to reconstruction using a combination of simulation (i.e., MEPDG), laboratory material testing, and distress survey data. Where possible, this research should be conducted through partnerships with specific agencies. As an example, members of the project team, led by Dr. Tighe, are working with the Ministry of Transportation of Ontario to better utilize RWIS in SLR applications (Huen et al., 2006).

The Road Well-traveled: Implications of Climate Change for Pavement Infrastructure in Southern Canada 70
5.0 REFERENCES Abaza, K.A. 2002. Optimal flexible pavement life-cycle analysis model, Journal of Transportation Engineering,
128(6):542-549.
Al Assar, R., Z. He, S. Tighe and R. Haas. 2000 Simplified User Delay Cost Model For Pavement and Bridge Life Cycle Analysis. CD-ROM proceedings of the Transportation Association of Canada Annual Conference, Regina, AB.
Al-Masaeid, H.R. 1997. Impact of pavement conditions on rural road accidents, Canadian Jounral of Civil Engineering, 24:523-531.
Andrey, J and A. Snow 1998. Transportation Sector, in Canada Country Study: Climate Impacts and Adaptations, Volume VII, National Sectoral Volume, Chapter 8, pp. 405-447. Environment Canada.
Andrey, J., B. Mills, B. Jones, R. Haas and W. Hamlin, 1999. Adaptation to Climate Change in the Canadian Transportation Sector. Report submitted to Natural Resources Canada, Adaptation Liaison Office, Ottawa, Ontario.
Andrey, J. 2000. The transportation imperative: risks of mobility and mobility-related risks. The Canadian Geographer, 44:387-400.
Andrey, J., B. Mills and J. Vandermolen. 2001. Weather Information and Road Safety. ICLR Paper Series No.15, Institute for Catastrophic Loss Reduction, London, Ontario. 36 pp.
Andrey, J. and B. Mills 2003. Climate Change Impacts and Adaptation: A Canadian Perspective—Transportation. Report prepared for Transport Canada. University of Waterloo, Department of Geography and Adaptation and Impacts Research Group, MSC, Waterloo, Canada.
Andrey, J., B. Mills, F.J.Warren and D.S. Lemmen 2004. Transportation, Chapter 8 in D.S. Lemmen and F.J. Warren (Eds.) Climate Change Impacts and Adaptation: A Canadian Perspective. Government of Canada, Ottawa. pp. 131-149. http://adaptation.nrcan.gc.ca/perspective/index_e.php
Archilla, A.R. and S. Madanat 2001. Estimation of rutting models by combining data from different sources, Journal of Transportation Engineering, 127(5):379-389.
Arenson, L.U., D.C. Sego, and G. Newman. 2006. The use of a convective heat flow model in road designs for Northern regions. CD Proceedings of the EIC Climate Change Technology Conference, Engineering Institute of Canada, Ottawa, May 10-12, 2006. ISBN 1-4244-0218-2. 8pp.
AASHTO 1993. AASHTO Guide for Design of Pavement Strutures. American Association of State Highway and Transportation Officials, Washington, D.C.
ARA Inc. 2004. Environmental effects, Part 2, chapter 3 in NCHRP, Guide for Mechanistic-Empirical Design of New and Rehabilitated Pavement Structures. 50pp.
Austroads 2004. Impact of Climate Change on Road Infrastructure. AP-R243. Austroads Incorporated, Sydney, Australia.
Barrow E., B. Maxwell, and P. Gachon (Eds.), (2004). Climate Variability and Change in Canada: Past, Present and Future, ACSD Science Assessment Series No. 2, Meteorological Service of Canada, Environment Canada, Toronto, Ontario, 114 p.
Berengier, M.C. and F. Anfosso-Ledee 1998. State-of-the-art prediction and control of road traffic noise in France, Transportation Research Record, 1626:71-77.
Beaulac, I., G. Doré, G. Grondin, and A. Guimond. 2006. Impacts de la fonte du pergélisol et adaptations des infrastructures de transport routier et aérien au Nunavik. CD Proceedings of the EIC Climate Change Technology Conference, Engineering Institute of Canada, Ottawa, May 10-12, 2006. ISBN 1-4244-0218-2. 11pp.
Birgisson, B. and B.E. Ruth 2003. Improving performance through consideration of terrain conditions - Soils, drainage, and climate, Transportation Research Record, 1819(1):369-377.
Birgisson, B., J. Ovik and D.E. Newcomb. 2000. Analytical predictions of seasonal variations in flexible pavements, Transportation Research Record, 1730:81-90.
Black, G.W. Jr. and L.E. Jackson 2000. Pavement surface water phenomena and traffic safety, Institute of Transportation Engineers (ITE) Journal, 70(2):32-37.

The Road Well-traveled: Implications of Climate Change for Pavement Infrastructure in Southern Canada 71
Boutonnet, M., P. Lerat, D. Saint-Laurent and Y. Savard. 2003. Thermal aspect of frost-thaw pavement dimensioning: In situ measurement and numerical modeling, 82nd Annual Meeting Preprint CD-ROM, proceedings of the Transportation Research Board annual meeting, January 2003, Washington, D.C.
Brennan, D., U. Akpan, I. Konuk, A. Zebrowski. 2001. Random field modelling of rainfall induced soil movement. Report prepared for the Climate Change Action Fund, Natural Resources Canada. 85 pp.
Brown, W.G. 1964. Difficulties associated with predicting depth of freeze or thaw, Canadian Geotechnical Journal, 1:215-226.
Bruce, J.P., I. Burton, H. Martin, B. Mills and L. Mortsch 2000. Water Sector: Vulnerability and Adaptation to Climate Change. Final report prepared for Natural Resources Canada, Climate Change Action Fund. Global Change Strategies International Inc. and Meteorological Service of Canada, Ottawa. http://www.gcsi.ca/downloads/ccafwater.pdf.
Burton, I., R.W. Kates and G.F. White. 1993. The Environment As Hazard. The Guilford Press, New York.
Carter, T.R., M.L. Parry, S. Nishioka, and H. Harasawa 1994. IPCC Technical Guidelines for Assessing Climate Change Impacts and Adaptations. Environmental Change Unit, University of Oxford and Center for Global Environmental Studies, London.
CCSN 2005. Canadian Climate Scenarios Network. Adaptation and Impacts Research Division, Environment Canada. http://www.ccsn.ca.
Chen, D.-H., D.-F. Lin and H.-L. Luo. 2003. Effectiveness of preventative maintenance treatments using fourteen SPS-3 sites in Texas, Journal of Performance of Constructed Facilities, 17(3):136-143.
Ciro, G.A. and M.C. Alfaro. 2006. Adaptation strategies for road embankments on permafrost affected by climate warming. CD Proceedings of the EIC Climate Change Technology Conference, Engineering Institute of Canada, Ottawa, May 10-12, 2006. ISBN 1-4244-0218-2. 10pp.
Clayton, A., J. Montufar, and R. McGregor 2006. Using Intelligent Transportation Systems to Adapt to Potential Climate Change Impacts on Seasonal Truck Weight Limits. Report prepared for the Climate Change Impacts and Adaptation Program, Natural Resources Canada. Transportation Information Group, University of Manitoba, and EBA Engineering Consultants Ltd., Winnipeg, MB. 60pp.
CMIP 2001. Coupled Model Intercomparison Project. http://www-pcmdi.llnl.gov/cmip/. Accessed June 2001.
Collop, A.C., D. Cebon and M.S.A. Hardy 1992. A Visco-elastic Approach to Rutting in Flexible Pavements, CUED/C-MECH/TR 49. University of Cambridge Transportation Research Group, Cambridge, UK. http://www-mech.eng.cam.ac.uk/trg/publications/downloads/damage/damage1.pdf
CRRL (Cold Regions Research and Engineering Lab) 2002. Army MSSR http://www.msrr.army.mil/index.cfm?top_level=ORG_A_1000136&taxonomy=ORG
CSHRP (Canadian Strategic Highway Research Program) 2000. Seasonal Load Restrictions in Canada and around the World. Technical Brief #21 http://www.cshrp.org/english/tech_briefs.html. Accessed June 18, 2004.
Dewan, S.A. and R.E. Smith. 2002. Estimating International Roughness Index from pavement distresses to calculate vehicle operating costs for the San Francisco Bay area, Transportation Research Record, 1816:65-72.
Dore, G. 1995. The Development of Models to Predict Pavement Performance in Frost Conditions. Prepared for the Canadian Strategic Highway Research Program. http://www.cshrp.org/products/bayesian/PQ/pqh1.htm
Doré, G., M. Flamand and P. Pascale. 2002. Anaysis of wavelength content of longitudinal profiles for C-LTPP test sections, Canadian Journal of Civil Engineering, 29: 50-57.
Easa, S.M., A. Shalaby, and A.O.A. El Halim 1996. Reliability-based model for predicting pavement thermal cracking, Journal of Transportation Engineering, 122(5):374-380.
El Hussein, H.M., K.W. Kim, and J. Penniah. 1998. Asphalt concrete damage associated with extreme low temperatures, Journal of Materials in Civil Engineering, 10(4):269-274.
Epps, A. 2000. Design and analysis system for thermal cracking in asphalt concrete, Journal of Transportation Engineering, 126(4):300-307.
FHWA. 1990. An Advanced Course in Pavement Management Systems. Federal Highway Administration, Course Notes, Washington, D.C.

The Road Well-traveled: Implications of Climate Change for Pavement Infrastructure in Southern Canada 72
Flato, G. and G.J. Boer. 2001. Warming asymmetry in climate change simulations, Geophysical Research Letters, 28(1):195-198.
Flato, G.M., Boer, G.J., Lee, W.G., McFarlane, N.A., Ramsden, D., Reader, M.C., and Weaver, A.J., 2000. The Canadian Centre for Climate Modelling and Analysis Global Coupled Model and its Climate, Climate Dynamics, 16(6):451-467.
Fradette, N., P. Pascale, G. Doré and S. Hébert 2005. Evolution of pavement winter roughness, 84th Annual Meeting Preprint CD-ROM, proceedings of the Transportation Research Board annual meeting, January 2005, Washington, D.C.
Fülöp, I.A., I. Bogardi, A. Gulyas and M. Csicsely-Tarpay 2000. Use of friction and texture in pavement performance modeling, Journal of Transportation Engineering, 126(3): 243-248.
Giese, J.K., R.J. Griffin, and D.A. Kuemmel 2001. Public perceptions of the Midwest’s pavements: Explaining the relationship between pavement quality and driver satisfaction, Transportation Research Record, 1769:61-70.
Gołebiewski, R., R. Makarewicz, M. Nowak, and A. Preis 2003. Traffic noise reduction due to the porous road surface, Applied Acoustics, 64(5):481–494.
Goodman, S.N. 2001. Assessing variability of surface distress surveys in Canadian long-term pavement performance program, Transportation Research Record, 1764:112-118.
Gordon, C., C. Cooper, C.A. Senior, H. Banks, J.M. Gregory, T.C. Johns, J.F.B. Mitchell and R.A. Wood. 2000. The simulation of SST, sea ice extents and ocean heat transports in a version of the Hadley Centre coupled model without flux adjustments, Climate Dynamics, 16:147-168.
Goyette, S., N. A. McFarlane, and G.M. Flato 2000. Application of the Canadian Regional Climate model to the Laurentian Great Lakes region: Implementation of a lake model, Atmosphere-Ocean, 38(3):481-503.
Haas, R., W. R. Hudson and J. Zaniewski. 1994. Modern Pavement Management. Kreiger Publishing Company, Florida.
Haas, R., W. R. Hudson and S. Tighe. 2001. Maximizing customer benefits as the ultimate goal of pavement management, National Academy Standard, 5th International Conference on Managing Pavements, Seattle Washington, August. 17 pp.
Haas, R. (ed.) 1997. Pavement Design and Management Guide. Transportation Association of Canada, Ottawa, ON.
Haas, R. 2001. Reinventing the (pavement management) wheel. Distinguished lecture, Fifth International Conference on Managing Pavements, August 11-14, 2001Seattle, WA.
Haas, R., L.C. Falls, D. MacLeod and S. Tighe. 2004. Climate impacts and adaptions on roads in Northern Canada, Cold Climates Conference, Regina, AB. 18 pp.
Haas, R., N. Li, and S. Tighe. 1999. Roughness Trends at C-SHRP LTPP Sites. Transportation Asscoiation of Canada, Ottawa, ON. 97 pp.
Hall, F., S. Wakefield, and A. Al-Kaisy 2001. Freeway quality of service: What really matters to drivers and passengers, Transportation Research Record, 1776:17-23.
Hassan, Y., S.M. Easa and A.O. Abd El Halim 1998. State-of-the-art of three-dimensional highway geometric design, Canadian Journal of Civil Engineering, 25(3):500-511.
He, Z., G. Kennepohl, Y. Cai, and R. Haas. 1997. Development of performance models for Ontario’s new mechanistic-empirical pavement design method. Volume I, Proceedings of the 8th International Conference on Asphalt Pavements, Seattle, Washington. pp. 43-60.
Herman, S.C. (ed.) 1984. The Influence of Roadway Surface Discontinuities on Safety: A state-of-the-art Review. Transportation Research Board, Washington, D.C.
Heydinger, A.G. 2003. Evaluation of seasonal effects on subgrade soils, Transportation Research Record, 1821: 47-55.
Hinzman, L.D., N. Bettez, F.S. Chapin, M. Dyurgerov, C. Fastie, B. Griffith, R.D. Hollister, A. Hope, H.P. Huntington, A. Jensen, D. Kane, D.R. Klein, A. Lynch, A. Lloyd, A.D. McGuire, F. Nelson, W.C. Oechel,T. Osterkamp, C. Racine,V. Romanovsky, D. Stow, M. Sturm, C.E.Tweedie, G.Vourlitis, M.Walker, D.Walker, P.J.Webber, J.Welker, K.Winker and K.Yoshikawa. 2005. Evidence and implications of recent climate change in terrestrial regions of the Arctic, Climatic Change, 72: 251–298.

The Road Well-traveled: Implications of Climate Change for Pavement Infrastructure in Southern Canada 73
Hong, H.P., and S. Somo. 2001. Probabilistic assessment of pavement conditions, Canadian Journal of Civil Engineering, 28(5):813-822.
Houghton, J.T., Y. Ding, D.J. Griggs, M. Noguer, P.J. van der Linden, X. Da, K. Maskell, and C.A. Johnson (eds.) Climate Change 2001: The Scientific Basis. Contribution of Working Group I to the Third Assessment Report of the Intergovernmental Panel on Climate Change, 2001. http://www.grida.no/climate/ipcc_tar/wg1/index.htm. Accessed July 2002
Huen, K., S. Tighe, B. Mills, and C. Haas. 2006. Using Road Weather Information Systems (RWIS) to Control Load Restrictions on Gravel and Surface Treated Highways: Phase I Final Report. Prepared for the Highway Infrastructure Innovation Funding Program, Engineering Standards Branch, Ontario Ministry of Transportation. Department of Civil Engineering, University of Waterloo, Waterloo, ON. 63pp.
Innes, J.D., F.R. Wilson and D.R. Goguen. 1998. Designing skid resistance testing programs using videotaped road inventory data, Canadian Journal of Civil Engineering, 25(5):950-955.
Instanes, A., O. Anisimov, L. Brigham, D. Goering, L.N. Khrustalev, B. Ladanyi, and J.O. Larsen. 2005. Infrastructure: Buildings, Support Systems, and Industrial Facilities, chapter 16 in ACIA, Arctic Climate Impact Assessment—Scientific Report, Cambirdge University Press, New York. pp.907-944.
IPCC 2000. Special Report on Emission Scenarios: Summary for Policymakers. Special Report of IPCC Working Group III. WMO and UNEP. http://www.ipcc.ch/pub/sres-e.pdf. Accessed July 2002.
IPCC 2001. Summary for Policymakers: A Report of Working Group I of the Intergovernmental Panel on Climate Change. http://www.ipcc.ch/pub/spm22-01.pdf. Accessed June 2001.
IPCC 2007. Climate Change 2007: The Physical Science Basis, Summary for Policymakers. Contribution of Working Group I to the Fourth Assessment Report of the Intergovernmental Panel on Climate Change. http://www.ipcc.ch/.
IPCC-TGCIA 1999. Guidelines on the Use of Scenario Data for Climate Impact and Adaptation Assessment. Version 1. Prepared by T.R. Carter, M. Hulme and M. Lal, Intergovernmental Panel on Climate Change, Task Group on Scenarios for Climate Impact Assessment, 69 pp.
Irwin, N.A., and W.F. Johnson. 1990. The implications of long-term climatic changes on transportation in Canada, Transportation Research Record, 1267:12-25.
Joint CSHRP/Quebec Bayesian Application Project. 2000a. The Development of Models to Predict Pavement Performance in Frost Conditions: 7. Cracking Model. www.cshrp.org/products/bayesian/PQ/pqh4.htm. Accessed June 18, 2004.
Joint CSHRP/Quebec Bayesian Application Project. 2000b. The Development of Models to Predict Pavement Performance in Frost Conditions: 6. Roughness Model. www.cshrp.org/products/bayesian/PQ/pqh3.htm. Accessed June 18, 2004.
Jong, D.-T., P.J. Bosscher and C.H. Benson. 1998. Field assessment of changes in pavement moduli caused by freezing and thawing, Transportation Research Record, 1615:41-48.
Kaku, J., M. Hiroe, S. Kuwano and S. Namba 2004. Sleep disturbance by traffic noise: an experimental study in subjects' own houses using a portable CD player, Journal of Sound and Vibration, 277(3): 459-464.
Kates, R.W., Ausubel, J.H. and M. Berberian (eds). 1985. Climate Impact Assessment: Studies of the Interaction of Climate and Society. John Wiley, New York.
Katz, R.W. 2002: Techniques for estimating uncertainty in climate change scenarios and impact studies. Climate Research, 20:167-185.
Kestler, M.A. 2003. Techniques for extending the life of low-volume roads in seasonal frost areas, Transportation Research Record, 1819: 275-284.
Kliewer, J.E., H. Zeng and T.S. Vinson. 1996. Aging and low-temperature cracking of asphalt concrete mixture, Journal of Cold Regions Engineering, 10(3):134-148.
Konrad, J.-M. and M. Shen. 1997. Prediction of the spacing between thermal contraction cracks in asphalt pavements, Canadian Journal of Civil Engineering, 24:288-302.
Landers, S., W. Bekheet, and L.C. Falls 2003. Cohen's weighted kappa statistic in quality control-quality assurance procedures: Application to network-level contract pavement surface condition surveys in British Columbia, Canada, Transportation Research Record, 1860:103-108.
The Road Well-traveled: Implications of Climate Change for Pavement Infrastructure in Southern Canada 74
Lee, C. and J. Rochat. 2002. FHWA Model Predicts Noise Impacts, Public Roads, 65(5), March/April.
Leong, P., S. Tighe and G. Doré. 2005. Using LTPP data to develop spring load restrictions: A pilot study, 84th Annual Meeting Preprint CD-ROM, proceedings of the Transportation Research Board annual meeting, January 9-13, 2005, Washington, D.C.
Li, Y. and S. Madanat 2002. A steady-state solution for the optimal pavement resurfacing problem, Transportation Research Part A, 36:525-535.
Liu, C. and R. Herman. 1996. New approach to roadway performance indices, Journal of Transportation Engineering, 122(5):329-336.
Manitoba Transportation and Government Services. 2004. Manitoba’s Spring Load Restriction Program. http://www.gov.mb.ca/tgs/transreg/compreg/spring-restrict.html Accessed June 18, 2004.
Marshall, C., R. Meier and M. Welch. 2001. Seasonal temperature effects on flexible pavements in Tennessee, Transportation Research Record, 1764: 89-96.
Masson, J.-F., P. Collins, and P.-P. Légaré. 1999. Performance of pavement crack sealants in cold urban conditions, Canadian Journal of Civil Engineering, 26(4):395-401.
Mehta, Y. and R. Roque 2003. Evaluation of FWD data for determination of layer moduli of pavements, Journal of Materials in Civil Engineering, 15(1):25-31.
Mills, B. and Andrey, J. 2003. Climate Change and Transportation: Potential Interactions and Impacts. Proceedings of the Potential Impacts of Climate Change on Transportation workshop, October 1-2, 2002, Washington, D.C. USDOT Center for Climate Change and Environmental Forecasting and Federal Research Partnership (DOT, DOE, EPA, USGCRP).
Minnesota DOT (Department of Transportation) 2004. Spring Load Restrictions. http://www.mrr.dot.state.mn.us/research/seasonal_load_limits/thawindex/thawdefs.asp Accessed June 18, 2004.
Mishalani, R. and A. Kumar 2005. Impacts of temperature time series on pavement rutting progression, 84th Annual Meeting Preprint CD-ROM, proceedings of the Transportation Research Board annual meeting, January 2005, Washington, D.C.
Montufar, J. and A. Clayton. 2002. Seasonal weight limits on prairie region highways: opportunities for rationalization and harmonization, Canadian Journal of Civil Engineering, 29: 8-16.
Monutfar, J. and R. McGregor 2006. Using Intelligent Transportation Systems to Adapt to Potential Climate Change Impacts on Seasonal Truck Weight Limits. CD Proceedings of the EIC Climate Change Technology Conference, Engineering Institute of Canada, Ottawa, May 10-12, 2006. ISBN 1-4244-0218-2.
Moreno, R.A. et al. 1996. Industry, Energy and Transportation: Impacts and Adaptation, in R.T.Watson, M.C.Zinyowera, R.H.Moss (eds.) Climate Change 1995: Impacts, Adaptations and Mitigation of Climate Change: Scientific-Technical Analyses, contribution of Working Group II to the Second Assessment of the Intergovernmental Panel on Climate Change, Cambridge University Press, UK. pp. 364-398.
MTO 1989. Manual for Condition Rating of Flexible Pavements Distress Manifestations, SP-024. Ministry of Transportation of Ontario, Downsview, Ontario.
MTO 2006. Road Weather Information System data for New Liskeard, Long Lac, and Gormley sites. Ministry of Transportation of Ontario, St. Catharines, Ontario.
NBDOT (New Brunswick Department of Transportation) 1995. Prediction of Rutting in Alternative Asphalt Concrete Overlay Methods. Research Section, Engineering Services Division. http://www.cshrp.org/products/bayesian/nb/nbtoc.htm
NCHRP 2002a. Contributions of Pavement Structural Layers to Rutting of Hot Mix Asphalt Pavements, NCHRP Report 468. National Cooperative Highway Research Program, Transportation Research Board, National Research Council. Washington, D.C. http://gulliver.trb.org/publications/nchrp/nchrp_rpt_468-c.pdf
NCHRP 2002b. Flexible Pavement Design and Rehabilitation Procedure, NCHRP Project 1-37A. National Cooperative Highway Research Program, Transportation Research Board, National Research Council. Washington, D.C. http://www.2002designguide.com/presentations%202003/TRB2003Flexible.pdf
NCHRP 2004a. Public Benefits of Highway System Preservation and Maintenance, NCHRP Synthesis 330. National Cooperative Highway Research Program, Transportation Research Board, National Research Council. Washington, D.C.
The Road Well-traveled: Implications of Climate Change for Pavement Infrastructure in Southern Canada 75
NCHRP 2004b. Guide for Mechanistic-Empirical Design of New and Rehabilitated Pavement Structures. National Cooperative Highway Research Program, Transportation Research Board, National Research Council, Washington, D.C. http://www.trb.org/mepdg/home.htm.
NCHRP 2006a. Independent review of Mechanistic-Empirical Design Guide and Software, Research Results Digest 307, National Cooperative Highway Research Program, Transportation Research Board. 32pp.
NCHRP 2006b. Changes to the Mechanistic-Empirical Design Guide Software through version 9.000, July 2006, Research Results Digest 308, National Cooperative Highway Research Program, Transportation Research Board. 22pp.
Nikolaides, A. 2000. Rutting and volumetric properties of SMA mixtures, Proceedings of the Institution of Civil Engineers, Transportation, 141(3): 135-141.
Nix, F.P., M. Boucher and B. Hutchinson 1992. Road costs, in Directions: The Final Report of the Royal Commission on National Passenger Transportation-Volume 4. Ottawa, Ontario. p.1014.
OHMPA (Ontario Hot Mix Asphalt Producers). 1999. The ABCs of PGAC. Ontario Hot Mix Asphalt Producers Association fact sheet, 2 (April).
Ohrstrom, E. 2004. Longitudinal surveys on effects of changes in road traffic noise: Effects on sleep assessed by general questionnaires and 3-day sleep logs, Journal of Sound and Vibration, 276(3-5): 713-727.
Ouyang, Y. and S. Madanat 2004. Optimal scheduling of rehabilitation activities for multiple pavement facilities: exact and approximate solutions, Transportation Research Part A, 38:347-365.
Park, D.-Y., N. Buch and K. Chatti. 2001. Effective layer temperature prediction model and temperature correction via falling weight deflectometer deflections, Transportation Research Record, 1764: 97-111.
Parm, S. 2007. Patterns of spatial and temporal variability in spring thaw timing for secondary pavements in southern Canada. Masters of Environmental Studies thesis, Department of Geography, University of Waterloo.
Paterson, W. 1986. International Roughness Index: Relationship to Other Measures of Roughness and Riding Quality, Transportation Research Record, 1084:49-59.
Phillips, S. 2002. Determining the performance of quieter road surfaces, Proceedings of the Institution of Civil Engineers-Transport, 153(2):111-120.
Prozzi, J.A. and S.M. Madanat 2003. Incremental nonlinear model for predicting pavement serviceability, Journal of Transportation Engineering, 129(6):635-641.
Raad, L., S. Saboundjian, P. Sebaaly and J. Epps. 1998. Thermal cracking models for AC and modified AC mixes in Alaska, Transportation Research Record, 1629:117-126.
Ramia, A.P., N. Ali, and K. Speiran 1995. Evaluation of Rutting in Nova Scotia’s Special “B” Asphalt Concrete Overlays.
Ranieri, V. 2002. Runoff control in porous pavements, Transportation Research Record, 1789:46-55.
Raymond, C., S. Tighe, R. Haas, and L. Rothenburg. 2003. Development of Canadian asphalt pavement deterioration models to benchmark performance, Canadian Journal of Civil Engineering, 30:637-643.
Richardson, S. 1996. Valuation of the Canadian Road and Highway System. TP 1279E. Transport Canada, Ottawa.
Samson, M. and L. Fréchette. 1995. Seasonal Variation of Pavement Strength Based on Benkelman Beam Rebounds. Report prepared for the Canadian Strategic Highway Research Program as part of the Canadian Long-term Pavement Performance Project.
Sebaaly, P.E., A. Lake and J. Epps. 2002. Evaluation of low-temperature properties of HMA mixtures, Journal of Transportation Engineering, 128(6): 578-586.
Semenov, M., R. Brooks, E. Barrow, and C. Richardson. 1998. Comparison of the WGEN and LARS-WG stochastic weather generators in diverse climates, Climate Research, 10:95-107.
Semenov, M.A. and E.M. Barrow 1997. Use of a stochastic weather generator in the development of climate change scenarios, Climatic Change, 35:397-414.
Shafizadeh K. and F. Mannering. 2003. Acceptability of pavement roughness an urban highways by driving public, Transportation Research Record, 1860:187-193.

The Road Well-traveled: Implications of Climate Change for Pavement Infrastructure in Southern Canada 76
Shalaby, A., S.M. Easa, and A.O. Abd El Halim 1998. Investigation of Thermal Cracking on C-SHRP Test Sections. http://www.ce.umanitoba.ca/~shalaby/files/csce98.pdf
Shen, W. and D.J. Kirkner. 2001. Thermal cracking of viscoelastic asphalt-concrete pavement, Journal of Engineering Mechanics, 127(7):700-709.
Shenoy, A. 2002. Single-event cracking temperature of asphalt pavements directly from bending beam rheometer data, Journal of Transportation Engineering, 128(5): 465-471.
Sherwood, P.T. and P.G. Roe 1986. Winter air temperatures in relation to frost damage in roads, Research Report 45. Transport and Road Research Laboratory, Department of Transport, Crowthorne, Berkshire, UK.
SHRP. 1990. Distress Identification Manual for the Long Term Pavement Performance Studies. Strategic Highway Research Program, Washington, D.C.
Simonsen, E., V.C. Janoo and U. Isacsson 1997. Prediction of temperature and moisture changes in pavement structures, Journal of Cold Regions Engineering, 11(4), 291-307.
Smith, S.L., M.M. Burgess, and J.A. Heginbottom. 2001. Permafrost in Canada, a challenge to northern development; in G.R. Brooks (ed.) A Synthesis of Geological Hazards in Canada, Geological Survey of Canada, Bulletin 548, pp. 241–264.
Start, M.R., J. Kim, and W.D. Berg 1998. Potential safety cost-effectiveness of treating rutted pavements, Transportation Research Record, 1629:208-213.
TAC 1999. Geometric Design Guide for Canadian Roads. Transportation Association of Canada, Ottawa, ON. 830pp.
TC 2000. Transportation in Canada 2000 Annual Report. TP13198E. Transport Canada, Ottawa, ON. http://www.tc.gc.ca/.
TC 2002. Transportation in Canada 2002 Annual Report. TP13198E. Transport Canada, Ottawa, ON. http://www.tc.gc.ca/.
TC 2003. Transportation in Canada 2003 Annual Report. TP13198E. Transport Canada, Ottawa, ON. http://www.tc.gc.ca/.
Tighe, S., R. Haas and N. Li. 2001.Overlay Performance in the Canadian Strategic Highway Research Program’s LTPP Study, Transportation Research Record, 1778:191-200.
Tighe, S and R. Haas. 2001. Managing Paved Road Assets Effectively, Canadian Technical Asphalt Association Proceedings, Volume XLVI, Winnipeg, November 2000. pp. 407-422.
Tighe, S. 1999. An Integrated Model to Assess Asphalt Cement Quality on Low Temperature Performance and Life Cycle Cost (section 2.4), Ph.D. thesis, University of Waterloo, Department of Civil Engineering, Waterloo, Ontario.
Tighe, S. 2001. Guidelines for probabilistic pavement life cycle cost analysis, Transportation Research Record, 1769:28-38.
Tighe, S., N. Li, L. Cowe Falls and R. Haas 2000. Incorporating road safety into pavement management, Transportation Research Record, 1699:1-10.
Transport Canada 2000. Canadian Vehicle Survey, 2000. http://www.tc.gc.ca/pol/en/cvs/files/TC_2000_CVS%20Report_E.pdf
TRB 2004. Moisture Sensitivity of Asphalt Pavements: A National Seminar, February 4-6, 2003, San Diego, California. Transportation Research Board, National Academies. pp. 186-206. http://trb.org/publications/conf/reports/moisture/05_TOP5.pdf. Accessed January 2005.
Tsai, Y. and J.S. Lai 2002. Framework and strategy for implementing an information technology-based pavement management system, Transportation Research Record, 1816:56-64.
U.S. Department of Transportation 2007. Long Term Pavement Performance (LTPP) program. Federal Highways Administration. http://www.fhwa.dot.gov/pavement/ltpp/.
USFHWA 2002. Superpave Asphalt Mixture Design, workshop workbook, version 8.0. Federal Highway Administration, Department of Transportation. http://www.tfhrc.gov/pavement/asphalt/prodrsrch/mixturedesign/mixdsgn.pdf
Uzan, J. 2004. Permanent deformation in flexible pavements, Journal of Transportation Engineering, 130(1):6-13.

The Road Well-traveled: Implications of Climate Change for Pavement Infrastructure in Southern Canada 77
Vadakpat, G., S. Stoffels, and K. Dixon 2000. Road user cost models for network-level pavement management, Transportation Research Record, 1699:49-57.
Wall, James III and M.R. Smith 1998. Life-cycle Cost Analysis in Pavement Design-Interim Technical Bulletin. FHWA-SA-98-079. U.S. Federal Highway Administration, Washington, D.C.
Walton, D., J.A. Thomas and P.D. Cenek 2004. Self and others' willingness to pay for improvements to the paved road surface, Transportation Research Part A, 38(7):483-494
Watson, D.K. and R.K.N.D. Rajapakse. 2000. Seasonal variation in material properties of a flexible pavement, Canadian Journal of Civil Engineering, 27:44-54.
White, T.D. and B. Coree. 1990. Threshold pavement thickness to survive spring thaw. Third International Conference on Bearing Capacity of Roads and Airfield, Trondheim, Norway.
Wilby, R.L., C.W. Dawson, and E.M. Barrow 2002. SDSM-a decision support tool for the assessment of regional climate change impacts, Environmental and Modelling Software, 17(2):145-157.
Wilks, D.S. and R.L. Wilby 1999. The weather generation game: a review of stochastic weather models, Progress in Physical Geography, 23(3):329-357.
Wright, J.F., C. Duchesne, M. Nixon, and M. Côté. 2002. Ground thermal modeling in support of terrain evaluation and route selection in the Mackenzie River valley. Report prepared for the Climate Change Action Fund, Natural Resources Canada. 53 pp.
Xiao, J., B.T. Kulakowski, and M. El-Gindy. 2000. Prediction of wet-pavement accidents: fuzzy logic model, Transportation Research Recor, 1717:28-36.
Yavuzturk, C., K. Ksaibati, and A.D. Chiasson 2005. Assessment of temperature fluctuations in asphalt pavements due to thermal environmental conditions using a two-dimensional, transient finite-difference approach, Journal of Materials in Civil Engineering, 17(4):465-475.
Zhang, Z.M., G. Claros, L. Manuel and I. Damnjanovic. 2003. Development of structural condition index to support pavement maintenance and rehabilitation decisions at network level, Transportation Research Record, 1827:10-17.
Zimmerman, K.A. and D.G. Peshkin 2003. Pavement management perspective on integrating preventive maintenance into a pavement management system, Transportation Research Record, 1827:3-9.
Zuo, G., R.W. Meier and E.C. Drumm. 2002. The effect of temperature averaging on predicted pavement life, 81st Annual Meeting Pre-print CD-ROM, proceedings of the Transportation Research Board annual meeting, January 2002, Washington, D.C.

The Road Well-traveled: Implications of Climate Change for Pavement Infrastructure in Southern Canada 78
APPENDIX A CLIMATE CHANGE SCENARIO INFORMATION FOR CASE STUDY
SITES

The Road Well-traveled: Implications of Climate Change for Pavement Infrastructure in Southern Canada 79
Table A-1. CGCM2A2x mean monthly temperature change scenarios (2049-60 relative to 1961-90) for case study sites Temperature Change (2049-2060 relative to 1961-1990 baseline) (°C) Site Jan Feb Mar Apr May Jun Jul Aug Sep Oct Nov DecVancouver 2.15 2.72 2.60 2.27 1.90 1.86 1.95 1.95 1.99 1.69 1.84 1.77
Kelowna 2.35 3.03 2.64 3.10 2.08 1.89 2.11 2.03 2.03 1.58 1.76 1.55
Calgary 5.37 5.06 4.54 4.97 4.69 2.45 2.31 2.46 2.30 1.59 1.36 1.32
Edmonton 5.62 3.88 3.31 3.49 5.86 2.65 2.31 2.09 1.90 1.38 1.00 2.84
Regina 5.95 5.79 6.27 6.46 5.38 3.24 3.06 3.22 2.95 2.13 1.40 2.46
Winnipeg 5.70 4.06 4.10 5.30 6.68 3.36 3.22 3.11 2.76 2.09 1.12 3.07
Thunder Bay
4.71 3.37 2.79 1.36 3.44 3.50 3.01 2.39 2.46 1.88 0.83 3.63
North Bay 5.62 4.56 2.96 1.23 4.00 2.83 2.60 2.17 2.46 2.32 1.62 0.55
Windsor 4.79 5.44 5.03 5.16 3.23 2.85 2.82 2.55 2.88 2.38 1.82 1.33
Muskoka 5.62 4.56 2.96 1.23 4.00 2.83 2.60 2.17 2.46 2.32 1.62 0.55
Toronto 4.44 5.57 4.42 4.74 3.46 2.75 2.76 2.60 2.76 2.36 1.82 1.49
Ottawa 5.34 4.07 2.83 1.50 3.64 2.79 2.61 2.23 2.54 2.32 1.55 0.82
Montreal 5.34 4.07 2.83 1.50 3.64 2.79 2.61 2.23 2.54 2.32 1.55 0.82
Quebec City 4.90 4.06 2.46 1.18 3.46 2.75 2.71 2.30 2.61 2.35 1.48 0.84
Fredericton 4.01 4.33 1.95 1.25 3.21 2.65 2.79 2.36 2.55 2.36 1.56 0.76
Halifax 2.61 4.15 1.99 2.30 2.20 2.53 2.83 2.40 2.40 2.36 1.78 1.32
St. John's 3.91 4.47 3.15 1.67 2.96 2.65 3.12 2.40 2.22 2.13 1.59 1.07

The Road Well-traveled: Implications of Climate Change for Pavement Infrastructure in Southern Canada 80
Table A-2. CGCM2A2x mean monthly precipitation change scenarios (2049-60 relative to 1961-90) for case study sites Precipitation Change (2049-2060 relative to 1961-1990 baseline) (%) Site Jan Feb Mar Apr May Jun Jul Aug Sep Oct Nov DecVancouver 7.05 2.25 -0.71 -2.93 -17.57 -8.72 -13.21 5.36 4.99 -0.10 19.50 9.07Kelowna 5.50 1.81 -1.86 -0.96 -15.32 -9.28 -7.22 1.34 6.75 4.65 18.59 7.13Calgary -4.65 10.75 -6.80 21.82 7.15 0.74 -22.07 -2.80 -7.73 5.11 7.47 3.36Edmonton 6.67 5.78 0.20 1.42 20.12 17.25 -5.14 -2.05 10.20 8.93 10.18 6.56Regina 0.91 3.77 5.84 25.68 27.22 7.93 -21.31 -10.54 -20.83 10.99 6.47 4.20Winnipeg -4.37 -2.86 -14.15 6.00 18.55 0.85 -14.97 -13.24 -22.23 5.05 2.83 -4.46Thunder Bay 2.52 15.88 -12.82 1.71 17.97 7.10 -1.87 -8.94 -7.23 -11.55 11.04 6.30North Bay -1.98 -1.34 -4.11 12.72 9.37 3.03 7.66 6.59 -0.85 7.87 -0.20 -12.58Windsor -3.22 1.73 0.25 5.96 4.38 -3.31 -8.98 -4.41 0.66 2.75 -10.94 1.48Muskoka -1.98 -1.34 -4.11 12.72 9.37 3.03 7.66 6.59 -0.85 7.87 -0.20 -12.58Toronto -5.84 -1.89 -5.49 8.28 -1.21 -8.27 1.44 6.80 0.10 -4.89 -7.57 -0.25Ottawa -4.21 -2.16 -5.54 10.56 7.81 0.83 6.96 13.77 4.08 1.24 -0.86 -4.03Montreal -4.21 -2.16 -5.54 10.56 7.81 0.83 6.96 13.77 4.08 1.24 -0.86 -4.03Quebec City -3.50 -1.23 -1.61 9.01 8.65 -0.45 9.59 12.94 4.74 2.28 2.89 5.46Fredericton 0.49 -2.78 3.78 7.81 10.92 -2.44 6.02 0.81 4.96 1.77 7.29 4.18Halifax -1.21 -5.31 1.88 1.55 2.39 0.36 2.83 -1.94 5.52 2.31 12.93 -0.36St. John's -5.88 -4.68 -2.57 -1.18 4.50 -6.36 -0.06 -0.88 4.45 -5.95 7.01 -3.64

The Road Well-traveled: Implications of Climate Change for Pavement Infrastructure in Southern Canada 81
Table A-3. HadCM3B21 mean monthly temperature change scenarios (2049-60 relative to 1961-90) for case study sites Temperature Change (2049-2060 relative to 1961-1990 baseline) (°C) Site Jan Feb Mar Apr May Jun Jul Aug Sep Oct Nov DecVancouver -1.13 -1.47 0.44 2.73 1.87 2.04 2.37 1.82 2.54 2.09 1.47 2.06Kelowna -0.13 -0.50 0.53 2.46 1.59 2.21 3.93 4.76 4.59 2.08 1.83 1.96Calgary 1.15 0.05 0.83 1.04 1.45 2.40 4.13 4.53 4.90 2.36 2.10 2.76Edmonton 0.87 0.41 0.75 0.95 1.27 2.17 3.91 4.04 4.49 2.37 2.45 2.25Regina 0.94 -0.50 0.99 1.71 1.53 2.46 3.50 3.94 4.58 2.72 2.52 2.01Winnipeg 0.96 -0.17 1.44 2.50 1.99 2.53 3.30 3.88 4.38 2.81 2.49 1.73Thunder Bay 0.89 0.24 1.43 2.20 2.29 2.77 2.97 2.92 3.18 2.43 2.23 2.19North Bay 2.04 1.46 2.16 2.90 2.71 3.09 2.94 3.16 2.20 2.03 2.24 2.46Windsor 1.57 0.93 1.50 2.95 2.82 2.58 2.70 3.45 2.14 2.44 2.14 2.53Muskoka 2.44 1.35 1.91 3.01 2.79 2.73 2.77 3.34 2.27 2.16 2.47 2.13Toronto 2.44 1.35 1.91 3.01 2.79 2.73 2.77 3.34 2.27 2.16 2.47 2.13Ottawa 1.88 1.11 1.95 2.70 2.85 2.90 3.05 3.78 2.35 2.04 2.48 1.99Montreal 1.88 1.11 1.95 2.70 2.85 2.90 3.05 3.78 2.35 2.04 2.48 1.99Quebec City 2.30 1.76 1.89 2.52 2.85 2.75 2.94 3.48 1.93 1.66 2.41 2.08Fredericton 2.50 1.98 1.94 2.11 2.45 2.87 2.70 3.57 1.86 1.70 2.47 2.18Halifax 2.50 1.98 1.94 2.11 2.45 2.87 2.70 3.57 1.86 1.70 2.47 2.18St. John's 1.65 1.41 1.54 1.36 1.46 2.32 2.42 3.19 2.54 1.66 1.55 2.15
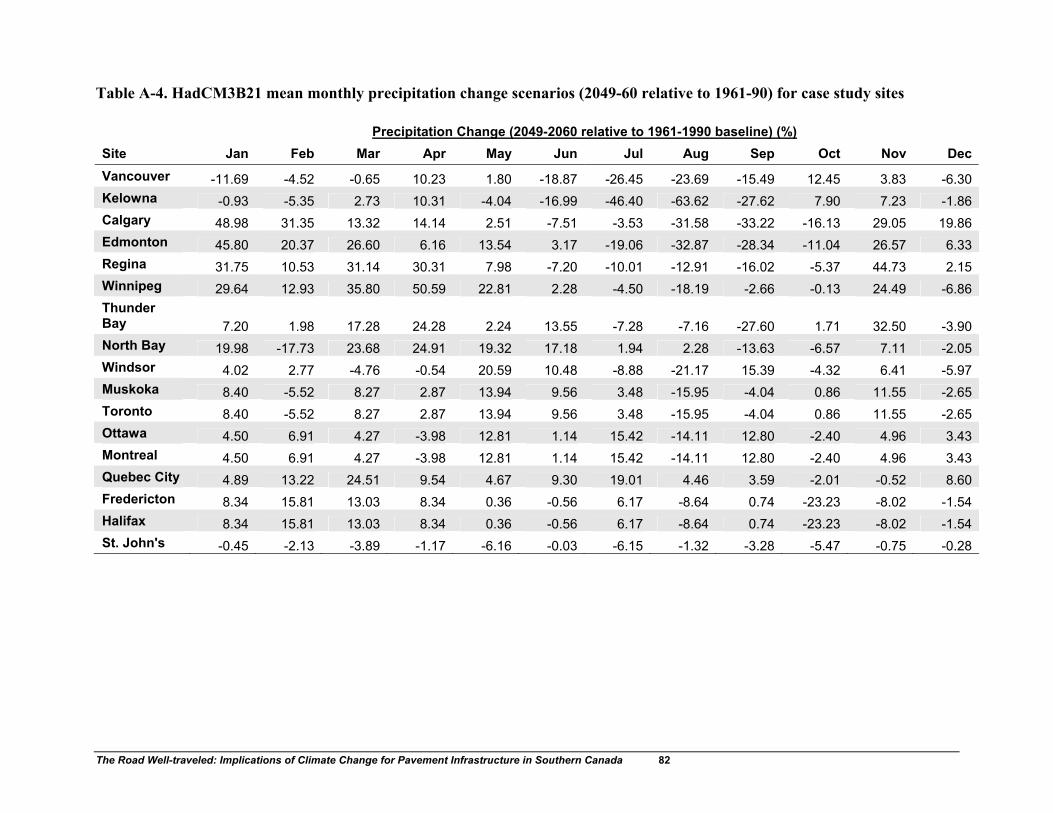
The Road Well-traveled: Implications of Climate Change for Pavement Infrastructure in Southern Canada 82
Table A-4. HadCM3B21 mean monthly precipitation change scenarios (2049-60 relative to 1961-90) for case study sites Precipitation Change (2049-2060 relative to 1961-1990 baseline) (%) Site Jan Feb Mar Apr May Jun Jul Aug Sep Oct Nov DecVancouver -11.69 -4.52 -0.65 10.23 1.80 -18.87 -26.45 -23.69 -15.49 12.45 3.83 -6.30Kelowna -0.93 -5.35 2.73 10.31 -4.04 -16.99 -46.40 -63.62 -27.62 7.90 7.23 -1.86Calgary 48.98 31.35 13.32 14.14 2.51 -7.51 -3.53 -31.58 -33.22 -16.13 29.05 19.86Edmonton 45.80 20.37 26.60 6.16 13.54 3.17 -19.06 -32.87 -28.34 -11.04 26.57 6.33Regina 31.75 10.53 31.14 30.31 7.98 -7.20 -10.01 -12.91 -16.02 -5.37 44.73 2.15Winnipeg 29.64 12.93 35.80 50.59 22.81 2.28 -4.50 -18.19 -2.66 -0.13 24.49 -6.86Thunder Bay 7.20 1.98 17.28 24.28 2.24 13.55 -7.28 -7.16 -27.60 1.71 32.50 -3.90North Bay 19.98 -17.73 23.68 24.91 19.32 17.18 1.94 2.28 -13.63 -6.57 7.11 -2.05Windsor 4.02 2.77 -4.76 -0.54 20.59 10.48 -8.88 -21.17 15.39 -4.32 6.41 -5.97Muskoka 8.40 -5.52 8.27 2.87 13.94 9.56 3.48 -15.95 -4.04 0.86 11.55 -2.65Toronto 8.40 -5.52 8.27 2.87 13.94 9.56 3.48 -15.95 -4.04 0.86 11.55 -2.65Ottawa 4.50 6.91 4.27 -3.98 12.81 1.14 15.42 -14.11 12.80 -2.40 4.96 3.43Montreal 4.50 6.91 4.27 -3.98 12.81 1.14 15.42 -14.11 12.80 -2.40 4.96 3.43Quebec City 4.89 13.22 24.51 9.54 4.67 9.30 19.01 4.46 3.59 -2.01 -0.52 8.60Fredericton 8.34 15.81 13.03 8.34 0.36 -0.56 6.17 -8.64 0.74 -23.23 -8.02 -1.54Halifax 8.34 15.81 13.03 8.34 0.36 -0.56 6.17 -8.64 0.74 -23.23 -8.02 -1.54St. John's -0.45 -2.13 -3.89 -1.17 -6.16 -0.03 -6.15 -1.32 -3.28 -5.47 -0.75 -0.28

The Road Well-traveled: Implications of Climate Change for Pavement Infrastructure in Southern Canada 83
-2
-1.5
-1
-0.5
0
0.5
1
1.5
2
2.5
3
Jan Feb Mar Apr May Jun Jul Aug Sep Oct Nov Dec
Tem
pera
ture
Cha
nge
(°C
)
-30-25-20-15-10-50510152025
Prec
ipita
tion
Cha
nge
(%)
Temperature (CGCM2A2x) Temperature (HadCM3B21)
Precipitation (CGCM2A2x) Precipitation (HadCM3B21)
Figure A-1. CGCM2A2x and HadCM3B21 temperature and precipitation change scenarios (2050s) for the British Columbia site (Vancouver)
00.5
11.5
22.5
33.5
44.5
55.5
66.5
Jan Feb Mar Apr May Jun Jul Aug Sep Oct Nov Dec
Tem
pera
ture
Cha
nge
(°C
)
-40-35-30-25-20-15-10-505101520253035404550
Prec
ipita
tion
Cha
nge
(%)
Temperature (CGCM2A2x) Temperature (HadCM3B21)
Precipitation (CGCM2A2x) Precipitation (HadCM3B21)
Figure 28. CGCM2A2x and HadCM3B21 temperature and precipitation change scenarios (2050s) for the Alberta site (Edmonton)
-1-0.5
00.5
11.5
22.5
33.5
44.5
55.5
66.5
77.5
Jan Feb Mar Apr May Jun Jul Aug Sep Oct Nov Dec
Tem
pera
ture
Cha
nge
(°C
)
-30-25-20-15-10-50510152025303540455055
Prec
ipita
tion
Cha
nge
(%)
Temperature (CGCM2A2x) Temperature (HadCM3B21)
Precipitation (CGCM2A2x) Precipitation (HadCM3B21)
Figure 29. CGCM2A2x and HadCM3B21 temperature and precipitation change scenarios (2050s) for the Manitoba site (Winnipeg)
00.5
11.5
22.5
33.5
44.5
55.5
6
Jan Feb Mar Apr May Jun Jul Aug Sep Oct Nov DecTe
mpe
ratu
re C
hang
e (°
C)
-20
-15
-10
-5
0
5
10
15
20
Prec
ipita
tion
Cha
nge
(%)
Temperature (CGCM2A2x) Temperature (HadCM3B21)
Precipitation (CGCM2A2x) Precipitation (HadCM3B21)
Figure 30. CGCM2A2x and HadCM3B21 temperature and precipitation change scenarios (2050s) for the Ontario site (Toronto)

The Road Well-traveled: Implications of Climate Change for Pavement Infrastructure in Southern Canada 84
00.5
11.5
22.5
33.5
44.5
55.5
6
Jan Feb Mar Apr May Jun Jul Aug Sep Oct Nov Dec
Tem
pera
ture
Cha
nge
(°C
)
-20
-15
-10
-5
0
5
10
15
20
Prec
ipita
tion
Cha
nge
(%)
Temperature (CGCM2A2x) Temperature (HadCM3B21)
Precipitation (CGCM2A2x) Precipitation (HadCM3B21)
Figure 31. CGCM2A2x and HadCM3B21 temperature and precipitation change scenarios (2050s) for the Quebec site (Montreal)
0
0.5
1
1.5
2
2.5
3
3.5
4
4.5
5
Jan Feb Mar Apr May Jun Jul Aug Sep Oct Nov Dec
Tem
pera
ture
Cha
nge
(°C
)
-10
-5
0
5
10
Prec
ipita
tion
Cha
nge
(%)
Temperature (CGCM2A2x) Temperature (HadCM3B21)
Precipitation (CGCM2A2x) Precipitation (HadCM3B21)
Figure 32. CGCM2A2x and HadCM3B21 temperature and precipitation change scenarios (2050s) for the Newfoundland site (St. John’s)

The Road Well-traveled: Implications of Climate Change for Pavement Infrastructure in Southern Canada 85
APPENDIX B DETERIORATION-RELEVANT CLIMATE INDICATOR RESULTS FOR
ALL CASE STUDY SITES
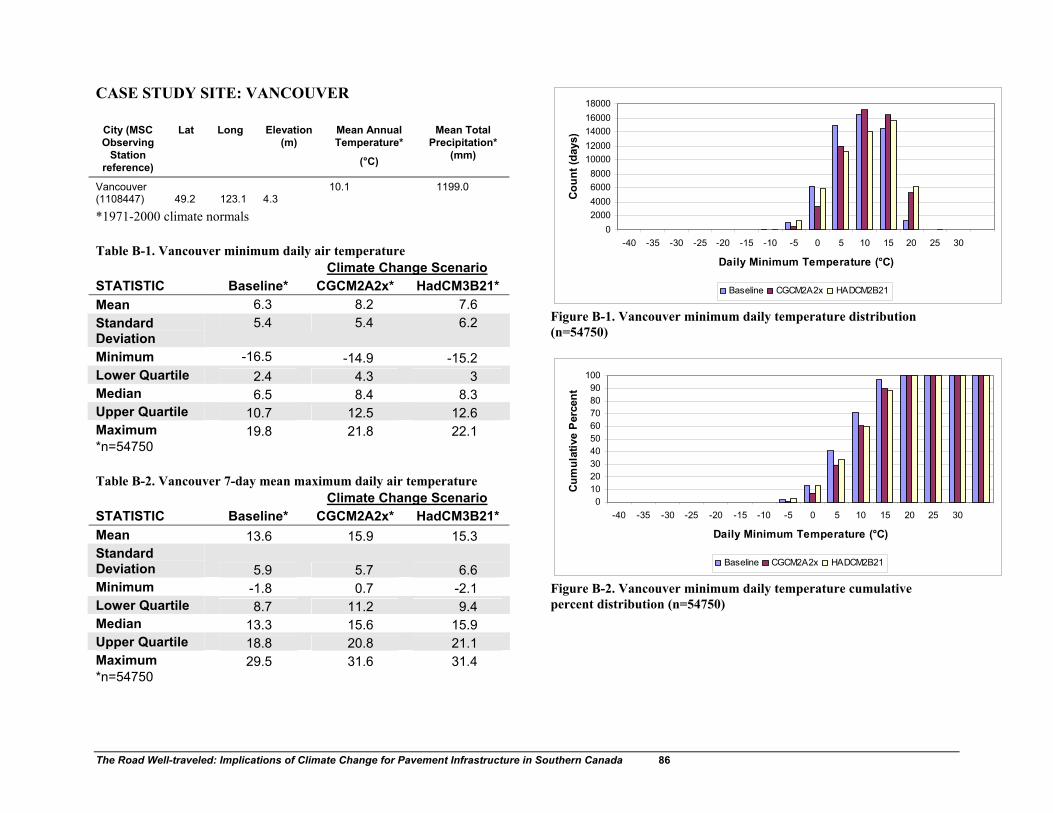
The Road Well-traveled: Implications of Climate Change for Pavement Infrastructure in Southern Canada 86
CASE STUDY SITE: VANCOUVER
City (MSC Observing
Station reference)
Lat Long Elevation (m)
Mean Annual Temperature*
(°C)
Mean Total Precipitation*
(mm)
Vancouver (1108447) 49.2 123.1 4.3
10.1 1199.0
*1971-2000 climate normals Table B-1. Vancouver minimum daily air temperature Climate Change Scenario STATISTIC Baseline* CGCM2A2x* HadCM3B21* Mean 6.3 8.2 7.6 Standard Deviation
5.4 5.4 6.2
Minimum -16.5 -14.9 -15.2 Lower Quartile 2.4 4.3 3 Median 6.5 8.4 8.3 Upper Quartile 10.7 12.5 12.6 Maximum 19.8 21.8 22.1 *n=54750 Table B-2. Vancouver 7-day mean maximum daily air temperature Climate Change Scenario STATISTIC Baseline* CGCM2A2x* HadCM3B21* Mean 13.6 15.9 15.3 Standard Deviation 5.9 5.7 6.6 Minimum -1.8 0.7 -2.1 Lower Quartile 8.7 11.2 9.4 Median 13.3 15.6 15.9 Upper Quartile 18.8 20.8 21.1 Maximum 29.5 31.6 31.4 *n=54750
02000400060008000
1000012000140001600018000
-40 -35 -30 -25 -20 -15 -10 -5 0 5 10 15 20 25 30
Daily Minimum Temperature (°C)
Coun
t (da
ys)
Baseline CGCM2A2x HADCM2B21
Figure B-1. Vancouver minimum daily temperature distribution (n=54750)
0102030405060708090
100
-40 -35 -30 -25 -20 -15 -10 -5 0 5 10 15 20 25 30
Daily Minimum Temperature (°C)
Cum
ulat
ive
Perc
ent
Baseline CGCM2A2x HADCM2B21
Figure B-2. Vancouver minimum daily temperature cumulative percent distribution (n=54750)

The Road Well-traveled: Implications of Climate Change for Pavement Infrastructure in Southern Canada 87
-60
-50
-40
-30
-20
-10
0
10
20
30
Base CGCM2A2x HADCM3B21
Daily
Min
imum
Tem
pera
ture
(°C)
Minimum 25% Quartile Median 75% Quartile Maximum
Figure B-3. Vancouver minimum daily temperature distribution: quartile statistics (n=54750)
02000400060008000
1000012000140001600018000
-35 -30 -25 -20 -15 -10 -5 0 5 10 15 20 25 30 35 40
7-day Mean Maximum Temperature (°C)
Cou
nt (d
ays)
Baseline CGCM2A2x HADCM2B21
Figure B-4. Vancouver 7-day mean maximum daily temperature distribution (n=54750)
0102030405060708090
100
-35 -30 -25 -20 -15 -10 -5 0 5 10 15 20 25 30 35 40
7-day Maximum Temperature Range (°C)
Cum
ulat
ive
Perc
ent
Baseline CGCM2A2x HADCM2B21
Figure B-5. Vancouver 7-day mean maximum daily temperature cumulative percent distribution (n=54750)
-40
-30
-20
-10
0
10
20
30
40
50
Base CGCM2A2x HADCM3B21
7-da
y M
axim
um T
empe
ratu
re (°
C)Minimum 25% Quartile Median 75% Quartile Maximum
Figure B-6. Vancouver 7-day mean maximum daily temperature distribution: quartile statistics (n=54750)

The Road Well-traveled: Implications of Climate Change for Pavement Infrastructure in Southern Canada 88
Table B-3. Vancouver annual extreme minimum air temperature Climate Change Scenario STATISTIC Baseline* CGCM2A2x* HadCM3B21* Mean -9.3 -7.4 -10.0 Standard Deviation 2.3 2.3 2.1 Minimum -16.5 -14.9 -15.2 Lower Quartile -10.6 -8.8 -11.2 Median -9.2 -7.3 -10.0 Upper Quartile -7.5 -5.7 -8.6 Maximum -4.4 -2.6 -5.7 *n=150 Table B-4. Vancouver annual extreme 7-day mean maximum air temperature Climate Change Scenario STATISTIC Baseline* CGCM2A2x* HadCM3B21* Mean 25.0 27.1 27.1 Standard Deviation 1.2 1.2 1.2 Minimum 21.5 23.4 24.0 Lower Quartile 24.2 26.3 26.3 Median 24.9 27.0 27.1 Upper Quartile 25.7 27.9 27.8 Maximum 29.5 31.6 31.4 *n=150
-60
-50
-40
-30
-20
-10
0
Base CGCM2A2x HADCM3B21
Ann
ual E
xtre
me
Min
imum
Te
mpe
ratu
re (°
C)
Minimum 25% Quartile Median 75% Quartile Maximum
Figure B-7. Vancouver annual extreme minimum temperature distribution: quartile statistics (n=150)
0.0
5.0
10.0
15.0
20.0
25.0
30.0
35.0
Base CGCM2A2x HADCM3B21Ann
ual E
xtre
me
7-da
y M
axim
um
Tem
pera
ture
(°C
)
Minimum 25% Quartile Median 75% Quartile Maximum
Figure B-8. Vancouver annual extreme 7-day mean maximum daily temperature distribution: quartile statistics (n=150)
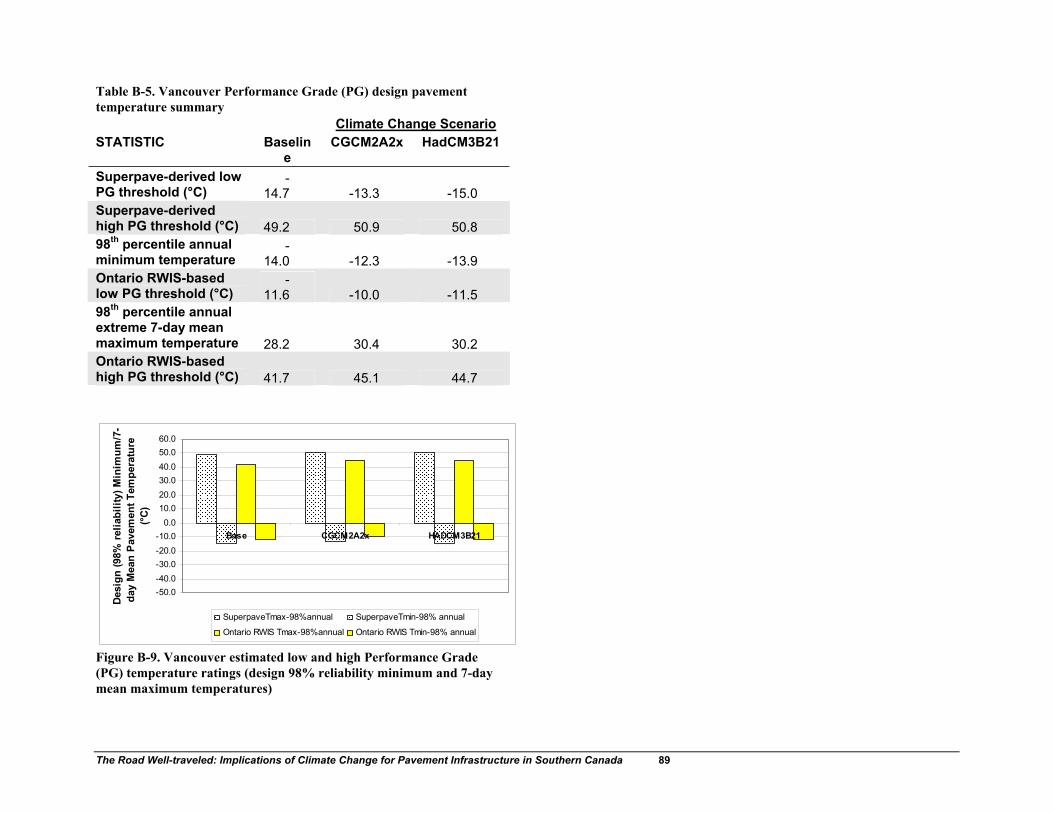
The Road Well-traveled: Implications of Climate Change for Pavement Infrastructure in Southern Canada 89
Table B-5. Vancouver Performance Grade (PG) design pavement temperature summary Climate Change Scenario STATISTIC Baselin
e CGCM2A2x HadCM3B21
Superpave-derived low PG threshold (°C)
-14.7 -13.3 -15.0
Superpave-derived high PG threshold (°C) 49.2 50.9 50.8 98th percentile annual minimum temperature
-14.0 -12.3 -13.9
Ontario RWIS-based low PG threshold (°C)
-11.6 -10.0 -11.5
98th percentile annual extreme 7-day mean maximum temperature 28.2 30.4 30.2 Ontario RWIS-based high PG threshold (°C) 41.7 45.1 44.7
-50.0-40.0-30.0-20.0-10.0
0.010.020.030.040.050.060.0
Base CGCM2A2x HADCM3B21
Desi
gn (9
8% re
liabi
lity)
Min
imum
/7-
day
Mea
n Pa
vem
ent T
empe
ratu
re
(°C)
SuperpaveTmax-98%annual SuperpaveTmin-98% annual
Ontario RWIS Tmax-98%annual Ontario RWIS Tmin-98% annual
Figure B-9. Vancouver estimated low and high Performance Grade (PG) temperature ratings (design 98% reliability minimum and 7-day mean maximum temperatures)

The Road Well-traveled: Implications of Climate Change for Pavement Infrastructure in Southern Canada 90
CASE STUDY SITE: KELOWNA
City (MSC Observing
Station reference)
Lat Long Elevation (m)
Mean Annual Temperature*
(°C)
Mean Total Precipitation*
(mm)
Kelowna (1123970) 49.9 119.4 429.5
7.7 380.5
*1971-2000 climate normals Table B-6. Kelowna minimum daily air temperature Climate Change Scenario STATISTIC Baseline* CGCM2A2x* HadCM3B21* Mean 1.3 3.5 3.1 Standard Deviation 7.5 7.3 8.0 Minimum -38.1 -35.6 -37.8 Lower Quartile -3.7 -1.4 -2.4 Median 1.8 3.9 3.7 Upper Quartile 7.2 9.2 9.3 Maximum 23.2 25.4 25.1 *n=54750 Table B-7. Kelowna 7-day mean maximum daily air temperature Climate Change Scenario STATISTIC Baseline* CGCM2A2x* HadCM3B21* Mean 14.0 16.3 16.5 Standard Deviation 10.1 10.0 11.7 Minimum -12.9 -11 -13.2 Lower Quartile 5.4 7.7 6.2 Median 14.1 16.9 16.7 Upper Quartile 22.6 24.8 26.6 Maximum 36.9 39.0 42.2 *n=54750
0
20004000
60008000
10000
1200014000
16000
-40 -35 -30 -25 -20 -15 -10 -5 0 5 10 15 20 25 30
Daily Minimum Temperature (°C)
Cou
nt (d
ays)
Baseline CGCM2A2x HADCM2B21
Figure B-10. Kelowna minimum daily temperature distribution (n=54750)
0102030405060708090
100
-40 -35 -30 -25 -20 -15 -10 -5 0 5 10 15 20 25 30
Daily Minimum Temperature (°C)
Cum
ulat
ive
Perc
ent
Baseline CGCM2A2x HADCM2B21
Figure B-11. Kelowna minimum daily temperature cumulative percent distribution (n=54750)

The Road Well-traveled: Implications of Climate Change for Pavement Infrastructure in Southern Canada 91
-60
-50
-40
-30
-20
-10
0
10
20
30
Base CGCM2A2x HADCM3B21
Daily
Min
imum
Tem
pera
ture
(°C)
Minimum 25% Quartile Median 75% Quartile Maximum
Figure B-12. Kelowna minimum daily temperature distribution: quartile statistics (n=54750)
0100020003000400050006000700080009000
10000
-35 -30 -25 -20 -15 -10 -5 0 5 10 15 20 25 30 35 40
7-day Mean Maximum Temperature (°C)
Cou
nt (d
ays)
Baseline CGCM2A2x HADCM2B21
Figure B-13. Kelowna 7-day mean maximum daily temperature distribution (n=54750)
0102030405060708090
100
-35 -30 -25 -20 -15 -10 -5 0 5 10 15 20 25 30 35 40
7-day Maximum Temperature Range (°C)
Cum
ulat
ive
Perc
ent
Baseline CGCM2A2x HADCM2B21
Figure B-14. Kelowna 7-day mean maximum daily temperature cumulative percent distribution (n=54750)
-40
-30
-20
-10
0
10
20
30
40
50
Base CGCM2A2x HADCM3B217-
day
Max
imum
Tem
pera
ture
(°C)
Minimum 25% Quartile Median 75% Quartile Maximum
Figure B-15. Kelowna 7-day mean maximum daily temperature distribution: quartile statistics (n=54750)
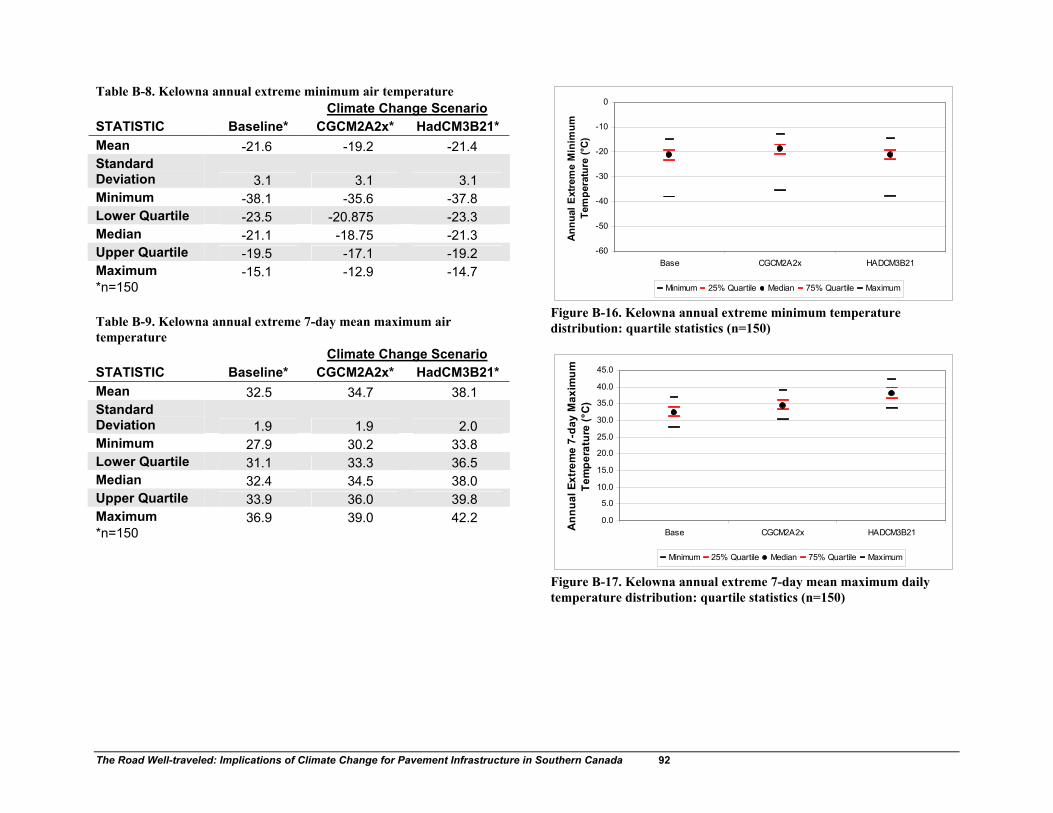
The Road Well-traveled: Implications of Climate Change for Pavement Infrastructure in Southern Canada 92
Table B-8. Kelowna annual extreme minimum air temperature Climate Change Scenario STATISTIC Baseline* CGCM2A2x* HadCM3B21* Mean -21.6 -19.2 -21.4 Standard Deviation 3.1 3.1 3.1 Minimum -38.1 -35.6 -37.8 Lower Quartile -23.5 -20.875 -23.3 Median -21.1 -18.75 -21.3 Upper Quartile -19.5 -17.1 -19.2 Maximum -15.1 -12.9 -14.7 *n=150 Table B-9. Kelowna annual extreme 7-day mean maximum air temperature Climate Change Scenario STATISTIC Baseline* CGCM2A2x* HadCM3B21* Mean 32.5 34.7 38.1 Standard Deviation 1.9 1.9 2.0 Minimum 27.9 30.2 33.8 Lower Quartile 31.1 33.3 36.5 Median 32.4 34.5 38.0 Upper Quartile 33.9 36.0 39.8 Maximum 36.9 39.0 42.2 *n=150
-60
-50
-40
-30
-20
-10
0
Base CGCM2A2x HADCM3B21
Ann
ual E
xtre
me
Min
imum
Te
mpe
ratu
re (°
C)
Minimum 25% Quartile Median 75% Quartile Maximum
Figure B-16. Kelowna annual extreme minimum temperature distribution: quartile statistics (n=150)
0.0
5.0
10.0
15.0
20.0
25.0
30.0
35.0
40.0
45.0
Base CGCM2A2x HADCM3B21Ann
ual E
xtre
me
7-da
y M
axim
um
Tem
pera
ture
(°C
)
Minimum 25% Quartile Median 75% Quartile Maximum
Figure B-17. Kelowna annual extreme 7-day mean maximum daily temperature distribution: quartile statistics (n=150)
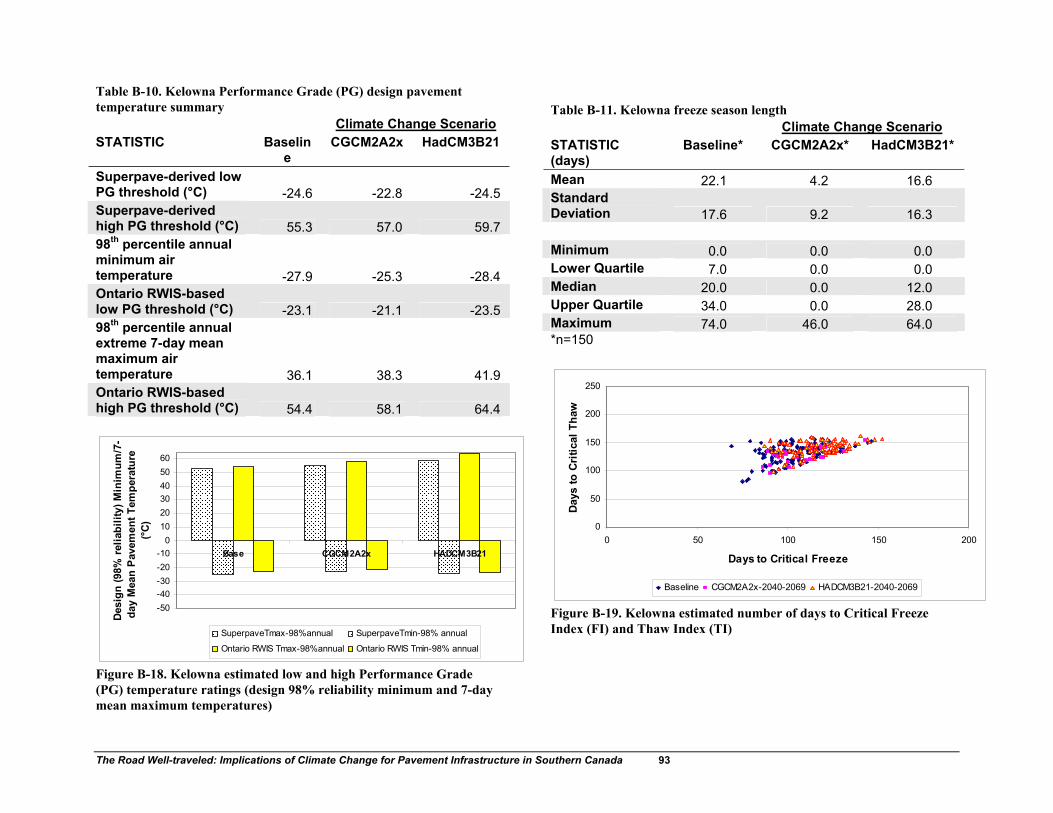
The Road Well-traveled: Implications of Climate Change for Pavement Infrastructure in Southern Canada 93
Table B-10. Kelowna Performance Grade (PG) design pavement temperature summary Climate Change Scenario STATISTIC Baselin
e CGCM2A2x HadCM3B21
Superpave-derived low PG threshold (°C) -24.6 -22.8 -24.5 Superpave-derived high PG threshold (°C) 55.3 57.0 59.7 98th percentile annual minimum air temperature -27.9 -25.3 -28.4 Ontario RWIS-based low PG threshold (°C) -23.1 -21.1 -23.5 98th percentile annual extreme 7-day mean maximum air temperature 36.1 38.3 41.9 Ontario RWIS-based high PG threshold (°C) 54.4 58.1 64.4
-50-40-30-20-10
0102030405060
Base CGCM2A2x HADCM3B21
Des
ign
(98%
rel
iabi
lity)
Min
imum
/7-
day
Mea
n P
avem
ent T
empe
ratu
re
(°C)
SuperpaveTmax-98%annual SuperpaveTmin-98% annual
Ontario RWIS Tmax-98%annual Ontario RWIS Tmin-98% annual
Figure B-18. Kelowna estimated low and high Performance Grade (PG) temperature ratings (design 98% reliability minimum and 7-day mean maximum temperatures)
Table B-11. Kelowna freeze season length Climate Change Scenario STATISTIC (days)
Baseline* CGCM2A2x* HadCM3B21*
Mean 22.1 4.2 16.6 Standard Deviation 17.6 9.2 16.3 Minimum 0.0 0.0 0.0 Lower Quartile 7.0 0.0 0.0 Median 20.0 0.0 12.0 Upper Quartile 34.0 0.0 28.0 Maximum 74.0 46.0 64.0 *n=150
0
50
100
150
200
250
0 50 100 150 200
Days to Critical FreezeDa
ys to
Crit
ical
Tha
wBaseline CGCM2A2x-2040-2069 HADCM3B21-2040-2069
Figure B-19. Kelowna estimated number of days to Critical Freeze Index (FI) and Thaw Index (TI)

The Road Well-traveled: Implications of Climate Change for Pavement Infrastructure in Southern Canada 94
0.0
10.0
20.0
30.0
40.0
50.0
60.0
70.0
80.0
Base CGCM2A2x HADCM3B21
Free
ze S
easo
n Le
ngth
(day
s)
Minimum 25% Quartile Median 75% Quartile Maximum
Figure B-20. Kelowna estimated freeze season length distribution: quartile statistics (n=150)
020406080
100120140160
1 3 5 7 9 11 13 15 17 19 21 23 25 27 29 31 33 35 37 39 41 43 45 47 49
Season
Days
to C
ritic
al F
reez
e
Base1 Base2 Base3
Figure B-21. Kelowna estimated days to critical FI (baseline series)
020406080
100120140160
1 3 5 7 9 11 13 15 17 19 21 23 25 27 29 31 33 35 37 39 41 43 45 47 49
Season
Days
to C
ritic
al F
reez
e
CGCM2A2xWG1 CGCM2A2xWG2 CGCM2A2xWG3
Figure B-22. Kelowna estimated days to critical FI (CGCM2A2x scenario series)
020406080
100120140160
1 3 5 7 9 11 13 15 17 19 21 23 25 27 29 31 33 35 37 39 41 43 45 47 49
SeasonDa
ys to
Crit
ical
Fre
eze
HADCM3B21WG1 HADCM3B21WG2 HADCM3B21WG3
Figure B-23. Kelowna estimated days to critical FI (HadCM3B21 scenario series)

The Road Well-traveled: Implications of Climate Change for Pavement Infrastructure in Southern Canada 95
020406080
100120140160180
1 3 5 7 9 11 13 15 17 19 21 23 25 27 29 31 33 35 37 39 41 43 45 47 49
Season
Days
to C
ritic
al T
haw
Base1 Base2 Base3
Figure B-24. Kelowna estimated days to critical TI (baseline series)
020406080
100120140160180
1 3 5 7 9 11 13 15 17 19 21 23 25 27 29 31 33 35 37 39 41 43 45 47 49
Season
Days
to C
ritic
al T
haw
CGCM2A2xWG1 CGCM2A2xWG2 CGCM2A2xWG3
Figure B-25. Kelowna estimated days to critical TI (CGCM2A2x scenario series)
020406080
100120140160180
1 3 5 7 9 11 13 15 17 19 21 23 25 27 29 31 33 35 37 39 41 43 45 47 49
Season
Day
s to
Cri
tical
Tha
w
HADCM3B21WG1 HADCM3B21WG2 HADCM3B21WG3
Figure B-26. Kelowna estimated days to critical TI (HadCM3B21 scenario series)
01020304050607080
1 3 5 7 9 11 13 15 17 19 21 23 25 27 29 31 33 35 37 39 41 43 45 47 49
SeasonFr
eeze
Sea
son
Leng
thBase1 Base2 Base3
Figure B-27. Kelowna estimated freeze season length (baseline series)
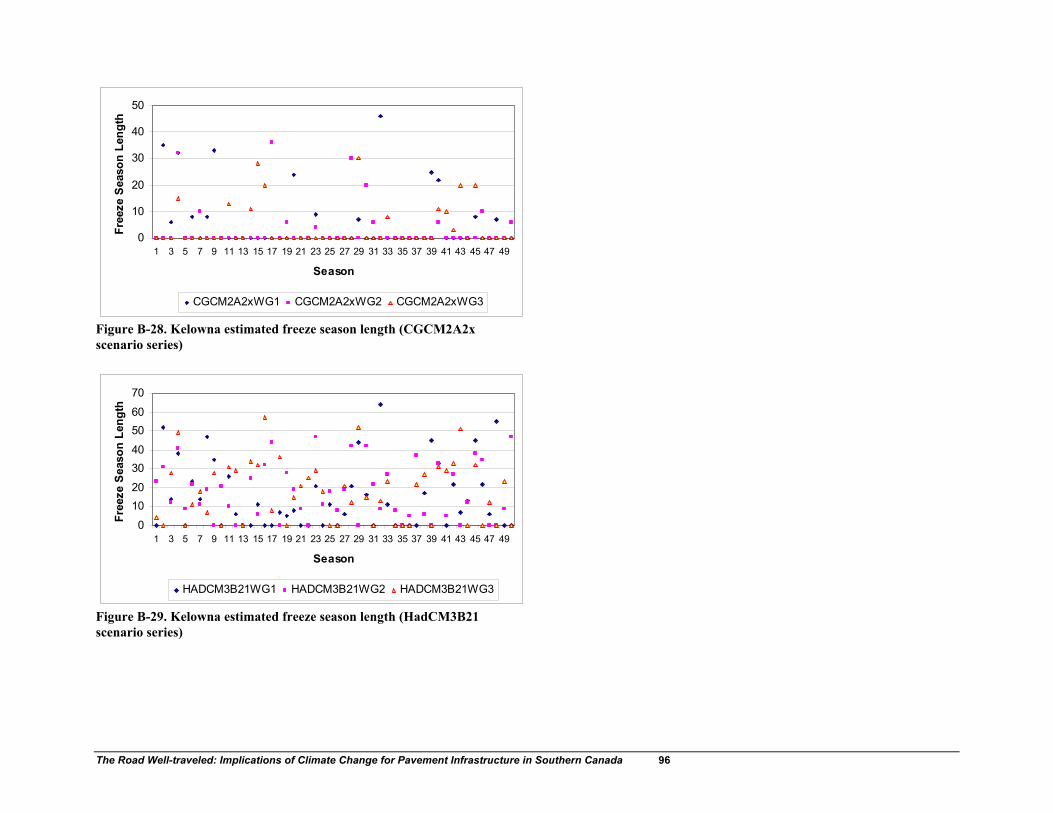
The Road Well-traveled: Implications of Climate Change for Pavement Infrastructure in Southern Canada 96
0
10
20
30
40
50
1 3 5 7 9 11 13 15 17 19 21 23 25 27 29 31 33 35 37 39 41 43 45 47 49
Season
Free
ze S
easo
n Le
ngth
CGCM2A2xWG1 CGCM2A2xWG2 CGCM2A2xWG3
Figure B-28. Kelowna estimated freeze season length (CGCM2A2x scenario series)
0
1020
3040
5060
70
1 3 5 7 9 11 13 15 17 19 21 23 25 27 29 31 33 35 37 39 41 43 45 47 49
Season
Free
ze S
easo
n Le
ngth
HADCM3B21WG1 HADCM3B21WG2 HADCM3B21WG3
Figure B-29. Kelowna estimated freeze season length (HadCM3B21 scenario series)

The Road Well-traveled: Implications of Climate Change for Pavement Infrastructure in Southern Canada 97
CASE STUDY SITE: CALGARY
City (MSC Observing
Station reference)
Lat Long Elevation (m)
Mean Annual Temperature*
(°C)
Mean Total Precipitation*
(mm)
Calgary (3031093)
51.0 114.0 1084.1 2.4 482.7
*1971-2000 climate normals Table B-12. Calgary minimum daily air temperature Climate Change Scenario STATISTIC (°C) Baseline* CGCM2A2x* HadCM3B21* Mean -2.6 1.0 -0.4 Standard Deviation 10.4 9.8 11.0 Minimum -55.9 -50.1 -54.1 Lower Quartile -9.5 -5.4 -7.9 Median -0.8 3.1 1 Upper Quartile 5.8 8.9 8.7 Maximum 21.1 28.1 24 *n=54750 Table B-13. Calgary 7-day mean maximum daily air temperature Climate Change Scenario STATISTIC (°C) Baseline* CGCM2A2x* HadCM3B21* Mean 10.2 13.1 12.6 Standard Deviation 10.4 10.4 11.6 Minimum -31.8 -28.0 -30.5 Lower Quartile 2.3 4.9 3.3 Median 11.2 14.4 13.1 Upper Quartile 19.0 22.1 22.6 Maximum 37.5 40.3 42.8 *n=54750
0
2000
4000
6000
8000
10000
12000
14000
-40 -35 -30 -25 -20 -15 -10 -5 0 5 10 15 20 25 30
Daily Minimum Temperature (°C)
Coun
t (da
ys)
Baseline CGCM2A2x HADCM2B21
Figure B-30. Calgary minimum daily temperature distribution (n=54750)
0102030405060708090
100
-40 -35 -30 -25 -20 -15 -10 -5 0 5 10 15 20 25 30
Daily Minimum Temperature (°C)
Cum
ulat
ive
Perc
ent
Baseline CGCM2A2x HADCM2B21
Figure B-31. Calgary minimum daily temperature cumulative percent distribution (n=54750)
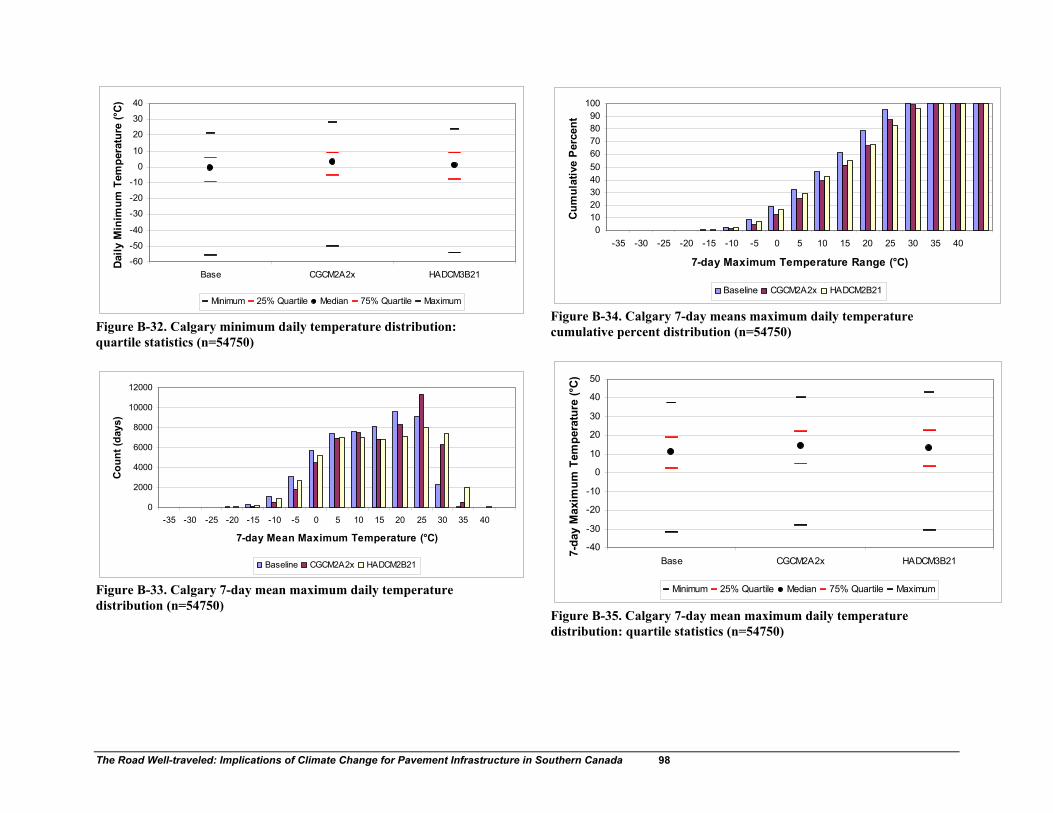
The Road Well-traveled: Implications of Climate Change for Pavement Infrastructure in Southern Canada 98
-60
-50
-40
-30
-20
-10
0
10
20
30
40
Base CGCM2A2x HADCM3B21
Daily
Min
imum
Tem
pera
ture
(°C)
Minimum 25% Quartile Median 75% Quartile Maximum
Figure B-32. Calgary minimum daily temperature distribution: quartile statistics (n=54750)
0
2000
4000
6000
8000
10000
12000
-35 -30 -25 -20 -15 -10 -5 0 5 10 15 20 25 30 35 40
7-day Mean Maximum Temperature (°C)
Cou
nt (d
ays)
Baseline CGCM2A2x HADCM2B21
Figure B-33. Calgary 7-day mean maximum daily temperature distribution (n=54750)
0102030405060708090
100
-35 -30 -25 -20 -15 -10 -5 0 5 10 15 20 25 30 35 40
7-day Maximum Temperature Range (°C)
Cum
ulat
ive
Perc
ent
Baseline CGCM2A2x HADCM2B21
Figure B-34. Calgary 7-day means maximum daily temperature cumulative percent distribution (n=54750)
-40
-30
-20
-10
0
10
20
30
40
50
Base CGCM2A2x HADCM3B217-
day
Max
imum
Tem
pera
ture
(°C
)Minimum 25% Quartile Median 75% Quartile Maximum
Figure B-35. Calgary 7-day mean maximum daily temperature distribution: quartile statistics (n=54750)
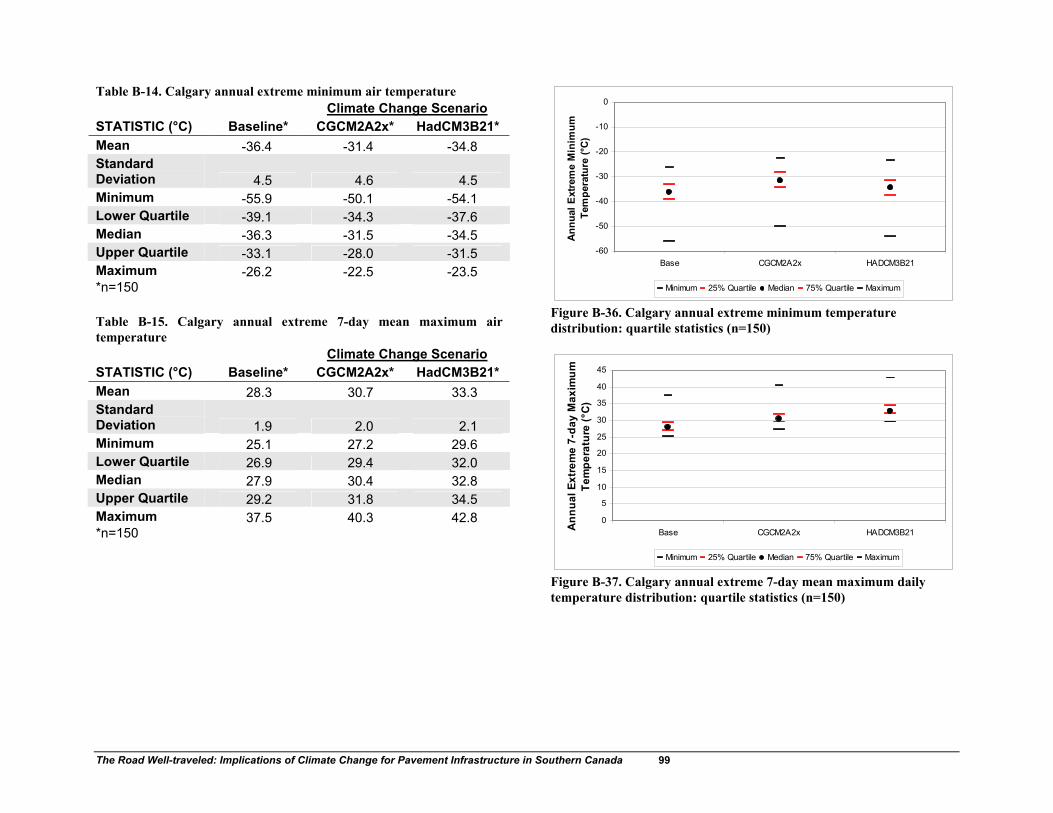
The Road Well-traveled: Implications of Climate Change for Pavement Infrastructure in Southern Canada 99
Table B-14. Calgary annual extreme minimum air temperature Climate Change Scenario STATISTIC (°C) Baseline* CGCM2A2x* HadCM3B21* Mean -36.4 -31.4 -34.8 Standard Deviation 4.5 4.6 4.5 Minimum -55.9 -50.1 -54.1 Lower Quartile -39.1 -34.3 -37.6 Median -36.3 -31.5 -34.5 Upper Quartile -33.1 -28.0 -31.5 Maximum -26.2 -22.5 -23.5 *n=150 Table B-15. Calgary annual extreme 7-day mean maximum air temperature Climate Change Scenario STATISTIC (°C) Baseline* CGCM2A2x* HadCM3B21* Mean 28.3 30.7 33.3 Standard Deviation 1.9 2.0 2.1 Minimum 25.1 27.2 29.6 Lower Quartile 26.9 29.4 32.0 Median 27.9 30.4 32.8 Upper Quartile 29.2 31.8 34.5 Maximum 37.5 40.3 42.8 *n=150
-60
-50
-40
-30
-20
-10
0
Base CGCM2A2x HADCM3B21
Ann
ual E
xtre
me
Min
imum
Te
mpe
ratu
re (°
C)
Minimum 25% Quartile Median 75% Quartile Maximum
Figure B-36. Calgary annual extreme minimum temperature distribution: quartile statistics (n=150)
0
5
10
15
20
25
30
35
40
45
Base CGCM2A2x HADCM3B21Ann
ual E
xtre
me
7-da
y M
axim
um
Tem
pera
ture
(°C
)
Minimum 25% Quartile Median 75% Quartile Maximum
Figure B-37. Calgary annual extreme 7-day mean maximum daily temperature distribution: quartile statistics (n=150)
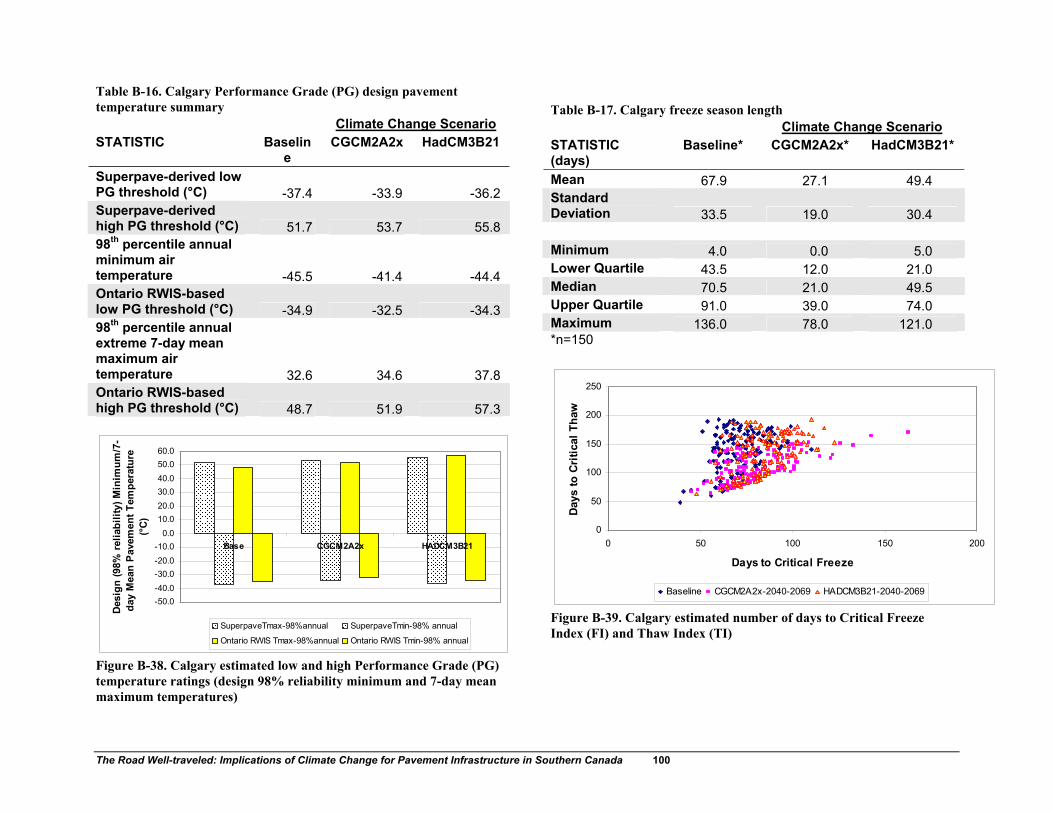
The Road Well-traveled: Implications of Climate Change for Pavement Infrastructure in Southern Canada 100
Table B-16. Calgary Performance Grade (PG) design pavement temperature summary Climate Change Scenario STATISTIC Baselin
e CGCM2A2x HadCM3B21
Superpave-derived low PG threshold (°C) -37.4 -33.9 -36.2 Superpave-derived high PG threshold (°C) 51.7 53.7 55.8 98th percentile annual minimum air temperature -45.5 -41.4 -44.4 Ontario RWIS-based low PG threshold (°C) -34.9 -32.5 -34.3 98th percentile annual extreme 7-day mean maximum air temperature 32.6 34.6 37.8 Ontario RWIS-based high PG threshold (°C) 48.7 51.9 57.3
-50.0-40.0-30.0-20.0-10.0
0.010.020.030.040.050.060.0
Base CGCM2A2x HADCM3B21
Des
ign
(98%
relia
bilit
y) M
inim
um/7
-da
y M
ean
Pave
men
t Tem
pera
ture
(°
C)
SuperpaveTmax-98%annual SuperpaveTmin-98% annual
Ontario RWIS Tmax-98%annual Ontario RWIS Tmin-98% annual
Figure B-38. Calgary estimated low and high Performance Grade (PG) temperature ratings (design 98% reliability minimum and 7-day mean maximum temperatures)
Table B-17. Calgary freeze season length Climate Change Scenario STATISTIC (days)
Baseline* CGCM2A2x* HadCM3B21*
Mean 67.9 27.1 49.4 Standard Deviation 33.5 19.0 30.4 Minimum 4.0 0.0 5.0 Lower Quartile 43.5 12.0 21.0 Median 70.5 21.0 49.5 Upper Quartile 91.0 39.0 74.0 Maximum 136.0 78.0 121.0 *n=150
0
50
100
150
200
250
0 50 100 150 200
Days to Critical FreezeD
ays
to C
ritic
al T
haw
Baseline CGCM2A2x-2040-2069 HADCM3B21-2040-2069
Figure B-39. Calgary estimated number of days to Critical Freeze Index (FI) and Thaw Index (TI)

The Road Well-traveled: Implications of Climate Change for Pavement Infrastructure in Southern Canada 101
0.0
20.0
40.0
60.0
80.0
100.0
120.0
140.0
160.0
Base CGCM2A2x HADCM3B21
Free
ze S
easo
n Le
ngth
(day
s)
Minimum 25% Quartile Median 75% Quartile Maximum
Figure B-40. Calgary estimated freeze season length distribution: quartile statistics (n=150)
0
20
40
60
80
100
120
1 3 5 7 9 11 13 15 17 19 21 23 25 27 29 31 33 35 37 39 41 43 45 47 49
Season
Days
to C
ritic
al F
reez
e
Base1 Base2 Base3
Figure B-41. Calgary estimated days to critical FI (baseline series)
020406080
100120140160180
1 3 5 7 9 11 13 15 17 19 21 23 25 27 29 31 33 35 37 39 41 43 45 47 49
Season
Days
to C
ritic
al F
reez
e
CGCM2A2xWG1 CGCM2A2xWG2 CGCM2A2xWG3
Figure B-42. Calgary estimated days to critical FI (CGCM2A2x scenario series)
020
406080
100
120140
1 3 5 7 9 11 13 15 17 19 21 23 25 27 29 31 33 35 37 39 41 43 45 47 49
SeasonDa
ys to
Crit
ical
Fre
eze
HADCM3B21WG1 HADCM3B21WG2 HADCM3B21WG3
Figure B-43. Calgary estimated days to critical FI (HadCM3B21 scenario series)

The Road Well-traveled: Implications of Climate Change for Pavement Infrastructure in Southern Canada 102
0
50
100
150
200
250
1 3 5 7 9 11 13 15 17 19 21 23 25 27 29 31 33 35 37 39 41 43 45 47 49
Season
Days
to C
ritic
al T
haw
Base1 Base2 Base3
Figure B-44. Calgary estimated days to critical TI (baseline series)
020406080
100120140160180
1 3 5 7 9 11 13 15 17 19 21 23 25 27 29 31 33 35 37 39 41 43 45 47 49
Season
Days
to C
ritic
al T
haw
CGCM2A2xWG1 CGCM2A2xWG2 CGCM2A2xWG3
Figure B-45. Calgary estimated days to critical TI (CGCM2A2x scenario series)
0
50
100
150
200
250
1 3 5 7 9 11 13 15 17 19 21 23 25 27 29 31 33 35 37 39 41 43 45 47 49
Season
Day
s to
Cri
tical
Tha
w
HADCM3B21WG1 HADCM3B21WG2 HADCM3B21WG3
Figure B-46. Calgary estimated days to critical TI (HadCM3B21 scenario series)
020406080
100120140160
1 3 5 7 9 11 13 15 17 19 21 23 25 27 29 31 33 35 37 39 41 43 45 47 49
SeasonFr
eeze
Sea
son
Leng
thBase1 Base2 Base3
Figure B-47. Calgary estimated freeze season length (baseline series)
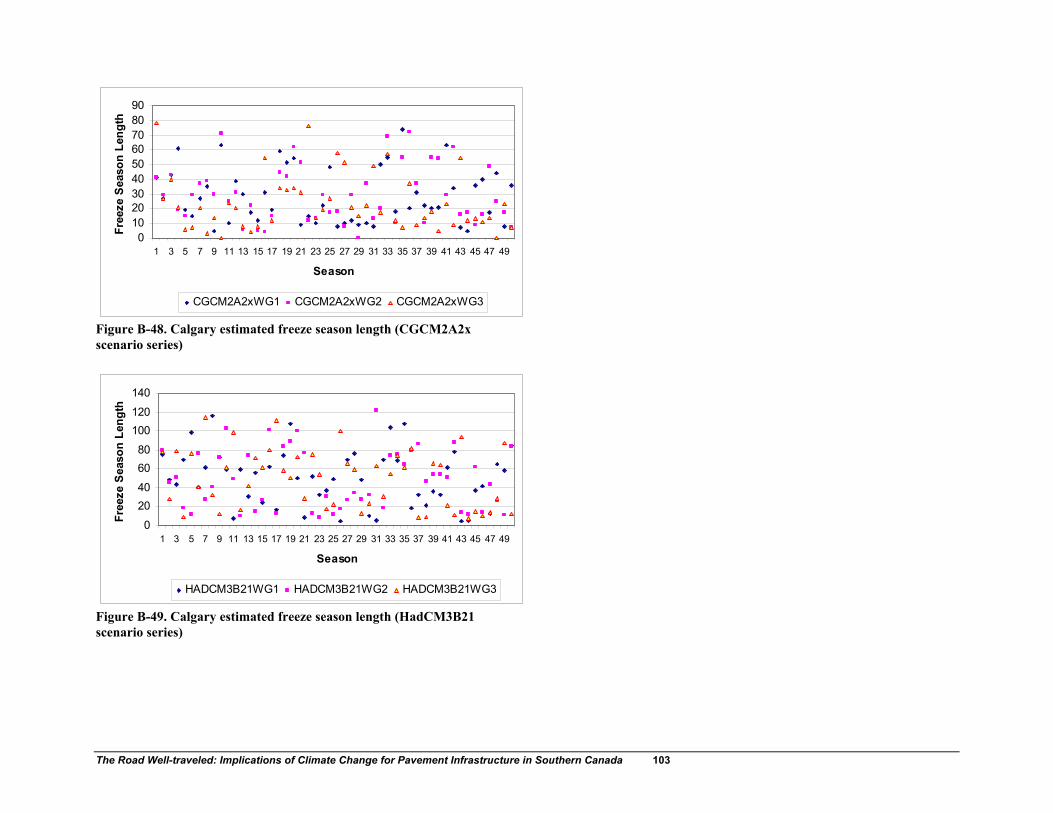
The Road Well-traveled: Implications of Climate Change for Pavement Infrastructure in Southern Canada 103
0102030405060708090
1 3 5 7 9 11 13 15 17 19 21 23 25 27 29 31 33 35 37 39 41 43 45 47 49
Season
Free
ze S
easo
n Le
ngth
CGCM2A2xWG1 CGCM2A2xWG2 CGCM2A2xWG3
Figure B-48. Calgary estimated freeze season length (CGCM2A2x scenario series)
0
2040
6080
100120
140
1 3 5 7 9 11 13 15 17 19 21 23 25 27 29 31 33 35 37 39 41 43 45 47 49
Season
Free
ze S
easo
n Le
ngth
HADCM3B21WG1 HADCM3B21WG2 HADCM3B21WG3
Figure B-49. Calgary estimated freeze season length (HadCM3B21 scenario series)

The Road Well-traveled: Implications of Climate Change for Pavement Infrastructure in Southern Canada 104
CASE STUDY SITE: EDMONTON
City (MSC Observing
Station reference)
Lat Long Elevation (m)
Mean Annual Temperature*
(°C)
Mean Total Precipitation*
(mm)
Edmonton (3012205) 53.5 113.5 723.3
4.1 412.6
*1971-2000 climate normals Table B-18. Edmonton minimum daily air temperature Climate Change Scenario STATISTIC (°C) Baseline* CGCM2A2x* HadCM3B21* Mean -4.0 -0.5 -2.0 Standard Deviation 11.7 11.3 12.2 Minimum -54.8 -48.8 -53.4 Lower Quartile -12.2 -8.7 -10.7 Median -1.8 1.5 -0.1 Upper Quartile 5.8 9.1 8.3 Maximum 21.2 23.1 24.7 *n=54750 Table B-19. Edmonton 7-day mean maximum daily air temperature Climate Change Scenario STATISTIC (°C) Baseline* CGCM2A2x* HadCM3B21* Mean 8.5 11.2 10.8Standard Deviation 12.0 11.9 13.1Minimum -30.2 -25.8 -29.0Lower Quartile -1.3 1.2 -0.1Median 9.8 12.2 11.8Upper Quartile 19.3 22.0 22.9Maximum 32.6 35.7 37.8*n=54750
0
2000
4000
6000
8000
10000
12000
-40 -35 -30 -25 -20 -15 -10 -5 0 5 10 15 20 25 30
Daily Minimum Temperature (°C)
Coun
t (da
ys)
Baseline CGCM2A2x HADCM2B21
Figure B-50. Edmonton minimum daily temperature distribution (n=54750)
0102030405060708090
100
-40 -35 -30 -25 -20 -15 -10 -5 0 5 10 15 20 25 30
Daily Minimum Temperature (°C)
Cum
ulat
ive
Perc
ent
Baseline CGCM2A2x HADCM2B21
Figure B-51. Edmonton minimum daily temperature cumulative percent distribution (n=54750)

The Road Well-traveled: Implications of Climate Change for Pavement Infrastructure in Southern Canada 105
-60
-50
-40
-30
-20
-10
0
10
20
30
Base CGCM2A2x HADCM3B21
Daily
Min
imum
Tem
pera
ture
(°C)
Minimum 25% Quartile Median 75% Quartile Maximum
Figure B-52. Edmonton minimum daily temperature distribution: quartile statistics (n=54750)
0
2000
4000
6000
8000
10000
12000
14000
-35 -30 -25 -20 -15 -10 -5 0 5 10 15 20 25 30 35 40
7-day Mean Maximum Temperature (°C)
Cou
nt (d
ays)
Baseline CGCM2A2x HADCM2B21
Figure B-53. Edmonton 7-day mean maximum daily temperature distribution (n=54750)
0102030405060708090
100
-35 -30 -25 -20 -15 -10 -5 0 5 10 15 20 25 30 35 40
7-day Maximum Temperature (°C)
Cum
ulat
ive
Perc
ent
Baseline CGCM2A2x HADCM2B21
Figure B-54. Edmonton 7-day means maximum daily temperature cumulative percent distribution (n=54750)
-40
-30
-20
-10
0
10
20
30
40
50
Base CGCM2A2x HADCM3B21
7-da
y M
axim
um T
empe
ratu
re (°
C)Minimum 25% Quartile Median 75% Quartile Maximum
Figure B-55. Edmonton 7-day mean maximum daily temperature distribution: quartile statistics (n=54750)
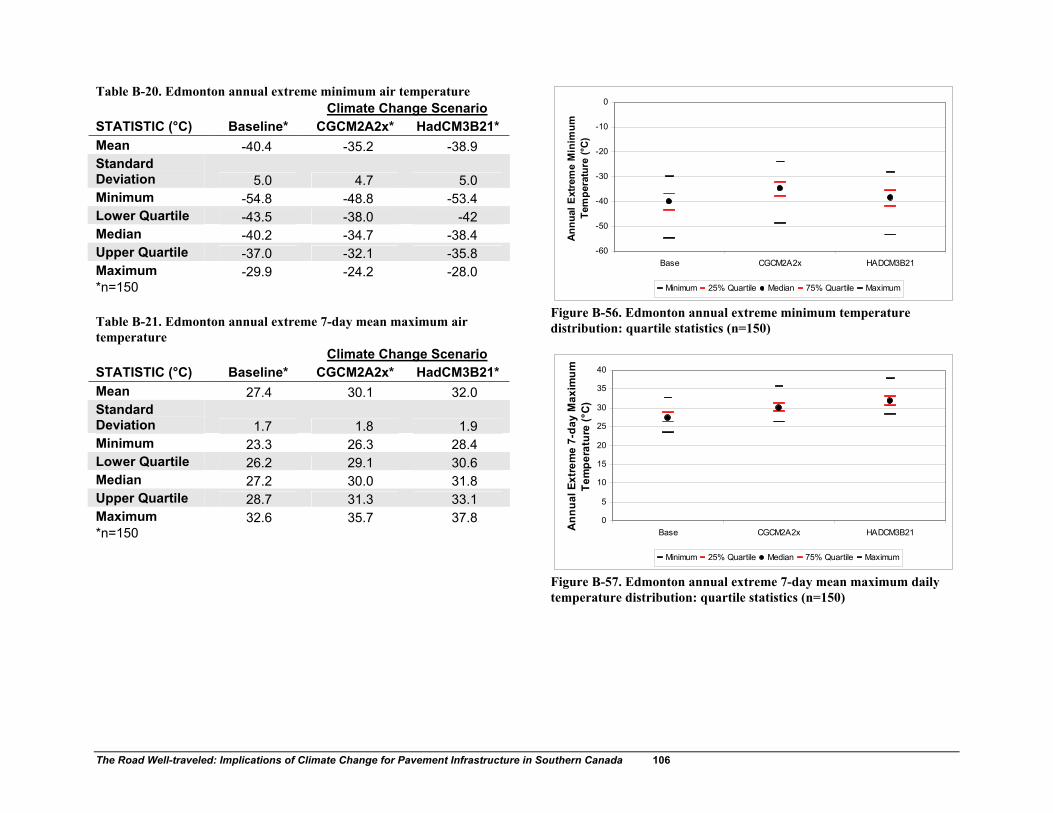
The Road Well-traveled: Implications of Climate Change for Pavement Infrastructure in Southern Canada 106
Table B-20. Edmonton annual extreme minimum air temperature Climate Change Scenario STATISTIC (°C) Baseline* CGCM2A2x* HadCM3B21* Mean -40.4 -35.2 -38.9 Standard Deviation 5.0 4.7 5.0 Minimum -54.8 -48.8 -53.4 Lower Quartile -43.5 -38.0 -42 Median -40.2 -34.7 -38.4 Upper Quartile -37.0 -32.1 -35.8 Maximum -29.9 -24.2 -28.0 *n=150 Table B-21. Edmonton annual extreme 7-day mean maximum air temperature Climate Change Scenario STATISTIC (°C) Baseline* CGCM2A2x* HadCM3B21* Mean 27.4 30.1 32.0 Standard Deviation 1.7 1.8 1.9 Minimum 23.3 26.3 28.4 Lower Quartile 26.2 29.1 30.6 Median 27.2 30.0 31.8 Upper Quartile 28.7 31.3 33.1 Maximum 32.6 35.7 37.8 *n=150
-60
-50
-40
-30
-20
-10
0
Base CGCM2A2x HADCM3B21
Ann
ual E
xtre
me
Min
imum
Te
mpe
ratu
re (°
C)
Minimum 25% Quartile Median 75% Quartile Maximum
Figure B-56. Edmonton annual extreme minimum temperature distribution: quartile statistics (n=150)
0
5
10
15
20
25
30
35
40
Base CGCM2A2x HADCM3B21Ann
ual E
xtre
me
7-da
y M
axim
um
Tem
pera
ture
(°C
)
Minimum 25% Quartile Median 75% Quartile Maximum
Figure B-57. Edmonton annual extreme 7-day mean maximum daily temperature distribution: quartile statistics (n=150)
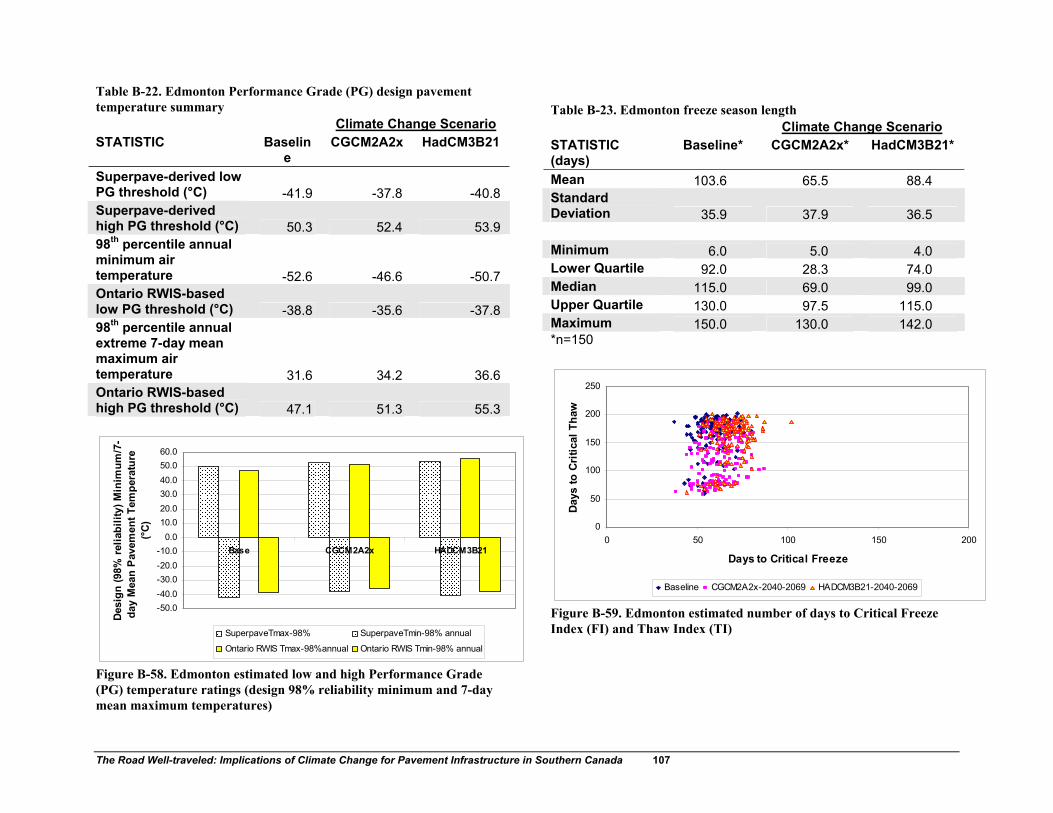
The Road Well-traveled: Implications of Climate Change for Pavement Infrastructure in Southern Canada 107
Table B-22. Edmonton Performance Grade (PG) design pavement temperature summary Climate Change Scenario STATISTIC Baselin
e CGCM2A2x HadCM3B21
Superpave-derived low PG threshold (°C) -41.9 -37.8 -40.8 Superpave-derived high PG threshold (°C) 50.3 52.4 53.9 98th percentile annual minimum air temperature -52.6 -46.6 -50.7 Ontario RWIS-based low PG threshold (°C) -38.8 -35.6 -37.8 98th percentile annual extreme 7-day mean maximum air temperature 31.6 34.2 36.6 Ontario RWIS-based high PG threshold (°C) 47.1 51.3 55.3
-50.0-40.0-30.0-20.0-10.0
0.010.020.030.040.050.060.0
Base CGCM2A2x HADCM3B21
Des
ign
(98%
rel
iabi
lity)
Min
imum
/7-
day
Mea
n P
avem
ent T
empe
ratu
re
(°C)
SuperpaveTmax-98% SuperpaveTmin-98% annual
Ontario RWIS Tmax-98%annual Ontario RWIS Tmin-98% annual
Figure B-58. Edmonton estimated low and high Performance Grade (PG) temperature ratings (design 98% reliability minimum and 7-day mean maximum temperatures)
Table B-23. Edmonton freeze season length Climate Change Scenario STATISTIC (days)
Baseline* CGCM2A2x* HadCM3B21*
Mean 103.6 65.5 88.4 Standard Deviation 35.9 37.9 36.5 Minimum 6.0 5.0 4.0 Lower Quartile 92.0 28.3 74.0 Median 115.0 69.0 99.0 Upper Quartile 130.0 97.5 115.0 Maximum 150.0 130.0 142.0 *n=150
0
50
100
150
200
250
0 50 100 150 200
Days to Critical FreezeDa
ys to
Crit
ical
Tha
wBaseline CGCM2A2x-2040-2069 HADCM3B21-2040-2069
Figure B-59. Edmonton estimated number of days to Critical Freeze Index (FI) and Thaw Index (TI)

The Road Well-traveled: Implications of Climate Change for Pavement Infrastructure in Southern Canada 108
0.0
20.0
40.0
60.0
80.0
100.0
120.0
140.0
160.0
Base CGCM2A2x HADCM3B21
Free
ze S
easo
n Le
ngth
(day
s)
Minimum 25% Quartile Median 75% Quartile Maximum
Figure B-60. Edmonton estimated freeze season length distribution: quartile statistics (n=150)
0102030405060708090
1 3 5 7 9 11 13 15 17 19 21 23 25 27 29 31 33 35 37 39 41 43 45 47 49
Season
Days
to C
ritic
al F
reez
e
Base1 Base2 Base3
Figure B-61. Edmonton estimated days to critical FI (baseline series)
0
20
40
60
80
100
1 3 5 7 9 11 13 15 17 19 21 23 25 27 29 31 33 35 37 39 41 43 45 47 49
Season
Days
to C
ritic
al F
reez
e
CGCM2A2xWG1 CGCM2A2xWG2 CGCM2A2xWG3
Figure B-62. Edmonton estimated days to critical FI (CGCM2A2x scenario series)
0
20
40
60
80
100
120
1 3 5 7 9 11 13 15 17 19 21 23 25 27 29 31 33 35 37 39 41 43 45 47 49
SeasonDa
ys to
Crit
ical
Fre
eze
HADCM3B21WG1 HADCM3B21WG2 HADCM3B21WG3
Figure B-63. Edmonton estimated days to critical FI (HadCM3B21 scenario series)
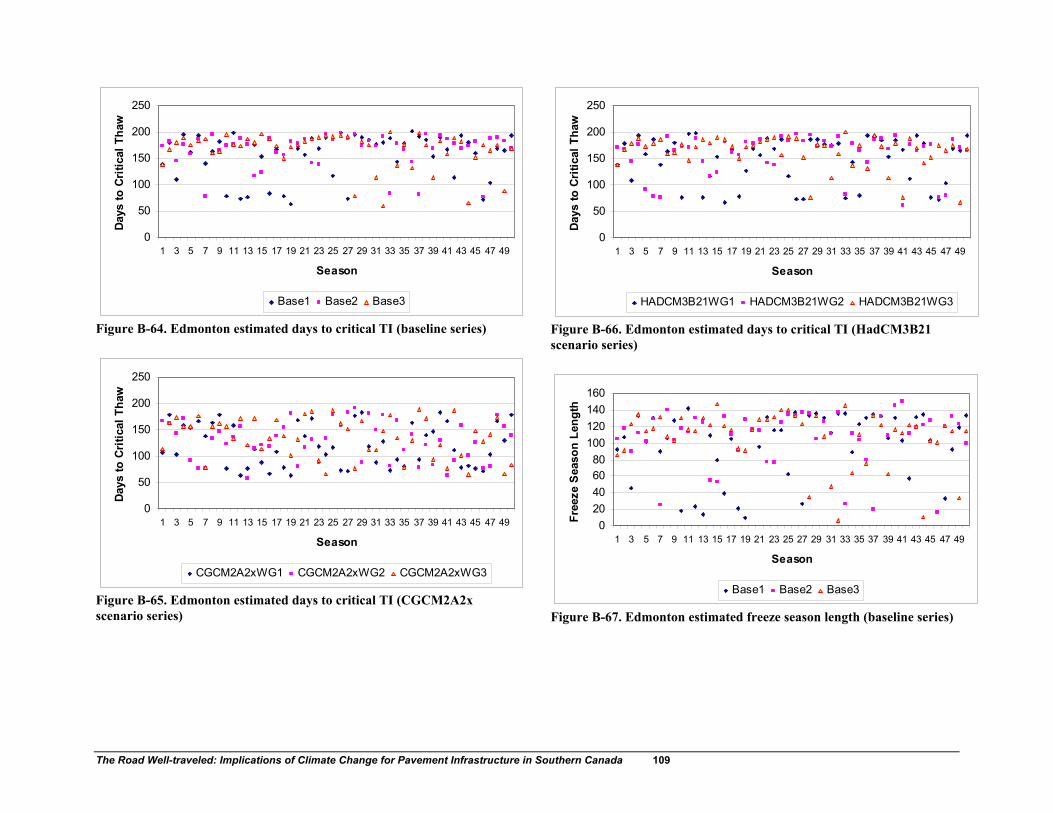
The Road Well-traveled: Implications of Climate Change for Pavement Infrastructure in Southern Canada 109
0
50
100
150
200
250
1 3 5 7 9 11 13 15 17 19 21 23 25 27 29 31 33 35 37 39 41 43 45 47 49
Season
Days
to C
ritic
al T
haw
Base1 Base2 Base3
Figure B-64. Edmonton estimated days to critical TI (baseline series)
0
50
100
150
200
250
1 3 5 7 9 11 13 15 17 19 21 23 25 27 29 31 33 35 37 39 41 43 45 47 49
Season
Days
to C
ritic
al T
haw
CGCM2A2xWG1 CGCM2A2xWG2 CGCM2A2xWG3
Figure B-65. Edmonton estimated days to critical TI (CGCM2A2x scenario series)
0
50
100
150
200
250
1 3 5 7 9 11 13 15 17 19 21 23 25 27 29 31 33 35 37 39 41 43 45 47 49
Season
Day
s to
Cri
tical
Tha
w
HADCM3B21WG1 HADCM3B21WG2 HADCM3B21WG3
Figure B-66. Edmonton estimated days to critical TI (HadCM3B21 scenario series)
020406080
100120140160
1 3 5 7 9 11 13 15 17 19 21 23 25 27 29 31 33 35 37 39 41 43 45 47 49
SeasonFr
eeze
Sea
son
Leng
thBase1 Base2 Base3
Figure B-67. Edmonton estimated freeze season length (baseline series)
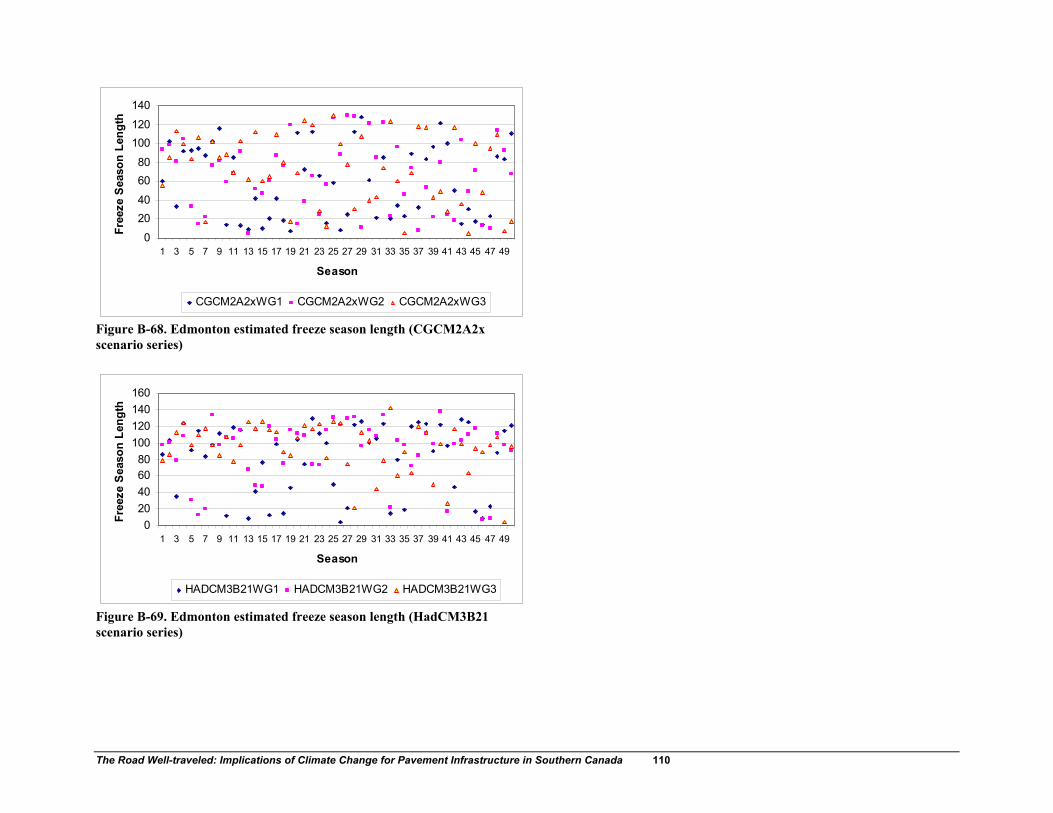
The Road Well-traveled: Implications of Climate Change for Pavement Infrastructure in Southern Canada 110
0
2040
6080
100120
140
1 3 5 7 9 11 13 15 17 19 21 23 25 27 29 31 33 35 37 39 41 43 45 47 49
Season
Free
ze S
easo
n Le
ngth
CGCM2A2xWG1 CGCM2A2xWG2 CGCM2A2xWG3
Figure B-68. Edmonton estimated freeze season length (CGCM2A2x scenario series)
020406080
100120140160
1 3 5 7 9 11 13 15 17 19 21 23 25 27 29 31 33 35 37 39 41 43 45 47 49
Season
Free
ze S
easo
n Le
ngth
HADCM3B21WG1 HADCM3B21WG2 HADCM3B21WG3
Figure B-69. Edmonton estimated freeze season length (HadCM3B21 scenario series)
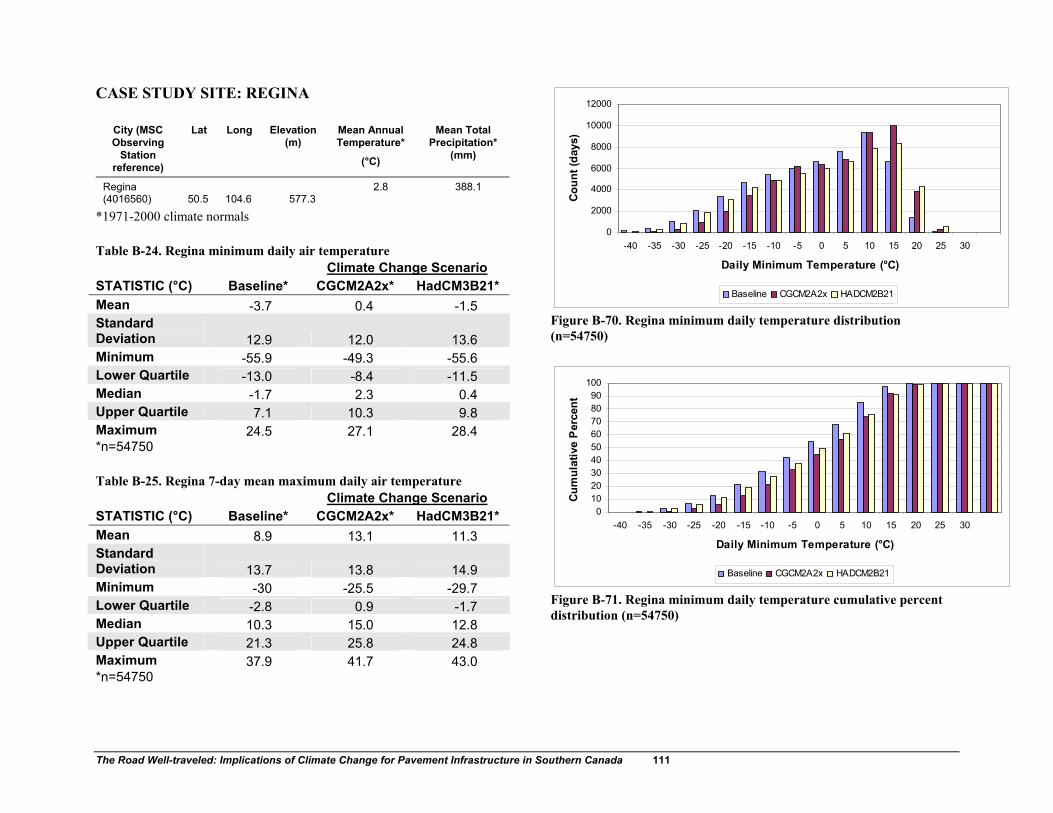
The Road Well-traveled: Implications of Climate Change for Pavement Infrastructure in Southern Canada 111
CASE STUDY SITE: REGINA
City (MSC Observing
Station reference)
Lat Long Elevation (m)
Mean Annual Temperature*
(°C)
Mean Total Precipitation*
(mm)
Regina (4016560) 50.5 104.6 577.3
2.8 388.1
*1971-2000 climate normals Table B-24. Regina minimum daily air temperature Climate Change Scenario STATISTIC (°C) Baseline* CGCM2A2x* HadCM3B21* Mean -3.7 0.4 -1.5 Standard Deviation 12.9 12.0 13.6 Minimum -55.9 -49.3 -55.6 Lower Quartile -13.0 -8.4 -11.5 Median -1.7 2.3 0.4 Upper Quartile 7.1 10.3 9.8 Maximum 24.5 27.1 28.4 *n=54750 Table B-25. Regina 7-day mean maximum daily air temperature Climate Change Scenario STATISTIC (°C) Baseline* CGCM2A2x* HadCM3B21* Mean 8.9 13.1 11.3 Standard Deviation 13.7 13.8 14.9 Minimum -30 -25.5 -29.7 Lower Quartile -2.8 0.9 -1.7 Median 10.3 15.0 12.8 Upper Quartile 21.3 25.8 24.8 Maximum 37.9 41.7 43.0 *n=54750
0
2000
4000
6000
8000
10000
12000
-40 -35 -30 -25 -20 -15 -10 -5 0 5 10 15 20 25 30
Daily Minimum Temperature (°C)
Cou
nt (d
ays)
Baseline CGCM2A2x HADCM2B21
Figure B-70. Regina minimum daily temperature distribution (n=54750)
0102030405060708090
100
-40 -35 -30 -25 -20 -15 -10 -5 0 5 10 15 20 25 30
Daily Minimum Temperature (°C)
Cum
ulat
ive
Per
cent
Baseline CGCM2A2x HADCM2B21
Figure B-71. Regina minimum daily temperature cumulative percent distribution (n=54750)

The Road Well-traveled: Implications of Climate Change for Pavement Infrastructure in Southern Canada 112
-60
-50
-40
-30
-20
-10
0
10
20
30
40
Base CGCM2A2x HADCM3B21
Daily
Min
imum
Tem
pera
ture
(°C)
Minimum 25% Quartile Median 75% Quartile Maximum
Figure B-72. Regina minimum daily temperature distribution: quartile statistics (n=54750)
0
2000
4000
6000
8000
10000
12000
-35 -30 -25 -20 -15 -10 -5 0 5 10 15 20 25 30 35 40
7-day Mean Maximum Temperature (°C)
Cou
nt (d
ays)
Baseline CGCM2A2x HADCM2B21
Figure B-73. Regina 7-day mean maximum daily temperature distribution (n=54750)
0102030405060708090
100
-35 -30 -25 -20 -15 -10 -5 0 5 10 15 20 25 30 35 40
7-day Maximum Temperature (°C)
Cum
ulat
ive
Perc
ent
Baseline CGCM2A2x HADCM2B21
Figure B-74. Regina 7-day means maximum daily temperature cumulative percent distribution (n=54750)
-40
-30
-20
-10
0
10
20
30
40
50
Base CGCM2A2x HADCM3B21
7-da
y M
axim
um T
empe
ratu
re (°
C)Minimum 25% Quartile Median 75% Quartile Maximum
Figure B-75. Regina 7-day mean maximum daily temperature distribution: quartile statistics (n=54750)

The Road Well-traveled: Implications of Climate Change for Pavement Infrastructure in Southern Canada 113
Table B-26. Regina annual extreme minimum air temperature Climate Change Scenario STATISTIC (°C) Baseline* CGCM2A2x* HadCM3B21* Mean -40.3 -34.7 -39.5 Standard Deviation 4.5 4.4 4.5 Minimum -55.9 -49.3 -55.6 Lower Quartile -42.4 -37.2 -42.2 Median -40.0 -34.3 -39.3 Upper Quartile -37.4 -31.8 -36.5 Maximum -27.7 -24.3 -27.6 *n=150 Table B-27. Regina annual extreme 7-day mean maximum air temperature Climate Change Scenario STATISTIC (°C) Baseline* CGCM2A2x* HadCM3B21* Mean 31.2 35.1 35.7 Standard Deviation 2.0 2.0 2.3 Minimum 26.8 31.2 30.9 Lower Quartile 29.5 33.6 34.1 Median 30.9 34.8 35.5 Upper Quartile 32.6 36.2 37.1 Maximum 37.9 41.7 43.0 *n=150
-60
-50
-40
-30
-20
-10
0
Base CGCM2A2x HADCM3B21
Ann
ual E
xtre
me
Min
imum
Te
mpe
ratu
re (°
C)
Minimum 25% Quartile Median 75% Quartile Maximum
Figure B-76. Regina annual extreme minimum temperature distribution: quartile statistics (n=150)
0
5
10
15
20
25
30
35
40
45
50
Base CGCM2A2x HADCM3B21Ann
ual E
xtre
me
7-da
y M
axim
um
Tem
pera
ture
(°C
)
Minimum 25% Quartile Median 75% Quartile Maximum
Figure B-77. Regina annual extreme 7-day mean maximum daily temperature distribution: quartile statistics (n=150)
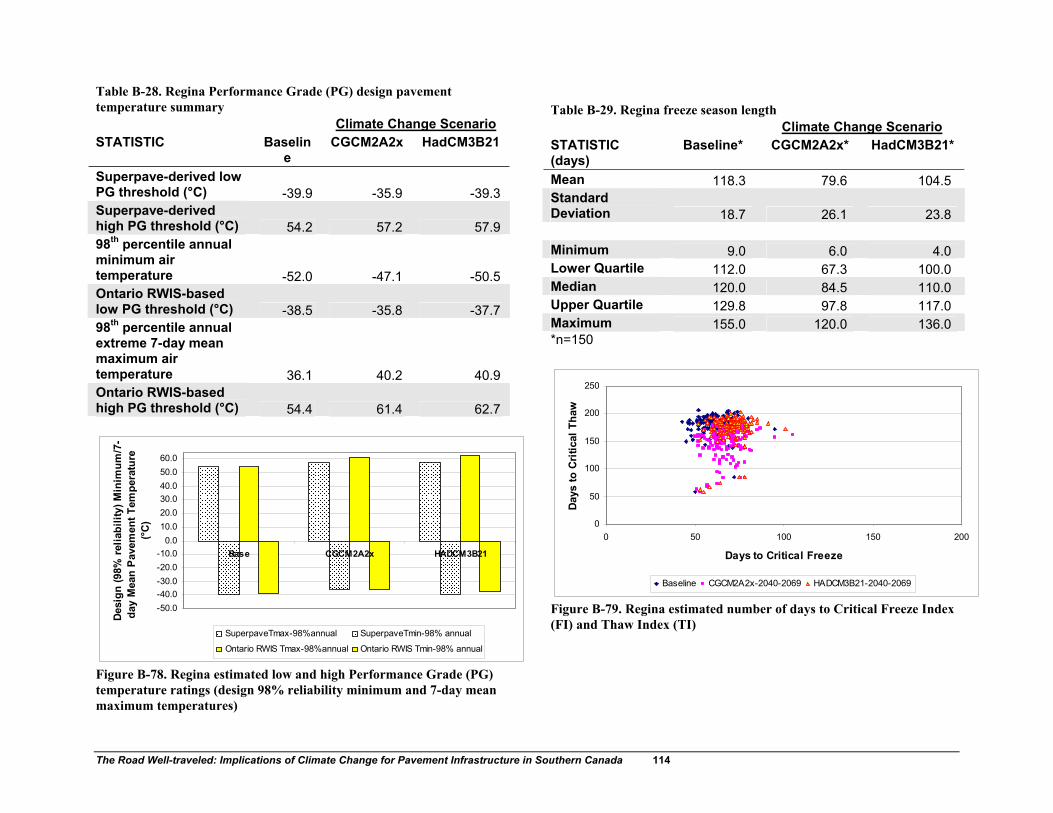
The Road Well-traveled: Implications of Climate Change for Pavement Infrastructure in Southern Canada 114
Table B-28. Regina Performance Grade (PG) design pavement temperature summary Climate Change Scenario STATISTIC Baselin
e CGCM2A2x HadCM3B21
Superpave-derived low PG threshold (°C) -39.9 -35.9 -39.3 Superpave-derived high PG threshold (°C) 54.2 57.2 57.9 98th percentile annual minimum air temperature -52.0 -47.1 -50.5 Ontario RWIS-based low PG threshold (°C) -38.5 -35.8 -37.7 98th percentile annual extreme 7-day mean maximum air temperature 36.1 40.2 40.9 Ontario RWIS-based high PG threshold (°C) 54.4 61.4 62.7
-50.0-40.0-30.0-20.0-10.0
0.010.020.030.040.050.060.0
Base CGCM2A2x HADCM3B21
Desi
gn (9
8% re
liabi
lity)
Min
imum
/7-
day
Mea
n P
avem
ent T
empe
ratu
re
(°C)
SuperpaveTmax-98%annual SuperpaveTmin-98% annual
Ontario RWIS Tmax-98%annual Ontario RWIS Tmin-98% annual
Figure B-78. Regina estimated low and high Performance Grade (PG) temperature ratings (design 98% reliability minimum and 7-day mean maximum temperatures)
Table B-29. Regina freeze season length Climate Change Scenario STATISTIC (days)
Baseline* CGCM2A2x* HadCM3B21*
Mean 118.3 79.6 104.5 Standard Deviation 18.7 26.1 23.8 Minimum 9.0 6.0 4.0 Lower Quartile 112.0 67.3 100.0 Median 120.0 84.5 110.0 Upper Quartile 129.8 97.8 117.0 Maximum 155.0 120.0 136.0 *n=150
0
50
100
150
200
250
0 50 100 150 200
Days to Critical FreezeDa
ys to
Cri
tical
Tha
wBaseline CGCM2A2x-2040-2069 HADCM3B21-2040-2069
Figure B-79. Regina estimated number of days to Critical Freeze Index (FI) and Thaw Index (TI)

The Road Well-traveled: Implications of Climate Change for Pavement Infrastructure in Southern Canada 115
0.0
20.0
40.0
60.0
80.0
100.0
120.0
140.0
160.0
180.0
Base CGCM2A2x HADCM3B21
Free
ze S
easo
n Le
ngth
(day
s)
Minimum 25% Quartile Median 75% Quartile Maximum
Figure B-80. Regina estimated freeze season length distribution: quartile statistics (n=150)
0
20
40
60
80
100
1 3 5 7 9 11 13 15 17 19 21 23 25 27 29 31 33 35 37 39 41 43 45 47 49
Season
Days
to C
ritic
al F
reez
e
Base1 Base2 Base3
Figure B-81. Regina estimated days to critical FI (baseline series)
0
20
40
60
80
100
120
1 3 5 7 9 11 13 15 17 19 21 23 25 27 29 31 33 35 37 39 41 43 45 47 49
Season
Days
to C
ritic
al F
reez
e
CGCM2A2xWG1 CGCM2A2xWG2 CGCM2A2xWG3
Figure B-82. Regina estimated days to critical FI (CGCM2A2x scenario series)
0
20
40
60
80
100
120
1 3 5 7 9 11 13 15 17 19 21 23 25 27 29 31 33 35 37 39 41 43 45 47 49
SeasonDa
ys to
Crit
ical
Fre
eze
HADCM3B21WG1 HADCM3B21WG2 HADCM3B21WG3
Figure B-83. Regina estimated days to critical FI (HadCM3B21 scenario series)

The Road Well-traveled: Implications of Climate Change for Pavement Infrastructure in Southern Canada 116
0
50
100
150
200
250
1 3 5 7 9 11 13 15 17 19 21 23 25 27 29 31 33 35 37 39 41 43 45 47 49
Season
Days
to C
ritic
al T
haw
Base1 Base2 Base3
Figure B-84. Regina estimated days to critical TI (baseline series)
0
50
100
150
200
1 3 5 7 9 11 13 15 17 19 21 23 25 27 29 31 33 35 37 39 41 43 45 47 49
Season
Days
to C
ritic
al T
haw
CGCM2A2xWG1 CGCM2A2xWG2 CGCM2A2xWG3
Figure B-85. Regina estimated days to critical TI (CGCM2A2x scenario series)
0
50
100
150
200
250
1 3 5 7 9 11 13 15 17 19 21 23 25 27 29 31 33 35 37 39 41 43 45 47 49
Season
Days
to C
ritic
al T
haw
HADCM3B21WG1 HADCM3B21WG2 HADCM3B21WG3
Figure B-86. Regina estimated days to critical TI (HadCM3B21 scenario series)
020406080
100120140160180
1 3 5 7 9 11 13 15 17 19 21 23 25 27 29 31 33 35 37 39 41 43 45 47 49
SeasonFr
eeze
Sea
son
Leng
thBase1 Base2 Base3
Figure B-87. Regina estimated freeze season length (baseline series)

The Road Well-traveled: Implications of Climate Change for Pavement Infrastructure in Southern Canada 117
0
2040
6080
100120
140
1 3 5 7 9 11 13 15 17 19 21 23 25 27 29 31 33 35 37 39 41 43 45 47 49
Season
Free
ze S
easo
n Le
ngth
CGCM2A2xWG1 CGCM2A2xWG2 CGCM2A2xWG3
Figure B-88. Regina estimated freeze season length (CGCM2A2x scenario series)
020406080
100120140160
1 3 5 7 9 11 13 15 17 19 21 23 25 27 29 31 33 35 37 39 41 43 45 47 49
Season
Free
ze S
easo
n Le
ngth
HADCM3B21WG1 HADCM3B21WG2 HADCM3B21WG3
Figure B-89. Regina estimated freeze season length (HadCM3B21 scenario series)

The Road Well-traveled: Implications of Climate Change for Pavement Infrastructure in Southern Canada 118
CASE STUDY SITE: WINNIPEG
City (MSC Observing
Station reference)
Lat Long Elevation (m)
Mean Annual Temperature*
(°C)
Mean Total Precipitation*
(mm)
Winnipeg (5023222) 50.0 97.2 238.7
2.6 513.7
*1971-2000 climate normals Table B-30. Winnipeg minimum daily air temperature Climate Change Scenario STATISTIC (°C) Baseline* CGCM2A2x* HadCM3B21* Mean -3.2 0.4 -1.2 Standard Deviation 13.8 13.4 14.4 Minimum -52.5 -47.5 -52.2 Lower Quartile -13.7 -10 -12.2 Median -1.0 2.5 1.1 Upper Quartile 8.4 11.9 11.0 Maximum 27.7 30.1 30.7 *n=54750 Table B-31. Winnipeg 7-day mean maximum daily air temperature Climate Change Scenario STATISTIC (°C) Baseline* CGCM2A2x* HadCM3B21* Mean 8.1 12.0 10.3 Standard Deviation 14.2 14.4 15.3 Minimum -30.9 -25.9 -30.7 Lower Quartile -4.4 -1.1 -3.4 Median 9.7 13.6 12.1 Upper Quartile 21.3 25.7 24.7 Maximum 36.5 41.2 40.4 *n=54750
0100020003000400050006000700080009000
10000
-40 -35 -30 -25 -20 -15 -10 -5 0 5 10 15 20 25 30
Daily Minimum Temperature (°C)
Coun
t (da
ys)
Baseline CGCM2A2x HADCM2B21
Figure B-80. Winnipeg minimum daily temperature distribution (n=54750)
0102030405060708090
100
-40 -35 -30 -25 -20 -15 -10 -5 0 5 10 15 20 25 30
Daily Minimum Temperature (°C)
Cum
ulat
ive
Per
cent
Baseline CGCM2A2x HADCM2B21
Figure B-81. Winnipeg minimum daily temperature cumulative percent distribution (n=54750)

The Road Well-traveled: Implications of Climate Change for Pavement Infrastructure in Southern Canada 119
-60
-50
-40
-30
-20
-10
0
10
20
30
40
Base CGCM2A2x HADCM3B21
Daily
Min
imum
Tem
pera
ture
(°C)
Minimum 25% Quartile Median 75% Quartile Maximum
Figure B-82. Winnipeg minimum daily temperature distribution: quartile statistics (n=54750)
0
2000
4000
6000
8000
10000
12000
-35 -30 -25 -20 -15 -10 -5 0 5 10 15 20 25 30 35 40
7-day Mean Maximum Temperature (°C)
Cou
nt (d
ays)
Baseline CGCM2A2x HADCM2B21
Figure B-83. Winnipeg 7-day mean maximum daily temperature distribution (n=54750)
0102030405060708090
100
-35 -30 -25 -20 -15 -10 -5 0 5 10 15 20 25 30 35 40
7-day Maximum Temperature Range (°C)
Cum
ulat
ive
Perc
ent
Baseline CGCM2A2x HADCM2B21
Figure B-84. Winnipeg 7-day means maximum daily temperature cumulative percent distribution (n=54750)
-40
-30
-20
-10
0
10
20
30
40
50
Base CGCM2A2x HADCM3B21
7-da
y M
axim
um T
empe
ratu
re (°
C)
Minimum 25% Quartile Median 75% Quartile Maximum
Figure B-85. Winnipeg 7-day mean maximum daily temperature distribution: quartile statistics (n=54750)
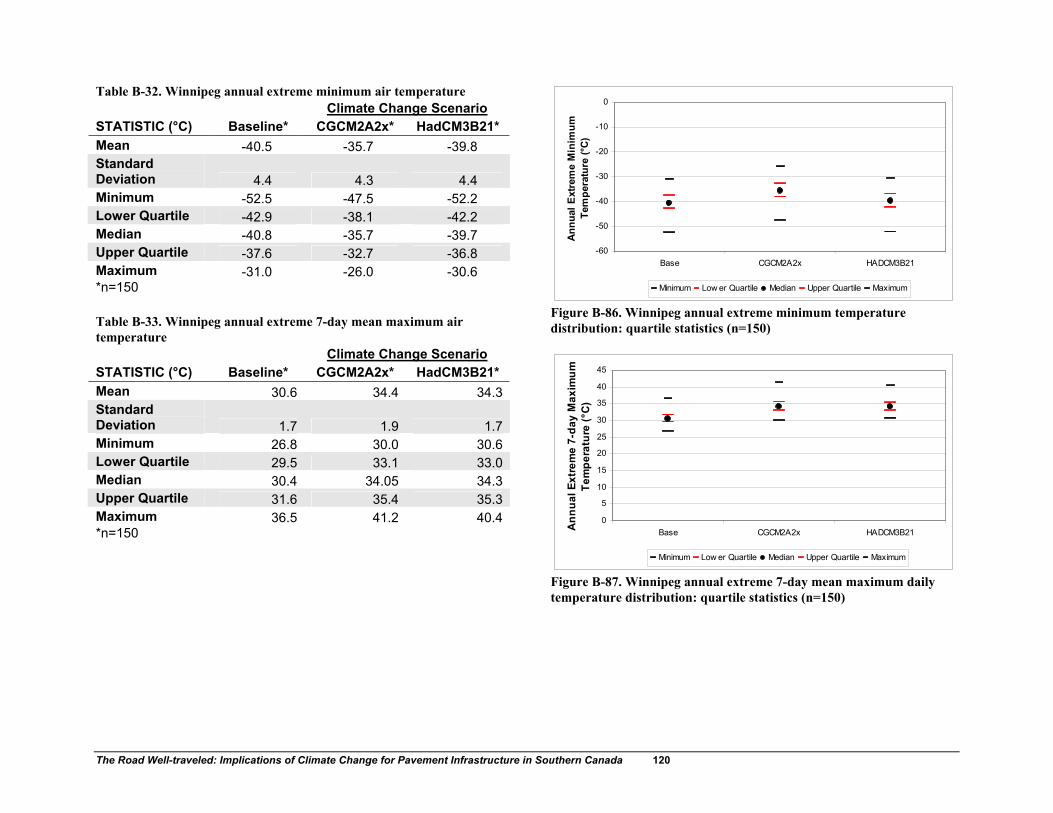
The Road Well-traveled: Implications of Climate Change for Pavement Infrastructure in Southern Canada 120
Table B-32. Winnipeg annual extreme minimum air temperature Climate Change Scenario STATISTIC (°C) Baseline* CGCM2A2x* HadCM3B21* Mean -40.5 -35.7 -39.8 Standard Deviation 4.4 4.3 4.4 Minimum -52.5 -47.5 -52.2 Lower Quartile -42.9 -38.1 -42.2 Median -40.8 -35.7 -39.7 Upper Quartile -37.6 -32.7 -36.8 Maximum -31.0 -26.0 -30.6 *n=150 Table B-33. Winnipeg annual extreme 7-day mean maximum air temperature Climate Change Scenario STATISTIC (°C) Baseline* CGCM2A2x* HadCM3B21* Mean 30.6 34.4 34.3Standard Deviation 1.7 1.9 1.7Minimum 26.8 30.0 30.6Lower Quartile 29.5 33.1 33.0Median 30.4 34.05 34.3Upper Quartile 31.6 35.4 35.3Maximum 36.5 41.2 40.4*n=150
-60
-50
-40
-30
-20
-10
0
Base CGCM2A2x HADCM3B21
Ann
ual E
xtre
me
Min
imum
Te
mpe
ratu
re (°
C)
Minimum Low er Quartile Median Upper Quartile Maximum
Figure B-86. Winnipeg annual extreme minimum temperature distribution: quartile statistics (n=150)
0
5
10
15
20
25
30
35
40
45
Base CGCM2A2x HADCM3B21Ann
ual E
xtre
me
7-da
y M
axim
um
Tem
pera
ture
(°C
)
Minimum Low er Quartile Median Upper Quartile Maximum
Figure B-87. Winnipeg annual extreme 7-day mean maximum daily temperature distribution: quartile statistics (n=150)

The Road Well-traveled: Implications of Climate Change for Pavement Infrastructure in Southern Canada 121
Table B-34. Winnipeg Performance Grade (PG) design pavement temperature summary Climate Change Scenario STATISTIC Baselin
e CGCM2A2x HadCM3B21
Superpave-derived low PG threshold (°C) -39.7 -36.2 -39.2 Superpave-derived high PG threshold (°C) 53.6 56.7 56.5 98th percentile annual minimum air temperature -49.5 -45.0 -49.0 Ontario RWIS-based low PG threshold (°C) -37.2 -34.6 -36.9 98th percentile annual extreme 7-day mean maximum air temperature 34.6 38.5 38.0 Ontario RWIS-based high PG threshold (°C) 51.9 58.5 57.6
-50.0-40.0-30.0-20.0-10.0
0.010.020.030.040.050.060.0
Base CGCM2A2x HADCM3B21
Desi
gn (9
8% re
liabi
lity)
Min
imum
/7-
day
Mea
n Pa
vem
ent T
empe
ratu
re
(°C)
SuperpaveTmax-98%annual SuperpaveTmin-98% annual
Ontario RWIS Tmax-98%annual Ontario RWIS Tmin-98% annual
Figure B-88. Winnipeg estimated low and high Performance Grade (PG) temperature ratings (design 98% reliability minimum and 7-day mean maximum temperatures)
Table B-35. Winnipeg freeze season length Climate Change Scenario STATISTIC (days)
Baseline* CGCM2A2x* HadCM3B21*
Mean 121.9 101.1 112.1 Standard Deviation 18.5 21.5 14.4 Minimum 4.0 15.0 18.0 Lower Quartile 116.0 95.3 104.0 Median 124.0 105.5 113.0 Upper Quartile 132.0 114.8 121.0 Maximum 148.0 131.0 145.0 *n=150
0
50
100
150
200
250
0 50 100 150 200
Days to Critical Freeze
Days
to C
ritic
al T
haw
Baseline CGCM2A2x-2040-2069 HADCM3B21-2040-2069
Figure B-89. Winnipeg estimated number of days to Critical Freeze Index (FI) and Thaw Index (TI)

The Road Well-traveled: Implications of Climate Change for Pavement Infrastructure in Southern Canada 122
0.0
20.0
40.0
60.0
80.0
100.0
120.0
140.0
160.0
Base CGCM2A2x HADCM3B21
Free
ze S
easo
n Le
ngth
(day
s)
Minimum 25% Quartile Median 75% Quartile Maximum
Figure B-90. Winnipeg estimated freeze season length distribution: quartile statistics (n=150)
0102030405060708090
1 3 5 7 9 11 13 15 17 19 21 23 25 27 29 31 33 35 37 39 41 43 45 47 49
Season
Days
to C
ritic
al F
reez
e
Base1 Base2 Base3
Figure B-91. Winnipeg estimated days to critical FI (baseline series)
0102030405060708090
1 3 5 7 9 11 13 15 17 19 21 23 25 27 29 31 33 35 37 39 41 43 45 47 49
Season
Days
to C
ritic
al F
reez
e
CGCM2A2xWG1 CGCM2A2xWG2 CGCM2A2xWG3
Figure B-92. Winnipeg estimated days to critical FI (CGCM2A2x scenario series)
0102030405060708090
1 3 5 7 9 11 13 15 17 19 21 23 25 27 29 31 33 35 37 39 41 43 45 47 49
SeasonDa
ys to
Cri
tical
Fre
eze
HADCM3B21WG1 HADCM3B21WG2 HADCM3B21WG3
Figure B-93. Winnipeg estimated days to critical FI (HadCM3B21 scenario series)
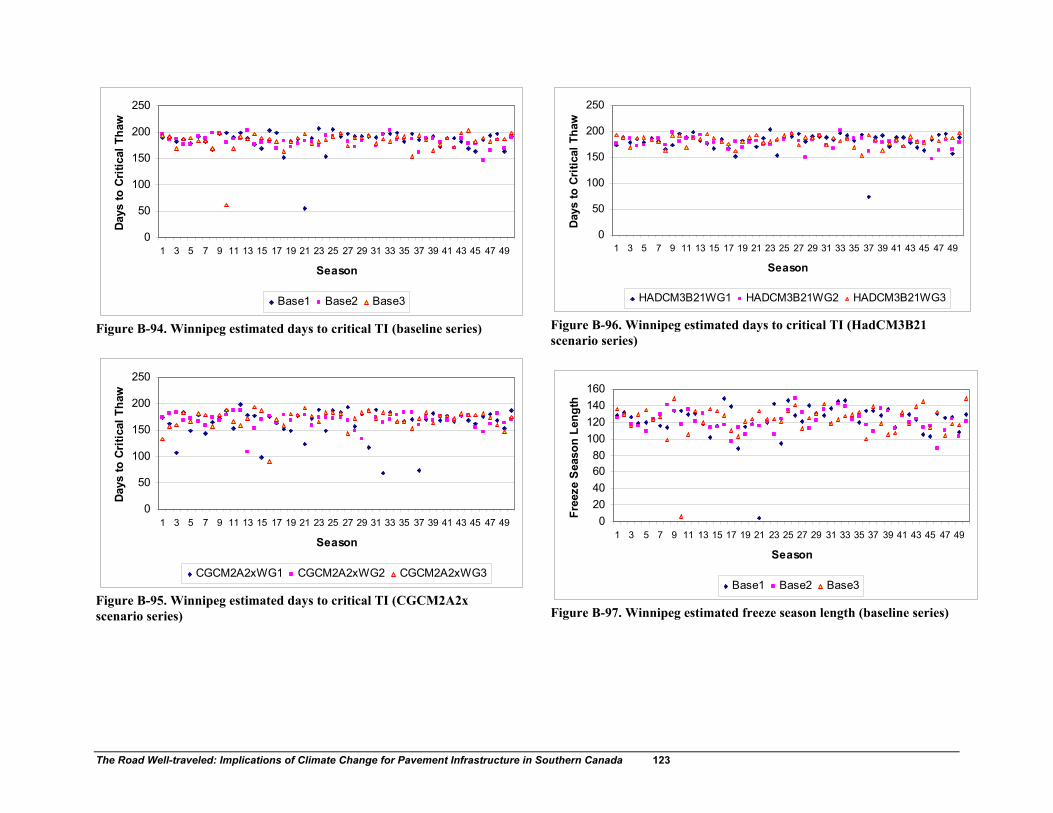
The Road Well-traveled: Implications of Climate Change for Pavement Infrastructure in Southern Canada 123
0
50
100
150
200
250
1 3 5 7 9 11 13 15 17 19 21 23 25 27 29 31 33 35 37 39 41 43 45 47 49
Season
Days
to C
ritic
al T
haw
Base1 Base2 Base3
Figure B-94. Winnipeg estimated days to critical TI (baseline series)
0
50
100
150
200
250
1 3 5 7 9 11 13 15 17 19 21 23 25 27 29 31 33 35 37 39 41 43 45 47 49
Season
Days
to C
ritic
al T
haw
CGCM2A2xWG1 CGCM2A2xWG2 CGCM2A2xWG3
Figure B-95. Winnipeg estimated days to critical TI (CGCM2A2x scenario series)
0
50
100
150
200
250
1 3 5 7 9 11 13 15 17 19 21 23 25 27 29 31 33 35 37 39 41 43 45 47 49
Season
Day
s to
Cri
tical
Tha
w
HADCM3B21WG1 HADCM3B21WG2 HADCM3B21WG3
Figure B-96. Winnipeg estimated days to critical TI (HadCM3B21 scenario series)
020406080
100120140160
1 3 5 7 9 11 13 15 17 19 21 23 25 27 29 31 33 35 37 39 41 43 45 47 49
SeasonFr
eeze
Sea
son
Leng
thBase1 Base2 Base3
Figure B-97. Winnipeg estimated freeze season length (baseline series)

The Road Well-traveled: Implications of Climate Change for Pavement Infrastructure in Southern Canada 124
0
2040
6080
100120
140
1 3 5 7 9 11 13 15 17 19 21 23 25 27 29 31 33 35 37 39 41 43 45 47 49
Season
Free
ze S
easo
n Le
ngth
CGCM2A2xWG1 CGCM2A2xWG2 CGCM2A2xWG3
Figure B-98. Winnipeg estimated freeze season length (CGCM2A2x scenario series)
020406080
100120140160
1 3 5 7 9 11 13 15 17 19 21 23 25 27 29 31 33 35 37 39 41 43 45 47 49
Season
Free
ze S
easo
n Le
ngth
HADCM3B21WG1 HADCM3B21WG2 HADCM3B21WG3
Figure B-99. Winnipeg estimated freeze season length (HadCM3B21 scenario series)
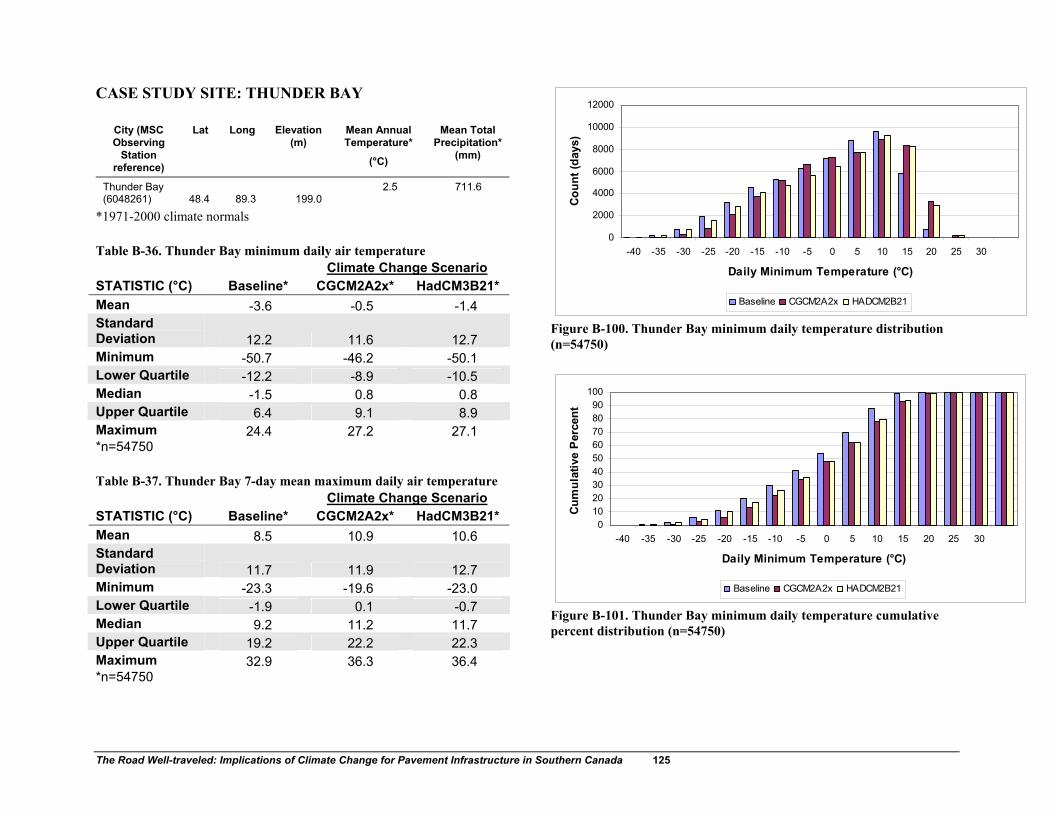
The Road Well-traveled: Implications of Climate Change for Pavement Infrastructure in Southern Canada 125
CASE STUDY SITE: THUNDER BAY
City (MSC Observing
Station reference)
Lat Long Elevation (m)
Mean Annual Temperature*
(°C)
Mean Total Precipitation*
(mm)
Thunder Bay (6048261) 48.4 89.3 199.0
2.5 711.6
*1971-2000 climate normals Table B-36. Thunder Bay minimum daily air temperature Climate Change Scenario STATISTIC (°C) Baseline* CGCM2A2x* HadCM3B21* Mean -3.6 -0.5 -1.4 Standard Deviation 12.2 11.6 12.7 Minimum -50.7 -46.2 -50.1 Lower Quartile -12.2 -8.9 -10.5 Median -1.5 0.8 0.8 Upper Quartile 6.4 9.1 8.9 Maximum 24.4 27.2 27.1 *n=54750 Table B-37. Thunder Bay 7-day mean maximum daily air temperature Climate Change Scenario STATISTIC (°C) Baseline* CGCM2A2x* HadCM3B21* Mean 8.5 10.9 10.6 Standard Deviation 11.7 11.9 12.7 Minimum -23.3 -19.6 -23.0 Lower Quartile -1.9 0.1 -0.7 Median 9.2 11.2 11.7 Upper Quartile 19.2 22.2 22.3 Maximum 32.9 36.3 36.4 *n=54750
0
2000
4000
6000
8000
10000
12000
-40 -35 -30 -25 -20 -15 -10 -5 0 5 10 15 20 25 30
Daily Minimum Temperature (°C)
Coun
t (da
ys)
Baseline CGCM2A2x HADCM2B21
Figure B-100. Thunder Bay minimum daily temperature distribution (n=54750)
0102030405060708090
100
-40 -35 -30 -25 -20 -15 -10 -5 0 5 10 15 20 25 30
Daily Minimum Temperature (°C)Cu
mul
ativ
e Pe
rcen
tBaseline CGCM2A2x HADCM2B21
Figure B-101. Thunder Bay minimum daily temperature cumulative percent distribution (n=54750)

The Road Well-traveled: Implications of Climate Change for Pavement Infrastructure in Southern Canada 126
-60
-50
-40
-30
-20
-10
0
10
20
30
40
Base CGCM2A2x HADCM3B21
Daily
Min
imum
Tem
pera
ture
(°C)
Minimum 25% Quartile Median 75% Quartile Maximum
Figure B-102. Thunder Bay minimum daily temperature distribution: quartile statistics (n=54750)
0
2000
4000
6000
8000
10000
12000
-35 -30 -25 -20 -15 -10 -5 0 5 10 15 20 25 30 35 40
7-day Mean Maximum Temperature (°C)
Cou
nt (d
ays)
Baseline CGCM2A2x HADCM2B21
Figure B-103. Thunder Bay 7-day mean maximum daily temperature distribution (n=54750)
0102030405060708090
100
-35 -30 -25 -20 -15 -10 -5 0 5 10 15 20 25 30 35 40
7-day Maximum Temperature Range (°C)
Cum
ulat
ive
Perc
ent
Baseline CGCM2A2x HADCM2B21
Figure B-104. Thunder Bay 7-day means maximum daily temperature cumulative percent distribution (n=54750)
-40
-30
-20
-10
0
10
20
30
40
50
Base CGCM2A2x HADCM3B217-
day
Max
imum
Tem
pera
ture
(°C)
Minimum 25% Quartile Median 75% Quartile Maximum
Figure B-105. Thunder Bay 7-day mean maximum daily temperature distribution: quartile statistics (n=54750)

The Road Well-traveled: Implications of Climate Change for Pavement Infrastructure in Southern Canada 127
Table B-38. Thunder Bay annual extreme minimum air temperature Climate Change Scenario STATISTIC (°C) Baseline* CGCM2A2x* HadCM3B21* Mean -38.7 -33.7 -37.8 Standard Deviation 3.7 3.7 3.8 Minimum -50.7 -46.2 -50.1 Lower Quartile -41.4 -36.5 -40.4 Median -38.5 -33.4 -37.4 Upper Quartile -36.2 -30.9 -35.1 Maximum -31.3 -26.7 -30.4 *n=150 Table B-39. Thunder Bay annual extreme 7-day mean maximum air temperature Climate Change Scenario STATISTIC (°C) Baseline* CGCM2A2x* HadCM3B21* Mean 28.1 30.8 31.3 Standard Deviation 1.6 1.6 1.6 Minimum 24.4 27.4 27.5 Lower Quartile 27.1 29.7 30.3 Median 28.1 30.8 31.2 Upper Quartile 29.2 31.8 32.4 Maximum 32.9 36.3 36.4 *n=150
-60
-50
-40
-30
-20
-10
0
Base CGCM2A2x HADCM3B21
Ann
ual E
xtre
me
Min
imum
Te
mpe
ratu
re (°
C)
Minimum 25% Quartile Median 75% Quartile Maximum
Figure B-106. Thunder Bay annual extreme minimum temperature distribution: quartile statistics (n=150)
0
5
10
15
20
25
30
35
40
Base CGCM2A2x HADCM3B21Ann
ual E
xtre
me
7-da
y M
axim
um
Tem
pera
ture
(°C
)
Minimum 25% Quartile Median 75% Quartile Maximum
Figure B-107. Thunder Bay annual extreme 7-day mean maximum daily temperature distribution: quartile statistics (n=150)

The Road Well-traveled: Implications of Climate Change for Pavement Infrastructure in Southern Canada 128
Table B-40. Thunder Bay Performance Grade (PG) design pavement temperature summary Climate Change Scenario STATISTIC Baselin
e CGCM2A2x HadCM3B21
Superpave-derived low PG threshold (°C) -37.1 -33.4 -36.4 Superpave-derived high PG threshold (°C) 52.1 54.2 54.5 98th percentile annual minimum air temperature -46.3 -40.9 -45.2 Ontario RWIS-based low PG threshold (°C) -35.4 -32.2 -34.8 98th percentile annual extreme 7-day mean maximum air temperature 31.7 34.3 34.7 Ontario RWIS-based high PG threshold (°C) 47.2 51.5 52.1
-50.0-40.0-30.0-20.0-10.0
0.010.020.030.040.050.060.0
Base CGCM2A2x HADCM3B21
Desi
gn (9
8% re
liabi
lity)
Min
imum
/7-
day
Mea
n Pa
vem
ent T
empe
ratu
re
(°C)
SuperpaveTmax-98%annual SuperpaveTmin-98% annual
Ontario RWIS Tmax-98%annual Ontario RWIS Tmin-98% annual
Figure B-108. Thunder Bay estimated low and high Performance Grade (PG) temperature ratings (design 98% reliability minimum and 7-day mean maximum temperatures)
Table B-41. Thunder Bay freeze season length Climate Change Scenario STATISTIC (days)
Baseline* CGCM2A2x* HadCM3B21*
Mean 114.5 94.6 100.9 Standard Deviation 18.0 21.8 14.1 Minimum 5.0 16.0 22.0 Lower Quartile 109.0 89.0 94.3 Median 118.0 99.0 103.0 Upper Quartile 124.0 107.0 109.0 Maximum 143.0 138.0 133.0 *n=150
0
50
100
150
200
250
0 50 100 150 200
Days to Critical Freeze
Days
to C
ritic
al T
haw
Baseline CGCM2A2x-2040-2069 HADCM3B21-2040-2069
Figure B-109. Thunder Bay estimated number of days to Critical Freeze Index (FI) and Thaw Index (TI)

The Road Well-traveled: Implications of Climate Change for Pavement Infrastructure in Southern Canada 129
0.0
20.0
40.0
60.0
80.0
100.0
120.0
140.0
160.0
Base CGCM2A2x HADCM3B21
Free
ze S
easo
n Le
ngth
(day
s)
Minimum 25% Quartile Median 75% Quartile Maximum
Figure B-110. Thunder Bay estimated freeze season length distribution: quartile statistics (n=150)
0
20
40
60
80
100
1 3 5 7 9 11 13 15 17 19 21 23 25 27 29 31 33 35 37 39 41 43 45 47 49
Season
Days
to C
ritic
al F
reez
e
Base1 Base2 Base3
Figure B-111. Thunder Bay estimated days to critical FI (baseline series)
0
20
40
60
80
100
120
1 3 5 7 9 11 13 15 17 19 21 23 25 27 29 31 33 35 37 39 41 43 45 47 49
Season
Day
s to
Crit
ical
Fre
eze
CGCM2A2xWG1 CGCM2A2xWG2 CGCM2A2xWG3
Figure B-112. Thunder Bay estimated days to critical FI (CGCM2A2x scenario series)
0
20
40
60
80
100
120
1 3 5 7 9 11 13 15 17 19 21 23 25 27 29 31 33 35 37 39 41 43 45 47 49
Season
Days
to C
ritic
al F
reez
eHADCM3B21WG1 HADCM3B21WG2 HADCM3B21WG3
Figure B-113. Thunder Bay estimated days to critical FI (HadCM3B21 scenario series)

The Road Well-traveled: Implications of Climate Change for Pavement Infrastructure in Southern Canada 130
0
50
100
150
200
250
1 3 5 7 9 11 13 15 17 19 21 23 25 27 29 31 33 35 37 39 41 43 45 47 49
Season
Days
to C
ritic
al T
haw
Base1 Base2 Base3
Figure B-114. Thunder Bay estimated days to critical TI (baseline series)
0
50
100
150
200
250
1 3 5 7 9 11 13 15 17 19 21 23 25 27 29 31 33 35 37 39 41 43 45 47 49
Season
Days
to C
ritic
al T
haw
CGCM2A2xWG1 CGCM2A2xWG2 CGCM2A2xWG3
Figure B-115. Thunder Bay estimated days to critical TI (CGCM2A2x scenario series)
0
50
100
150
200
250
1 3 5 7 9 11 13 15 17 19 21 23 25 27 29 31 33 35 37 39 41 43 45 47 49
Season
Day
s to
Cri
tical
Tha
w
HADCM3B21WG1 HADCM3B21WG2 HADCM3B21WG3
Figure B-116. Thunder Bay estimated days to critical TI (HadCM3B21 scenario series)
020406080
100120140160
1 3 5 7 9 11 13 15 17 19 21 23 25 27 29 31 33 35 37 39 41 43 45 47 49
SeasonFr
eeze
Sea
son
Leng
th
Base1 Base2 Base3
Figure B-117. Thunder Bay estimated freeze season length (baseline series)

The Road Well-traveled: Implications of Climate Change for Pavement Infrastructure in Southern Canada 131
020406080
100120140160
1 3 5 7 9 11 13 15 17 19 21 23 25 27 29 31 33 35 37 39 41 43 45 47 49
Season
Free
ze S
easo
n Le
ngth
CGCM2A2xWG1 CGCM2A2xWG2 CGCM2A2xWG3
Figure B-118. Thunder Bay estimated freeze season length (CGCM2A2x scenario series)
0
2040
6080
100120
140
1 3 5 7 9 11 13 15 17 19 21 23 25 27 29 31 33 35 37 39 41 43 45 47 49
Season
Free
ze S
easo
n Le
ngth
HADCM3B21WG1 HADCM3B21WG2 HADCM3B21WG3
Figure B-119. Thunder Bay estimated freeze season length (HadCM3B21 scenario series)

The Road Well-traveled: Implications of Climate Change for Pavement Infrastructure in Southern Canada 132
CASE STUDY SITE: NORTH BAY
City (MSC Observing
Station reference)
Lat Long Elevation (m)
Mean Annual Temperature*
(°C)
Mean Total Precipitation*
(mm)
North Bay (6085700) 46.4 78.4 370.3
3.8 1007.7
*1971-2000 climate normals Table B-42. North Bay minimum daily air temperature Climate Change Scenario STATISTIC (°C) Baseline* CGCM2A2x* HadCM3B21* Mean -1.1 2.0 1.4 Standard Deviation 12.0 11.3 12.1 Minimum -47.1 -40.2 -44.9 Lower Quartile -10.0 -6.5 -7.5 Median 0.5 2.9 2.9 Upper Quartile 8.8 11.7 11.4 Maximum 25.6 27.9 28.6 *n=54750 Table B-43. North Bay 7-day mean maximum daily air temperature Climate Change Scenario STATISTIC (°C) Baseline* CGCM2A2x* HadCM3B21* Mean 8.6 11.0 11.0 Standard Deviation 11.5 11.6 12.0 Minimum -23.2 -20.3 -21.6 Lower Quartile -1.5 0.5 0.3 Median 9.3 11.4 11.7 Upper Quartile 19.2 22.0 22.2 Maximum 31.4 35.2 34.2 *n=54750
0
2000
4000
6000
8000
10000
12000
-40 -35 -30 -25 -20 -15 -10 -5 0 5 10 15 20 25 30
Daily Minimum Temperature (°C)
Cou
nt (d
ays)
Baseline CGCM2A2x HADCM2B21
Figure B-120. North Bay minimum daily temperature distribution (n=54750)
0102030405060708090
100
-40 -35 -30 -25 -20 -15 -10 -5 0 5 10 15 20 25 30
Daily Minimum Temperature (°C)
Cum
ulat
ive
Per
cent
Baseline CGCM2A2x HADCM2B21
Figure B-121. North Bay minimum daily temperature cumulative percent distribution (n=54750)

The Road Well-traveled: Implications of Climate Change for Pavement Infrastructure in Southern Canada 133
-60
-50
-40
-30
-20
-10
0
10
20
30
40
Base CGCM2A2x HADCM3B21
Daily
Min
imum
Tem
pera
ture
(°C)
Minimum 25% Quartile Median 75% Quartile Maximum
Figure B-122. North Bay minimum daily temperature distribution: quartile statistics (n=54750)
0
2000
4000
6000
8000
10000
12000
-35 -30 -25 -20 -15 -10 -5 0 5 10 15 20 25 30 35 40
7-day Mean Maximum Temperature (°C)
Cou
nt (d
ays)
Baseline CGCM2A2x HADCM2B21
Figure B-123. North Bay 7-day mean maximum daily temperature distribution (n=54750)
0102030405060708090
100
-35 -30 -25 -20 -15 -10 -5 0 5 10 15 20 25 30 35 40
7-day Maximum Temperature Range (°C)
Cum
ulat
ive
Perc
ent
Baseline CGCM2A2x HADCM2B21
Figure B-124. North Bay 7-day means maximum daily temperature cumulative percent distribution (n=54750)
-40
-30
-20
-10
0
10
20
30
40
50
Base CGCM2A2x HADCM3B217-
day
Max
imum
Tem
pera
ture
(°C)
Minimum 25% Quartile Median 75% Quartile Maximum
Figure B-125. North Bay 7-day mean maximum daily temperature distribution: quartile statistics (n=54750)

The Road Well-traveled: Implications of Climate Change for Pavement Infrastructure in Southern Canada 134
Table B-44. North Bay annual extreme minimum air temperature Climate Change Scenario STATISTIC (°C) Baseline* CGCM2A2x* HadCM3B21* Mean -35.3 -29.5 -33.0 Standard Deviation 3.8 3.8 3.8 Minimum -47.1 -40.2 -44.9 Lower Quartile -38.4 -32.5 -36.0 Median -34.9 -28.9 -32.7 Upper Quartile -32.2 -26.7 -30.1 Maximum -28.3 -22.2 -26.2 *n=150 Table B-45. North Bay annual extreme 7-day mean maximum air temperature Climate Change Scenario STATISTIC (°C) Baseline* CGCM2A2x* HadCM3B21* Mean 27.4 30.1 30.4 Standard Deviation 1.5 1.6 1.5 Minimum 24.4 26.8 27.5 Lower Quartile 26.4 28.8 29.3 Median 27.3 29.9 30.2 Upper Quartile 28.2 30.9 31.1 Maximum 31.4 35.2 34.2 *n=150
-60
-50
-40
-30
-20
-10
0
Base CGCM2A2x HADCM3B21
Ann
ual E
xtre
me
Min
imum
Te
mpe
ratu
re (°
C)
Minimum 25% Quartile Median 75% Quartile Maximum
Figure B-126. North Bay annual extreme minimum temperature distribution: quartile statistics (n=150)
0
5
10
15
20
25
30
35
40
Base CGCM2A2x HADCM3B21Ann
ual E
xtre
me
7-da
y M
axim
um
Tem
pera
ture
(°C
)
Minimum 25% Quartile Median 75% Quartile Maximum
Figure B-127. North Bay annual extreme 7-day mean maximum daily temperature distribution: quartile statistics (n=150)
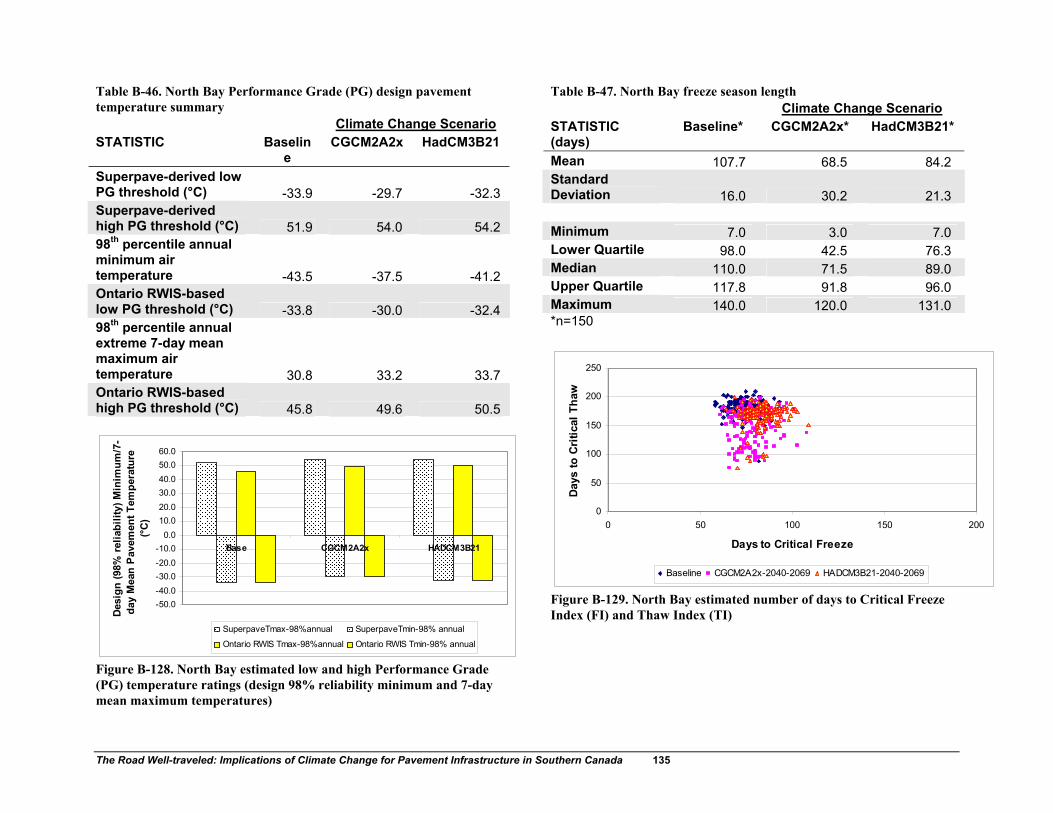
The Road Well-traveled: Implications of Climate Change for Pavement Infrastructure in Southern Canada 135
Table B-46. North Bay Performance Grade (PG) design pavement temperature summary Climate Change Scenario STATISTIC Baselin
e CGCM2A2x HadCM3B21
Superpave-derived low PG threshold (°C) -33.9 -29.7 -32.3 Superpave-derived high PG threshold (°C) 51.9 54.0 54.2 98th percentile annual minimum air temperature -43.5 -37.5 -41.2 Ontario RWIS-based low PG threshold (°C) -33.8 -30.0 -32.4 98th percentile annual extreme 7-day mean maximum air temperature 30.8 33.2 33.7 Ontario RWIS-based high PG threshold (°C) 45.8 49.6 50.5
-50.0-40.0-30.0-20.0-10.0
0.010.020.030.040.050.060.0
Base CGCM2A2x HADCM3B21
Des
ign
(98%
rel
iabi
lity)
Min
imum
/7-
day
Mea
n P
avem
ent T
empe
ratu
re
(°C)
SuperpaveTmax-98%annual SuperpaveTmin-98% annual
Ontario RWIS Tmax-98%annual Ontario RWIS Tmin-98% annual
Figure B-128. North Bay estimated low and high Performance Grade (PG) temperature ratings (design 98% reliability minimum and 7-day mean maximum temperatures)
Table B-47. North Bay freeze season length Climate Change Scenario STATISTIC (days)
Baseline* CGCM2A2x* HadCM3B21*
Mean 107.7 68.5 84.2 Standard Deviation 16.0 30.2 21.3 Minimum 7.0 3.0 7.0 Lower Quartile 98.0 42.5 76.3 Median 110.0 71.5 89.0 Upper Quartile 117.8 91.8 96.0 Maximum 140.0 120.0 131.0 *n=150
0
50
100
150
200
250
0 50 100 150 200
Days to Critical Freeze
Day
s to
Cri
tical
Tha
wBaseline CGCM2A2x-2040-2069 HADCM3B21-2040-2069
Figure B-129. North Bay estimated number of days to Critical Freeze Index (FI) and Thaw Index (TI)
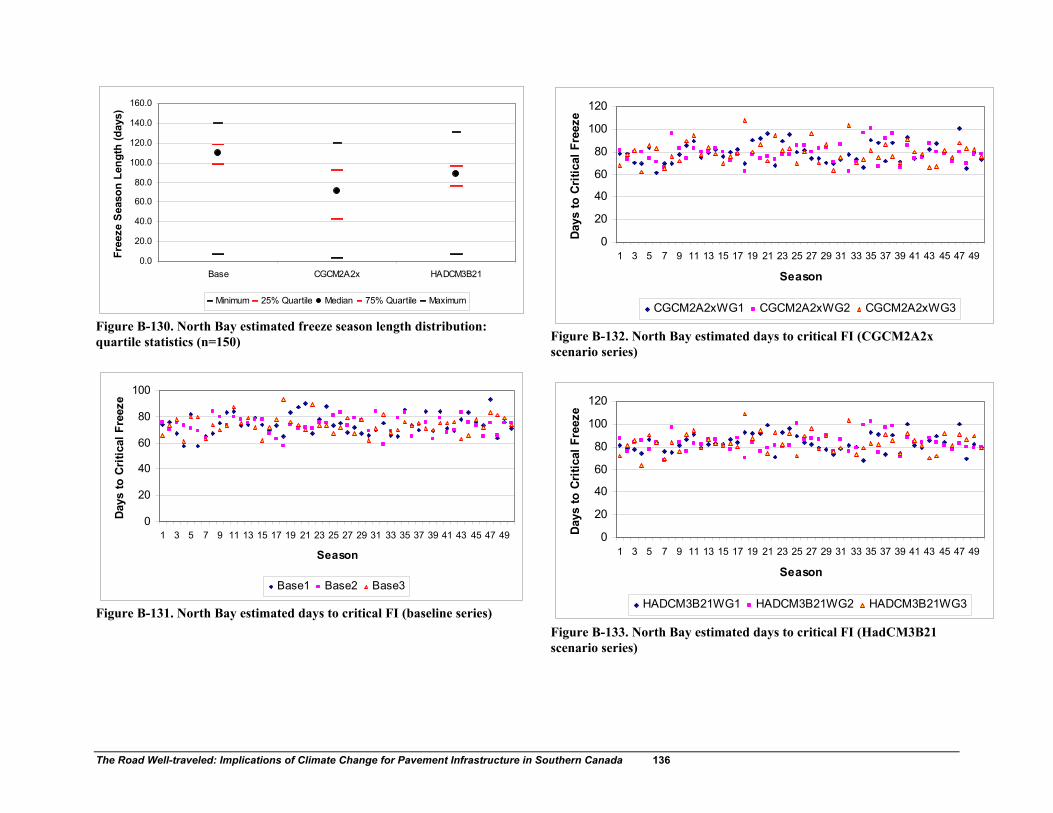
The Road Well-traveled: Implications of Climate Change for Pavement Infrastructure in Southern Canada 136
0.0
20.0
40.0
60.0
80.0
100.0
120.0
140.0
160.0
Base CGCM2A2x HADCM3B21
Free
ze S
easo
n Le
ngth
(day
s)
Minimum 25% Quartile Median 75% Quartile Maximum
Figure B-130. North Bay estimated freeze season length distribution: quartile statistics (n=150)
0
20
40
60
80
100
1 3 5 7 9 11 13 15 17 19 21 23 25 27 29 31 33 35 37 39 41 43 45 47 49
Season
Days
to C
ritic
al F
reez
e
Base1 Base2 Base3
Figure B-131. North Bay estimated days to critical FI (baseline series)
0
20
40
60
80
100
120
1 3 5 7 9 11 13 15 17 19 21 23 25 27 29 31 33 35 37 39 41 43 45 47 49
Season
Day
s to
Cri
tical
Fre
eze
CGCM2A2xWG1 CGCM2A2xWG2 CGCM2A2xWG3
Figure B-132. North Bay estimated days to critical FI (CGCM2A2x scenario series)
0
20
40
60
80
100
120
1 3 5 7 9 11 13 15 17 19 21 23 25 27 29 31 33 35 37 39 41 43 45 47 49
SeasonDa
ys to
Crit
ical
Fre
eze
HADCM3B21WG1 HADCM3B21WG2 HADCM3B21WG3
Figure B-133. North Bay estimated days to critical FI (HadCM3B21 scenario series)

The Road Well-traveled: Implications of Climate Change for Pavement Infrastructure in Southern Canada 137
0
50
100
150
200
250
1 3 5 7 9 11 13 15 17 19 21 23 25 27 29 31 33 35 37 39 41 43 45 47 49
Season
Days
to C
ritic
al T
haw
Base1 Base2 Base3
Figure B-134. North Bay estimated days to critical TI (baseline series)
0
50
100
150
200
250
1 3 5 7 9 11 13 15 17 19 21 23 25 27 29 31 33 35 37 39 41 43 45 47 49
Season
Days
to C
ritic
al T
haw
CGCM2A2xWG1 CGCM2A2xWG2 CGCM2A2xWG3
Figure B-135. North Bay estimated days to critical TI (CGCM2A2x scenario series)
0
50
100
150
200
250
1 3 5 7 9 11 13 15 17 19 21 23 25 27 29 31 33 35 37 39 41 43 45 47 49
Season
Day
s to
Cri
tical
Tha
w
HADCM3B21WG1 HADCM3B21WG2 HADCM3B21WG3
Figure B-136. North Bay estimated days to critical TI (HadCM3B21 scenario series)
020406080
100120140160
1 3 5 7 9 11 13 15 17 19 21 23 25 27 29 31 33 35 37 39 41 43 45 47 49
SeasonFr
eeze
Sea
son
Leng
th
Base1 Base2 Base3
Figure B-137. North Bay estimated freeze season length (baseline series)

The Road Well-traveled: Implications of Climate Change for Pavement Infrastructure in Southern Canada 138
0
2040
6080
100120
140
1 3 5 7 9 11 13 15 17 19 21 23 25 27 29 31 33 35 37 39 41 43 45 47 49
Season
Free
ze S
easo
n Le
ngth
CGCM2A2xWG1 CGCM2A2xWG2 CGCM2A2xWG3
Figure B-138. North Bay estimated freeze season length (CGCM2A2x scenario series)
0
2040
6080
100120
140
1 3 5 7 9 11 13 15 17 19 21 23 25 27 29 31 33 35 37 39 41 43 45 47 49
Season
Free
ze S
easo
n Le
ngth
HADCM3B21WG1 HADCM3B21WG2 HADCM3B21WG3
Figure B-139. North Bay estimated freeze season length (HadCM3B21 scenario series)

The Road Well-traveled: Implications of Climate Change for Pavement Infrastructure in Southern Canada 139
CASE STUDY SITE: MUSKOKA
City (MSC Observing
Station reference)
Lat Long Elevation (m)
Mean Annual Temperature*
(°C)
Mean Total Precipitation*
(mm)
Muskoka (6115525) 44.9 79.3 281.9
4.9 1098.6
*1971-2000 climate normals Table B-48. Muskoka minimum daily air temperature Climate Change Scenario STATISTIC (°C) Baseline* CGCM2A2x* HadCM3B21* Mean -0.8 2.4 1.7 Standard Deviation 11.3 10.7 11.4 Minimum -51.7 -45.3 -49.3 Lower Quartile -8.5 -5.1 -6.0 Median 0.9 3.5 3.3 Upper Quartile 8.2 11.1 10.7 Maximum 28.0 30.1 30.6 *n=54750 Table B-49. Muskoka 7-day mean maximum daily air temperature Climate Change Scenario STATISTIC (°C) Baseline* CGCM2A2x* HadCM3B21* Mean 10.6 13.0 13.1 Standard Deviation 10.9 11.1 11.5 Minimum -16.3 -13.3 -15.4 Lower Quartile 0.8 2.8 2.8 Median 11.2 13.4 13.8 Upper Quartile 20.8 23.6 23.9 Maximum 32.2 35.6 35.5 *n=54750
0
2000
4000
6000
8000
10000
12000
-40 -35 -30 -25 -20 -15 -10 -5 0 5 10 15 20 25 30
Daily Minimum Temperature (°C)
Coun
t (da
ys)
Baseline CGCM2A2x HADCM2B21
Figure B-140. Muskoka minimum daily temperature distribution (n=54750)
0102030405060708090
100
-40 -35 -30 -25 -20 -15 -10 -5 0 5 10 15 20 25 30
Daily Minimum Temperature (°C)
Cum
ulat
ive
Per
cent
Baseline CGCM2A2x HADCM2B21
Figure B-141. Muskoka minimum daily temperature cumulative percent distribution (n=54750)

The Road Well-traveled: Implications of Climate Change for Pavement Infrastructure in Southern Canada 140
-60
-50
-40
-30
-20
-10
0
10
20
30
40
Base CGCM2A2x HADCM3B21
Daily
Min
imum
Tem
pera
ture
(°C)
Minimum 25% Quartile Median 75% Quartile Maximum
Figure B-142. Muskoka minimum daily temperature distribution: quartile statistics (n=54750)
0
2000
4000
6000
8000
10000
12000
-35 -30 -25 -20 -15 -10 -5 0 5 10 15 20 25 30 35 40
7-day Mean Maximum Temperature (°C)
Cou
nt (d
ays)
Baseline CGCM2A2x HADCM2B21
Figure B-143. Muskoka 7-day mean maximum daily temperature distribution (n=54750)
0102030405060708090
100
-35 -30 -25 -20 -15 -10 -5 0 5 10 15 20 25 30 35 40
7-day Maximum Temperature Range (°C)
Cum
ulat
ive
Perc
ent
Baseline CGCM2A2x HADCM2B21
Figure B-144. Muskoka 7-day mean maximum daily temperature cumulative percent distribution (n=54750)
-40
-30
-20
-10
0
10
20
30
40
50
Base CGCM2A2x HADCM3B217-
day
Max
imum
Tem
pera
ture
(°C)
Minimum 25% Quartile Median 75% Quartile Maximum
Figure B-145. Muskoka 7-day mean maximum daily temperature distribution: quartile statistics (n=54750)

The Road Well-traveled: Implications of Climate Change for Pavement Infrastructure in Southern Canada 141
Table B-50. Muskoka annual extreme minimum air temperature Climate Change Scenario STATISTIC (°C) Baseline* CGCM2A2x* HadCM3B21* Mean -35.1 -29.3 -32.7 Standard Deviation 4.4 4.3 4.4 Minimum -51.7 -45.3 -49.3 Lower Quartile -38.0 -31.7 -35.7 Median -34.8 -28.7 -32.5 Upper Quartile -31.8 -26.4 -29.3 Maximum -24.4 -18.5 -22.2 *n=150 Table B-51. Muskoka annual extreme 7-day mean maximum air temperature Climate Change Scenario STATISTIC (°C) Baseline* CGCM2A2x* HadCM3B21* Mean 28.4 31.1 31.6 Standard Deviation 1.4 1.6 1.3 Minimum 25.8 27.9 29.0 Lower Quartile 27.5 29.9 30.6 Median 28.4 31.1 31.6 Upper Quartile 29.3 32.0 32.4 Maximum 32.2 35.6 35.5 *n=150
-60
-50
-40
-30
-20
-10
0
Base CGCM2A2x HADCM3B21
Ann
ual E
xtre
me
Min
imum
Te
mpe
ratu
re (°
C)
Minimum 25% Quartile Median 75% Quartile Maximum
Figure B-146. Muskoka annual extreme minimum temperature distribution: quartile statistics (n=150)
0
5
10
15
20
25
30
35
40
Base CGCM2A2x HADCM3B21Ann
ual E
xtre
me
7-da
y M
axim
um
Tem
pera
ture
(°C
)
Minimum 25% Quartile Median 75% Quartile Maximum
Figure B-147. Muskoka annual extreme 7-day mean maximum daily temperature distribution: quartile statistics (n=150)
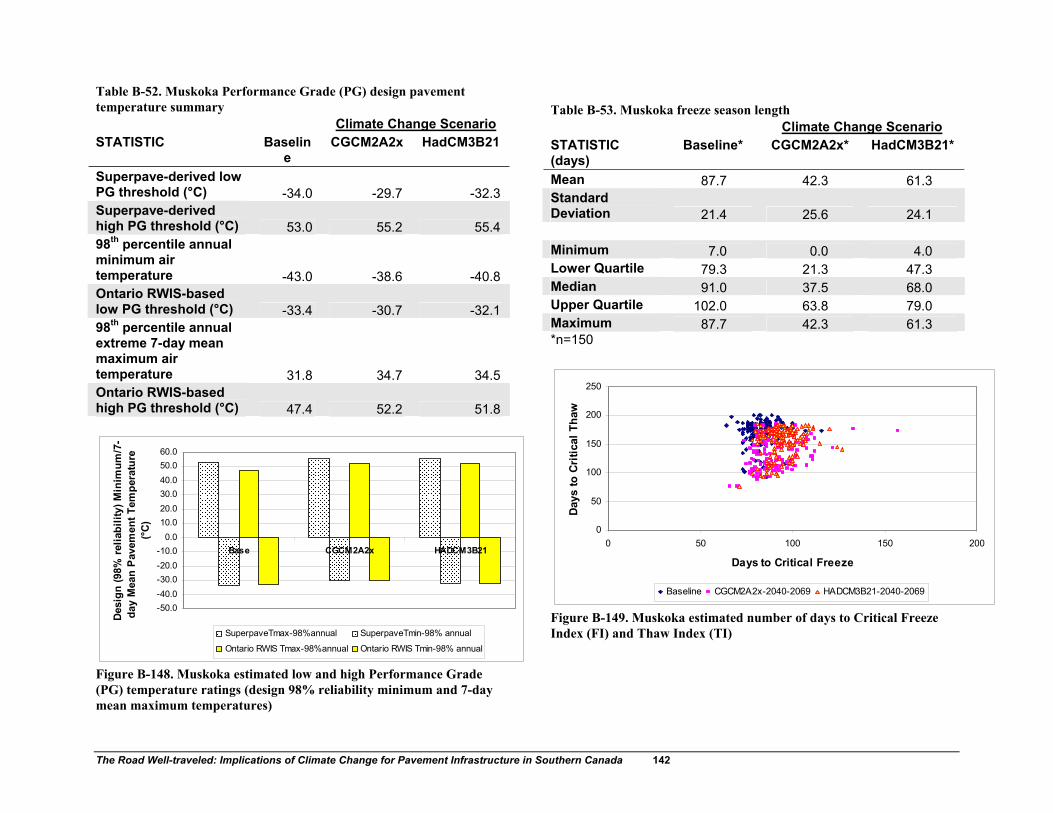
The Road Well-traveled: Implications of Climate Change for Pavement Infrastructure in Southern Canada 142
Table B-52. Muskoka Performance Grade (PG) design pavement temperature summary Climate Change Scenario STATISTIC Baselin
e CGCM2A2x HadCM3B21
Superpave-derived low PG threshold (°C) -34.0 -29.7 -32.3 Superpave-derived high PG threshold (°C) 53.0 55.2 55.4 98th percentile annual minimum air temperature -43.0 -38.6 -40.8 Ontario RWIS-based low PG threshold (°C) -33.4 -30.7 -32.1 98th percentile annual extreme 7-day mean maximum air temperature 31.8 34.7 34.5 Ontario RWIS-based high PG threshold (°C) 47.4 52.2 51.8
-50.0-40.0-30.0-20.0-10.0
0.010.020.030.040.050.060.0
Base CGCM2A2x HADCM3B21
Des
ign
(98%
rel
iabi
lity)
Min
imum
/7-
day
Mea
n P
avem
ent T
empe
ratu
re
(°C)
SuperpaveTmax-98%annual SuperpaveTmin-98% annual
Ontario RWIS Tmax-98%annual Ontario RWIS Tmin-98% annual
Figure B-148. Muskoka estimated low and high Performance Grade (PG) temperature ratings (design 98% reliability minimum and 7-day mean maximum temperatures)
Table B-53. Muskoka freeze season length Climate Change Scenario STATISTIC (days)
Baseline* CGCM2A2x* HadCM3B21*
Mean 87.7 42.3 61.3 Standard Deviation 21.4 25.6 24.1 Minimum 7.0 0.0 4.0 Lower Quartile 79.3 21.3 47.3 Median 91.0 37.5 68.0 Upper Quartile 102.0 63.8 79.0 Maximum 87.7 42.3 61.3 *n=150
0
50
100
150
200
250
0 50 100 150 200
Days to Critical FreezeD
ays
to C
ritic
al T
haw
Baseline CGCM2A2x-2040-2069 HADCM3B21-2040-2069
Figure B-149. Muskoka estimated number of days to Critical Freeze Index (FI) and Thaw Index (TI)

The Road Well-traveled: Implications of Climate Change for Pavement Infrastructure in Southern Canada 143
0.0
20.0
40.0
60.0
80.0
100.0
120.0
140.0
Base CGCM2A2x HADCM3B21
Free
ze S
easo
n Le
ngth
(day
s)
Minimum 25% Quartile Median 75% Quartile Maximum
Figure B-150. Muskoka estimated freeze season length distribution: quartile statistics (n=150)
020
406080
100
120140
1 3 5 7 9 11 13 15 17 19 21 23 25 27 29 31 33 35 37 39 41 43 45 47 49
Season
Days
to C
ritic
al F
reez
e
Base1 Base2 Base3
Figure B-151. Muskoka estimated days to critical FI (baseline series)
020406080
100120140160180
1 3 5 7 9 11 13 15 17 19 21 23 25 27 29 31 33 35 37 39 41 43 45 47 49
Season
Day
s to
Cri
tical
Fre
eze
CGCM2A2xWG1 CGCM2A2xWG2 CGCM2A2xWG3
Figure B-152. Muskoka estimated days to critical FI (CGCM2A2x scenario series)
020
406080
100
120140
1 3 5 7 9 11 13 15 17 19 21 23 25 27 29 31 33 35 37 39 41 43 45 47 49
Season
Days
to C
ritic
al F
reez
eHADCM3B21WG1 HADCM3B21WG2 HADCM3B21WG3
Figure B-153. Muskoka estimated days to critical FI (HadCM3B21 scenario series)

The Road Well-traveled: Implications of Climate Change for Pavement Infrastructure in Southern Canada 144
0
50
100
150
200
250
1 3 5 7 9 11 13 15 17 19 21 23 25 27 29 31 33 35 37 39 41 43 45 47 49
Season
Days
to C
ritic
al T
haw
Base1 Base2 Base3
Figure B-154. Muskoka estimated days to critical TI (baseline series)
0
50
100
150
200
1 3 5 7 9 11 13 15 17 19 21 23 25 27 29 31 33 35 37 39 41 43 45 47 49
Season
Days
to C
ritic
al T
haw
CGCM2A2xWG1 CGCM2A2xWG2 CGCM2A2xWG3
Figure B-155. Muskoka estimated days to critical TI (CGCM2A2x scenario series)
0
50
100
150
200
1 3 5 7 9 11 13 15 17 19 21 23 25 27 29 31 33 35 37 39 41 43 45 47 49
Season
Days
to C
ritic
al T
haw
HADCM3B21WG1 HADCM3B21WG2 HADCM3B21WG3
Figure B-156. Muskoka estimated days to critical TI (HadCM3B21 scenario series)
0
2040
6080
100120
140
1 3 5 7 9 11 13 15 17 19 21 23 25 27 29 31 33 35 37 39 41 43 45 47 49
SeasonFr
eeze
Sea
son
Leng
th
Base1 Base2 Base3
Figure B-157. Muskoka estimated freeze season length (baseline series)
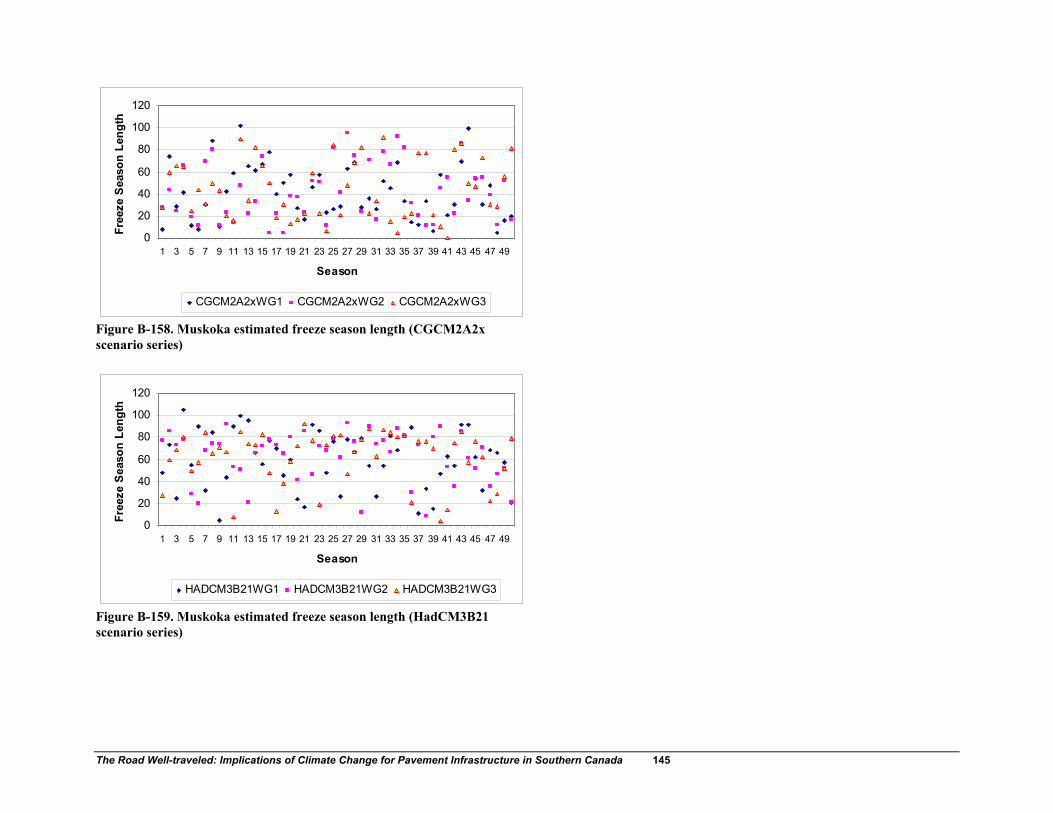
The Road Well-traveled: Implications of Climate Change for Pavement Infrastructure in Southern Canada 145
0
20
40
60
80
100
120
1 3 5 7 9 11 13 15 17 19 21 23 25 27 29 31 33 35 37 39 41 43 45 47 49
Season
Free
ze S
easo
n Le
ngth
CGCM2A2xWG1 CGCM2A2xWG2 CGCM2A2xWG3
Figure B-158. Muskoka estimated freeze season length (CGCM2A2x scenario series)
0
20
40
60
80
100
120
1 3 5 7 9 11 13 15 17 19 21 23 25 27 29 31 33 35 37 39 41 43 45 47 49
Season
Free
ze S
easo
n Le
ngth
HADCM3B21WG1 HADCM3B21WG2 HADCM3B21WG3
Figure B-159. Muskoka estimated freeze season length (HadCM3B21 scenario series)
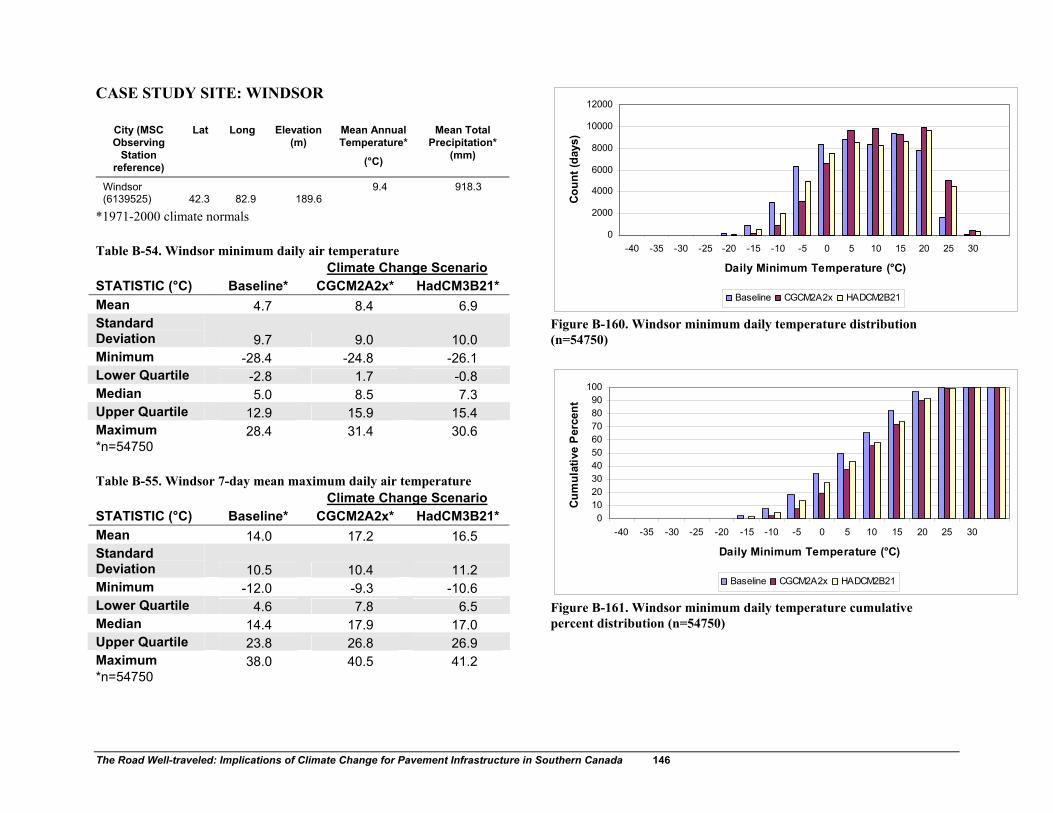
The Road Well-traveled: Implications of Climate Change for Pavement Infrastructure in Southern Canada 146
CASE STUDY SITE: WINDSOR
City (MSC Observing
Station reference)
Lat Long Elevation (m)
Mean Annual Temperature*
(°C)
Mean Total Precipitation*
(mm)
Windsor (6139525) 42.3 82.9 189.6
9.4 918.3
*1971-2000 climate normals Table B-54. Windsor minimum daily air temperature Climate Change Scenario STATISTIC (°C) Baseline* CGCM2A2x* HadCM3B21* Mean 4.7 8.4 6.9 Standard Deviation 9.7 9.0 10.0 Minimum -28.4 -24.8 -26.1 Lower Quartile -2.8 1.7 -0.8 Median 5.0 8.5 7.3 Upper Quartile 12.9 15.9 15.4 Maximum 28.4 31.4 30.6 *n=54750 Table B-55. Windsor 7-day mean maximum daily air temperature Climate Change Scenario STATISTIC (°C) Baseline* CGCM2A2x* HadCM3B21* Mean 14.0 17.2 16.5 Standard Deviation 10.5 10.4 11.2 Minimum -12.0 -9.3 -10.6 Lower Quartile 4.6 7.8 6.5 Median 14.4 17.9 17.0 Upper Quartile 23.8 26.8 26.9 Maximum 38.0 40.5 41.2 *n=54750
0
2000
4000
6000
8000
10000
12000
-40 -35 -30 -25 -20 -15 -10 -5 0 5 10 15 20 25 30
Daily Minimum Temperature (°C)
Coun
t (da
ys)
Baseline CGCM2A2x HADCM2B21
Figure B-160. Windsor minimum daily temperature distribution (n=54750)
0102030405060708090
100
-40 -35 -30 -25 -20 -15 -10 -5 0 5 10 15 20 25 30
Daily Minimum Temperature (°C)
Cum
ulat
ive
Per
cent
Baseline CGCM2A2x HADCM2B21
Figure B-161. Windsor minimum daily temperature cumulative percent distribution (n=54750)

The Road Well-traveled: Implications of Climate Change for Pavement Infrastructure in Southern Canada 147
-60
-50
-40
-30
-20
-10
0
10
20
30
40
Base CGCM2A2x HADCM3B21
Daily
Min
imum
Tem
pera
ture
(°C)
Minimum 25% Quartile Median 75% Quartile Maximum
Figure B-162. Windsor minimum daily temperature distribution: quartile statistics (n=54750)
0
2000
4000
6000
8000
10000
12000
14000
-35 -30 -25 -20 -15 -10 -5 0 5 10 15 20 25 30 35 40
7-day Mean Maximum Temperature (°C)
Cou
nt (d
ays)
Baseline CGCM2A2x HADCM2B21
Figure B-163. Windsor 7-day mean maximum daily temperature distribution (n=54750)
0102030405060708090
100
-35 -30 -25 -20 -15 -10 -5 0 5 10 15 20 25 30 35 40
7-day Maximum Temperature Range (°C)
Cum
ulat
ive
Per
cent
Baseline CGCM2A2x HADCM2B21
Figure B-164. Windsor 7-day mean maximum daily temperature cumulative percent distribution (n=54750)
-40
-30
-20
-10
0
10
20
30
40
50
Base CGCM2A2x HADCM3B217-
day
Max
imum
Tem
pera
ture
(°C)
Minimum 25% Quartile Median 75% Quartile Maximum
Figure B-165. Windsor 7-day mean maximum daily temperature distribution: quartile statistics (n=54750)

The Road Well-traveled: Implications of Climate Change for Pavement Infrastructure in Southern Canada 148
Table B-56. Windsor annual extreme minimum air temperature Climate Change Scenario STATISTIC (°C) Baseline* CGCM2A2x* HadCM3B21* Mean -20.5 -15.3 -18.8 Standard Deviation 2.8 2.8 2.7 Minimum -28.4 -24.8 -26.1 Lower Quartile -22.4 -16.8 -20.8 Median -20.5 -15.0 -18.8 Upper Quartile -18.5 -13.4 -16.8 Maximum -13.8 -8.8 -12.2 *n=150 Table B-57. Windsor annual extreme 7-day mean maximum air temperature Climate Change Scenario STATISTIC (°C) Baseline* CGCM2A2x* HadCM3B21* Mean 31.4 34.1 34.9 Standard Deviation 1.5 1.5 1.5 Minimum 27.4 30.0 31.0 Lower Quartile 30.3 33.1 33.9 Median 31.2 34.0 34.8 Upper Quartile 32.4 35.1 35.7 Maximum 38.0 40.5 41.2 *n=150
-60
-50
-40
-30
-20
-10
0
Base CGCM2A2x HADCM3B21
Ann
ual E
xtre
me
Min
imum
Dai
ly
Tem
pera
ture
(°C
)
Minimum Low er Quartile Median Upper Quartile Maximum
Figure B-166. Windsor annual extreme minimum temperature distribution: quartile statistics (n=150)
0
5
10
15
20
25
30
35
40
45
Base CGCM2A2x HADCM3B21Ann
ual E
xtre
me
7-da
y M
axim
um
Tem
pera
ture
(°C
)
Minimum Low er Quartile Median Upper Quartile Maximum
Figure B-167. Windsor annual extreme 7-day mean maximum daily temperature distribution: quartile statistics (n=150)
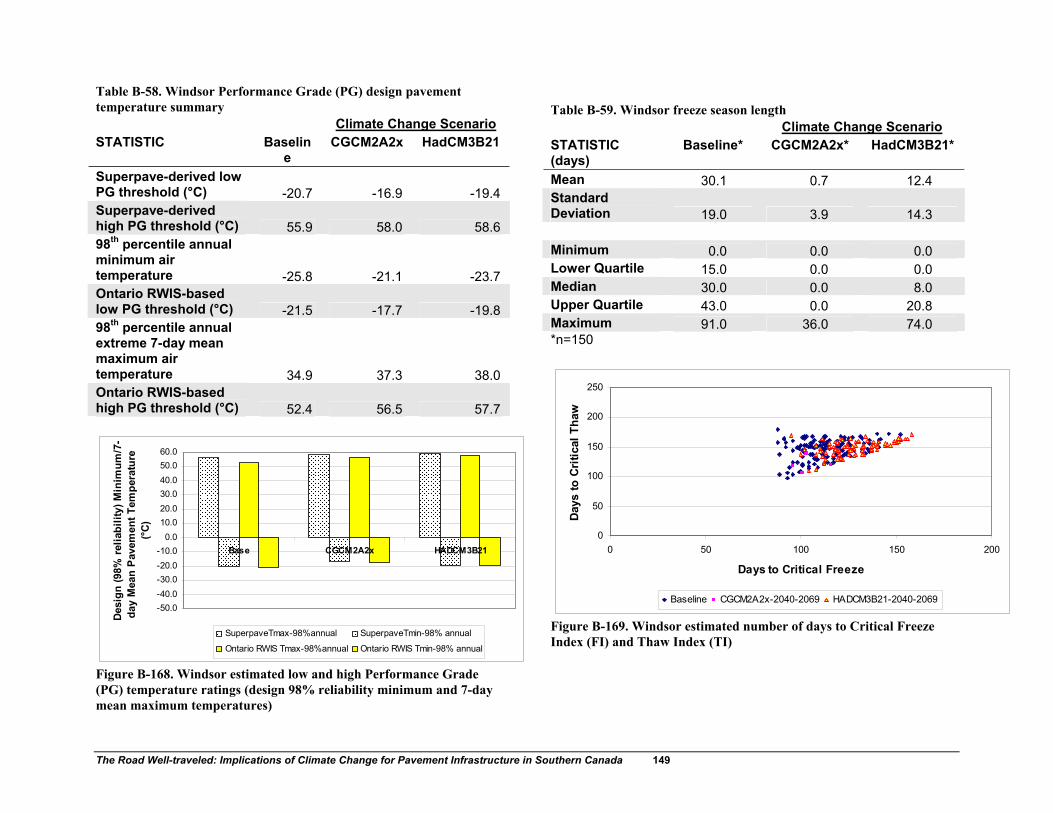
The Road Well-traveled: Implications of Climate Change for Pavement Infrastructure in Southern Canada 149
Table B-58. Windsor Performance Grade (PG) design pavement temperature summary Climate Change Scenario STATISTIC Baselin
e CGCM2A2x HadCM3B21
Superpave-derived low PG threshold (°C) -20.7 -16.9 -19.4 Superpave-derived high PG threshold (°C) 55.9 58.0 58.6 98th percentile annual minimum air temperature -25.8 -21.1 -23.7 Ontario RWIS-based low PG threshold (°C) -21.5 -17.7 -19.8 98th percentile annual extreme 7-day mean maximum air temperature 34.9 37.3 38.0 Ontario RWIS-based high PG threshold (°C) 52.4 56.5 57.7
-50.0-40.0-30.0-20.0-10.0
0.010.020.030.040.050.060.0
Base CGCM2A2x HADCM3B21
Des
ign
(98%
rel
iabi
lity)
Min
imum
/7-
day
Mea
n P
avem
ent T
empe
ratu
re
(°C)
SuperpaveTmax-98%annual SuperpaveTmin-98% annual
Ontario RWIS Tmax-98%annual Ontario RWIS Tmin-98% annual
Figure B-168. Windsor estimated low and high Performance Grade (PG) temperature ratings (design 98% reliability minimum and 7-day mean maximum temperatures)
Table B-59. Windsor freeze season length Climate Change Scenario STATISTIC (days)
Baseline* CGCM2A2x* HadCM3B21*
Mean 30.1 0.7 12.4 Standard Deviation 19.0 3.9 14.3 Minimum 0.0 0.0 0.0 Lower Quartile 15.0 0.0 0.0 Median 30.0 0.0 8.0 Upper Quartile 43.0 0.0 20.8 Maximum 91.0 36.0 74.0 *n=150
0
50
100
150
200
250
0 50 100 150 200
Days to Critical FreezeD
ays
to C
ritic
al T
haw
Baseline CGCM2A2x-2040-2069 HADCM3B21-2040-2069
Figure B-169. Windsor estimated number of days to Critical Freeze Index (FI) and Thaw Index (TI)

The Road Well-traveled: Implications of Climate Change for Pavement Infrastructure in Southern Canada 150
0.0
10.0
20.0
30.0
40.0
50.0
60.0
70.0
80.0
90.0
100.0
Base CGCM2A2x HADCM3B21
Free
ze S
easo
n Le
ngth
(day
s)
Minimum 25% Quartile Median 75% Quartile Maximum
Figure B-170. Windsor estimated freeze season length distribution: quartile statistics (n=150)
020406080
100120140160
1 3 5 7 9 11 13 15 17 19 21 23 25 27 29 31 33 35 37 39 41 43 45 47 49
Season
Days
to C
ritic
al F
reez
e
Base1 Base2 Base3
Figure B-171. Windsor estimated days to critical FI (baseline series)
020
406080
100
120140
1 3 5 7 9 11 13 15 17 19 21 23 25 27 29 31 33 35 37 39 41 43 45 47 49
Season
Day
s to
Cri
tical
Fre
eze
CGCM2A2xWG1 CGCM2A2xWG2 CGCM2A2xWG3
Figure B-172. Windsor estimated days to critical FI (CGCM2A2x scenario series)
020406080
100120140160180
1 3 5 7 9 11 13 15 17 19 21 23 25 27 29 31 33 35 37 39 41 43 45 47 49
Season
Days
to C
ritic
al F
reez
eHADCM3B21WG1 HADCM3B21WG2 HADCM3B21WG3
Figure B-173. Windsor estimated days to critical FI (HadCM3B21 scenario series)
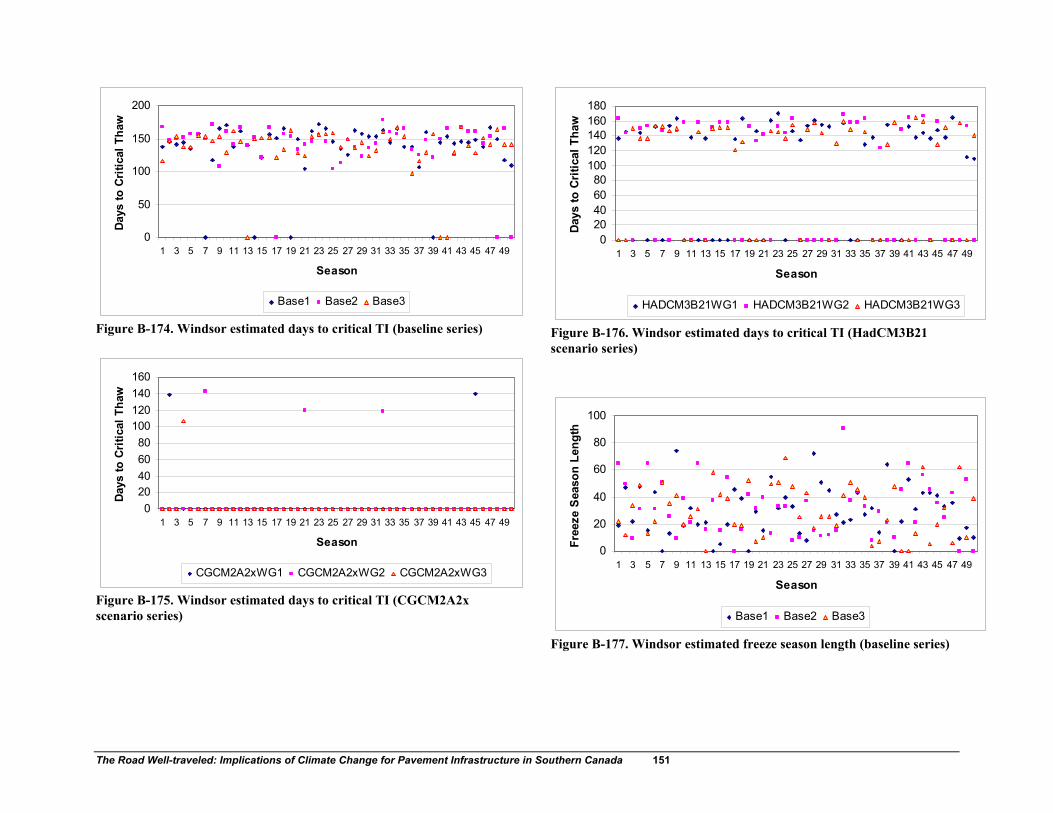
The Road Well-traveled: Implications of Climate Change for Pavement Infrastructure in Southern Canada 151
0
50
100
150
200
1 3 5 7 9 11 13 15 17 19 21 23 25 27 29 31 33 35 37 39 41 43 45 47 49
Season
Days
to C
ritic
al T
haw
Base1 Base2 Base3
Figure B-174. Windsor estimated days to critical TI (baseline series)
020406080
100120140160
1 3 5 7 9 11 13 15 17 19 21 23 25 27 29 31 33 35 37 39 41 43 45 47 49
Season
Days
to C
ritic
al T
haw
CGCM2A2xWG1 CGCM2A2xWG2 CGCM2A2xWG3
Figure B-175. Windsor estimated days to critical TI (CGCM2A2x scenario series)
020406080
100120140160180
1 3 5 7 9 11 13 15 17 19 21 23 25 27 29 31 33 35 37 39 41 43 45 47 49
Season
Day
s to
Crit
ical
Tha
w
HADCM3B21WG1 HADCM3B21WG2 HADCM3B21WG3
Figure B-176. Windsor estimated days to critical TI (HadCM3B21 scenario series)
0
20
40
60
80
100
1 3 5 7 9 11 13 15 17 19 21 23 25 27 29 31 33 35 37 39 41 43 45 47 49
SeasonFr
eeze
Sea
son
Leng
th
Base1 Base2 Base3
Figure B-177. Windsor estimated freeze season length (baseline series)
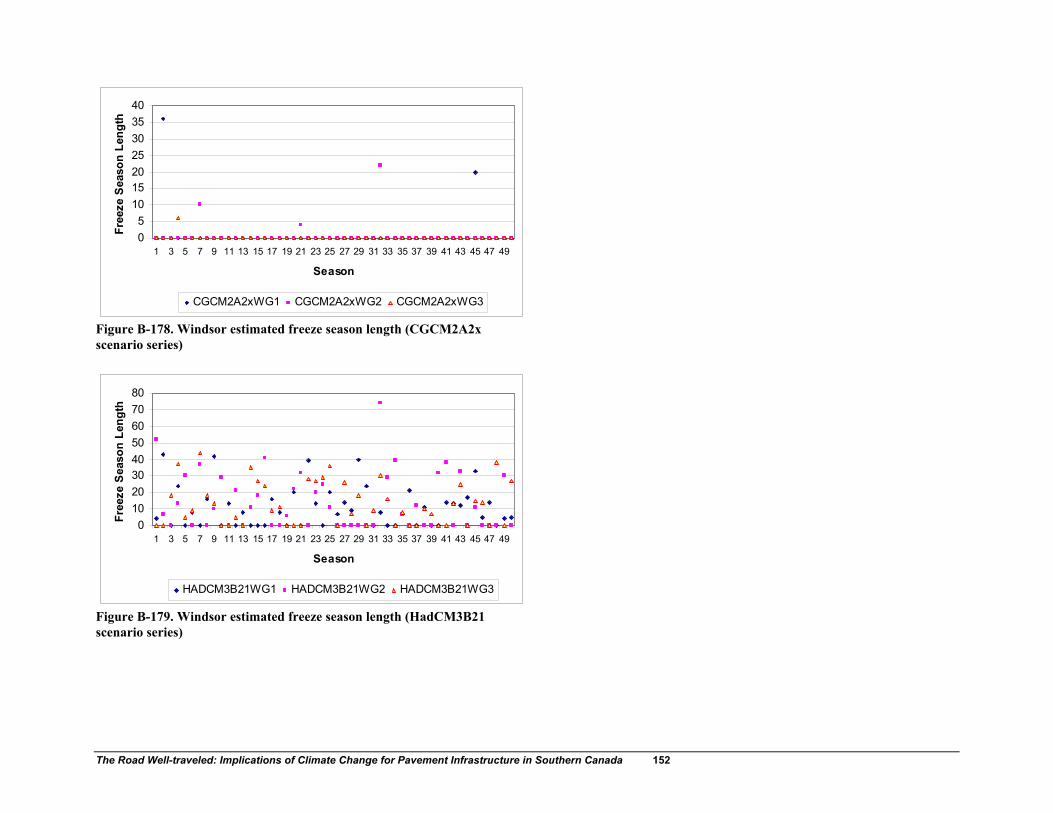
The Road Well-traveled: Implications of Climate Change for Pavement Infrastructure in Southern Canada 152
05
10152025303540
1 3 5 7 9 11 13 15 17 19 21 23 25 27 29 31 33 35 37 39 41 43 45 47 49
Season
Free
ze S
easo
n Le
ngth
CGCM2A2xWG1 CGCM2A2xWG2 CGCM2A2xWG3
Figure B-178. Windsor estimated freeze season length (CGCM2A2x scenario series)
01020304050607080
1 3 5 7 9 11 13 15 17 19 21 23 25 27 29 31 33 35 37 39 41 43 45 47 49
Season
Free
ze S
easo
n Le
ngth
HADCM3B21WG1 HADCM3B21WG2 HADCM3B21WG3
Figure B-179. Windsor estimated freeze season length (HadCM3B21 scenario series)

The Road Well-traveled: Implications of Climate Change for Pavement Infrastructure in Southern Canada 153
CASE STUDY SITE: TORONTO
City (MSC Observing
Station reference)
Lat Long Elevation (m)
Mean Annual Temperature*
(°C)
Mean Total Precipitation*
(mm)
Toronto (6158733) 43.7 79.6 173.4
7.5 792.7
*1971-2000 climate normals Table B-60. Toronto minimum daily air temperature Climate Change Scenario STATISTIC (°C) Baseline* CGCM2A2x* HadCM3B21* Mean 2.4 6.1 4.8 Standard Deviation 9.9 9.1 10.0 Minimum -33.2 -27.4 -31.0 Lower Quartile -4.9 -0.6 -2.5 Median 3.0 6.5 5.4 Upper Quartile 10.5 13.5 13.0 Maximum 28.0 30.9 30.6 *n=54750 Table B-61. Toronto 7-day mean maximum daily air temperature Climate Change Scenario STATISTIC (°C) Baseline* CGCM2A2x* HadCM3B21* Mean 12.5 15.5 15.0 Standard Deviation 10.6 10.6 11.2 Minimum -15.0 -12.3 -13.5 Lower Quartile 3.0 5.9 4.9 Median 12.8 16.1 15.4 Upper Quartile 22.4 25.4 25.4 Maximum 34.1 37.6 37.6 *n=54750
0
2000
4000
6000
8000
10000
12000
-40 -35 -30 -25 -20 -15 -10 -5 0 5 10 15 20 25 30
Daily Minimum Temperature (°C)
Coun
t (da
ys)
Baseline CGCM2A2x HADCM2B21
Figure B-180. Toronto minimum daily temperature distribution (n=54750)
0102030405060708090
100
-40 -35 -30 -25 -20 -15 -10 -5 0 5 10 15 20 25 30
Daily Minimum Temperature (°C)
Cum
ulat
ive
Per
cent
Baseline CGCM2A2x HADCM2B21
Figure B-181. Toronto minimum daily temperature cumulative percent distribution (n=54750)

The Road Well-traveled: Implications of Climate Change for Pavement Infrastructure in Southern Canada 154
-60
-50
-40
-30
-20
-10
0
10
20
30
40
Base CGCM2A2x HADCM3B21
Daily
Min
imum
Tem
pera
ture
(°C)
Minimum 25% Quartile Median 75% Quartile Maximum
Figure B-182. Toronto minimum daily temperature distribution: quartile statistics (n=54750)
0
2000
4000
6000
8000
10000
12000
-35 -30 -25 -20 -15 -10 -5 0 5 10 15 20 25 30 35 40
7-day Mean Maximum Temperature (°C)
Cou
nt (d
ays)
Baseline CGCM2A2x HADCM2B21
Figure B-183. Toronto 7-day mean maximum daily temperature distribution (n=54750)
0102030405060708090
100
-35 -30 -25 -20 -15 -10 -5 0 5 10 15 20 25 30 35 40
7-day Maximum Temperature Range (°C)
Cum
ulat
ive
Perc
ent
Baseline CGCM2A2x HADCM2B21
Figure B-184. Toronto 7-day mean maximum daily temperature cumulative percent distribution (n=54750)
-40
-30
-20
-10
0
10
20
30
40
50
Base CGCM2A2x HADCM3B217-
day
Max
imum
Tem
pera
ture
(°C
)
Minimum 25% Quartile Median 75% Quartile Maximum
Figure B-185. Toronto 7-day mean maximum daily temperature distribution: quartile statistics (n=54750)
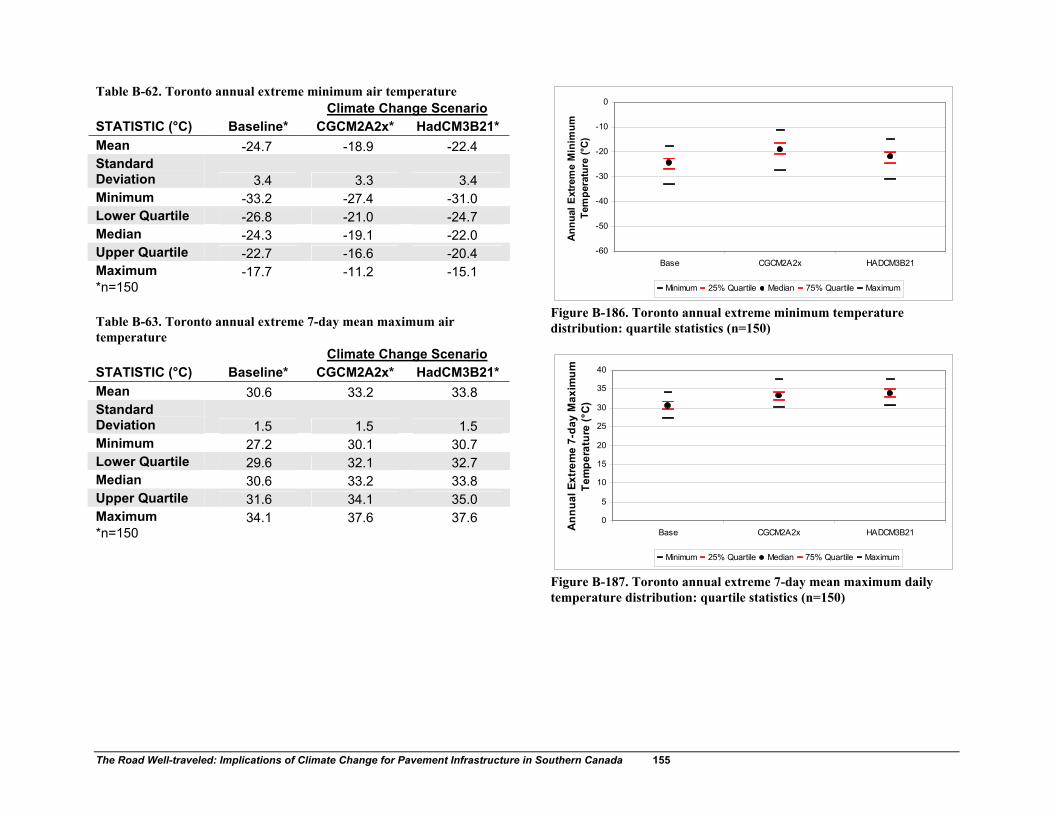
The Road Well-traveled: Implications of Climate Change for Pavement Infrastructure in Southern Canada 155
Table B-62. Toronto annual extreme minimum air temperature Climate Change Scenario STATISTIC (°C) Baseline* CGCM2A2x* HadCM3B21* Mean -24.7 -18.9 -22.4 Standard Deviation 3.4 3.3 3.4 Minimum -33.2 -27.4 -31.0 Lower Quartile -26.8 -21.0 -24.7 Median -24.3 -19.1 -22.0 Upper Quartile -22.7 -16.6 -20.4 Maximum -17.7 -11.2 -15.1 *n=150 Table B-63. Toronto annual extreme 7-day mean maximum air temperature Climate Change Scenario STATISTIC (°C) Baseline* CGCM2A2x* HadCM3B21* Mean 30.6 33.2 33.8 Standard Deviation 1.5 1.5 1.5 Minimum 27.2 30.1 30.7 Lower Quartile 29.6 32.1 32.7 Median 30.6 33.2 33.8 Upper Quartile 31.6 34.1 35.0 Maximum 34.1 37.6 37.6 *n=150
-60
-50
-40
-30
-20
-10
0
Base CGCM2A2x HADCM3B21
Ann
ual E
xtre
me
Min
imum
Te
mpe
ratu
re (°
C)
Minimum 25% Quartile Median 75% Quartile Maximum
Figure B-186. Toronto annual extreme minimum temperature distribution: quartile statistics (n=150)
0
5
10
15
20
25
30
35
40
Base CGCM2A2x HADCM3B21Ann
ual E
xtre
me
7-da
y M
axim
um
Tem
pera
ture
(°C
)
Minimum 25% Quartile Median 75% Quartile Maximum
Figure B-187. Toronto annual extreme 7-day mean maximum daily temperature distribution: quartile statistics (n=150)

The Road Well-traveled: Implications of Climate Change for Pavement Infrastructure in Southern Canada 156
Table B-64. Toronto Performance Grade (PG) design pavement temperature summary Climate Change Scenario STATISTIC Baselin
e CGCM2A2x HadCM3B21
Superpave-derived low PG threshold (°C) -24.8 -20.5 -23.2 Superpave-derived high PG threshold (°C) 55.0 57.0 57.5 98th percentile annual minimum air temperature -32.4 -26.2 -30.1 Ontario RWIS-based low PG threshold (°C) -26.4 -21.8 -24.8 98th percentile annual extreme 7-day mean maximum air temperature 33.9 36.5 36.8 Ontario RWIS-based high PG threshold (°C) 50.8 55.1 55.6
-50.0-40.0-30.0-20.0-10.0
0.010.020.030.040.050.060.0
Base CGCM2A2x HADCM3B21
Des
ign
(98%
rel
iabi
lity)
Min
imum
/7-
day
Mea
n P
avem
ent T
empe
ratu
re
(°C)
SuperpaveTmax-98%annual SuperpaveTmin-98% annual
Ontario RWIS Tmax-98%annual Ontario RWIS Tmin-98% annual
Figure B-188. Toronto estimated low and high Performance Grade (PG) temperature ratings (design 98% reliability minimum and 7-day mean maximum temperatures)
Table B-65. Toronto freeze season length Climate Change Scenario STATISTIC (days)
Baseline* CGCM2A2x* HadCM3B21*
Mean 55.4 6.5 29.6 Standard Deviation 21.7 10.2 17.4 Minimum 4.0 0.0 0.0 Lower Quartile 41.8 0.0 17.0 Median 60.5 0.0 30.0 Upper Quartile 72.8 9.8 42.0 Maximum 95.0 47.0 78.0 *n=150
0
50
100
150
200
250
0 50 100 150 200
Days to Critical FreezeDa
ys to
Crit
ical
Tha
w
Baseline CGCM2A2x-2040-2069 HADCM3B21-2040-2069
Figure B-189. Toronto estimated number of days to Critical Freeze Index (FI) and Thaw Index (TI)

The Road Well-traveled: Implications of Climate Change for Pavement Infrastructure in Southern Canada 157
0.0
10.0
20.0
30.0
40.0
50.0
60.0
70.0
80.0
90.0
100.0
Base CGCM2A2x HADCM3B21
Free
ze S
easo
n Le
ngth
(day
s)
Minimum 25% Quartile Median 75% Quartile Maximum
Figure B-190. Toronto estimated freeze season length distribution: quartile statistics (n=150)
020406080
100120140160
1 3 5 7 9 11 13 15 17 19 21 23 25 27 29 31 33 35 37 39 41 43 45 47 49
Season
Days
to C
ritic
al F
reez
e
Base1 Base2 Base3
Figure B-191. Toronto estimated days to critical FI (baseline series)
020406080
100120140160180
1 3 5 7 9 11 13 15 17 19 21 23 25 27 29 31 33 35 37 39 41 43 45 47 49
Season
Days
to C
ritic
al F
reez
e
CGCM2A2xWG1 CGCM2A2xWG2 CGCM2A2xWG3
Figure B-192. Toronto estimated days to critical FI (CGCM2A2x scenario series)
020406080
100120140160180
1 3 5 7 9 11 13 15 17 19 21 23 25 27 29 31 33 35 37 39 41 43 45 47 49
SeasonD
ays
to C
ritic
al F
reez
e
HADCM3B21WG1 HADCM3B21WG2 HADCM3B21WG3
Figure B-193. Toronto estimated days to critical FI (HadCM3B21 scenario series)
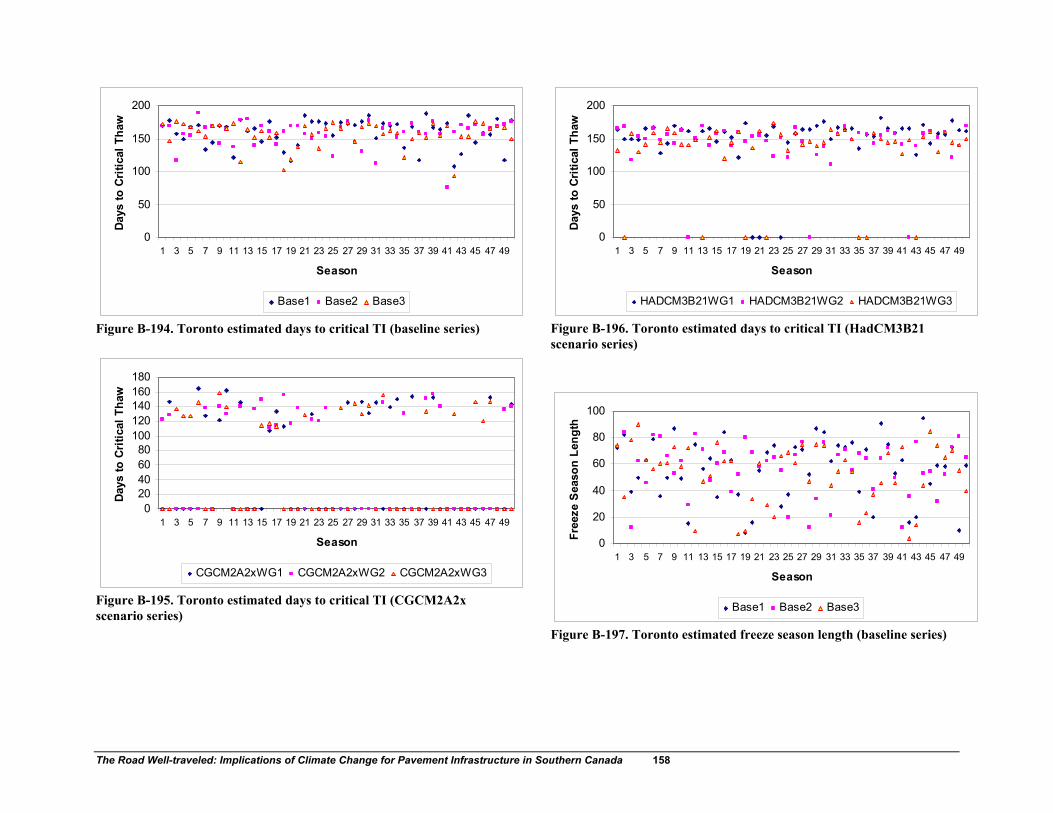
The Road Well-traveled: Implications of Climate Change for Pavement Infrastructure in Southern Canada 158
0
50
100
150
200
1 3 5 7 9 11 13 15 17 19 21 23 25 27 29 31 33 35 37 39 41 43 45 47 49
Season
Days
to C
ritic
al T
haw
Base1 Base2 Base3
Figure B-194. Toronto estimated days to critical TI (baseline series)
020406080
100120140160180
1 3 5 7 9 11 13 15 17 19 21 23 25 27 29 31 33 35 37 39 41 43 45 47 49
Season
Days
to C
ritic
al T
haw
CGCM2A2xWG1 CGCM2A2xWG2 CGCM2A2xWG3
Figure B-195. Toronto estimated days to critical TI (CGCM2A2x scenario series)
0
50
100
150
200
1 3 5 7 9 11 13 15 17 19 21 23 25 27 29 31 33 35 37 39 41 43 45 47 49
Season
Days
to C
ritic
al T
haw
HADCM3B21WG1 HADCM3B21WG2 HADCM3B21WG3
Figure B-196. Toronto estimated days to critical TI (HadCM3B21 scenario series)
0
20
40
60
80
100
1 3 5 7 9 11 13 15 17 19 21 23 25 27 29 31 33 35 37 39 41 43 45 47 49
SeasonFr
eeze
Sea
son
Leng
th
Base1 Base2 Base3
Figure B-197. Toronto estimated freeze season length (baseline series)

The Road Well-traveled: Implications of Climate Change for Pavement Infrastructure in Southern Canada 159
0
10
20
30
40
50
1 3 5 7 9 11 13 15 17 19 21 23 25 27 29 31 33 35 37 39 41 43 45 47 49
Season
Free
ze S
easo
n Le
ngth
CGCM2A2xWG1 CGCM2A2xWG2 CGCM2A2xWG3
Figure B-198. Toronto estimated freeze season length (CGCM2A2x scenario series)
0102030405060708090
1 3 5 7 9 11 13 15 17 19 21 23 25 27 29 31 33 35 37 39 41 43 45 47 49
Season
Free
ze S
easo
n Le
ngth
HADCM3B21WG1 HADCM3B21WG2 HADCM3B21WG3
Figure B-199. Toronto estimated freeze season length (HadCM3B21 scenario series)

The Road Well-traveled: Implications of Climate Change for Pavement Infrastructure in Southern Canada 160
CASE STUDY SITE: OTTAWA
City (MSC Observing
Station reference)
Lat Long Elevation (m)
Mean Annual Temperature*
(°C)
Mean Total Precipitation*
(mm)
Ottawa (6106000) 45.3 75.7 114.0
6.0 943.5
*1971-2000 climate normals Table B-66. Ottawa minimum daily air temperature Climate Change Scenario STATISTIC (°C) Baseline* CGCM2A2x* HadCM3B21* Mean 0.9 4.0 3.3 Standard Deviation 11.4 10.8 11.7 Minimum -41.8 -37.9 -39.6 Lower Quartile -7.6 -4.2 -5.3 Median 2.1 4.5 4.4 Upper Quartile 10.5 13.4 13.2 Maximum 25.8 28.2 28.9 *n=54750 Table B-67. Ottawa 7-day mean maximum daily air temperature Climate Change Scenario STATISTIC (°C) Baseline* CGCM2A2x* HadCM3B21* Mean 10.9 13.3 13.3 Standard Deviation 11.8 11.9 12.5 Minimum -18.4 -15.8 -17.2 Lower Quartile 0.4 2.3 2.0 Median 11.5 13.7 14.0 Upper Quartile 21.9 24.6 25.0 Maximum 34.9 37.0 38.3 *n=54750
0100020003000400050006000700080009000
10000
-40 -35 -30 -25 -20 -15 -10 -5 0 5 10 15 20 25 30
Daily Minimum Temperature (°C)
Coun
t (da
ys)
Baseline CGCM2A2x HADCM2B21
Figure B-200. Ottawa minimum daily temperature distribution (n=54750)
0102030405060708090
100
-40 -35 -30 -25 -20 -15 -10 -5 0 5 10 15 20 25 30
Daily Minimum Temperature (°C)
Cum
ulat
ive
Perc
ent
Baseline CGCM2A2x HADCM2B21
Figure B-201. Ottawa minimum daily temperature cumulative percent distribution (n=54750)

The Road Well-traveled: Implications of Climate Change for Pavement Infrastructure in Southern Canada 161
-60
-50
-40
-30
-20
-10
0
10
20
30
40
Base CGCM2A2x HADCM3B21
Daily
Min
imum
Tem
pera
ture
(°C)
Minimum 25% Quartile Median 75% Quartile Maximum
Figure B-202. Ottawa minimum daily temperature distribution: quartile statistics (n=54750)
0
2000
4000
6000
8000
10000
12000
-35 -30 -25 -20 -15 -10 -5 0 5 10 15 20 25 30 35 40
7-day Mean Maximum Temperature (°C)
Cou
nt (d
ays)
Baseline CGCM2A2x HADCM2B21
Figure B-203. Ottawa 7-day mean maximum daily temperature distribution (n=54750)
0102030405060708090
100
-35 -30 -25 -20 -15 -10 -5 0 5 10 15 20 25 30 35 40
7-day Maximum Temperature Range (°C)
Cum
ulat
ive
Perc
ent
Baseline CGCM2A2x HADCM2B21
Figure B-204. Ottawa 7-day mean maximum daily temperature cumulative percent distribution (n=54750)
-40
-30
-20
-10
0
10
20
30
40
50
Base CGCM2A2x HADCM3B217-
day
Max
imum
Tem
pera
ture
(°C)
Minimum 25% Quartile Median 75% Quartile Maximum
Figure B-205. Ottawa 7-day mean maximum daily temperature distribution: quartile statistics (n=54750)

The Road Well-traveled: Implications of Climate Change for Pavement Infrastructure in Southern Canada 162
Table B-68. Ottawa annual extreme minimum air temperature Climate Change Scenario STATISTIC (°C) Baseline* CGCM2A2x* HadCM3B21* Mean -30.3 -25.0 -28.4 Standard Deviation 3.4 3.3 3.4 Minimum -41.8 -37.9 -39.6 Lower Quartile -32.8 -27.4 -30.7 Median -29.9 -24.9 -28.2 Upper Quartile -27.9 -22.7 -25.9 Maximum -23.2 -18.0 -21.3 *n=150 Table B-69. Ottawa annual extreme 7-day mean maximum air temperature Climate Change Scenario STATISTIC (°C) Baseline* CGCM2A2x* HadCM3B21* Mean 30.2 32.6 33.6 Standard Deviation 1.6 1.6 1.6 Minimum 26.1 27.9 29.8 Lower Quartile 29.2 31.6 32.6 Median 30.1 32.5 33.5 Upper Quartile 31.1 33.6 34.6 Maximum 34.9 37.0 38.3 *n=150
-60
-50
-40
-30
-20
-10
0
Base CGCM2A2x HADCM3B21
Ann
ual E
xtre
me
Min
imum
Te
mpe
ratu
re (°
C)
Minimum 25% Quartile Median 75% Quartile Maximum
Figure B-206. Ottawa annual extreme minimum temperature distribution: quartile statistics (n=150)
0
5
10
15
20
25
30
35
40
45
Base CGCM2A2x HADCM3B21Ann
ual E
xtre
me
7-da
y M
axim
um
Tem
pera
ture
(°C
)
Minimum 25% Quartile Median 75% Quartile Maximum
Figure B-207. Ottawa annual extreme 7-day mean maximum daily temperature distribution: quartile statistics (n=150)

The Road Well-traveled: Implications of Climate Change for Pavement Infrastructure in Southern Canada 163
Table B-70. Ottawa Performance Grade (PG) design pavement temperature summary Climate Change Scenario STATISTIC Baselin
e CGCM2A2x HadCM3B21
Superpave-derived low PG threshold (°C) -29.5 -25.6 -28.1 Superpave-derived high PG threshold (°C) 54.4 56.3 57.0 98th percentile annual minimum air temperature -37.6 -31.8 -35.9 Ontario RWIS-based low PG threshold (°C) -30.0 -26.0 -28.9 98th percentile annual extreme 7-day mean maximum air temperature 33.4 36.0 37.1 Ontario RWIS-based high PG threshold (°C) 50.0 54.3 56.1
-50.0-40.0-30.0-20.0-10.0
0.010.020.030.040.050.060.0
Base CGCM2A2x HADCM3B21
Desi
gn (9
8% re
liabi
lity)
Min
imum
/7-
day
Mea
n Pa
vem
ent T
empe
ratu
re
(°C)
SuperpaveTmax-98%annual SuperpaveTmin-98% annual
Ontario RWIS Tmax-98%annual Ontario RWIS Tmin-98% annual
Figure B-208. Ottawa estimated low and high Performance Grade (PG) temperature ratings (design 98% reliability minimum and 7-day mean maximum temperatures)
Table B-71. Ottawa freeze season length Climate Change Scenario STATISTIC (days)
Baseline* CGCM2A2x* HadCM3B21*
Mean 87.3 49.9 68.8 Standard Deviation 20.4 25.0 19.8 Minimum 6.0 0.0 6.0 Lower Quartile 80.0 29.3 61.3 Median 91.0 51.0 71.5 Upper Quartile 98.8 70.8 82.0 Maximum 124.0 108.0 108.0 *n=150
0
50
100
150
200
250
0 50 100 150 200
Days to Critical Freeze
Days
to C
ritic
al T
haw
Baseline CGCM2A2x-2040-2069 HADCM3B21-2040-2069
Figure B-209. Ottawa estimated number of days to Critical Freeze Index (FI) and Thaw Index (TI)

The Road Well-traveled: Implications of Climate Change for Pavement Infrastructure in Southern Canada 164
0.0
20.0
40.0
60.0
80.0
100.0
120.0
140.0
Base CGCM2A2x HADCM3B21
Free
ze S
easo
n Le
ngth
(day
s)
Minimum 25% Quartile Median 75% Quartile Maximum
Figure B-210. Ottawa estimated freeze season length distribution: quartile statistics (n=150)
0
20
40
60
80
100
120
1 3 5 7 9 11 13 15 17 19 21 23 25 27 29 31 33 35 37 39 41 43 45 47 49
Season
Days
to C
ritic
al F
reez
e
Base1 Base2 Base3
Figure B-211. Ottawa estimated days to critical FI (baseline series)
020
406080
100
120140
1 3 5 7 9 11 13 15 17 19 21 23 25 27 29 31 33 35 37 39 41 43 45 47 49
Season
Day
s to
Cri
tical
Fre
eze
CGCM2A2xWG1 CGCM2A2xWG2 CGCM2A2xWG3
Figure B-212. Ottawa estimated days to critical FI (CGCM2A2x scenario series)
020406080
100120140160
1 3 5 7 9 11 13 15 17 19 21 23 25 27 29 31 33 35 37 39 41 43 45 47 49
Season
Days
to C
ritic
al F
reez
eHADCM3B21WG1 HADCM3B21WG2 HADCM3B21WG3
Figure B-213. Ottawa estimated days to critical FI (HadCM3B21 scenario series)

The Road Well-traveled: Implications of Climate Change for Pavement Infrastructure in Southern Canada 165
0
50
100
150
200
250
1 3 5 7 9 11 13 15 17 19 21 23 25 27 29 31 33 35 37 39 41 43 45 47 49
Season
Days
to C
ritic
al T
haw
Base1 Base2 Base3
Figure B-214. Ottawa estimated days to critical TI (baseline series)
0
50
100
150
200
250
1 3 5 7 9 11 13 15 17 19 21 23 25 27 29 31 33 35 37 39 41 43 45 47 49
Season
Days
to C
ritic
al T
haw
CGCM2A2xWG1 CGCM2A2xWG2 CGCM2A2xWG3
Figure B-215. Ottawa estimated days to critical TI (CGCM2A2x scenario series)
0
50
100
150
200
250
1 3 5 7 9 11 13 15 17 19 21 23 25 27 29 31 33 35 37 39 41 43 45 47 49
Season
Day
s to
Cri
tical
Tha
w
HADCM3B21WG1 HADCM3B21WG2 HADCM3B21WG3
Figure B-216. Ottawa estimated days to critical TI (HadCM3B21 scenario series)
0
2040
6080
100120
140
1 3 5 7 9 11 13 15 17 19 21 23 25 27 29 31 33 35 37 39 41 43 45 47 49
SeasonFr
eeze
Sea
son
Leng
thBase1 Base2 Base3
Figure B-217. Ottawa estimated freeze season length (baseline series)
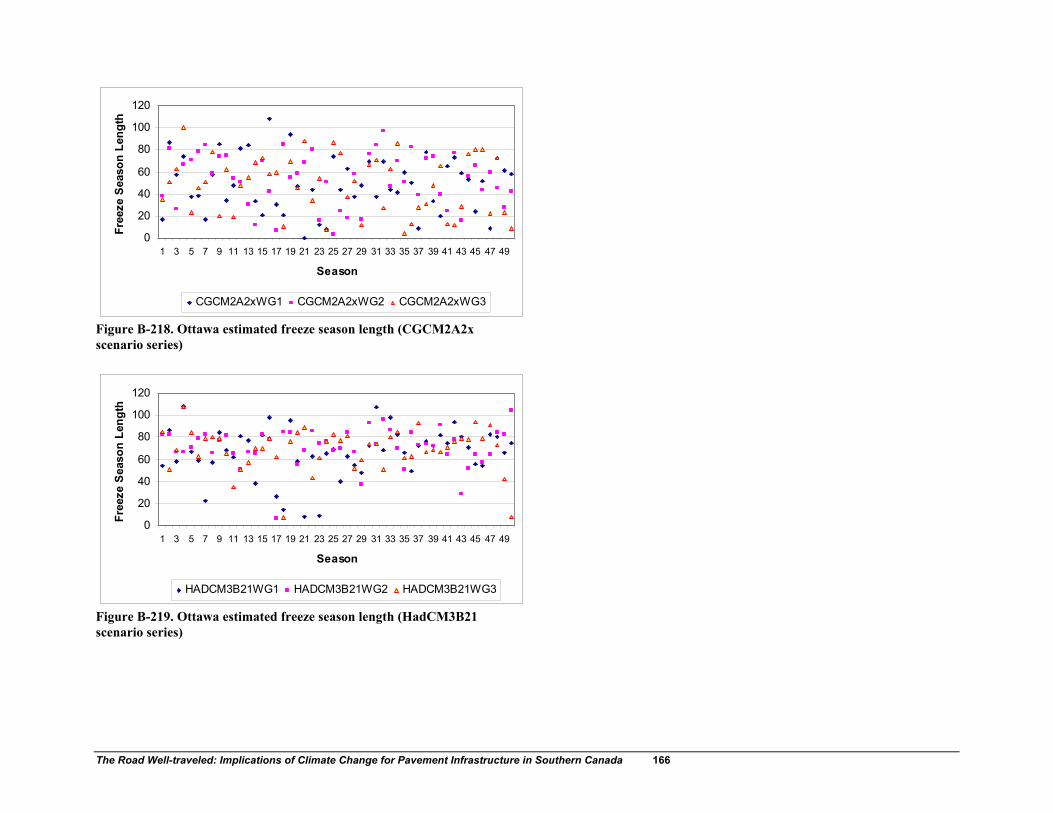
The Road Well-traveled: Implications of Climate Change for Pavement Infrastructure in Southern Canada 166
0
20
40
60
80
100
120
1 3 5 7 9 11 13 15 17 19 21 23 25 27 29 31 33 35 37 39 41 43 45 47 49
Season
Free
ze S
easo
n Le
ngth
CGCM2A2xWG1 CGCM2A2xWG2 CGCM2A2xWG3
Figure B-218. Ottawa estimated freeze season length (CGCM2A2x scenario series)
0
20
40
60
80
100
120
1 3 5 7 9 11 13 15 17 19 21 23 25 27 29 31 33 35 37 39 41 43 45 47 49
Season
Free
ze S
easo
n Le
ngth
HADCM3B21WG1 HADCM3B21WG2 HADCM3B21WG3
Figure B-219. Ottawa estimated freeze season length (HadCM3B21 scenario series)
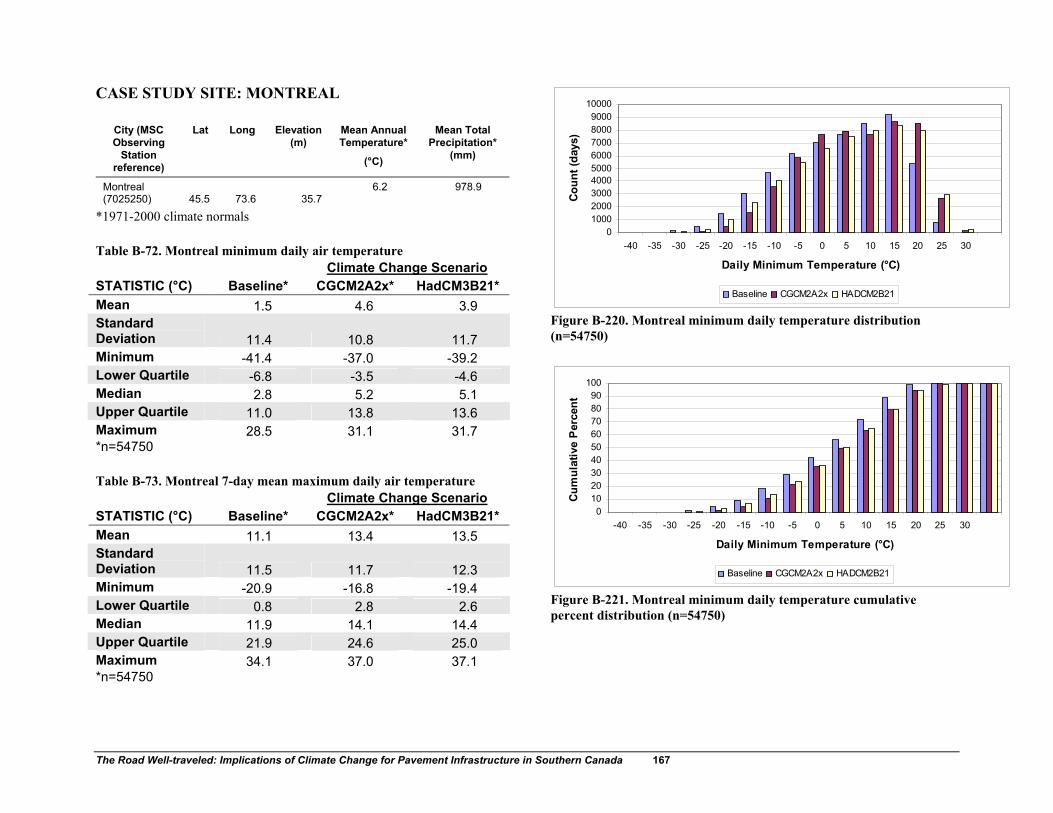
The Road Well-traveled: Implications of Climate Change for Pavement Infrastructure in Southern Canada 167
CASE STUDY SITE: MONTREAL
City (MSC Observing
Station reference)
Lat Long Elevation (m)
Mean Annual Temperature*
(°C)
Mean Total Precipitation*
(mm)
Montreal (7025250) 45.5 73.6 35.7
6.2 978.9
*1971-2000 climate normals Table B-72. Montreal minimum daily air temperature Climate Change Scenario STATISTIC (°C) Baseline* CGCM2A2x* HadCM3B21* Mean 1.5 4.6 3.9 Standard Deviation 11.4 10.8 11.7 Minimum -41.4 -37.0 -39.2 Lower Quartile -6.8 -3.5 -4.6 Median 2.8 5.2 5.1 Upper Quartile 11.0 13.8 13.6 Maximum 28.5 31.1 31.7 *n=54750 Table B-73. Montreal 7-day mean maximum daily air temperature Climate Change Scenario STATISTIC (°C) Baseline* CGCM2A2x* HadCM3B21* Mean 11.1 13.4 13.5 Standard Deviation 11.5 11.7 12.3 Minimum -20.9 -16.8 -19.4 Lower Quartile 0.8 2.8 2.6 Median 11.9 14.1 14.4 Upper Quartile 21.9 24.6 25.0 Maximum 34.1 37.0 37.1 *n=54750
0100020003000400050006000700080009000
10000
-40 -35 -30 -25 -20 -15 -10 -5 0 5 10 15 20 25 30
Daily Minimum Temperature (°C)
Coun
t (da
ys)
Baseline CGCM2A2x HADCM2B21
Figure B-220. Montreal minimum daily temperature distribution (n=54750)
0102030405060708090
100
-40 -35 -30 -25 -20 -15 -10 -5 0 5 10 15 20 25 30
Daily Minimum Temperature (°C)
Cum
ulat
ive
Per
cent
Baseline CGCM2A2x HADCM2B21
Figure B-221. Montreal minimum daily temperature cumulative percent distribution (n=54750)
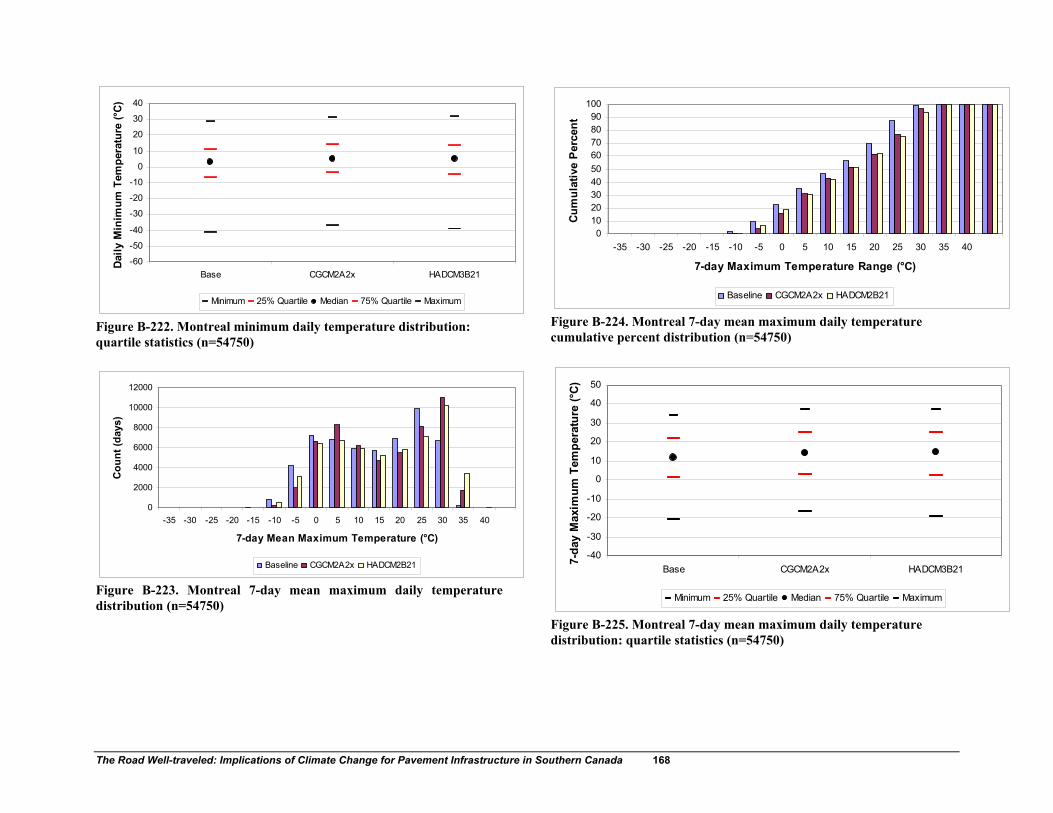
The Road Well-traveled: Implications of Climate Change for Pavement Infrastructure in Southern Canada 168
-60
-50
-40
-30
-20
-10
0
10
20
30
40
Base CGCM2A2x HADCM3B21
Daily
Min
imum
Tem
pera
ture
(°C)
Minimum 25% Quartile Median 75% Quartile Maximum
Figure B-222. Montreal minimum daily temperature distribution: quartile statistics (n=54750)
0
2000
4000
6000
8000
10000
12000
-35 -30 -25 -20 -15 -10 -5 0 5 10 15 20 25 30 35 40
7-day Mean Maximum Temperature (°C)
Cou
nt (d
ays)
Baseline CGCM2A2x HADCM2B21
Figure B-223. Montreal 7-day mean maximum daily temperature distribution (n=54750)
0102030405060708090
100
-35 -30 -25 -20 -15 -10 -5 0 5 10 15 20 25 30 35 40
7-day Maximum Temperature Range (°C)
Cum
ulat
ive
Perc
ent
Baseline CGCM2A2x HADCM2B21
Figure B-224. Montreal 7-day mean maximum daily temperature cumulative percent distribution (n=54750)
-40
-30
-20
-10
0
10
20
30
40
50
Base CGCM2A2x HADCM3B217-
day
Max
imum
Tem
pera
ture
(°C
)
Minimum 25% Quartile Median 75% Quartile Maximum
Figure B-225. Montreal 7-day mean maximum daily temperature distribution: quartile statistics (n=54750)

The Road Well-traveled: Implications of Climate Change for Pavement Infrastructure in Southern Canada 169
Table B-74. Montreal annual extreme minimum air temperature Climate Change Scenario STATISTIC (°C) Baseline* CGCM2A2x* HadCM3B21* Mean -29.8 -24.4 -27.9 Standard Deviation 3.9 3.7 3.9 Minimum -41.4 -37.0 -39.2 Lower Quartile -32.0 -26.4 -30.2 Median -29.7 -24.2 -27.7 Upper Quartile -27.0 -21.9 -25.1 Maximum -23.2 -17.0 -21.0 *n=150 Table B-75. Montreal annual extreme 7-day mean maximum air temperature Climate Change Scenario STATISTIC (°C) Baseline* CGCM2A2x* HadCM3B21* Mean 29.7 32.2 33.2 Standard Deviation 1.3 1.3 1.3 Minimum 27.3 29.8 30.5 Lower Quartile 28.7 31.4 32.2 Median 29.7 32.0 33.1 Upper Quartile 30.5 32.9 34.0 Maximum 34.1 37.0 37.1 *n=150
-60
-50
-40
-30
-20
-10
0
Base CGCM2A2x HADCM3B21
Ann
ual E
xtre
me
Min
imum
Te
mpe
ratu
re (°
C)
Minimum 25% Quartile Median 75% Quartile Maximum
Figure B-226. Montreal annual extreme minimum temperature distribution: quartile statistics (n=150)
0
5
10
15
20
25
30
35
40
Base CGCM2A2x HADCM3B21Ann
ual E
xtre
me
7-da
y M
axim
um
Tem
pera
ture
(°C
)
Minimum 25% Quartile Median 75% Quartile Maximum
Figure B-227. Montreal annual extreme 7-day mean maximum daily temperature distribution: quartile statistics (n=150)

The Road Well-traveled: Implications of Climate Change for Pavement Infrastructure in Southern Canada 170
Table B-76. Montreal Performance Grade (PG) design pavement temperature summary Climate Change Scenario STATISTIC Baselin
e CGCM2A2x HadCM3B21
Superpave-derived low PG threshold (°C) -29.8 -25.7 -28.4 Superpave-derived high PG threshold (°C) 53.8 55.7 56.5 98th percentile annual minimum air temperature -39.2 -33.8 -37.5 Ontario RWIS-based low PG threshold (°C) -31.1 -27.4 -30.0 98th percentile annual extreme 7-day mean maximum air temperature 33.0 35.2 36.5 Ontario RWIS-based high PG threshold (°C) 49.3 53.0 55.2
-50.0-40.0-30.0-20.0-10.0
0.010.020.030.040.050.060.0
Base CGCM2A2x HADCM3B21
Des
ign
(98%
rel
iabi
lity)
Min
imum
/7-
day
Mea
n P
avem
ent T
empe
ratu
re
(°C)
SuperpaveTmax-98%annual SuperpaveTmin-98% annual
Ontario RWIS Tmax-98%annual Ontario RWIS Tmin-98% annual
Figure B-228. Montreal estimated low and high Performance Grade (PG) temperature ratings (design 98% reliability minimum and 7-day mean maximum temperatures)
Table B-77. Montreal freeze season length Climate Change Scenario STATISTIC (days)
Baseline* CGCM2A2x* HadCM3B21*
Mean 82.4 39.5 62.5 Standard Deviation 19.0 22.5 19.9 Minimum 4.0 4.0 7.0 Lower Quartile 76.0 19.0 56.3 Median 87.0 36.5 67.0 Upper Quartile 93.0 58.8 76.0 Maximum 115.0 85.0 95.0 *n=150
0
50
100
150
200
250
0 50 100 150 200
Days to Critical FreezeDa
ys to
Crit
ical
Tha
w
Baseline CGCM2A2x-2040-2069 HADCM3B21-2040-2069
Figure B-229. Montreal estimated number of days to Critical Freeze Index (FI) and Thaw Index (TI)

The Road Well-traveled: Implications of Climate Change for Pavement Infrastructure in Southern Canada 171
0.0
20.0
40.0
60.0
80.0
100.0
120.0
140.0
Base CGCM2A2x HADCM3B21
Free
ze S
easo
n Le
ngth
(day
s)
Minimum 25% Quartile Median 75% Quartile Maximum
Figure B-230. Montreal estimated freeze season length distribution: quartile statistics (n=150)
0
20
40
60
80
100
120
1 3 5 7 9 11 13 15 17 19 21 23 25 27 29 31 33 35 37 39 41 43 45 47 49
Season
Days
to C
ritic
al F
reez
e
Base1 Base2 Base3
Figure B-231. Montreal estimated days to critical FI (baseline series)
020
406080
100
120140
1 3 5 7 9 11 13 15 17 19 21 23 25 27 29 31 33 35 37 39 41 43 45 47 49
Season
Days
to C
ritic
al F
reez
e
CGCM2A2xWG1 CGCM2A2xWG2 CGCM2A2xWG3
Figure B-232. Montreal estimated days to critical FI (CGCM2A2x scenario series)
020
406080
100
120140
1 3 5 7 9 11 13 15 17 19 21 23 25 27 29 31 33 35 37 39 41 43 45 47 49
SeasonDa
ys to
Crit
ical
Fre
eze
HADCM3B21WG1 HADCM3B21WG2 HADCM3B21WG3
Figure B-233. Montreal estimated days to critical FI (HadCM3B21 scenario series)

The Road Well-traveled: Implications of Climate Change for Pavement Infrastructure in Southern Canada 172
0
50
100
150
200
1 3 5 7 9 11 13 15 17 19 21 23 25 27 29 31 33 35 37 39 41 43 45 47 49
Season
Days
to C
ritic
al T
haw
Base1 Base2 Base3
Figure B-234. Montreal estimated days to critical TI (baseline series)
0
50
100
150
200
1 3 5 7 9 11 13 15 17 19 21 23 25 27 29 31 33 35 37 39 41 43 45 47 49
Season
Days
to C
ritic
al T
haw
CGCM2A2xWG1 CGCM2A2xWG2 CGCM2A2xWG3
Figure B-235. Montreal estimated days to critical TI (CGCM2A2x scenario series)
0
50
100
150
200
1 3 5 7 9 11 13 15 17 19 21 23 25 27 29 31 33 35 37 39 41 43 45 47 49
Season
Days
to C
ritic
al T
haw
HADCM3B21WG1 HADCM3B21WG2 HADCM3B21WG3
Figure B-236. Montreal estimated days to critical TI (HadCM3B21 scenario series)
0
2040
6080
100120
140
1 3 5 7 9 11 13 15 17 19 21 23 25 27 29 31 33 35 37 39 41 43 45 47 49
SeasonFr
eeze
Sea
son
Leng
th
Base1 Base2 Base3
Figure B-237. Montreal estimated freeze season length (baseline series)

The Road Well-traveled: Implications of Climate Change for Pavement Infrastructure in Southern Canada 173
0102030405060708090
1 3 5 7 9 11 13 15 17 19 21 23 25 27 29 31 33 35 37 39 41 43 45 47 49
Season
Free
ze S
easo
n Le
ngth
CGCM2A2xWG1 CGCM2A2xWG2 CGCM2A2xWG3
Figure B-238. Montreal estimated freeze season length (CGCM2A2x scenario series)
0
20
40
60
80
100
1 3 5 7 9 11 13 15 17 19 21 23 25 27 29 31 33 35 37 39 41 43 45 47 49
Season
Free
ze S
easo
n Le
ngth
HADCM3B21WG1 HADCM3B21WG2 HADCM3B21WG3
Figure B-239. Montreal estimated freeze season length (HadCM3B21 scenario series)

The Road Well-traveled: Implications of Climate Change for Pavement Infrastructure in Southern Canada 174
CASE STUDY SITE: QUEBEC
City (MSC Observing
Station reference)
Lat Long Elevation (m)
Mean Annual Temperature*
(°C)
Mean Total Precipitation*
(mm)
Quebec (7016294) 46.8 71.2 74.4
4.0 1207.7
*1971-2000 climate normals Table B-78. Quebec minimum daily air temperature Climate Change Scenario STATISTIC (°C) Baseline* CGCM2A2x* HadCM3B21* Mean -0.9 2.1 1.6 Standard Deviation 11.5 10.9 11.5 Minimum -42.8 -36.6 -40.4 Lower Quartile -9.3 -6.1 -6.8 Median 0.7 2.9 2.9 Upper Quartile 8.5 11.4 11.0 Maximum 26.4 28.9 29.5 *n=54750 Table B-79. Quebec 7-day mean maximum daily air temperature Climate Change Scenario STATISTIC (°C) Baseline* CGCM2A2x* HadCM3B21* Mean 9.1 11.3 11.4 Standard Deviation 11.7 11.9 12.2 Minimum -23.8 -21.6 -22.0 Lower Quartile -1.5 0.2 0.3 Median 9.5 11.7 11.8 Upper Quartile 20.0 22.7 22.9 Maximum 32.0 35.1 34.8 *n=54750
0
2000
4000
6000
8000
10000
12000
-40 -35 -30 -25 -20 -15 -10 -5 0 5 10 15 20 25 30
Daily Minimum Temperature (°C)
Cou
nt (d
ays)
Baseline CGCM2A2x HADCM2B21
Figure B-240. Quebec minimum daily temperature distribution (n=54750)
0102030405060708090
100
-40 -35 -30 -25 -20 -15 -10 -5 0 5 10 15 20 25 30
Daily Minimum Temperature (°C)
Cum
ulat
ive
Perc
ent
Baseline CGCM2A2x HADCM2B21
Figure B-241. Quebec minimum daily temperature cumulative percent distribution (n=54750)

The Road Well-traveled: Implications of Climate Change for Pavement Infrastructure in Southern Canada 175
-60
-50
-40
-30
-20
-10
0
10
20
30
40
Base CGCM2A2x HADCM3B21
Daily
Min
imum
Tem
pera
ture
(°C)
Minimum 25% Quartile Median 75% Quartile Maximum
Figure B-242. Quebec minimum daily temperature distribution: quartile statistics (n=54750)
0
2000
4000
6000
8000
10000
12000
-35 -30 -25 -20 -15 -10 -5 0 5 10 15 20 25 30 35 40
7-day Mean Maximum Temperature (°C)
Cou
nt (d
ays)
Baseline CGCM2A2x HADCM2B21
Figure B-243. Quebec 7-day mean maximum daily temperature distribution (n=54750)
0102030405060708090
100
-35 -30 -25 -20 -15 -10 -5 0 5 10 15 20 25 30 35 40
7-day Maximum Temperature Range (°C)
Cum
ulat
ive
Per
cent
Baseline CGCM2A2x HADCM2B21
Figure B-244. Quebec 7-day mean maximum daily temperature cumulative percent distribution (n=54750)
-40
-30
-20
-10
0
10
20
30
40
50
Base CGCM2A2x HADCM3B217-
day
Max
imum
Tem
pera
ture
(°C
)
Minimum 25% Quartile Median 75% Quartile Maximum
Figure B-245. Quebec 7-day mean maximum daily temperature distribution: quartile statistics (n=54750)

The Road Well-traveled: Implications of Climate Change for Pavement Infrastructure in Southern Canada 176
Table B-80. Quebec annual extreme minimum air temperature Climate Change Scenario STATISTIC (°C) Baseline* CGCM2A2x* HadCM3B21* Mean -33.2 -27.5 -30.6 Standard Deviation 3.7 3.5 3.7 Minimum -42.8 -36.6 -40.4 Lower Quartile -35.2 -29.3 -32.8 Median -32.6 -26.8 -30.1 Upper Quartile -30.6 -25.6 -28.2 Maximum -23.7 -20.3 -21.4 *n=150 Table B-81. Quebec annual extreme 7-day mean maximum air temperature Climate Change Scenario STATISTIC (°C) Baseline* CGCM2A2x* HadCM3B21* Mean 28.5 31.1 31.5 Standard Deviation 1.3 1.4 1.3 Minimum 25.2 28.2 28.1 Lower Quartile 27.6 30.1 30.6 Median 28.5 31.1 31.5 Upper Quartile 29.3 32.0 32.4 Maximum 32.0 35.1 34.8 *n=150
-60
-50
-40
-30
-20
-10
0
Base CGCM2A2x HADCM3B21
Ann
ual E
xtre
me
Min
imum
Te
mpe
ratu
re (°
C)
Minimum 25% Quartile Median 75% Quartile Maximum
Figure B-246. Quebec annual extreme minimum temperature distribution: quartile statistics (n=150)
0
5
10
15
20
25
30
35
40
Base CGCM2A2x HADCM3B21Ann
ual E
xtre
me
7-da
y M
axim
um
Tem
pera
ture
(°C
)
Minimum 25% Quartile Median 75% Quartile Maximum
Figure B-247. Quebec annual extreme 7-day mean maximum daily temperature distribution: quartile statistics (n=150)
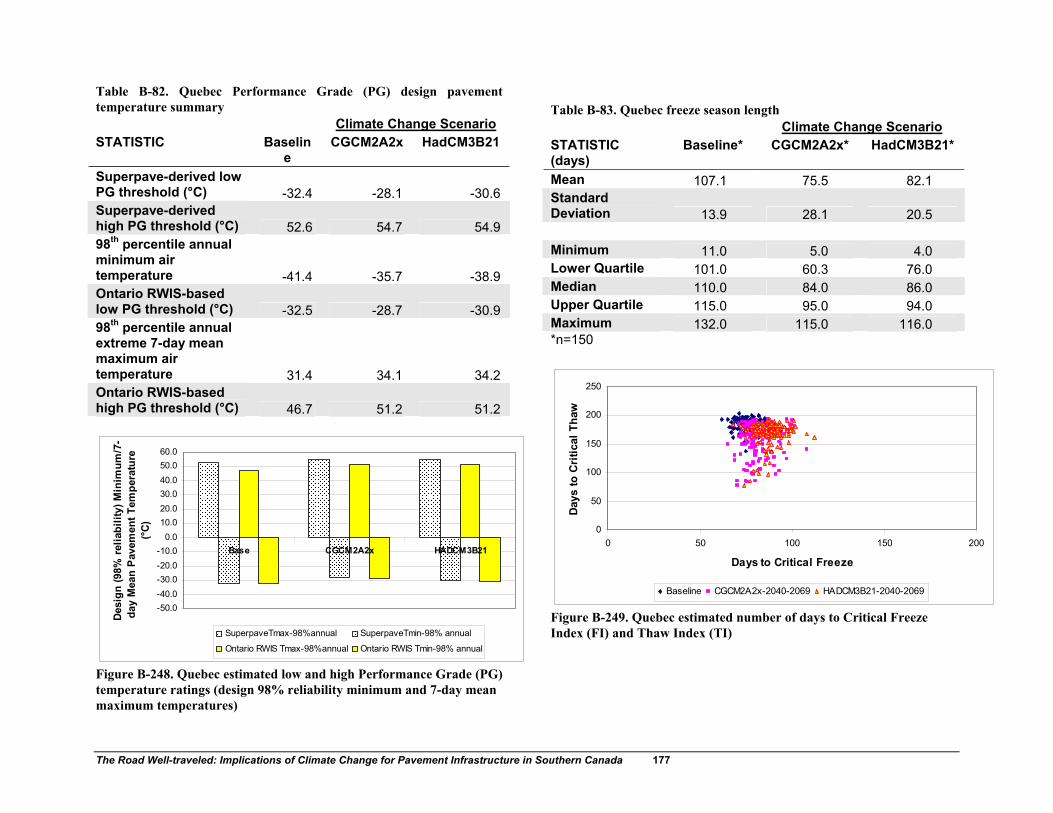
The Road Well-traveled: Implications of Climate Change for Pavement Infrastructure in Southern Canada 177
Table B-82. Quebec Performance Grade (PG) design pavement temperature summary Climate Change Scenario STATISTIC Baselin
e CGCM2A2x HadCM3B21
Superpave-derived low PG threshold (°C) -32.4 -28.1 -30.6 Superpave-derived high PG threshold (°C) 52.6 54.7 54.9 98th percentile annual minimum air temperature -41.4 -35.7 -38.9 Ontario RWIS-based low PG threshold (°C) -32.5 -28.7 -30.9 98th percentile annual extreme 7-day mean maximum air temperature 31.4 34.1 34.2 Ontario RWIS-based high PG threshold (°C) 46.7 51.2 51.2
-50.0-40.0-30.0-20.0-10.0
0.010.020.030.040.050.060.0
Base CGCM2A2x HADCM3B21
Des
ign
(98%
rel
iabi
lity)
Min
imum
/7-
day
Mea
n P
avem
ent T
empe
ratu
re
(°C)
SuperpaveTmax-98%annual SuperpaveTmin-98% annual
Ontario RWIS Tmax-98%annual Ontario RWIS Tmin-98% annual
Figure B-248. Quebec estimated low and high Performance Grade (PG) temperature ratings (design 98% reliability minimum and 7-day mean maximum temperatures)
Table B-83. Quebec freeze season length Climate Change Scenario STATISTIC (days)
Baseline* CGCM2A2x* HadCM3B21*
Mean 107.1 75.5 82.1 Standard Deviation 13.9 28.1 20.5 Minimum 11.0 5.0 4.0 Lower Quartile 101.0 60.3 76.0 Median 110.0 84.0 86.0 Upper Quartile 115.0 95.0 94.0 Maximum 132.0 115.0 116.0 *n=150
0
50
100
150
200
250
0 50 100 150 200
Days to Critical FreezeDa
ys to
Cri
tical
Tha
wBaseline CGCM2A2x-2040-2069 HADCM3B21-2040-2069
Figure B-249. Quebec estimated number of days to Critical Freeze Index (FI) and Thaw Index (TI)
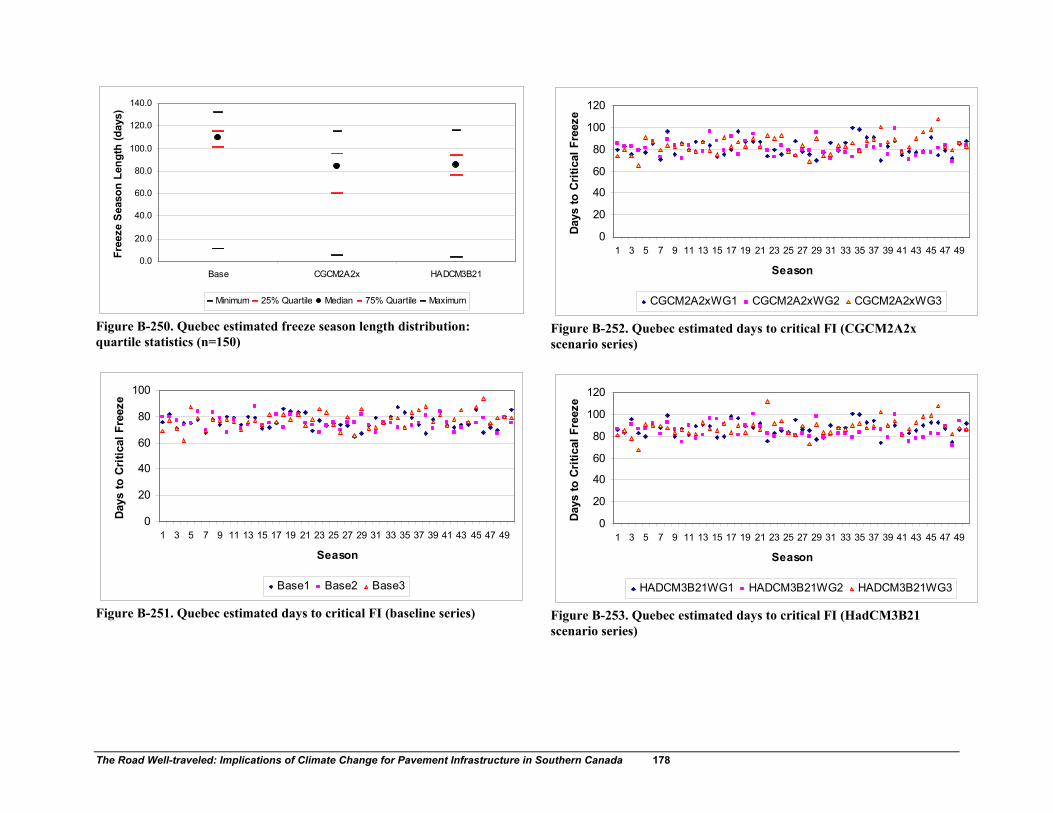
The Road Well-traveled: Implications of Climate Change for Pavement Infrastructure in Southern Canada 178
0.0
20.0
40.0
60.0
80.0
100.0
120.0
140.0
Base CGCM2A2x HADCM3B21
Free
ze S
easo
n Le
ngth
(day
s)
Minimum 25% Quartile Median 75% Quartile Maximum
Figure B-250. Quebec estimated freeze season length distribution: quartile statistics (n=150)
0
20
40
60
80
100
1 3 5 7 9 11 13 15 17 19 21 23 25 27 29 31 33 35 37 39 41 43 45 47 49
Season
Days
to C
ritic
al F
reez
e
Base1 Base2 Base3
Figure B-251. Quebec estimated days to critical FI (baseline series)
0
20
40
60
80
100
120
1 3 5 7 9 11 13 15 17 19 21 23 25 27 29 31 33 35 37 39 41 43 45 47 49
Season
Days
to C
ritic
al F
reez
e
CGCM2A2xWG1 CGCM2A2xWG2 CGCM2A2xWG3
Figure B-252. Quebec estimated days to critical FI (CGCM2A2x scenario series)
0
20
40
60
80
100
120
1 3 5 7 9 11 13 15 17 19 21 23 25 27 29 31 33 35 37 39 41 43 45 47 49
SeasonDa
ys to
Crit
ical
Fre
eze
HADCM3B21WG1 HADCM3B21WG2 HADCM3B21WG3
Figure B-253. Quebec estimated days to critical FI (HadCM3B21 scenario series)
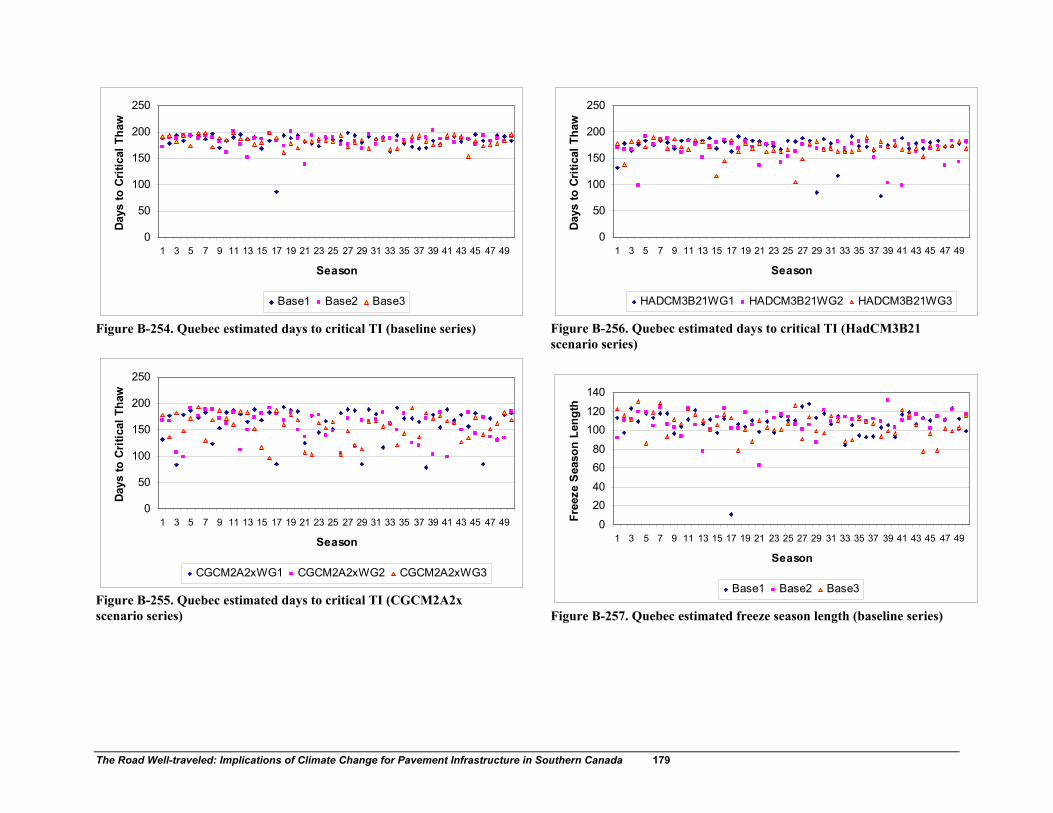
The Road Well-traveled: Implications of Climate Change for Pavement Infrastructure in Southern Canada 179
0
50
100
150
200
250
1 3 5 7 9 11 13 15 17 19 21 23 25 27 29 31 33 35 37 39 41 43 45 47 49
Season
Days
to C
ritic
al T
haw
Base1 Base2 Base3
Figure B-254. Quebec estimated days to critical TI (baseline series)
0
50
100
150
200
250
1 3 5 7 9 11 13 15 17 19 21 23 25 27 29 31 33 35 37 39 41 43 45 47 49
Season
Days
to C
ritic
al T
haw
CGCM2A2xWG1 CGCM2A2xWG2 CGCM2A2xWG3
Figure B-255. Quebec estimated days to critical TI (CGCM2A2x scenario series)
0
50
100
150
200
250
1 3 5 7 9 11 13 15 17 19 21 23 25 27 29 31 33 35 37 39 41 43 45 47 49
Season
Days
to C
ritic
al T
haw
HADCM3B21WG1 HADCM3B21WG2 HADCM3B21WG3
Figure B-256. Quebec estimated days to critical TI (HadCM3B21 scenario series)
0
2040
6080
100120
140
1 3 5 7 9 11 13 15 17 19 21 23 25 27 29 31 33 35 37 39 41 43 45 47 49
SeasonFr
eeze
Sea
son
Leng
thBase1 Base2 Base3
Figure B-257. Quebec estimated freeze season length (baseline series)

The Road Well-traveled: Implications of Climate Change for Pavement Infrastructure in Southern Canada 180
0
2040
6080
100120
140
1 3 5 7 9 11 13 15 17 19 21 23 25 27 29 31 33 35 37 39 41 43 45 47 49
Season
Free
ze S
easo
n Le
ngth
CGCM2A2xWG1 CGCM2A2xWG2 CGCM2A2xWG3
Figure B-258. Quebec estimated freeze season length (CGCM2A2x scenario series)
0
2040
6080
100120
140
1 3 5 7 9 11 13 15 17 19 21 23 25 27 29 31 33 35 37 39 41 43 45 47 49
Season
Free
ze S
easo
n Le
ngth
HADCM3B21WG1 HADCM3B21WG2 HADCM3B21WG3
Figure B-259. Quebec estimated freeze season length (HadCM3B21 scenario series)
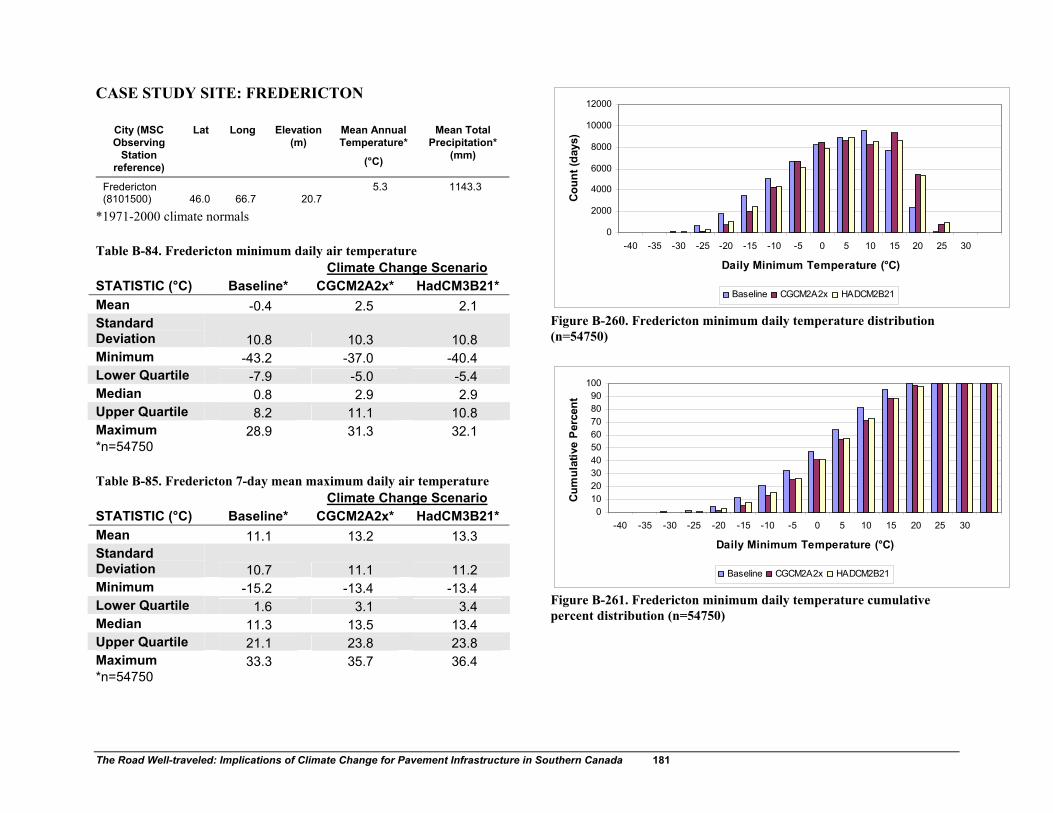
The Road Well-traveled: Implications of Climate Change for Pavement Infrastructure in Southern Canada 181
CASE STUDY SITE: FREDERICTON
City (MSC Observing
Station reference)
Lat Long Elevation (m)
Mean Annual Temperature*
(°C)
Mean Total Precipitation*
(mm)
Fredericton (8101500) 46.0 66.7 20.7
5.3 1143.3
*1971-2000 climate normals Table B-84. Fredericton minimum daily air temperature Climate Change Scenario STATISTIC (°C) Baseline* CGCM2A2x* HadCM3B21* Mean -0.4 2.5 2.1 Standard Deviation 10.8 10.3 10.8 Minimum -43.2 -37.0 -40.4 Lower Quartile -7.9 -5.0 -5.4 Median 0.8 2.9 2.9 Upper Quartile 8.2 11.1 10.8 Maximum 28.9 31.3 32.1 *n=54750 Table B-85. Fredericton 7-day mean maximum daily air temperature Climate Change Scenario STATISTIC (°C) Baseline* CGCM2A2x* HadCM3B21* Mean 11.1 13.2 13.3 Standard Deviation 10.7 11.1 11.2 Minimum -15.2 -13.4 -13.4 Lower Quartile 1.6 3.1 3.4 Median 11.3 13.5 13.4 Upper Quartile 21.1 23.8 23.8 Maximum 33.3 35.7 36.4 *n=54750
0
2000
4000
6000
8000
10000
12000
-40 -35 -30 -25 -20 -15 -10 -5 0 5 10 15 20 25 30
Daily Minimum Temperature (°C)
Cou
nt (d
ays)
Baseline CGCM2A2x HADCM2B21
Figure B-260. Fredericton minimum daily temperature distribution (n=54750)
0102030405060708090
100
-40 -35 -30 -25 -20 -15 -10 -5 0 5 10 15 20 25 30
Daily Minimum Temperature (°C)
Cum
ulat
ive
Perc
ent
Baseline CGCM2A2x HADCM2B21
Figure B-261. Fredericton minimum daily temperature cumulative percent distribution (n=54750)

The Road Well-traveled: Implications of Climate Change for Pavement Infrastructure in Southern Canada 182
-60
-50
-40
-30
-20
-10
0
10
20
30
40
Base CGCM2A2x HADCM3B21
Daily
Min
imum
Tem
pera
ture
(°C)
Minimum 25% Quartile Median 75% Quartile Maximum
Figure B-262. Fredericton minimum daily temperature distribution: quartile statistics (n=54750)
0
2000
4000
6000
8000
10000
12000
-35 -30 -25 -20 -15 -10 -5 0 5 10 15 20 25 30 35 40
7-day Mean Maximum Temperature (°C)
Cou
nt (d
ays)
Baseline CGCM2A2x HADCM2B21
Figure B-263. Fredericton 7-day mean maximum daily temperature distribution (n=54750)
0102030405060708090
100
-35 -30 -25 -20 -15 -10 -5 0 5 10 15 20 25 30 35 40
7-day Maximum Temperature Range (°C)
Cum
ulat
ive
Perc
ent
Baseline CGCM2A2x HADCM2B21
Figure B-264. Fredericton 7-day mean maximum daily temperature cumulative percent distribution (n=54750)
-40
-30
-20
-10
0
10
20
30
40
50
Base CGCM2A2x HADCM3B21
7-da
y M
axim
um T
empe
ratu
re (°
C)Minimum 25% Quartile Median 75% Quartile Maximum
Figure B-265. Fredericton 7-day mean maximum daily temperature distribution: quartile statistics (n=54750)

The Road Well-traveled: Implications of Climate Change for Pavement Infrastructure in Southern Canada 183
Table B-86. Fredericton annual extreme minimum air temperature Climate Change Scenario STATISTIC (°C) Baseline* CGCM2A2x* HadCM3B21* Mean -31.6 -26.2 -28.7 Standard Deviation 3.5 3.4 3.5 Minimum -43.2 -37.0 -40.4 Lower Quartile -34.0 -28.3 -31.1 Median -31.5 -25.8 -28.8 Upper Quartile -29.2 -23.9 -26.4 Maximum -22.1 -18.9 -19.3 *n=150 Table B-87. Fredericton annual extreme 7-day mean maximum air temperature Climate Change Scenario STATISTIC (°C) Baseline* CGCM2A2x* HadCM3B21* Mean 29.4 31.9 32.5 Standard Deviation 1.4 1.4 1.4 Minimum 26.0 28.2 29.1 Lower Quartile 28.5 30.9 31.5 Median 29.2 31.6 32.2 Upper Quartile 30.3 32.8 33.3 Maximum 33.3 35.7 36.4 *n=150
-60
-50
-40
-30
-20
-10
0
Base CGCM2A2x HADCM3B21
Ann
ual E
xtre
me
Min
imum
Te
mpe
ratu
re (°
C)
Minimum 25% Quartile Median 75% Quartile Maximum
Figure B-266. Fredericton annual extreme minimum temperature distribution: quartile statistics (n=150)
0
5
10
15
20
25
30
35
40
Base CGCM2A2x HADCM3B21Ann
ual E
xtre
me
7-da
y M
axim
um
Tem
pera
ture
(°C
)
Minimum 25% Quartile Median 75% Quartile Maximum
Figure B-267. Fredericton annual extreme 7-day mean maximum daily temperature distribution: quartile statistics (n=150)

The Road Well-traveled: Implications of Climate Change for Pavement Infrastructure in Southern Canada 184
Table B-88. Fredericton Performance Grade (PG) design pavement temperature summary Climate Change Scenario STATISTIC Baselin
e CGCM2A2x HadCM3B21
Superpave-derived low PG threshold (°C) -30.7 -26.7 -28.7 Superpave-derived high PG threshold (°C) 53.5 55.4 55.9 98th percentile annual minimum air temperature -39.2 -35.0 -36.4 Ontario RWIS-based low PG threshold (°C) -31.1 -28.3 -29.2 98th percentile annual extreme 7-day mean maximum air temperature 32.8 35.3 35.8 Ontario RWIS-based high PG threshold (°C) 48.9 53.1 54.0
-50.0-40.0-30.0-20.0-10.0
0.010.020.030.040.050.060.0
Base CGCM2A2x HADCM3B21
Des
ign
(98%
rel
iabi
lity)
Min
imum
/7-
day
Mea
n P
avem
ent T
empe
ratu
re
(°C)
SuperpaveTmax-98%annual SuperpaveTmin-98% annual
Ontario RWIS Tmax-98%annual Ontario RWIS Tmin-98% annual
Figure B-268. Fredericton estimated low and high Performance Grade (PG) temperature ratings (design 98% reliability minimum and 7-day mean maximum temperatures)
Table B-89. Fredericton freeze season length Climate Change Scenario STATISTIC (days)
Baseline* CGCM2A2x* HadCM3B21*
Mean 85.0 47.7 57.6 Standard Deviation 18.4 23.9 20.9 Minimum 7.0 5.0 7.0 Lower Quartile 78.0 27.5 46.3 Median 86.5 47.5 63.0 Upper Quartile 96.8 68.0 71.8 Maximum 118.0 104.0 102.0 *n=150
0
50
100
150
200
250
0 50 100 150 200
Days to Critical FreezeDa
ys to
Cri
tical
Tha
wBaseline CGCM2A2x-2040-2069 HADCM3B21-2040-2069
Figure B-269. Fredericton estimated number of days to Critical Freeze Index (FI) and Thaw Index (TI)

The Road Well-traveled: Implications of Climate Change for Pavement Infrastructure in Southern Canada 185
0.0
20.0
40.0
60.0
80.0
100.0
120.0
140.0
Base CGCM2A2x HADCM3B21
Free
ze S
easo
n Le
ngth
(day
s)
Minimum 25% Quartile Median 75% Quartile Maximum
Figure B-270. Fredericton estimated freeze season length distribution: quartile statistics (n=150)
0
20
40
60
80
100
120
1 3 5 7 9 11 13 15 17 19 21 23 25 27 29 31 33 35 37 39 41 43 45 47 49
Season
Days
to C
ritic
al F
reez
e
Base1 Base2 Base3
Figure B-271. Fredericton estimated days to critical FI (baseline series)
020406080
100120140160
1 3 5 7 9 11 13 15 17 19 21 23 25 27 29 31 33 35 37 39 41 43 45 47 49
Season
Day
s to
Crit
ical
Fre
eze
CGCM2A2xWG1 CGCM2A2xWG2 CGCM2A2xWG3
Figure B-272. Fredericton estimated days to critical FI (CGCM2A2x scenario series)
020406080
100120140160
1 3 5 7 9 11 13 15 17 19 21 23 25 27 29 31 33 35 37 39 41 43 45 47 49
SeasonDa
ys to
Crit
ical
Fre
eze
HADCM3B21WG1 HADCM3B21WG2 HADCM3B21WG3
Figure B-273. Fredericton estimated days to critical FI (HadCM3B21 scenario series)

The Road Well-traveled: Implications of Climate Change for Pavement Infrastructure in Southern Canada 186
0
50
100
150
200
250
1 3 5 7 9 11 13 15 17 19 21 23 25 27 29 31 33 35 37 39 41 43 45 47 49
Season
Days
to C
ritic
al T
haw
Base1 Base2 Base3
Figure B-274. Fredericton estimated days to critical TI (baseline series)
0
50
100
150
200
1 3 5 7 9 11 13 15 17 19 21 23 25 27 29 31 33 35 37 39 41 43 45 47 49
Season
Days
to C
ritic
al T
haw
CGCM2A2xWG1 CGCM2A2xWG2 CGCM2A2xWG3
Figure B-275. Fredericton estimated days to critical TI (CGCM2A2x scenario series)
0
50
100
150
200
1 3 5 7 9 11 13 15 17 19 21 23 25 27 29 31 33 35 37 39 41 43 45 47 49
Season
Day
s to
Cri
tical
Tha
w
HADCM3B21WG1 HADCM3B21WG2 HADCM3B21WG3
Figure B-276. Fredericton estimated days to critical TI (HadCM3B21 scenario series)
0
2040
6080
100120
140
1 3 5 7 9 11 13 15 17 19 21 23 25 27 29 31 33 35 37 39 41 43 45 47 49
SeasonFr
eeze
Sea
son
Leng
thBase1 Base2 Base3
Figure B-277. Fredericton estimated freeze season length (baseline series)

The Road Well-traveled: Implications of Climate Change for Pavement Infrastructure in Southern Canada 187
0
20
40
60
80
100
120
1 3 5 7 9 11 13 15 17 19 21 23 25 27 29 31 33 35 37 39 41 43 45 47 49
Season
Free
ze S
easo
n Le
ngth
CGCM2A2xWG1 CGCM2A2xWG2 CGCM2A2xWG3
Figure B-278. Fredericton estimated freeze season length (CGCM2A2x scenario series)
0
20
40
60
80
100
120
1 3 5 7 9 11 13 15 17 19 21 23 25 27 29 31 33 35 37 39 41 43 45 47 49
Season
Free
ze S
easo
n Le
ngth
HADCM3B21WG1 HADCM3B21WG2 HADCM3B21WG3
Figure B-279. Fredericton estimated freeze season length (HadCM3B21 scenario series)

The Road Well-traveled: Implications of Climate Change for Pavement Infrastructure in Southern Canada 188
CASE STUDY SITE: HALIFAX
City (MSC Observing
Station reference)
Lat Long Elevation (m)
Mean Annual Temperature*
(°C)
Mean Total Precipitation*
(mm)
Halifax (8202250) 44.6 63.6 145.4
6.3 1452.2
*1971-2000 climate normals Table B-90. Halifax minimum daily air temperature Climate Change Scenario STATISTIC (°C) Baseline* CGCM2A2x* HadCM3B21* Mean 1.5 4.3 4.1 Standard Deviation 9.2 8.9 9.3 Minimum -31.8 -27.5 -28.9 Lower Quartile -5.1 -2.3 -2.6 Median 2.2 4.3 4.3 Upper Quartile 9.2 11.9 11.7 Maximum 22.6 25.3 26.0 *n=54750 Table B-91. Halifax 7-day mean maximum daily air temperature Climate Change Scenario STATISTIC (°C) Baseline* CGCM2A2x* HadCM3B21* Mean 10.9 13.1 13.1 Standard Deviation 9.2 9.4 9.6 Minimum -15.7 -13.1 -13.6 Lower Quartile 2.8 4.8 4.7 Median 10.9 13.3 13.1 Upper Quartile 19.3 21.7 21.9 Maximum 30.5 32.7 33.5 *n=54750
0
2000
4000
6000
8000
10000
12000
-40 -35 -30 -25 -20 -15 -10 -5 0 5 10 15 20 25 30
Daily Minimum Temperature (°C)
Coun
t (da
ys)
Baseline CGCM2A2x HADCM2B21
Figure B-280. Halifax minimum daily temperature distribution (n=54750)
0102030405060708090
100
-40 -35 -30 -25 -20 -15 -10 -5 0 5 10 15 20 25 30
Daily Minimum Temperature (°C)
Cum
ulat
ive
Perc
ent
Baseline CGCM2A2x HADCM2B21
Figure B-281. Halifax minimum daily temperature cumulative percent distribution (n=54750)

The Road Well-traveled: Implications of Climate Change for Pavement Infrastructure in Southern Canada 189
-60
-50
-40
-30
-20
-10
0
10
20
30
40
Base CGCM2A2x HADCM3B21
Daily
Min
imum
Tem
pera
ture
(°C)
Minimum 25% Quartile Median 75% Quartile Maximum
Figure B-282. Halifax minimum daily temperature distribution: quartile statistics (n=54750)
0
2000
4000
6000
8000
10000
12000
-35 -30 -25 -20 -15 -10 -5 0 5 10 15 20 25 30 35 40
7-day Mean Maximum Temperature (°C)
Cou
nt (d
ays)
Baseline CGCM2A2x HADCM2B21
Figure B-283. Halifax 7-day mean maximum daily temperature distribution (n=54750)
0102030405060708090
100
-35 -30 -25 -20 -15 -10 -5 0 5 10 15 20 25 30 35 40
7-day Maximum Temperature Range (°C)
Cum
ulat
ive
Perc
ent
Baseline CGCM2A2x HADCM2B21
Figure B-284. Halifax 7-day mean maximum daily temperature cumulative percent distribution (n=54750)
-40
-30
-20
-10
0
10
20
30
40
50
Base CGCM2A2x HADCM3B21
7-da
y M
axim
um T
empe
ratu
re (°
C)Minimum 25% Quartile Median 75% Quartile Maximum
Figure B-285. Halifax 7-day mean maximum daily temperature distribution: quartile statistics (n=54750)

The Road Well-traveled: Implications of Climate Change for Pavement Infrastructure in Southern Canada 190
Table B-92. Halifax annual extreme minimum air temperature Climate Change Scenario STATISTIC (°C) Baseline* CGCM2A2x* HadCM3B21* Mean -23.9 -19.5 -21.1 Standard Deviation 3.3 2.9 3.2 Minimum -31.8 -27.5 -28.9 Lower Quartile -26.1 -21.5 -23.2 Median -23.8 -19.5 -21.0 Upper Quartile -21.2 -17.2 -18.3 Maximum -17.2 -13.7 -14.6 *n=150 Table B-93. Halifax annual extreme 7-day mean maximum air temperature Climate Change Scenario STATISTIC (°C) Baseline* CGCM2A2x* HadCM3B21* Mean 27.0 29.3 30.0 Standard Deviation 1.1 1.1 1.1 Minimum 24.4 26.7 27.6 Lower Quartile 26.2 28.6 29.3 Median 26.8 29.2 29.9 Upper Quartile 27.7 30.0 30.7 Maximum 30.5 32.7 33.5 *n=150
-60
-50
-40
-30
-20
-10
0
Base CGCM2A2x HADCM3B21
Ann
ual E
xtre
me
Min
imum
Te
mpe
ratu
re (°
C)
Minimum 25% Quartile Median 75% Quartile Maximum
Figure B-286. Halifax annual extreme minimum temperature distribution: quartile statistics (n=150)
0
5
10
15
20
25
30
35
40
Base CGCM2A2x HADCM3B21
Ann
ual E
xtre
me
7-da
y M
axim
um
Tem
pera
ture
(°C
)
Minimum 25% Quartile Median 75% Quartile Maximum
Figure B-287. Halifax annual extreme 7-day mean maximum daily temperature distribution: quartile statistics (n=150)
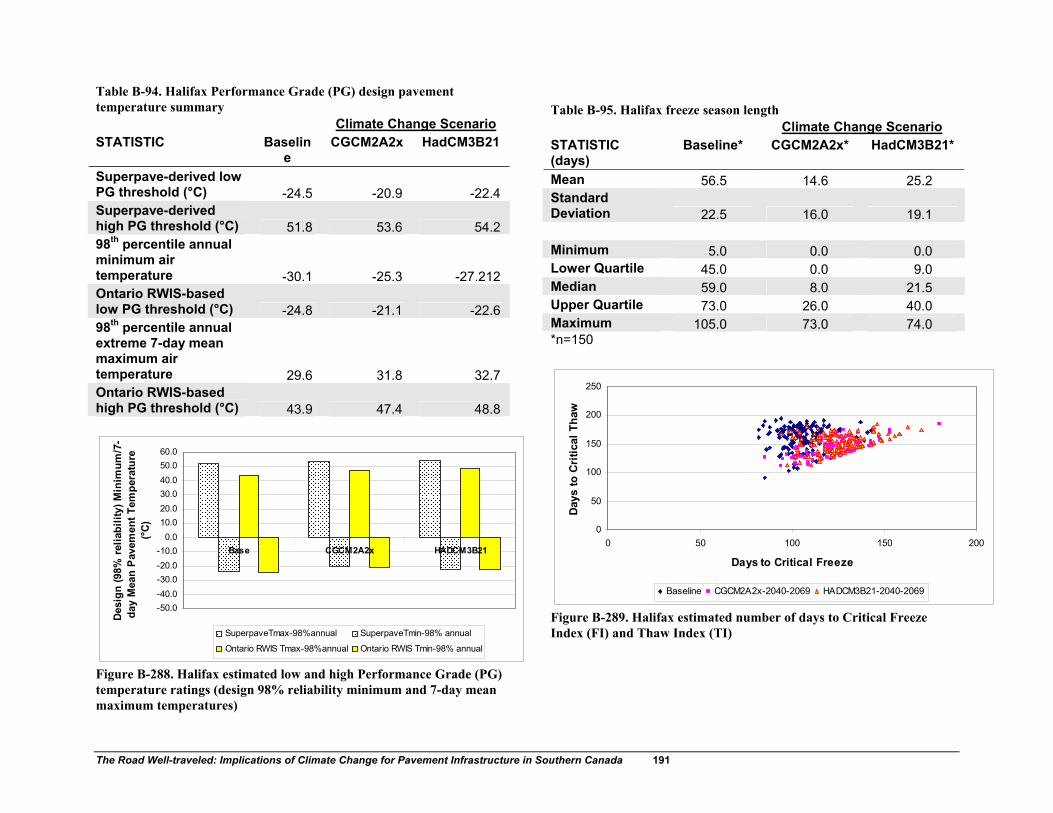
The Road Well-traveled: Implications of Climate Change for Pavement Infrastructure in Southern Canada 191
Table B-94. Halifax Performance Grade (PG) design pavement temperature summary Climate Change Scenario STATISTIC Baselin
e CGCM2A2x HadCM3B21
Superpave-derived low PG threshold (°C) -24.5 -20.9 -22.4 Superpave-derived high PG threshold (°C) 51.8 53.6 54.2 98th percentile annual minimum air temperature -30.1 -25.3 -27.212 Ontario RWIS-based low PG threshold (°C) -24.8 -21.1 -22.6 98th percentile annual extreme 7-day mean maximum air temperature 29.6 31.8 32.7 Ontario RWIS-based high PG threshold (°C) 43.9 47.4 48.8
-50.0-40.0-30.0-20.0-10.0
0.010.020.030.040.050.060.0
Base CGCM2A2x HADCM3B21
Des
ign
(98%
rel
iabi
lity)
Min
imum
/7-
day
Mea
n P
avem
ent T
empe
ratu
re
(°C)
SuperpaveTmax-98%annual SuperpaveTmin-98% annual
Ontario RWIS Tmax-98%annual Ontario RWIS Tmin-98% annual
Figure B-288. Halifax estimated low and high Performance Grade (PG) temperature ratings (design 98% reliability minimum and 7-day mean maximum temperatures)
Table B-95. Halifax freeze season length Climate Change Scenario STATISTIC (days)
Baseline* CGCM2A2x* HadCM3B21*
Mean 56.5 14.6 25.2 Standard Deviation 22.5 16.0 19.1 Minimum 5.0 0.0 0.0 Lower Quartile 45.0 0.0 9.0 Median 59.0 8.0 21.5 Upper Quartile 73.0 26.0 40.0 Maximum 105.0 73.0 74.0 *n=150
0
50
100
150
200
250
0 50 100 150 200
Days to Critical FreezeDa
ys to
Cri
tical
Tha
wBaseline CGCM2A2x-2040-2069 HADCM3B21-2040-2069
Figure B-289. Halifax estimated number of days to Critical Freeze Index (FI) and Thaw Index (TI)

The Road Well-traveled: Implications of Climate Change for Pavement Infrastructure in Southern Canada 192
0.0
20.0
40.0
60.0
80.0
100.0
120.0
Base CGCM2A2x HADCM3B21
Free
ze S
easo
n Le
ngth
(day
s)
Minimum 25% Quartile Median 75% Quartile Maximum
Figure B-290. Halifax estimated freeze season length distribution: quartile statistics (n=150)
020406080
100120140160
1 3 5 7 9 11 13 15 17 19 21 23 25 27 29 31 33 35 37 39 41 43 45 47 49
Season
Days
to C
ritic
al F
reez
e
Base1 Base2 Base3
Figure B-291. Halifax estimated days to critical FI (baseline series)
0
50
100
150
200
1 3 5 7 9 11 13 15 17 19 21 23 25 27 29 31 33 35 37 39 41 43 45 47 49
Season
Days
to C
ritic
al F
reez
e
CGCM2A2xWG1 CGCM2A2xWG2 CGCM2A2xWG3
Figure B-292. Halifax estimated days to critical FI (CGCM2A2x scenario series)
020406080
100120140160180
1 3 5 7 9 11 13 15 17 19 21 23 25 27 29 31 33 35 37 39 41 43 45 47 49
SeasonDa
ys to
Crit
ical
Fre
eze
HADCM3B21WG1 HADCM3B21WG2 HADCM3B21WG3
Figure B-293. Halifax estimated days to critical FI (HadCM3B21 scenario series)
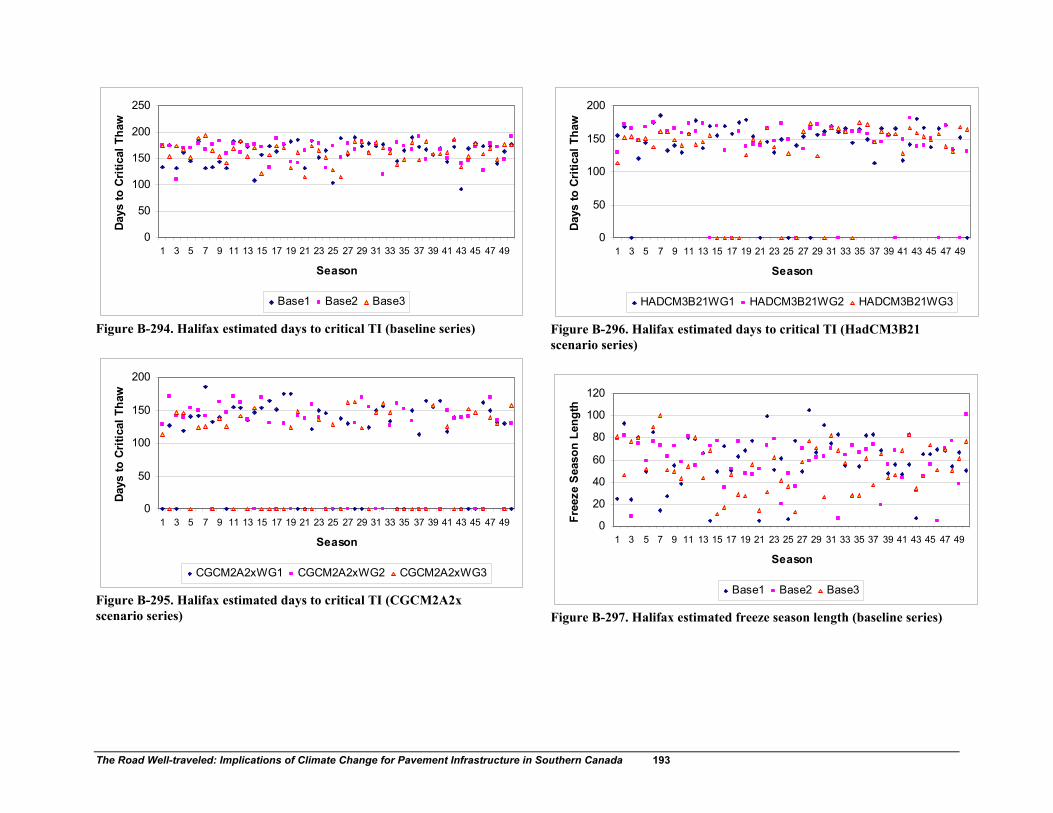
The Road Well-traveled: Implications of Climate Change for Pavement Infrastructure in Southern Canada 193
0
50
100
150
200
250
1 3 5 7 9 11 13 15 17 19 21 23 25 27 29 31 33 35 37 39 41 43 45 47 49
Season
Days
to C
ritic
al T
haw
Base1 Base2 Base3
Figure B-294. Halifax estimated days to critical TI (baseline series)
0
50
100
150
200
1 3 5 7 9 11 13 15 17 19 21 23 25 27 29 31 33 35 37 39 41 43 45 47 49
Season
Days
to C
ritic
al T
haw
CGCM2A2xWG1 CGCM2A2xWG2 CGCM2A2xWG3
Figure B-295. Halifax estimated days to critical TI (CGCM2A2x scenario series)
0
50
100
150
200
1 3 5 7 9 11 13 15 17 19 21 23 25 27 29 31 33 35 37 39 41 43 45 47 49
Season
Day
s to
Cri
tical
Tha
w
HADCM3B21WG1 HADCM3B21WG2 HADCM3B21WG3
Figure B-296. Halifax estimated days to critical TI (HadCM3B21 scenario series)
0
20
40
60
80
100
120
1 3 5 7 9 11 13 15 17 19 21 23 25 27 29 31 33 35 37 39 41 43 45 47 49
SeasonFr
eeze
Sea
son
Leng
thBase1 Base2 Base3
Figure B-297. Halifax estimated freeze season length (baseline series)

The Road Well-traveled: Implications of Climate Change for Pavement Infrastructure in Southern Canada 194
01020304050607080
1 3 5 7 9 11 13 15 17 19 21 23 25 27 29 31 33 35 37 39 41 43 45 47 49
Season
Free
ze S
easo
n Le
ngth
CGCM2A2xWG1 CGCM2A2xWG2 CGCM2A2xWG3
Figure B-298. Halifax estimated freeze season length (CGCM2A2x scenario series)
01020304050607080
1 3 5 7 9 11 13 15 17 19 21 23 25 27 29 31 33 35 37 39 41 43 45 47 49
Season
Free
ze S
easo
n Le
ngth
HADCM3B21WG1 HADCM3B21WG2 HADCM3B21WG3
Figure B-299. Halifax estimated freeze season length (HadCM3B21 scenario series)
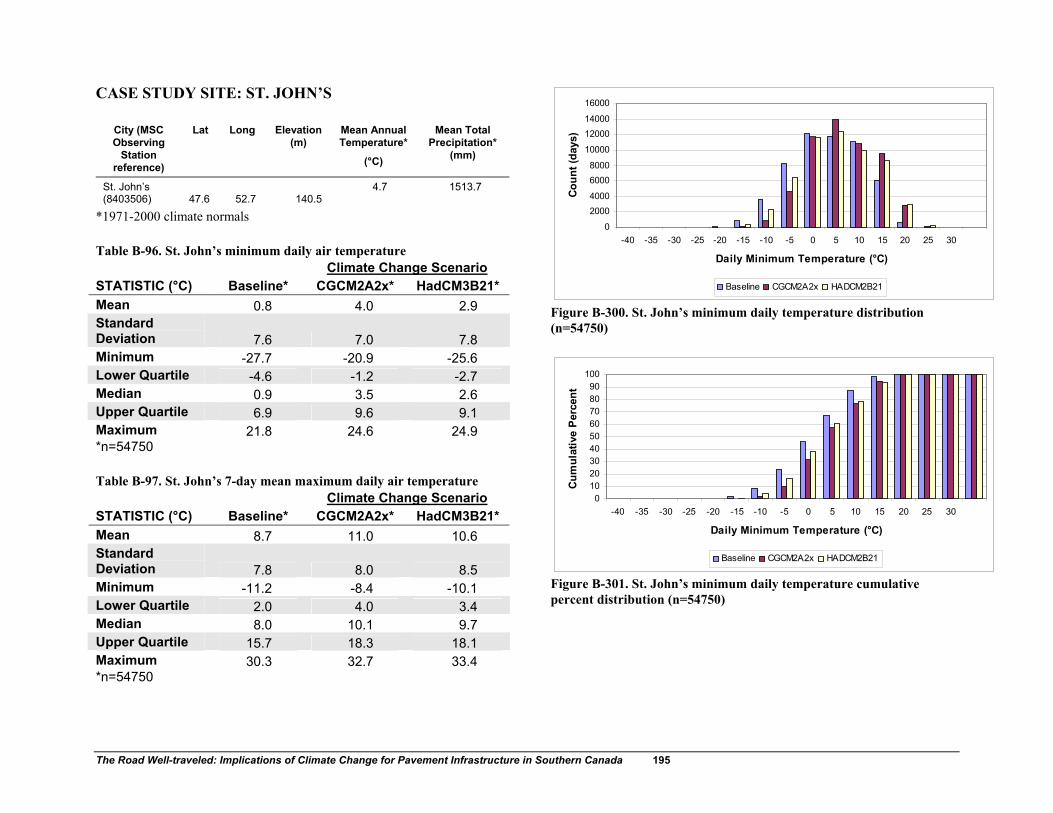
The Road Well-traveled: Implications of Climate Change for Pavement Infrastructure in Southern Canada 195
CASE STUDY SITE: ST. JOHN’S
City (MSC Observing
Station reference)
Lat Long Elevation (m)
Mean Annual Temperature*
(°C)
Mean Total Precipitation*
(mm)
St. John’s (8403506) 47.6 52.7 140.5
4.7 1513.7
*1971-2000 climate normals Table B-96. St. John’s minimum daily air temperature Climate Change Scenario STATISTIC (°C) Baseline* CGCM2A2x* HadCM3B21* Mean 0.8 4.0 2.9 Standard Deviation 7.6 7.0 7.8 Minimum -27.7 -20.9 -25.6 Lower Quartile -4.6 -1.2 -2.7 Median 0.9 3.5 2.6 Upper Quartile 6.9 9.6 9.1 Maximum 21.8 24.6 24.9 *n=54750 Table B-97. St. John’s 7-day mean maximum daily air temperature Climate Change Scenario STATISTIC (°C) Baseline* CGCM2A2x* HadCM3B21* Mean 8.7 11.0 10.6 Standard Deviation 7.8 8.0 8.5 Minimum -11.2 -8.4 -10.1 Lower Quartile 2.0 4.0 3.4 Median 8.0 10.1 9.7 Upper Quartile 15.7 18.3 18.1 Maximum 30.3 32.7 33.4 *n=54750
0
20004000
60008000
10000
1200014000
16000
-40 -35 -30 -25 -20 -15 -10 -5 0 5 10 15 20 25 30
Daily Minimum Temperature (°C)
Coun
t (da
ys)
Baseline CGCM2A2x HADCM2B21
Figure B-300. St. John’s minimum daily temperature distribution (n=54750)
0102030405060708090
100
-40 -35 -30 -25 -20 -15 -10 -5 0 5 10 15 20 25 30
Daily Minimum Temperature (°C)
Cum
ulat
ive
Perc
ent
Baseline CGCM2A2x HADCM2B21
Figure B-301. St. John’s minimum daily temperature cumulative percent distribution (n=54750)
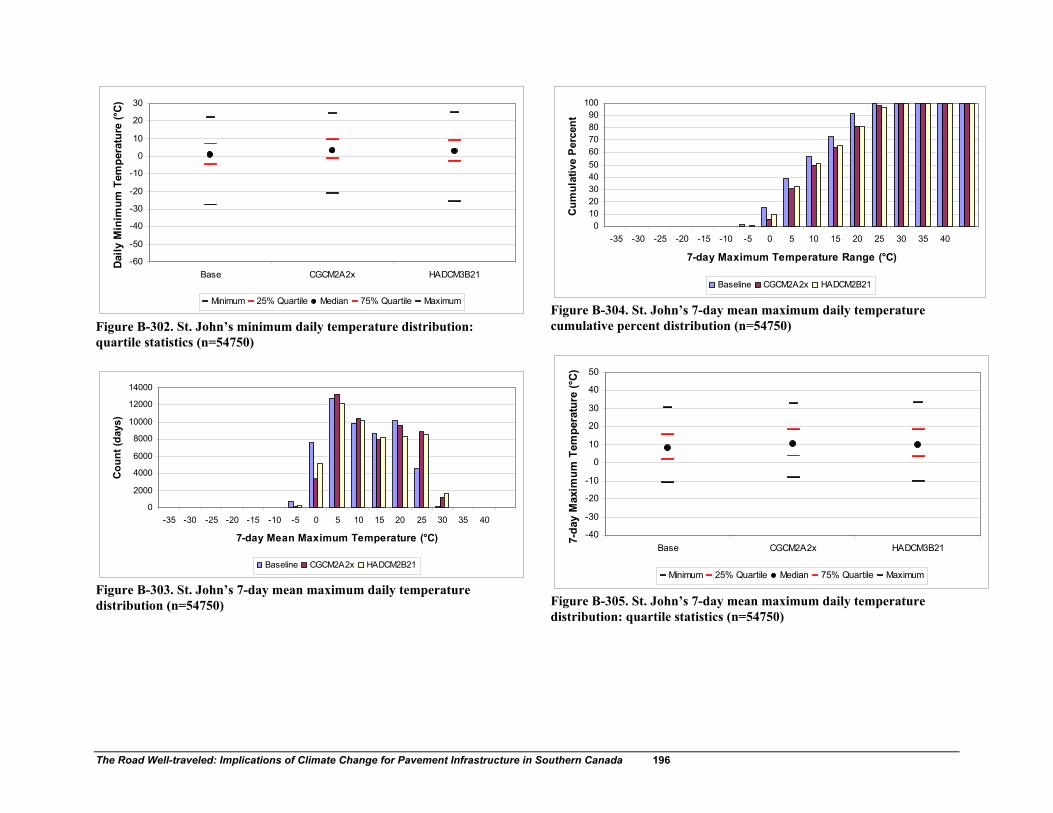
The Road Well-traveled: Implications of Climate Change for Pavement Infrastructure in Southern Canada 196
-60
-50
-40
-30
-20
-10
0
10
20
30
Base CGCM2A2x HADCM3B21
Daily
Min
imum
Tem
pera
ture
(°C)
Minimum 25% Quartile Median 75% Quartile Maximum
Figure B-302. St. John’s minimum daily temperature distribution: quartile statistics (n=54750)
0
2000
4000
6000
8000
10000
12000
14000
-35 -30 -25 -20 -15 -10 -5 0 5 10 15 20 25 30 35 40
7-day Mean Maximum Temperature (°C)
Cou
nt (d
ays)
Baseline CGCM2A2x HADCM2B21
Figure B-303. St. John’s 7-day mean maximum daily temperature distribution (n=54750)
0102030405060708090
100
-35 -30 -25 -20 -15 -10 -5 0 5 10 15 20 25 30 35 40
7-day Maximum Temperature Range (°C)
Cum
ulat
ive
Perc
ent
Baseline CGCM2A2x HADCM2B21
Figure B-304. St. John’s 7-day mean maximum daily temperature cumulative percent distribution (n=54750)
-40
-30
-20
-10
0
10
20
30
40
50
Base CGCM2A2x HADCM3B21
7-da
y M
axim
um T
empe
ratu
re (°
C)Minimum 25% Quartile Median 75% Quartile Maximum
Figure B-305. St. John’s 7-day mean maximum daily temperature distribution: quartile statistics (n=54750)

The Road Well-traveled: Implications of Climate Change for Pavement Infrastructure in Southern Canada 197
Table B-98. St. John’s annual extreme minimum air temperature Climate Change Scenario STATISTIC (°C) Baseline* CGCM2A2x* HadCM3B21* Mean -19.9 -14.4 -17.7 Standard Deviation 2.4 2.2 2.4 Minimum -27.7 -20.9 -25.6 Lower Quartile -21.5 -15.8 -19.2 Median -19.5 -14.2 -17.4 Upper Quartile -17.8 -12.6 -15.9 Maximum -14.7 -9.3 -12.8 *n=150 Table B-99. St. John’s annual extreme 7-day mean maximum air temperature Climate Change Scenario STATISTIC (°C) Baseline* CGCM2A2x* HadCM3B21* Mean 24.3 26.8 27.2 Standard Deviation 1.6 1.6 1.6 Minimum 21.5 23.7 24.3 Lower Quartile 23.1 25.5 26.1 Median 24.1 26.8 27.1 Upper Quartile 25.3 27.7 28.2 Maximum 30.3 32.7 33.4 *n=150
-60
-50
-40
-30
-20
-10
0
Base CGCM2A2x HADCM3B21
Ann
ual E
xtre
me
Min
imum
Te
mpe
ratu
re (°
C)
Minimum 25% Quartile Median 75% Quartile Maximum
Figure B-306. St. John’s annual extreme minimum temperature distribution: quartile statistics (n=150)
0
5
10
15
20
25
30
35
40
Base CGCM2A2x HADCM3B21
Annu
al E
xtre
me
7-da
y M
axim
um
Tem
pera
ture
(°C)
Minimum 25% Quartile Median 75% Quartile Maximum
Figure B-307. St. John’s annual extreme 7-day mean maximum daily temperature distribution: quartile statistics (n=150)

The Road Well-traveled: Implications of Climate Change for Pavement Infrastructure in Southern Canada 198
Table B-100. St. John’s Performance Grade (PG) design pavement temperature summary Climate Change Scenario STATISTIC Baselin
e CGCM2A2x HadCM3B21
Superpave-derived low PG threshold (°C) -21.8 -17.676794 -20.2403732Superpave-derived high PG threshold (°C) 49.2 51.2 51.598th percentile annual minimum air temperature -24.9 -19.506 -22.608Ontario RWIS-based low PG threshold (°C) -20.8 -16.376953 -18.953221998th percentile annual extreme 7-day mean maximum air temperature 28.0 31.1 31.0Ontario RWIS-based high PG threshold (°C) 41.3 46.3 46.1
-50.0-40.0-30.0-20.0-10.0
0.010.020.030.040.050.060.0
Base CGCM2A2x HADCM3B21
Desi
gn (9
8% re
liabi
lity)
Min
imum
/7-
day
Mea
n Pa
vem
ent T
empe
ratu
re
(°C)
SuperpaveTmax-98%annual SuperpaveTmin-98% annual
Ontario RWIS Tmax-98%annual Ontario RWIS Tmin-98% annual
Figure B-308. St. John’s estimated low and high Performance Grade (PG) temperature ratings (design 98% reliability minimum and 7-day mean maximum temperatures)
Table B-101. St. John’s freeze season length Climate Change Scenario STATISTIC (days)
Baseline* CGCM2A2x* HadCM3B21*
Mean 56.0 0.9 23.2 Standard Deviation 21.8 3.1 16.8 Minimum 6.0 0.0 0.0 Lower Quartile 42.0 0.0 9.3 Median 59.0 0.0 22.0 Upper Quartile 72.0 0.0 35.5 Maximum 107.0 15.0 72.0 *n=150
0
50
100
150
200
250
0 50 100 150 200
Days to Critical FreezeDa
ys to
Crit
ical
Tha
wBaseline CGCM2A2x-2040-2069 HADCM3B21-2040-2069
Figure B-309. St. John’s estimated number of days to Critical Freeze Index (FI) and Thaw Index (TI)

The Road Well-traveled: Implications of Climate Change for Pavement Infrastructure in Southern Canada 199
0.0
20.0
40.0
60.0
80.0
100.0
120.0
Base CGCM2A2x HADCM3B21
Free
ze S
easo
n Le
ngth
(day
s)
Minimum 25% Quartile Median 75% Quartile Maximum
Figure B-310. St. John’s estimated freeze season length distribution: quartile statistics (n=150)
020406080
100120140160180
1 3 5 7 9 11 13 15 17 19 21 23 25 27 29 31 33 35 37 39 41 43 45 47 49
Season
Days
to C
ritic
al F
reez
e
Base1 Base2 Base3
Figure B-311. St. John’s estimated days to critical FI (baseline series)
020406080
100120140160180
1 3 5 7 9 11 13 15 17 19 21 23 25 27 29 31 33 35 37 39 41 43 45 47 49
Season
Days
to C
ritic
al F
reez
e
CGCM2A2xWG1 CGCM2A2xWG2 CGCM2A2xWG3
Figure B-312. St. John’s estimated days to critical FI (CGCM2A2x scenario series)
0
50
100
150
200
1 3 5 7 9 11 13 15 17 19 21 23 25 27 29 31 33 35 37 39 41 43 45 47 49
SeasonDa
ys to
Crit
ical
Fre
eze
HADCM3B21WG1 HADCM3B21WG2 HADCM3B21WG3
Figure B-313. St. John’s estimated days to critical FI (HadCM3B21 scenario series)
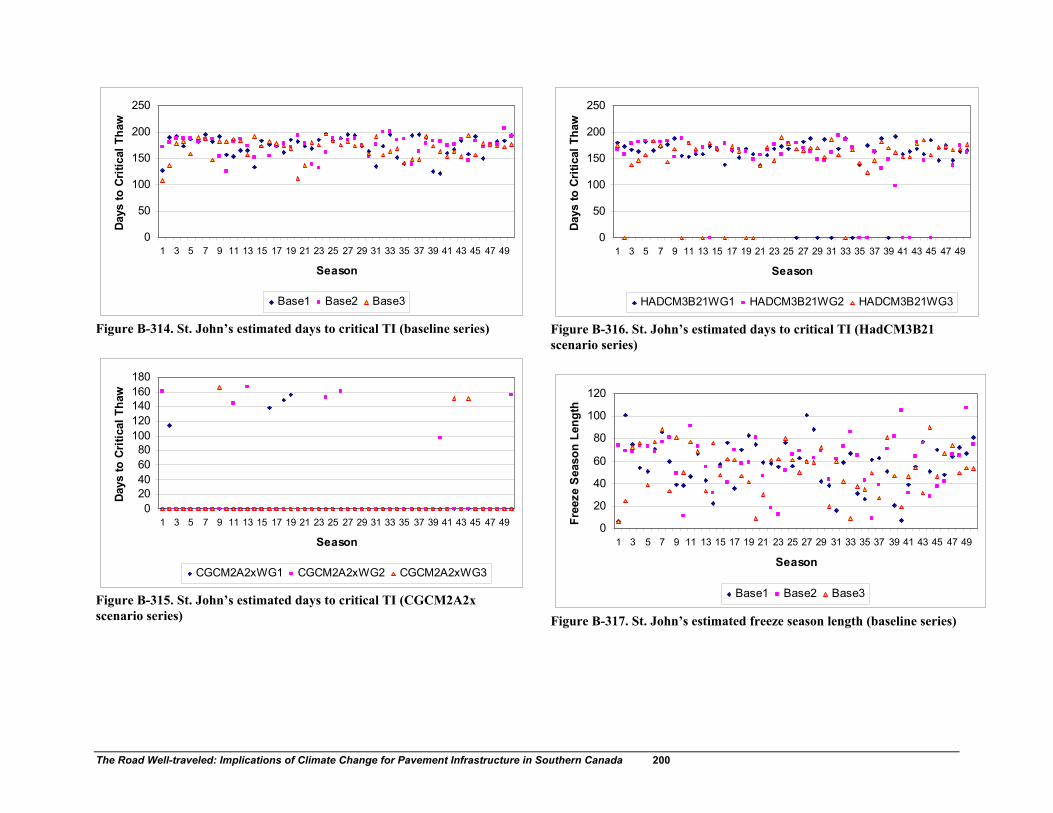
The Road Well-traveled: Implications of Climate Change for Pavement Infrastructure in Southern Canada 200
0
50
100
150
200
250
1 3 5 7 9 11 13 15 17 19 21 23 25 27 29 31 33 35 37 39 41 43 45 47 49
Season
Days
to C
ritic
al T
haw
Base1 Base2 Base3
Figure B-314. St. John’s estimated days to critical TI (baseline series)
020406080
100120140160180
1 3 5 7 9 11 13 15 17 19 21 23 25 27 29 31 33 35 37 39 41 43 45 47 49
Season
Days
to C
ritic
al T
haw
CGCM2A2xWG1 CGCM2A2xWG2 CGCM2A2xWG3
Figure B-315. St. John’s estimated days to critical TI (CGCM2A2x scenario series)
0
50
100
150
200
250
1 3 5 7 9 11 13 15 17 19 21 23 25 27 29 31 33 35 37 39 41 43 45 47 49
Season
Day
s to
Cri
tical
Tha
w
HADCM3B21WG1 HADCM3B21WG2 HADCM3B21WG3
Figure B-316. St. John’s estimated days to critical TI (HadCM3B21 scenario series)
0
20
40
60
80
100
120
1 3 5 7 9 11 13 15 17 19 21 23 25 27 29 31 33 35 37 39 41 43 45 47 49
SeasonFr
eeze
Sea
son
Leng
thBase1 Base2 Base3
Figure B-317. St. John’s estimated freeze season length (baseline series)

The Road Well-traveled: Implications of Climate Change for Pavement Infrastructure in Southern Canada 201
02468
10121416
1 3 5 7 9 11 13 15 17 19 21 23 25 27 29 31 33 35 37 39 41 43 45 47 49
Season
Free
ze S
easo
n Le
ngth
CGCM2A2xWG1 CGCM2A2xWG2 CGCM2A2xWG3
Figure B-318. St. John’s estimated freeze season length (CGCM2A2x scenario series)
01020304050607080
1 3 5 7 9 11 13 15 17 19 21 23 25 27 29 31 33 35 37 39 41 43 45 47 49
Season
Free
ze S
easo
n Le
ngth
HADCM3B21WG1 HADCM3B21WG2 HADCM3B21WG3
Figure B-319. St. John’s estimated freeze season length (HadCM3B21 scenario series)

The Road Well-traveled: Implications of Climate Change for Pavement Infrastructure in Southern Canada 202
APPENDIX C: MATERIAL PROPERTY ASSUMPTIONS USED IN MEPDG ANALYSES

The Road Well-traveled: Implications of Climate Change for Pavement Infrastructure in Southern Canada 203
Table C-1. Asphalt Properties (Layer 1)
Table C-2. Asphalt Properties (Layer 2)
Table C-3. Base Properties
Province Site ID Σ Ret 3/4 Σ Ret 3/8 Σ Ret #4 Pass #200 Type Grade Used Temp Binder C. A. Voids U. Weight Poisson T. Cap H. Cap
AB 81-1804-1 0 23 43 7 Pen 150 - 200 200 - 300 70 6.4 7 142 0.35 0.67 0.23BC 82-1005-1 0 24 42 6 AC 8 10 70 5.6 2.6 149 0.35 0.67 0.23MB 83-6450-1 0 16 32 3 Cutback 3000 200 - 300 70 3.8 7.7 162 0.35 0.67 0.23NF 85-1808-1 0 16 44 3 Pen 120 - 150 120 - 150 70 6 2.1 152 0.35 0.67 0.23ON 87-1806-1 0 12 37.5 9.9 Pen 85 - 100 85 - 100 70 5.6 5.4 182 0.35 0.67 0.23PQ 89-1021-1 0 26 41 5 Pen 85 - 100 85 - 100 70 4.9 1.8 154 0.35 0.67 0.23
Gradation (%) Binder General
Province Site ID Σ Ret 3/4 Σ Ret 3/8 Σ Ret #4 Pass #200 Type Grade Used Temp Binder C. A. Voids U. Weight Poisson T. Cap H. Cap
MB 84-1684-1 0 16 32 3 Cutback 3000 200 - 300 70 3.8 7.7 162 0.35 0.67 0.23ON 87-1806-1 0 12 37.5 9.9 Pen 85 - 100 85 - 100 70 5.4 5.4 148 0.35 0.67 0.23
Gradation (%) Binder General
Province Site IDPoisson Ko Modulus PI % Pass #4 D60 % Pass 200 Dry UW Gs Hyd Con GWC Deg Sat
AB 81-1804-1 0.35 0.5 40000 2 45 15 8 122.3 2.67 344 11.3 83.2BC 82-1005-1 0.35 0.5 40000 2 53 6.5 3 122.3 2.67 221 11.2 82.5MB 83-6450-1 0.35 0.5 40000 2 59 6 6.9 122.3 2.67 204 11.8 83NF 85-1808-1 0.35 0.5 40000 2 56 6 3 122.3 2.67 204 11.2 82.5ON 87-1806-1 0.35 0.5 38500 1 53.2 6.5 2.3 122.2 2.66 221 11.1 81.9PQ 89-1021-1 0.35 0.5 40000 2 35 10 2.2 122.3 2.67 302 11.1 82.3
Strength Properties ICM
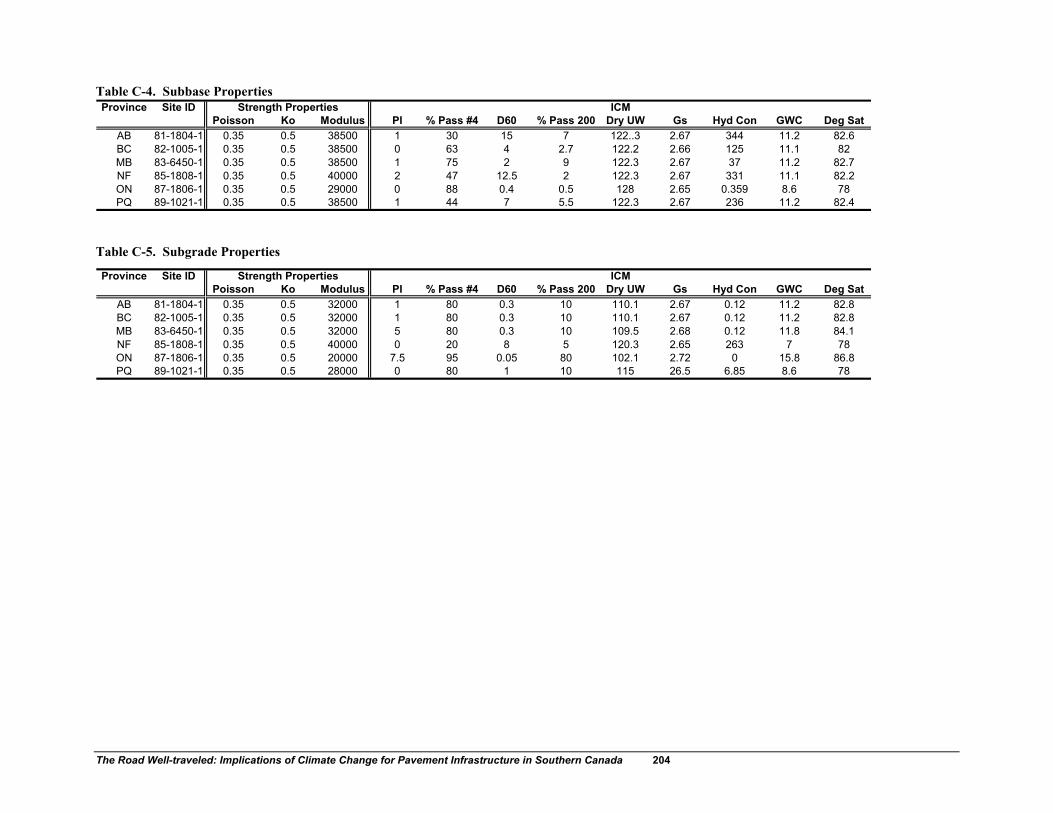
The Road Well-traveled: Implications of Climate Change for Pavement Infrastructure in Southern Canada 204
Table C-4. Subbase Properties
Table C-5. Subgrade Properties
Province Site IDPoisson Ko Modulus PI % Pass #4 D60 % Pass 200 Dry UW Gs Hyd Con GWC Deg Sat
AB 81-1804-1 0.35 0.5 38500 1 30 15 7 122..3 2.67 344 11.2 82.6BC 82-1005-1 0.35 0.5 38500 0 63 4 2.7 122.2 2.66 125 11.1 82MB 83-6450-1 0.35 0.5 38500 1 75 2 9 122.3 2.67 37 11.2 82.7NF 85-1808-1 0.35 0.5 40000 2 47 12.5 2 122.3 2.67 331 11.1 82.2ON 87-1806-1 0.35 0.5 29000 0 88 0.4 0.5 128 2.65 0.359 8.6 78PQ 89-1021-1 0.35 0.5 38500 1 44 7 5.5 122.3 2.67 236 11.2 82.4
Strength Properties ICM
Province Site IDPoisson Ko Modulus PI % Pass #4 D60 % Pass 200 Dry UW Gs Hyd Con GWC Deg Sat
AB 81-1804-1 0.35 0.5 32000 1 80 0.3 10 110.1 2.67 0.12 11.2 82.8BC 82-1005-1 0.35 0.5 32000 1 80 0.3 10 110.1 2.67 0.12 11.2 82.8MB 83-6450-1 0.35 0.5 32000 5 80 0.3 10 109.5 2.68 0.12 11.8 84.1NF 85-1808-1 0.35 0.5 40000 0 20 8 5 120.3 2.65 263 7 78ON 87-1806-1 0.35 0.5 20000 7.5 95 0.05 80 102.1 2.72 0 15.8 86.8PQ 89-1021-1 0.35 0.5 28000 0 80 1 10 115 26.5 6.85 8.6 78
Strength Properties ICM

The Road Well-traveled: Implications of Climate Change for Pavement Infrastructure in Southern Canada 205
APPENDIX D: MEPDG SENSITIVITY ANALYSIS RESULTS
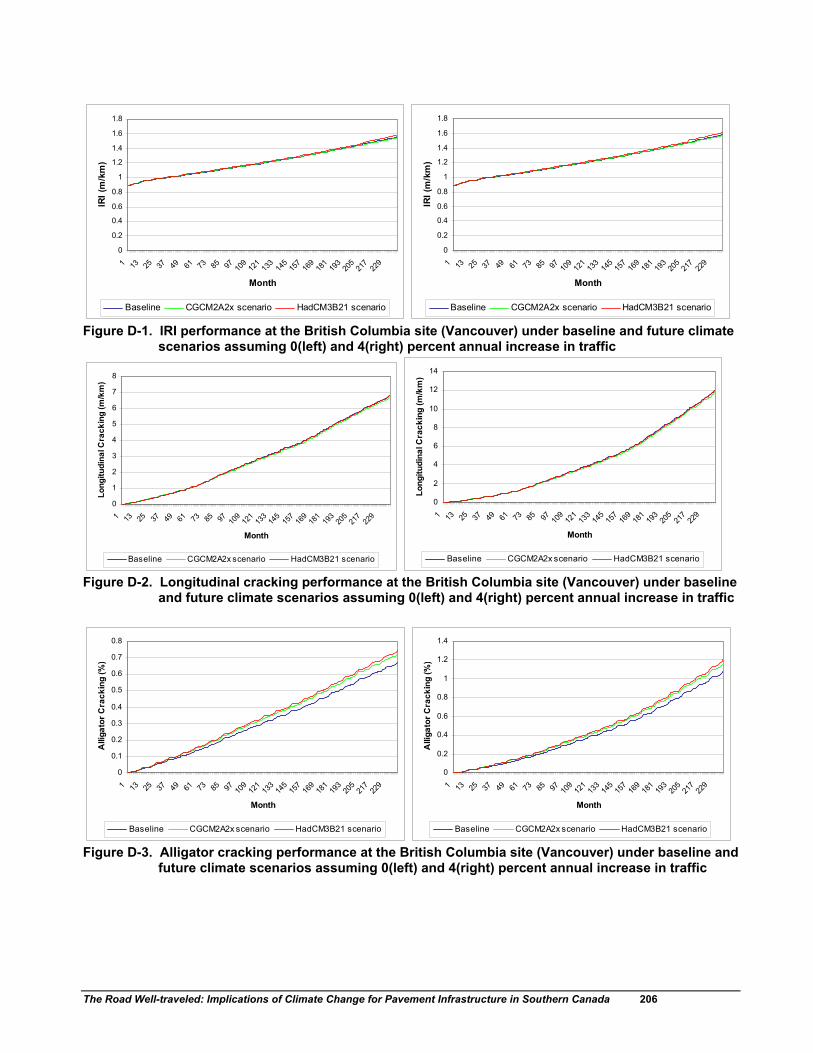
The Road Well-traveled: Implications of Climate Change for Pavement Infrastructure in Southern Canada 206
0
0.2
0.4
0.6
0.8
1
1.2
1.4
1.6
1.8
1 13 25 37 49 61 73 85 97 109
121
133
145
157
169
181
193
205
217
229
Month
IRI (
m/k
m)
Baseline CGCM2A2x scenario HadCM3B21 scenario
0
0.2
0.4
0.6
0.8
1
1.2
1.4
1.6
1.8
1 13 25 37 49 61 73 85 97 109
121
133
145
157
169
181
193
205
217
229
Month
IRI (
m/k
m)
Baseline CGCM2A2x scenario HadCM3B21 scenario
Figure D-1. IRI performance at the British Columbia site (Vancouver) under baseline and future climate scenarios assuming 0(left) and 4(right) percent annual increase in traffic
0
1
2
3
4
5
6
7
8
1 13 25 37 49 61 73 85 97 109
121
133
145
157
169
181
193
205
217
229
Month
Long
itudi
nal C
rack
ing
(m/k
m)
Baseline CGCM2A2x scenario HadCM3B21 scenario
0
2
4
6
8
10
12
14
1 13 25 37 49 61 73 85 97 109
121
133
145
157
169
181
193
205
217
229
Month
Long
itudi
nal C
rack
ing
(m/k
m)
Baseline CGCM2A2x scenario HadCM3B21 scenario
Figure D-2. Longitudinal cracking performance at the British Columbia site (Vancouver) under baseline and future climate scenarios assuming 0(left) and 4(right) percent annual increase in traffic
0
0.1
0.2
0.3
0.4
0.5
0.6
0.7
0.8
1 13 25 37 49 61 73 85 97 109
121
133
145
157
169
181
193
205
217
229
Month
Alli
gato
r Cra
ckin
g (%
)
Baseline CGCM2A2x scenario HadCM3B21 scenario
0
0.2
0.4
0.6
0.8
1
1.2
1.4
1 13 25 37 49 61 73 85 97 109
121
133
145
157
169
181
193
205
217
229
Month
Alli
gato
r Cra
ckin
g (%
)
Baseline CGCM2A2x scenario HadCM3B21 scenario
Figure D-3. Alligator cracking performance at the British Columbia site (Vancouver) under baseline and future climate scenarios assuming 0(left) and 4(right) percent annual increase in traffic
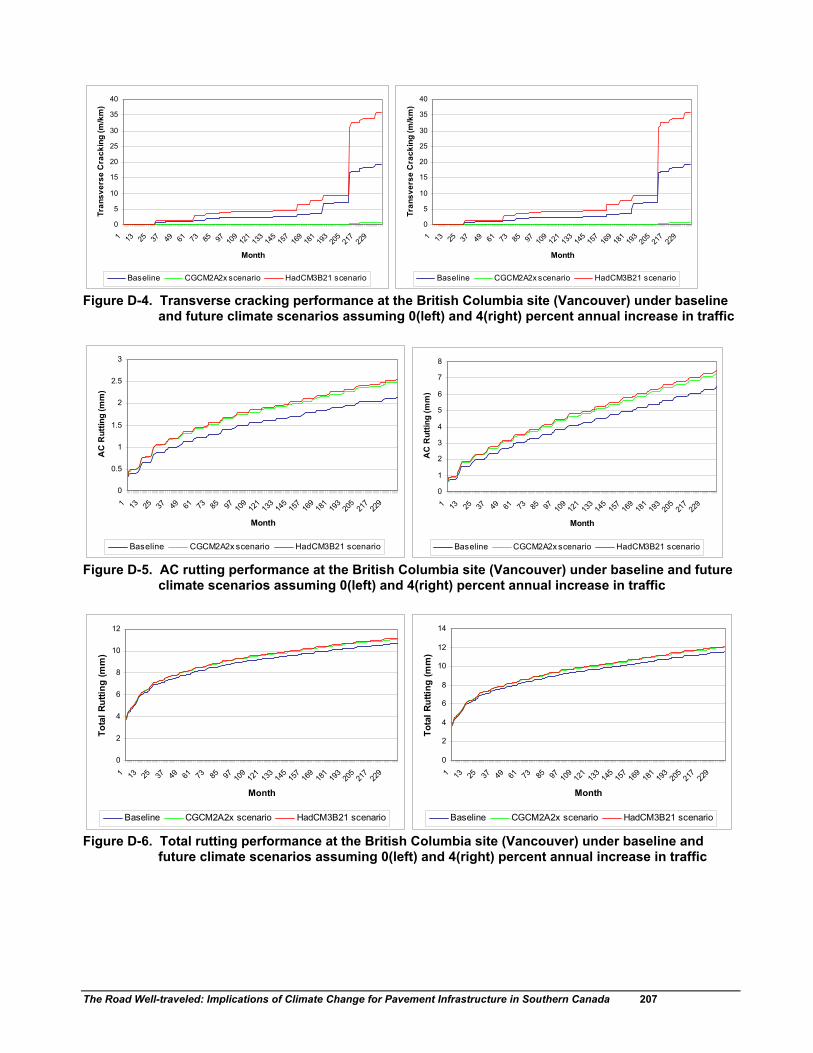
The Road Well-traveled: Implications of Climate Change for Pavement Infrastructure in Southern Canada 207
0
5
10
15
20
25
30
35
40
1 13 25 37 49 61 73 85 97 109
121
133
145
157
169
181
193
205
217
229
Month
Tran
sver
se C
rack
ing
(m/k
m)
Baseline CGCM2A2x scenario HadCM3B21 scenario
0
5
10
15
20
25
30
35
40
1 13 25 37 49 61 73 85 97 109
121
133
145
157
169
181
193
205
217
229
Month
Tran
sver
se C
rack
ing
(m/k
m)
Baseline CGCM2A2x scenario HadCM3B21 scenario
Figure D-4. Transverse cracking performance at the British Columbia site (Vancouver) under baseline and future climate scenarios assuming 0(left) and 4(right) percent annual increase in traffic
0
0.5
1
1.5
2
2.5
3
1 13 25 37 49 61 73 85 97 109
121
133
145
157
169
181
193
205
217
229
Month
AC
Rut
ting
(mm
)
Baseline CGCM2A2x scenario HadCM3B21 scenario
0
1
2
3
4
5
6
7
8
1 13 25 37 49 61 73 85 97 109
121
133
145
157
169
181
193
205
217
229
Month
AC
Rut
ting
(mm
)
Baseline CGCM2A2x scenario HadCM3B21 scenario
Figure D-5. AC rutting performance at the British Columbia site (Vancouver) under baseline and future climate scenarios assuming 0(left) and 4(right) percent annual increase in traffic
0
2
4
6
8
10
12
1 13 25 37 49 61 73 85 97 109
121
133
145
157
169
181
193
205
217
229
Month
Tota
l Rut
ting
(mm
)
Baseline CGCM2A2x scenario HadCM3B21 scenario
0
2
4
6
8
10
12
14
1 13 25 37 49 61 73 85 97 109
121
133
145
157
169
181
193
205
217
229
Month
Tota
l Rut
ting
(mm
)
Baseline CGCM2A2x scenario HadCM3B21 scenario
Figure D-6. Total rutting performance at the British Columbia site (Vancouver) under baseline and future climate scenarios assuming 0(left) and 4(right) percent annual increase in traffic

The Road Well-traveled: Implications of Climate Change for Pavement Infrastructure in Southern Canada 208
00.20.40.60.8
11.21.41.61.8
22.22.42.6
1 13 25 37 49 61 73 85 97 109
121
133
145
157
169
181
193
205
217
229
Month
IRI (
m/k
m)
Baseline CGCM2A2x scenario HadCM3B21 scenario
00.20.40.60.8
11.21.41.61.8
22.22.42.62.8
1 13 25 37 49 61 73 85 97 109
121
133
145
157
169
181
193
205
217
229
Month
IRI (
m/k
m)
Baseline CGCM2A2x scenario HadCM3B21 scenario
Figure D-7. IRI performance at the Alberta site (Edmonton) under baseline and future climate scenarios assuming 0(left) and 4(right) percent annual increase in traffic
0
100
200
300
400
500
600
700
1 13 25 37 49 61 73 85 97 109
121
133
145
157
169
181
193
205
217
229
Month
Long
itudi
nal C
rack
ing
(m/k
m)
Baseline CGCM2A2x scenario HadCM3B21 scenario
0100
200300
400500600
700800
9001000
1 13 25 37 49 61 73 85 97 109
121
133
145
157
169
181
193
205
217
229
Month
Long
itudi
nal C
rack
ing
(m/k
m)
Baseline CGCM2A2x scenario HadCM3B21 scenario
Figure D-8. Longitudinal cracking performance at the Alberta site (Edmonton) under baseline and future climate scenarios assuming 0(left) and 4(right) percent annual increase in traffic
0
5
10
15
20
25
30
35
1 13 25 37 49 61 73 85 97 109
121
133
145
157
169
181
193
205
217
229
Month
Alli
gato
r Cra
ckin
g (%
)
Baseline CGCM2A2x scenario HadCM3B21 scenario
05
1015
2025
3035
4045
50
1 13 25 37 49 61 73 85 97 109
121
133
145
157
169
181
193
205
217
229
Month
Alli
gato
r Cra
ckin
g (%
)
Baseline CGCM2A2x scenario HadCM3B21 scenario
Figure D-9. Alligator cracking performance at the Alberta site (Edmonton) under baseline and future climate scenarios assuming 0(left) and 4(right) percent annual increase in traffic
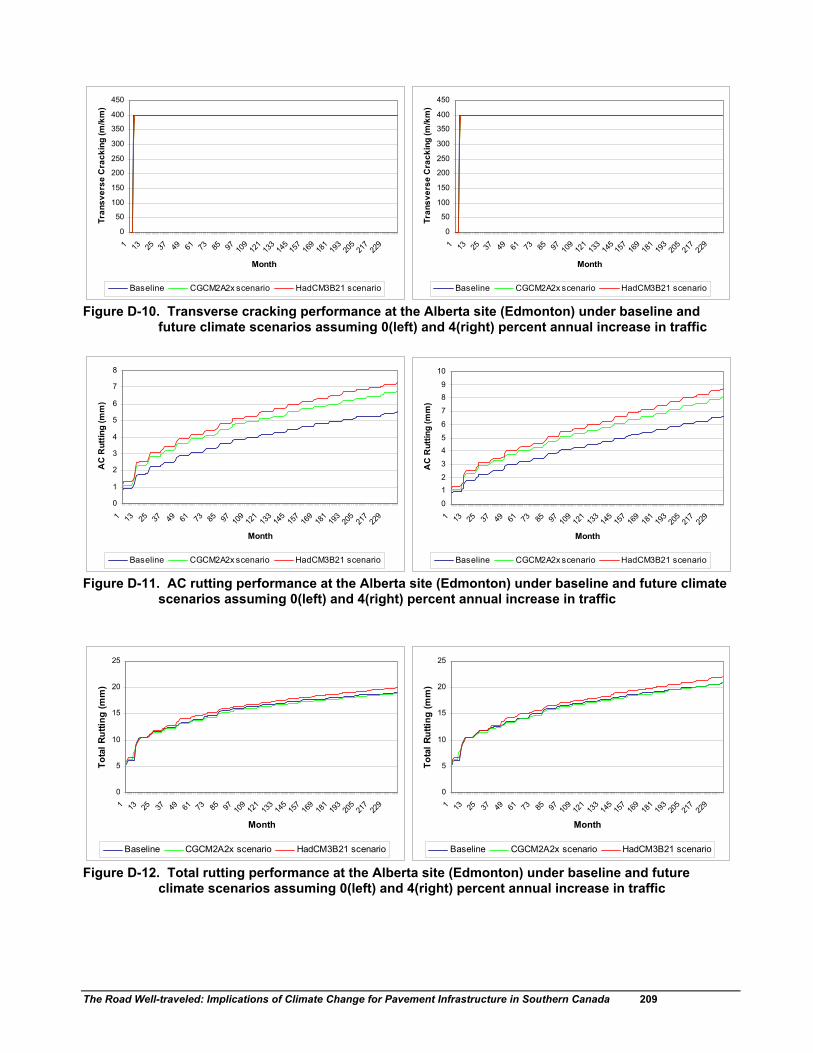
The Road Well-traveled: Implications of Climate Change for Pavement Infrastructure in Southern Canada 209
0
50
100
150
200
250
300
350
400
450
1 13 25 37 49 61 73 85 97 109
121
133
145
157
169
181
193
205
217
229
Month
Tran
sver
se C
rack
ing
(m/k
m)
Baseline CGCM2A2x scenario HadCM3B21 scenario
0
50
100
150
200
250
300
350
400
450
1 13 25 37 49 61 73 85 97 109
121
133
145
157
169
181
193
205
217
229
Month
Tran
sver
se C
rack
ing
(m/k
m)
Baseline CGCM2A2x scenario HadCM3B21 scenario
Figure D-10. Transverse cracking performance at the Alberta site (Edmonton) under baseline and future climate scenarios assuming 0(left) and 4(right) percent annual increase in traffic
0
1
2
3
4
5
6
7
8
1 13 25 37 49 61 73 85 97 109
121
133
145
157
169
181
193
205
217
229
Month
AC
Rut
ting
(mm
)
Baseline CGCM2A2x scenario HadCM3B21 scenario
0
12
3
45
6
7
89
10
1 13 25 37 49 61 73 85 97 109
121
133
145
157
169
181
193
205
217
229
Month
AC
Rut
ting
(mm
)
Baseline CGCM2A2x scenario HadCM3B21 scenario
Figure D-11. AC rutting performance at the Alberta site (Edmonton) under baseline and future climate scenarios assuming 0(left) and 4(right) percent annual increase in traffic
0
5
10
15
20
25
1 13 25 37 49 61 73 85 97 109
121
133
145
157
169
181
193
205
217
229
Month
Tota
l Rut
ting
(mm
)
Baseline CGCM2A2x scenario HadCM3B21 scenario
0
5
10
15
20
25
1 13 25 37 49 61 73 85 97 109
121
133
145
157
169
181
193
205
217
229
Month
Tota
l Rut
ting
(mm
)
Baseline CGCM2A2x scenario HadCM3B21 scenario
Figure D-12. Total rutting performance at the Alberta site (Edmonton) under baseline and future climate scenarios assuming 0(left) and 4(right) percent annual increase in traffic

The Road Well-traveled: Implications of Climate Change for Pavement Infrastructure in Southern Canada 210
00.20.40.60.8
11.21.41.61.8
22.22.42.62.8
1 13 25 37 49 61 73 85 97 109
121
133
145
157
169
181
193
205
217
229
Month
IRI (
m/k
m)
Baseline CGCM2A2x scenario HadCM3B21 scenario
00.20.40.60.8
11.21.41.61.8
22.22.42.62.8
33.2
1 13 25 37 49 61 73 85 97 109
121
133
145
157
169
181
193
205
217
229
Month
IRI (
m/k
m)
Baseline CGCM2A2x scenario HadCM3B21 scenario
Figure D-13. IRI performance at the Manitoba site (Winnipeg) under baseline and future climate scenarios assuming 0(left) and 4(right) percent annual increase in traffic
050
100150
200250300
350400
450500
1 13 25 37 49 61 73 85 97 109
121
133
145
157
169
181
193
205
217
229
Month
Long
itudi
nal C
rack
ing
(m/k
m)
Baseline CGCM2A2x scenario HadCM3B21 scenario
0
100
200
300
400
500
600
700
800
1 13 25 37 49 61 73 85 97 109
121
133
145
157
169
181
193
205
217
229
Month
Long
itudi
nal C
rack
ing
(m/k
m)
Baseline CGCM2A2x scenario HadCM3B21 scenario
Figure D-14. Longitudinal cracking performance at the Manitoba site (Winnipeg) under baseline and future climate scenarios assuming 0(left) and 4(right) percent annual increase in traffic
0
10
20
30
40
50
60
1 13 25 37 49 61 73 85 97 109
121
133
145
157
169
181
193
205
217
229
Month
Alli
gato
r Cra
ckin
g (%
)
Baseline CGCM2A2x scenario HadCM3B21 scenario
0
10
20
30
40
50
60
70
1 13 25 37 49 61 73 85 97 109
121
133
145
157
169
181
193
205
217
229
Month
Alli
gato
r Cra
ckin
g (%
)
Baseline CGCM2A2x scenario HadCM3B21 scenario
Figure D-15. Alligator cracking performance at the Manitoba site (Winnipeg) under baseline and future climate scenarios assuming 0(left) and 4(right) percent annual increase in traffic

The Road Well-traveled: Implications of Climate Change for Pavement Infrastructure in Southern Canada 211
0
50
100
150
200
250
300
350
400
450
1 13 25 37 49 61 73 85 97 109
121
133
145
157
169
181
193
205
217
229
Month
Tran
sver
se C
rack
ing
(m/k
m)
Baseline CGCM2A2x scenario HadCM3B21 scenario
0
50
100
150
200
250
300
350
400
450
1 13 25 37 49 61 73 85 97 109
121
133
145
157
169
181
193
205
217
229
Month
Tran
sver
se C
rack
ing
(m/k
m)
Baseline CGCM2A2x scenario HadCM3B21 scenario
Figure D-16. Transverse cracking performance at the Manitoba site (Winnipeg) under baseline and future climate scenarios assuming 0(left) and 4(right) percent annual increase in traffic
0
0.5
1
1.5
2
2.5
3
3.5
4
4.5
1 13 25 37 49 61 73 85 97 109
121
133
145
157
169
181
193
205
217
229
Month
AC
Rut
ting
(mm
)
Baseline CGCM2A2x scenario HadCM3B21 scenario
0
0.51
1.5
22.5
3
3.5
44.5
5
1 13 25 37 49 61 73 85 97 109
121
133
145
157
169
181
193
205
217
229
Month
AC
Rut
ting
(mm
)
Baseline CGCM2A2x scenario HadCM3B21 scenario
Figure D-17. AC rutting performance at the Manitoba site (Winnipeg) under baseline and future climate scenarios assuming 0(left) and 4(right) percent annual increase in traffic
0
2
4
6
8
10
12
14
16
1 13 25 37 49 61 73 85 97 109
121
133
145
157
169
181
193
205
217
229
Month
Tota
l Rut
ting
(mm
)
Baseline CGCM2A2x scenario HadCM3B21 scenario
0
2
4
6
8
10
12
14
16
18
1 13 25 37 49 61 73 85 97 109
121
133
145
157
169
181
193
205
217
229
Month
Tota
l Rut
ting
(mm
)
Baseline CGCM2A2x scenario HadCM3B21 scenario
Figure D-18. Total rutting performance at the Manitoba site (Winnipeg) under baseline and future climate scenarios assuming 0(left) and 4(right) percent annual increase in traffic

The Road Well-traveled: Implications of Climate Change for Pavement Infrastructure in Southern Canada 212
00.20.40.60.8
11.21.41.61.8
22.2
1 13 25 37 49 61 73 85 97 109
121
133
145
157
169
181
193
205
217
229
Month
IRI (
m/k
m)
Baseline CGCM2A2x scenario HadCM3B21 scenario
00.20.40.60.8
11.21.41.61.8
22.2
1 13 25 37 49 61 73 85 97 109
121
133
145
157
169
181
193
205
217
229
Month
IRI (
m/k
m)
Baseline CGCM2A2x scenario HadCM3B21 scenario
Figure D-19. IRI performance at the Ontario site (Toronto) under baseline and future climate scenarios assuming 0(left) and 4(right) percent annual increase in traffic
0
5
10
15
20
25
30
35
40
1 13 25 37 49 61 73 85 97 109
121
133
145
157
169
181
193
205
217
229
Month
Long
itudi
nal C
rack
ing
(m/k
m)
Baseline CGCM2A2x scenario HadCM3B21 scenario
0
10
20
30
40
50
60
70
1 13 25 37 49 61 73 85 97 109
121
133
145
157
169
181
193
205
217
229
Month
Long
itudi
nal C
rack
ing
(m/k
m)
Baseline CGCM2A2x scenario HadCM3B21 scenario
Figure D-20. Longitudinal cracking performance at the Ontario site (Toronto) under baseline and future climate scenarios assuming 0(left) and 4(right) percent annual increase in traffic
0
1
2
3
4
5
6
1 13 25 37 49 61 73 85 97 109
121
133
145
157
169
181
193
205
217
229
Month
Alli
gato
r Cra
ckin
g (%
)
Baseline CGCM2A2x scenario HadCM3B21 scenario
0
1
2
3
4
5
6
7
8
9
1 13 25 37 49 61 73 85 97 109
121
133
145
157
169
181
193
205
217
229
Month
Alli
gato
r Cra
ckin
g (%
)
Baseline CGCM2A2x scenario HadCM3B21 scenario
Figure D-21. Alligator cracking performance at the Ontario site (Toronto) under baseline and future climate scenarios assuming 0(left) and 4(right) percent annual increase in traffic

The Road Well-traveled: Implications of Climate Change for Pavement Infrastructure in Southern Canada 213
0
50
100
150
200
250
300
350
400
450
1 13 25 37 49 61 73 85 97 109
121
133
145
157
169
181
193
205
217
229
Month
Tran
sver
se C
rack
ing
(m/k
m)
Baseline CGCM2A2x scenario HadCM3B21 scenario
0
50
100
150
200
250
300
350
400
450
1 13 25 37 49 61 73 85 97 109
121
133
145
157
169
181
193
205
217
229
Month
Tran
sver
se C
rack
ing
(m/k
m)
Baseline CGCM2A2x scenario HadCM3B21 scenario
Figure D-22. Transverse cracking performance at the Ontario site (Toronto) under baseline and future climate scenarios assuming 0(left) and 4(right) percent annual increase in traffic
0
1
2
3
4
5
6
1 13 25 37 49 61 73 85 97 109
121
133
145
157
169
181
193
205
217
229
Month
AC
Rut
ting
(mm
)
Baseline CGCM2A2x scenario HadCM3B21 scenario
0
1
2
3
4
5
6
7
1 13 25 37 49 61 73 85 97 109
121
133
145
157
169
181
193
205
217
229
Month
AC
Rut
ting
(mm
)
Baseline CGCM2A2x scenario HadCM3B21 scenario
Figure D-23. AC rutting performance at the Ontario site (Toronto) under baseline and future climate scenarios assuming 0(left) and 4(right) percent annual increase in traffic
0
2
4
6
8
10
12
14
1 13 25 37 49 61 73 85 97 109
121
133
145
157
169
181
193
205
217
229
Month
Tota
l Rut
ting
(mm
)
Baseline CGCM2A2x scenario HadCM3B21 scenario
0
2
4
6
8
10
12
14
16
1 13 25 37 49 61 73 85 97 109
121
133
145
157
169
181
193
205
217
229
Month
Tota
l Rut
ting
(mm
)
Baseline CGCM2A2x scenario HadCM3B21 scenario
Figure D-24. Total rutting performance at the Ontario site (Toronto) under baseline and future climate scenarios assuming 0(left) and 4(right) percent annual increase in traffic

The Road Well-traveled: Implications of Climate Change for Pavement Infrastructure in Southern Canada 214
00.20.40.60.8
11.21.41.61.8
22.22.4
1 13 25 37 49 61 73 85 97 109
121
133
145
157
169
181
193
205
217
229
Month
IRI (
m/k
m)
Baseline CGCM2A2x scenario HadCM3B21 scenario
00.20.40.60.8
11.21.41.61.8
22.22.4
1 13 25 37 49 61 73 85 97 109
121
133
145
157
169
181
193
205
217
229
Month
IRI (
m/k
m)
Baseline CGCM2A2x scenario HadCM3B21 scenario
Figure D-25. IRI performance at the Quebec site (Montreal) under baseline and future climate scenarios assuming 0(left) and 4(right) percent annual increase in traffic
0
200
400
600
800
1000
1200
1400
1600
1800
1 13 25 37 49 61 73 85 97 109
121
133
145
157
169
181
193
205
217
229
Month
Long
itudi
nal C
rack
ing
(m/k
m)
Baseline CGCM2A2x scenario HadCM3B21 scenario
0200
400600
80010001200
14001600
18002000
1 13 25 37 49 61 73 85 97 109
121
133
145
157
169
181
193
205
217
229
Month
Long
itudi
nal C
rack
ing
(m/k
m)
Baseline CGCM2A2x scenario HadCM3B21 scenario
Figure D-26. Longitudinal cracking performance at the Quebec site (Montreal) under baseline and future climate scenarios assuming 0(left) and 4(right) percent annual increase in traffic
00.05
0.10.15
0.20.25
0.30.35
0.40.45
0.5
1 13 25 37 49 61 73 85 97 109
121
133
145
157
169
181
193
205
217
229
Month
Alli
gato
r Cra
ckin
g (%
)
Baseline CGCM2A2x scenario HadCM3B21 scenario
00.1
0.20.3
0.40.5
0.60.7
0.80.9
1
1 13 25 37 49 61 73 85 97 109
121
133
145
157
169
181
193
205
217
229
Month
Alli
gato
r Cra
ckin
g (%
)
Baseline CGCM2A2x scenario HadCM3B21 scenario
Figure D-27. Alligator cracking performance at the Quebec site (Montreal) under baseline and future climate scenarios assuming 0(left) and 4(right) percent annual increase in traffic

The Road Well-traveled: Implications of Climate Change for Pavement Infrastructure in Southern Canada 215
0
50
100
150
200
250
300
350
400
450
1 13 25 37 49 61 73 85 97 109
121
133
145
157
169
181
193
205
217
229
Month
Tran
sver
se C
rack
ing
(m/k
m)
Baseline CGCM2A2x scenario HadCM3B21 scenario
0
50
100
150
200
250
300
350
400
450
1 13 25 37 49 61 73 85 97 109
121
133
145
157
169
181
193
205
217
229
Month
Tran
sver
se C
rack
ing
(m/k
m)
Baseline CGCM2A2x scenario HadCM3B21 scenario
Figure D-28. Transverse cracking performance at the Quebec site (Montreal) under baseline and future climate scenarios assuming 0(left) and 4(right) percent annual increase in traffic
0
1
2
3
4
5
6
7
1 13 25 37 49 61 73 85 97 109
121
133
145
157
169
181
193
205
217
229
Month
AC
Rut
ting
(mm
)
Baseline CGCM2A2x scenario HadCM3B21 scenario
0
1
2
3
4
5
6
7
8
1 13 25 37 49 61 73 85 97 109
121
133
145
157
169
181
193
205
217
229
Month
AC
Rut
ting
(mm
)
Baseline CGCM2A2x scenario HadCM3B21 scenario
Figure D-29. AC rutting performance at the Quebec site (Montreal) under baseline and future climate scenarios assuming 0(left) and 4(right) percent annual increase in traffic
0
5
10
15
20
25
1 13 25 37 49 61 73 85 97 109
121
133
145
157
169
181
193
205
217
229
Month
Tota
l Rut
ting
(mm
)
Baseline CGCM2A2x scenario HadCM3B21 scenario
0
5
10
15
20
25
30
1 13 25 37 49 61 73 85 97 109
121
133
145
157
169
181
193
205
217
229
Month
Tota
l Rut
ting
(mm
)
Baseline CGCM2A2x scenario HadCM3B21 scenario
Figure D-30. Total rutting performance at the Quebec site (Montreal) under baseline and future climate scenarios assuming 0(left) and 4(right) percent annual increase in traffic

The Road Well-traveled: Implications of Climate Change for Pavement Infrastructure in Southern Canada 216
0
0.20.4
0.6
0.81
1.2
1.4
1.61.8
2
1 13 25 37 49 61 73 85 97 109
121
133
145
157
169
181
193
205
217
229
Month
IRI (
m/k
m)
Baseline CGCM2A2x scenario HadCM3B21 scenario
0
0.20.4
0.6
0.81
1.2
1.4
1.61.8
2
1 13 25 37 49 61 73 85 97 109
121
133
145
157
169
181
193
205
217
229
Month
IRI (
m/k
m)
Baseline CGCM2A2x scenario HadCM3B21 scenario
Figure D-31. IRI performance at the Newfoundland site (St. John’s) under baseline and future climate scenarios assuming 0(left) and 4(right) percent annual increase in traffic
0
1
2
3
4
5
6
1 13 25 37 49 61 73 85 97 109
121
133
145
157
169
181
193
205
217
229
Month
Long
itudi
nal C
rack
ing
(m/k
m)
Baseline CGCM2A2x scenario HadCM3B21 scenario
0
2
4
6
8
10
12
1 13 25 37 49 61 73 85 97 109
121
133
145
157
169
181
193
205
217
229
Month
Long
itudi
nal C
rack
ing
(m/k
m)
Baseline CGCM2A2x scenario HadCM3B21 scenario
Figure D-32. Longitudinal cracking performance at the Newfoundland site (St. John’s) under baseline and future climate scenarios assuming 0(left) and 4(right) percent annual increase in traffic
0
0.01
0.02
0.03
0.04
0.05
0.06
0.07
0.08
0.09
1 13 25 37 49 61 73 85 97 109
121
133
145
157
169
181
193
205
217
229
Month
Alli
gato
r Cra
ckin
g (%
)
Baseline CGCM2A2x scenario HadCM3B21 scenario
0
0.02
0.04
0.06
0.08
0.1
0.12
0.14
0.16
1 13 25 37 49 61 73 85 97 109
121
133
145
157
169
181
193
205
217
229
Month
Alli
gato
r Cra
ckin
g (%
)
Baseline CGCM2A2x scenario HadCM3B21 scenario
Figure D-33. Alligator cracking performance at the Newfoundland site (St. John’s) under baseline and future climate scenarios assuming 0(left) and 4(right) percent annual increase in traffic

The Road Well-traveled: Implications of Climate Change for Pavement Infrastructure in Southern Canada 217
0
50
100
150
200
250
300
350
400
450
1 13 25 37 49 61 73 85 97 109
121
133
145
157
169
181
193
205
217
229
Month
Tran
sver
se C
rack
ing
(m/k
m)
Baseline CGCM2A2x scenario HadCM3B21 scenario
0
50
100
150
200
250
300
350
400
450
1 13 25 37 49 61 73 85 97 109
121
133
145
157
169
181
193
205
217
229
Month
Tran
sver
se C
rack
ing
(m/k
m)
Baseline CGCM2A2x scenario HadCM3B21 scenario
Figure D-34. Transverse cracking performance at the Newfoundland site (St. John’s) under baseline and future climate scenarios assuming 0(left) and 4(right) percent annual increase in traffic
0
0.2
0.4
0.6
0.8
1
1.2
1.4
1.6
1 13 25 37 49 61 73 85 97 109
121
133
145
157
169
181
193
205
217
229
Month
AC
Rut
ting
(mm
)
Baseline CGCM2A2x scenario HadCM3B21 scenario
0
0.20.4
0.6
0.81
1.2
1.4
1.61.8
2
1 13 25 37 49 61 73 85 97 109
121
133
145
157
169
181
193
205
217
229
Month
AC
Rut
ting
(mm
)
Baseline CGCM2A2x scenario HadCM3B21 scenario
Figure D-35. AC rutting performance at the Newfoundland site (St. John’s) under baseline and future climate scenarios assuming 0(left) and 4(right) percent annual increase in traffic
0
12
34
5
67
89
10
1 13 25 37 49 61 73 85 97 109
121
133
145
157
169
181
193
205
217
229
Month
Tota
l Rut
ting
(mm
)
Baseline CGCM2A2x scenario HadCM3B21 scenario
0
2
4
6
8
10
12
1 13 25 37 49 61 73 85 97 109
121
133
145
157
169
181
193
205
217
229
Month
Tota
l Rut
ting
(mm
)
Baseline CGCM2A2x scenario HadCM3B21 scenario
Figure D-36. Total rutting performance at the Newfoundland site (St. John’s) under baseline and future climate scenarios assuming 0(left) and 4(right) percent annual increase in traffic

The Road Well-traveled: Implications of Climate Change for Pavement Infrastructure in Southern Canada 218
02468
101214161820
Baseline CGCM2A2x HadCM3B21
Climate Change Scenario
Year
s to
reac
h m
aint
enan
ce li
mit
IRI Longitudinal cracking Alligator cracking
Transverse cracking AC rutting Total rutting
*values greater than 20 years indicate parameter limits not reached during design life Figure D-37. Years to reach performance parameter limits (50% reliability maintenance thresholds)
under 4 percent annual traffic growth scenario at the British Columbia site (Vancouver)
02468
101214161820
Baseline CGCM2A2x HadCM3B21
Climate Change Scenario
Year
s to
reac
h m
aint
enan
ce li
mit
(at 9
0% re
liabi
lity)
IRI Longitudinal cracking Alligator cracking Transverse cracking Total rutting
*values greater than 20 years indicate parameter limits not reached during design life Figure D-38. Years to reach performance parameter limits (90% reliability maintenance thresholds)
under 4 percent annual traffic growth scenario at the British Columbia site (Vancouver)

The Road Well-traveled: Implications of Climate Change for Pavement Infrastructure in Southern Canada 219
02468
101214161820
Baseline CGCM2A2x HadCM3B21
Climate Change Scenario
Year
s to
reac
h m
aint
enan
ce li
mit
IRI Longitudinal cracking Alligator cracking
Transverse cracking AC rutting Total rutting
*values greater than 20 years indicate parameter limits not reached during design life Figure D-39. Years to reach performance parameter limits (50% reliability maintenance thresholds)
under 4 percent annual traffic growth scenario at the Alberta site (Edmonton)
02468
101214161820
Baseline CGCM2A2x HadCM3B21
Climate Change Scenario
Year
s to
reac
h m
aint
enan
ce li
mit
(at 9
0% re
liabi
lity)
IRI Longitudinal cracking Alligator cracking Transverse cracking Total rutting
*values greater than 20 years indicate parameter limits not reached during design life Figure D-40. Years to reach performance parameter limits (90% reliability maintenance thresholds)
under 4 percent annual traffic growth scenario at the Alberta site (Edmonton)
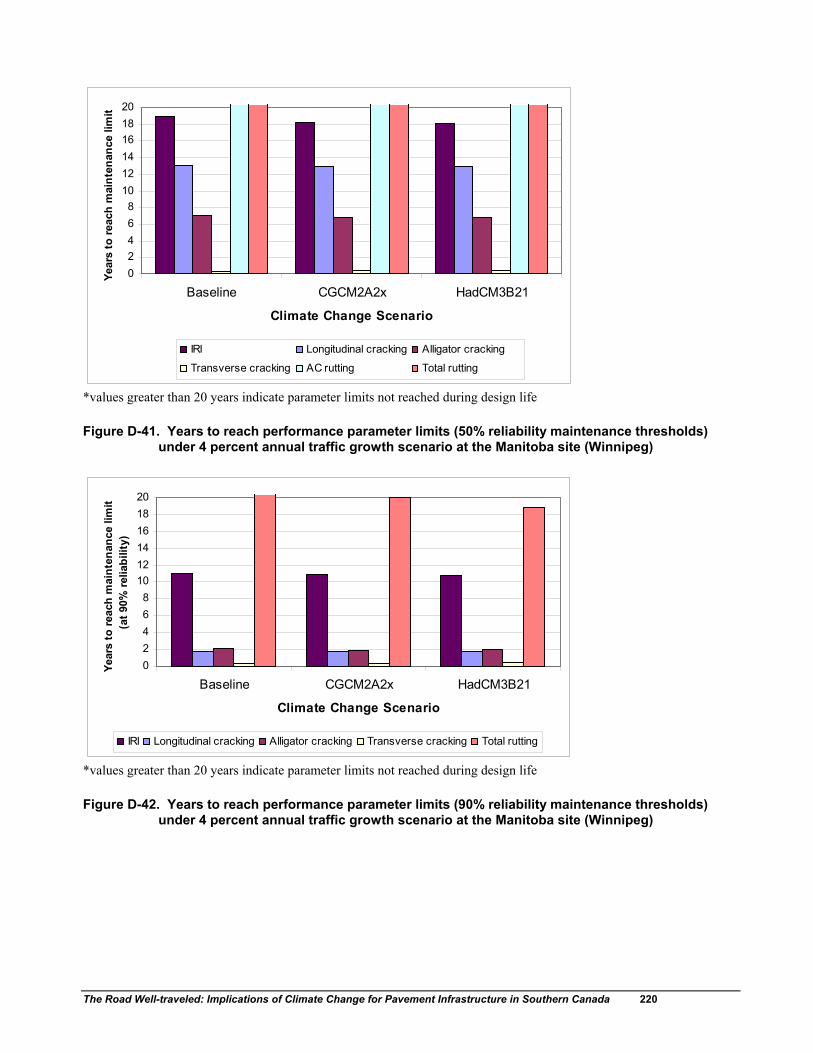
The Road Well-traveled: Implications of Climate Change for Pavement Infrastructure in Southern Canada 220
02468
101214161820
Baseline CGCM2A2x HadCM3B21
Climate Change Scenario
Year
s to
reac
h m
aint
enan
ce li
mit
IRI Longitudinal cracking Alligator cracking
Transverse cracking AC rutting Total rutting
*values greater than 20 years indicate parameter limits not reached during design life Figure D-41. Years to reach performance parameter limits (50% reliability maintenance thresholds)
under 4 percent annual traffic growth scenario at the Manitoba site (Winnipeg)
02468
101214161820
Baseline CGCM2A2x HadCM3B21
Climate Change Scenario
Year
s to
reac
h m
aint
enan
ce li
mit
(at 9
0% re
liabi
lity)
IRI Longitudinal cracking Alligator cracking Transverse cracking Total rutting
*values greater than 20 years indicate parameter limits not reached during design life Figure D-42. Years to reach performance parameter limits (90% reliability maintenance thresholds)
under 4 percent annual traffic growth scenario at the Manitoba site (Winnipeg)
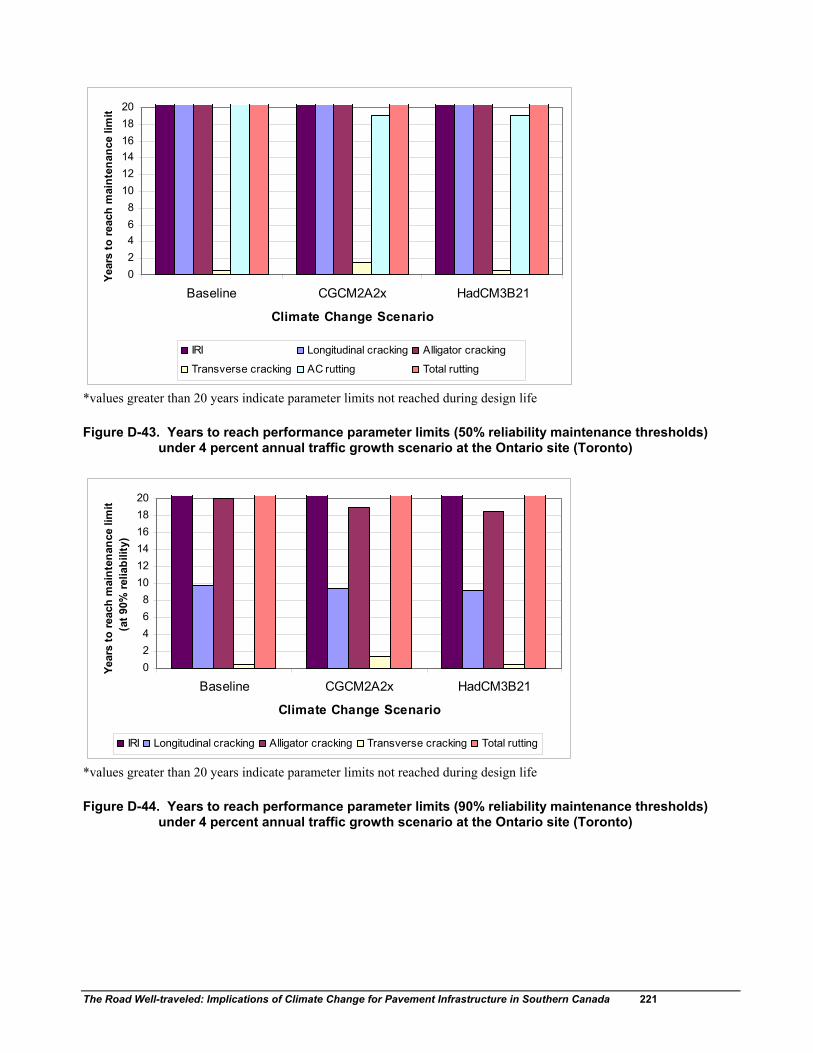
The Road Well-traveled: Implications of Climate Change for Pavement Infrastructure in Southern Canada 221
02468
101214161820
Baseline CGCM2A2x HadCM3B21
Climate Change Scenario
Year
s to
reac
h m
aint
enan
ce li
mit
IRI Longitudinal cracking Alligator cracking
Transverse cracking AC rutting Total rutting
*values greater than 20 years indicate parameter limits not reached during design life Figure D-43. Years to reach performance parameter limits (50% reliability maintenance thresholds)
under 4 percent annual traffic growth scenario at the Ontario site (Toronto)
02468
101214161820
Baseline CGCM2A2x HadCM3B21
Climate Change Scenario
Year
s to
reac
h m
aint
enan
ce li
mit
(at 9
0% re
liabi
lity)
IRI Longitudinal cracking Alligator cracking Transverse cracking Total rutting
*values greater than 20 years indicate parameter limits not reached during design life Figure D-44. Years to reach performance parameter limits (90% reliability maintenance thresholds)
under 4 percent annual traffic growth scenario at the Ontario site (Toronto)
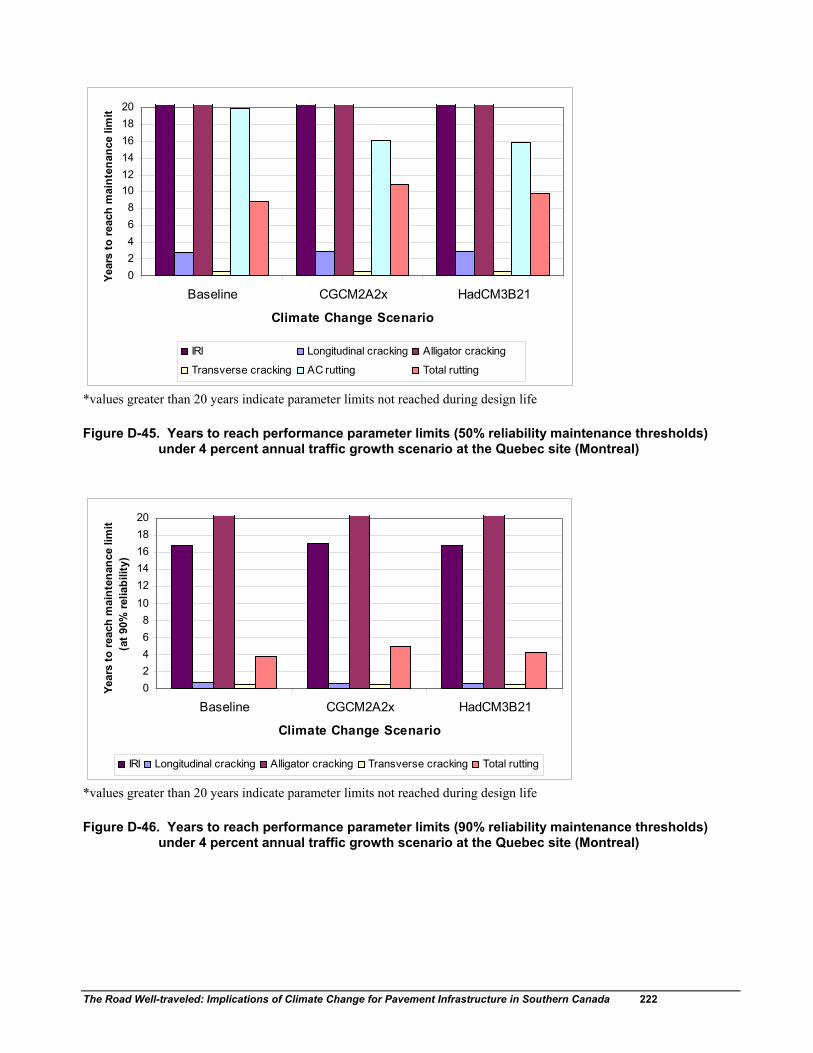
The Road Well-traveled: Implications of Climate Change for Pavement Infrastructure in Southern Canada 222
02468
101214161820
Baseline CGCM2A2x HadCM3B21
Climate Change Scenario
Year
s to
reac
h m
aint
enan
ce li
mit
IRI Longitudinal cracking Alligator cracking
Transverse cracking AC rutting Total rutting
*values greater than 20 years indicate parameter limits not reached during design life Figure D-45. Years to reach performance parameter limits (50% reliability maintenance thresholds)
under 4 percent annual traffic growth scenario at the Quebec site (Montreal)
02468
101214161820
Baseline CGCM2A2x HadCM3B21
Climate Change Scenario
Year
s to
reac
h m
aint
enan
ce li
mit
(at 9
0% re
liabi
lity)
IRI Longitudinal cracking Alligator cracking Transverse cracking Total rutting
*values greater than 20 years indicate parameter limits not reached during design life Figure D-46. Years to reach performance parameter limits (90% reliability maintenance thresholds)
under 4 percent annual traffic growth scenario at the Quebec site (Montreal)

The Road Well-traveled: Implications of Climate Change for Pavement Infrastructure in Southern Canada 223
02468
101214161820
Baseline CGCM2A2x HadCM3B21
Climate Change Scenario
Year
s to
reac
h m
aint
enan
ce li
mit
IRI Longitudinal cracking Alligator cracking
Transverse cracking AC rutting Total rutting
*values greater than 20 years indicate parameter limits not reached during design life Figure D-47. Years to reach performance parameter limits (50% reliability maintenance thresholds)
under 4 percent annual traffic growth scenario at the Newfoundland site (St. John’s)
02468
101214161820
Baseline CGCM2A2x HadCM3B21
Climate Change Scenario
Year
s to
reac
h m
aint
enan
ce li
mit
(at 9
0% re
liabi
lity)
IRI Longitudinal cracking Alligator cracking Transverse cracking Total rutting
*values greater than 20 years indicate parameter limits not reached during design life Figure D-48. Years to reach performance parameter limits (90% reliability maintenance thresholds)
under 4 percent annual traffic growth scenario at the Newfoundland site (St. John’s)