Embed Size (px)
Citation preview

Implications of fiscal issues for central banks: Mexico’s experience
José Sidaoui
1. Introduction
During the past decade there has been a widespread movement to grant independence to central banks.1 In most cases, the movement has been accompanied by a sole mandate to pursue price stability (defined as the attainment of a low level of inflation) to guarantee the monetary authorities’ firm commitment without being influenced by fiscal considerations. Nevertheless, the government’s fiscal policies remain of concern even for price-stability-focused independent central banks for at least two reasons: fiscal dominance over monetary policy and the impact of fiscal policies on aggregate demand and supply.
Fiscal dominance occurs when the effectiveness and credibility of monetary policy are jeopardised by the size of fiscal imbalances (eg unsustainable expansionary policy or debt dynamics), an issue related to the public finance approach to inflation initiated by Phelps (1973). The risks associated with fiscal dominance have been addressed in both advanced and developing countries by adopting fiscal rules with the primary objective of conferring credibility on macroeconomic policies. A good example of these rules is included in the European Union’s Stability and Growth Pact, which explicitly refers to the “objective of sound government finances as a means of strengthening the conditions for price stability and for strong sustainable growth conducive to employment creation”.2 Fiscal imbalances can translate into reserve losses, unstable exchange rates, balance of payments crises and higher inflation (Van Wijnbergen (1991)). In effect, this was Mexico’s experience in the late 1970s and the early 1980s.
To assess the risks of fiscal dominance and the sustainability of fiscal accounts, and the dynamics of the public sector debt, the Banco de México (Mexico’s central bank) closely follows the evolution of public finances. The broad definitions of the fiscal deficit (public sector borrowing requirement, PSBR) and of total public sector debt,3,4 together with estimations and stress tests of the public sector debt dynamics, are closely monitored to detect sustainability problems early.
Due to the constitutional mandate, in Mexico the oil and electricity industries belong to the state; thus, a significant amount of resources must be devoted to investment projects in these sectors. Hence, any analysis of the sustainability of public finances must take into account that oil and electricity investments will generate the cash flow needed to repay the associated debt some years after the initial expenditures are made. In addition, the state’s control over these sectors gives the government a significant say over energy prices, changes in which can create supply side pressures on headline inflation.
Besides fiscal dominance, fiscal policy can pose considerable challenges to monetary policy through its impact on domestic demand, which may significantly affect the price level. In this context, indicators such as the public sector economic and primary balances are not enough to evaluate the fiscal stance. Consequently, the central bank uses indicators that only consider those items that have an impact on
1 In 1994 the Mexican central bank was granted autonomy, having as a constitutional mandate to preserve the purchasing
power of the country’s currency. 2 This was translated into a medium-term objective of budgetary positions close to balance or surplus, but allows normal
cyclical fluctuations while keeping the government deficit within 3% of GDP and general government gross debt below 60% of GDP.
3 The total net debt includes the financial debt of the federal government and the state-owned enterprises, the liabilities of the Banking Institute for the Protection of Savings (IPAB), the off-budget investment projects (PIDIREGAS), the liabilities of the Public Fund for the Administration of Toll Roads (FARAC) and subtracts the assets of all these agents.
4 Measured as the public sector’s revenues less expenses, excluding interest payments.
180 BIS Papers No 20

aggregate demand. Furthermore, measures of the fiscal impact are also calculated in order to analyse the discretionary behaviour of the fiscal authorities.
In Mexico’s experience, the inflationary consequences of fiscal policies come from both the fiscal stimulus to aggregate demand and the previously mentioned government influence over energy prices (supply shock). The influence that government policies have on private domestic consumption and investment through the incentives embedded in the tax code and purchases of goods and services also need to be considered.
Increases in administered prices and indirect taxes should only have a once-and-for-all effect on the general price level (supply shocks). Nonetheless, second-round effects may appear if such rises contaminate inflation expectations. For this reason, the Banco de México routinely assesses the behaviour of prices of public sector goods and services and accordingly tightens its monetary policy when it deems it necessary to defuse such second-round effects. On the other hand, even though increases in administered prices or indirect taxes could have an adverse effect on inflation, they could improve public accounts. In this regard, the central bank has made clear the desirability of strengthening fiscal sustainability in the medium term, even if headline inflation rises temporarily above the target. Furthermore, having sound fiscal accounts would enable the central bank to pursue countercyclical monetary policies when needed.
This paper provides a brief description of the most relevant indicators that the Banco de México uses to evaluate the fiscal stance, which takes into consideration the increasingly important role of contingent liabilities.5 It also deals with the indicators used to measure the impact of fiscal policy on domestic demand. This information is useful for properly assessing fiscal sustainability and inflationary pressures in order to determine the appropriate stance of monetary policy to attain price stability. The second section evaluates the sustainability of fiscal accounts and public sector debt dynamics, including a stress test exercise. The third section presents the adjustments made to the public sector balance (economic deficit) in order to have a useful definition to evaluate fiscal policy effects on aggregate demand, called the expanded operational balance. The fiscal impulse of this measure is also presented in order to analyse some aspects of the discretionary stance of fiscal policy. Finally, some conclusions are offered.
2. Fiscal dominance
One channel through which fiscal policy may affect the price level, as mentioned in the introduction, is related to expectations about the sustainability of public finances. In this section, we present the measures used by the Banco de México to analyse the fiscal situation and describe the behaviour of the public balance and PSBR, together with an assessment of the performance of public debt indicators.
Public balance
The design of the Mexican tax system has been regarded as one of the most neutral and progressive among the OECD countries; see Dalsgaard (2000). However, in practice it has a low revenue raising capacity. While the average tax revenue for OECD countries for the 1997-2001 period was 38% of GDP, for Mexico it was only 18% of GDP.6
Another interesting issue is that oil-related income represents around one third of total government income. This fiscal dependence on oil revenues renders government finances vulnerable to changes in the international price of oil, since it affects financial planning as well as the continuity of public
5 In Mexico, fiscal contingent liabilities result mainly from the financial and debtor support programmes associated with the
banking crisis of the mid-1990s and from off-budget energy sector investments. 6 This figure differs from the 10.7% that is usually reported in Mexico because the OECD methodology includes an estimation
of social security contributions (3.0%), taxes on payroll and workforce (0.2%), taxes on property (0.2%) and duties (oil fees and others (3.2%)).
BIS Papers No 20 181

sector programmes. It is important to note that to achieve macroeconomic goals, and in particular fiscal targets, revenue shortfalls due to oil price falls have triggered government expenditure cuts. This reliance on oil revenues has been exacerbated by the lack of an adequate oil price stabilisation fund or a long-run hedging strategy.
Regarding public expenditures, the Mexican government needs funds to cope with the costs of the recent banking crisis and social security system reform, in addition to the resources needed for the provision of public goods (education, health, poverty alleviation and infrastructure) and to invest in electricity and oil projects.
In recent years the government has been able to attain low budget deficits (Table 1), especially when considering the significant estimated fiscal cost of the banking crisis (approximately 16% of GDP in NPV terms). This fiscal effort has involved a contraction in public expenditures, revenues raised from the privatisation of public enterprises and transitory increases in oil prices. It is important to recognise that these adjustments cannot be sustained in the long run. Therefore, the government has an increasing need to boost stable and reliable revenue sources in order to maintain healthy public finances and meet the provision of public goods.
Table 1
Public sector balance and PSBR % of GDP
1994 1995 1996 1997 1998 1999 2000 2001 2002
Economic balance 0.1 0.0 0.0 0.7 1.3 1.1 1.1 0.7 1.2
Primary balance –2.1 –4.7 –4.3 –3.5 –1.7 –2.5 –2.6 –2.6 –1.8
PSBR 3.0 3.0 4.8 4.5 5.9 5.9 3.3 3.1 2.6
Overall, in spite of confronting a gradual structural weakening of the public finances, in recent years there has been a strong effort to improve the fiscal accounts. The behaviour of the fiscal authorities has reinforced fiscal management credibility by attaining a sustainable public sector debt path, thus allowing monetary policy to achieve price stability. This is confirmed by the fact that since the early 1990s, the primary balance has exceeded the amount required to maintain constant the debt/GDP ratio (using the previous-period total debt/GDP ratio, and either the current-year or long-term real interest rates and GDP growth (Table 2)).7
Public sector debt dynamics
In 1994, mainly in response to macroeconomic conditions, the composition of public debt was tilted to the short-term and exchange rate indexed instruments. Clearly, this strategy proved vulnerable to a change in perception of the government’s ability to roll over its debt and maintain the fixed exchange rate. Thus, over the years the improvement of debt management has been a key element in achieving macroeconomic stability and strengthening public finances. In recent years, public debt management has pusued three main objectives: (a) a reduction of foreign debt; (b) the development of a yield curve for bonds issued in international and domestic markets, allowing for an increase in the duration of securities issued; and (c) the smoothing of the amortisation schedule of foreign debt.
7 See Buiter (1997). Primary balance needed to maintain the debt/GDP ratio constant: (r–g) / (1+g)*domestic debt/GDP ratio
+ (1+ r*)(1+e) / (1+g)*external debt/GDP ratio (where r is the real domestic interest rate, r* the external interest rate, e real depreciation, and g real GDP growth).
182 BIS Papers No 20

Table 2
Primary deficit1
% of GDP
Actual Required2 (long-term3) Required2 (current4)
1990 –7.2 0.7 –0.7
1991 –4.8 1.3 –0.8
1992 –5.2 0.6 –0.7
1993 –3.3 –0.8 –0.5
1994 –2.1 –1.3 –0.4
1995 –4.7 –3.2 –0.7
1996 –4.3 5.6 –1.6
1997 –3.5 2.5 –1.2
1998 –1.7 –1.5 –1.1
1999 –2.5 1.4 –1.2
2000 –2.6 0.7 –1.1
2001 –2.6 –2.1 1.0
2002 –2.4 –2.6 –1.0
1 Negative means surplus. 2 Primary balance required so that the debt/GDP ratio of the next period remains constant. 3 Estimated using long-term interest rates and GDP growth. 4 Using the current level of such variables.
An important element of this strategy has been for the public sector to rely exclusively on the domestic market to finance the public sector deficit (excluding off-budget investment projects (PIDIREGAS; see footnote 8)). Additionally, the government has gradually improved the composition of domestic debt, depending less on indexed (inflation or exchange rate) and floating rate securities, and more on fixed rate long-term bonds, thus lengthening its average maturity (Graph 1).
Graph 1Average maturity and duration of domestic
government debt
350
450
550
650
750
850
950
Jan 1998
May Sep 1998
Jan May 1999
Sep Jan 2000
May Sep 2000
Jan May 2001
Sep Jan 2002
May Sep 2002
0
0.2
0.4
0.6
0.8
1.0
1.2
Average maturity
Duration
Years Days
Source: Bank of Mexico.
BIS Papers No 20 183

On the other hand, the management of foreign debt has focused on lengthening its maturity, reducing the rollover risks by avoiding a large concentration of maturities in a given year and reducing its costs through conducting significant buybacks of expensive securities such as Brady Bonds. This strategy has led to a significant contraction of public foreign debt, together with a relative increase in domestic public debt.
Nonetheless, the public sector’s contingent liabilities have increased due to the fiscal cost of the resolution of the banking crisis and the development of PIDIREGAS8 as a mechanism to undertake electricity and oil related investment projects without having a direct impact on fiscal accounts. Therefore, Banco de México uses a broader measure of public sector debt that includes the aforementioned items, in order to assess its sustainability (Table 3). 9
Table 3
Total net public sector debt End-year, as a percentage of GDP
1994 1995 1996 1997 1998 1999 2000 2001 2002
Net broad economic debt 32.3 37.0 27.6 22.1 24.5 21.9 20.7 20.1 22.8
Contingent items 1.2 5.1 9.3 13.7 14.2 17.5 16.6 16.5 17.4 IPAB1 1.2 5.1 8.4 10.5 9.8 11.7 10.3 10.7 10.4 FARAC2 – – – 1.9 1.9 2.0 1.9 2.1 2.3 UDI3 restructuring
programmes – – 0.6 0.5 0.5 0.7 0.6 0.7 0.7
Direct PIDIREGAS – – 0.1 0.4 1.3 2.3 2.8 2.7 3.9 Debtor support programmes – 0.0 0.2 0.5 0.6 0.9 0.5 0.3 0.1
Total net public sector debt (a + b) 33.5 42.1 36.8 35.8 38.7 39.4 36.9 36.6 40.2
Memorandum: Total gross public sector debt 65.1 65.6 56.0 58.4 59.5 65.2 58.4 53.7 57.9
Total public sector debt net of liquid assets 45.2 48.9 36.6 31.5 34.7 47.2 42.8 42.6 46.6
1 Banking Institute for the Protection of Savings. 2 Public Fund for the Administration of Toll Roads. 3 Off-budget public investment projects.
Stress tests on total public debt including contingent liabilities were performed to evaluate the vulnerability and soundness of the fiscal accounts. Several authors, including Blanchard (1990), Buiter (1997) and Talvi and Végh (2000), suggest similar methods to evaluate public finances’ viability. Fiscal sustainability is defined by IMF (2002) as “whether a country’s debt can be serviced without an unrealistically large future correction in the balance of income and expenditure”.
8 PIDIREGAS are public sector investment projects directly undertaken by the private sector. This project-financing
mechanism was developed to allow the government to undertake priority investment projects by contracting them out to the private sector, while deferring their registration as government expenditure in the budget. The private sector provides the financing during the construction and until the government acquires the assets. While the information on the stock of PIDIREGAS liabilities is publicly available, the public debt statistics do not consolidate this information with the external debt. Each year only the debt service for the following two years are consolidated with the public debt, while the remaining outstanding stock is classified as a contingent liability.
9 This measure does not take into consideration other obligations related to the pension system such as liabilities of IMSS and ISSSTE which for 1999 were estimated at 45% and 34% of GDP respectively; Santaella (2001).
184 BIS Papers No 20

The following analysis of the sustainability of public finances is based on the so-called stress tests (which are of a partial equilibrium nature). These provide a useful estimation of the impact on public debt coming from shocks to interest rates, GDP growth, and the primary balance. Additionally, a crisis scenario is considered including an interest rate shock and a significant real exchange rate depreciation. The different scenarios are as follows:
Baseline: 2.8% real depreciation for 2003 and zero for the rest of the estimation period; real GDP growth of 2.8% for 2003, 3.7% for 2004, 3.8% for 2005 and 4.1% until 2008; primary surplus of 2.3% of GDP for 2003 and 2% of GDP until 2008; real domestic interest rate of 3.6% for 2003, 5.1% for 2004 and 2005, and 5% for the rest of the period; and interest cost of external debt of 7.6% until 2008.10
Sensitivity to GDP growth: No growth from 2003 to 2005, and 4.1% real growth the rest of the period.
Sensitivity to interest rates: Domestic real interest rate increases to 10% and the external rate to 8.2% from 2003 until 2005.
Sensitivity to primary balance: Reduction of the primary surplus to 1% of GDP from 2003 until 2005.
Crisis scenario: Real depreciation of 52% and 23% in 2003 and 2005 respectively, and real appreciation of 2% in 2004; no real exchange rate variation for the rest of the period; and a real domestic interest rate of 10% and an external rate of 8.2% for the period 2003-05, and the baseline scenario for 2006-08.
Graph 2
Stress tests on total public sector debt % of GDP
27
31
35
39
43
47
51
55
2001 2002 2003 2004 2005 2006 2007 2008
Baseline scenario
Sensitivity to GDP growth
Sensitivity to interest rates
Sensitivity to primary surplus
Crisis scenario
The stress tests show that the public debt dynamics can endure significant adverse scenarios (Graph 2). However, it is important to indicate that the simulated adverse conditions for the different scenarios are only transitory, ie the macroeconomic scenarios assume that after the variables undergo the different shocks, they return to their expected values. Clearly, this allows the debt/GDP ratio to maintain a downward trend.
10 The baseline scenario for 2003 is based on Banco de México’s February survey of economic expectations. For the following
years it is consistent with the “macroeconomic scenario without structural reforms” presented in the National Programme for the Financing of Development (PRONAFIDE).
BIS Papers No 20 185
The most interesting results are:
• The highest debt level attained in the exercise is below 55% of GDP, and this would only occur in the crisis scenario that includes real exchange rate depreciations similar to those observed in Brazil during 1999-2001 (52%, –2% and 23%) and significant real interest rate increases (real domestic and external interest rates of 10% and 8.2%, respectively).
• Likewise, public debt would continuously increase, although moderately, until the year 2005 if there was no economic growth during the next three consecutive years, as occurred in Argentina (sensitivity to GDP growth).
Regarding these first two results, it should be noted that, clearly, the prevailing circumstances in Brazil and Argentina were different from those currently observed in Mexico.
• On the other hand, public debt will follow a downward trend even in a context of significant increases in interest rates. Even if the real domestic and the external interest rates were to reach the maximum levels registered in Mexico during the period 1995-2001 for three consecutive years, public debt would continue to fall as a percentage of GDP (sensitivity to interest rates).
3. Fiscal policy stance
Effects of fiscal policy on aggregate demand: the expanded operational balance
Even though the Ministry of Finance provides a wide range of information concerning different elements of fiscal policy, it does not fully depict its impact on aggregate demand. As is well known, information about the behaviour of fiscal policy is essential for the determination of monetary policy; see Taylor (1995). An accurate measure of the fiscal position’s effects on internal demand is of utmost importance for the central bank, because of its impact on the price level. All transactions by the government with such an impact should be included in the indicator, regardless of whether they were part of a deliberate policy or not. This is because both types of actions, intentional or not, affect internal demand and thus may affect the price level.
In order to evaluate the effect of the public sector’s decisions on aggregate demand, some adjustments are made to the standard measure of economic deficit. Those items of public revenue related to financial operations (eg banking deposits of state-owned institutions and debt buybacks) are subtracted, as well as those income items that are not collected from the domestic private sector; see Blejer and Cheasty (1991). The adjusted measure is called expanded operational balance (EOB).11
This section briefly describes the adjustments that traditional Mexican fiscal accounts need in order to adequately assess the stance of fiscal policy and its relationship with aggregate demand. In particular, on the expenditure side the items included are:
• Domestic purchases of goods and services. The EOB should include those undertaken by the federal government, by the state-owned enterprises (including off-budget sector), and the sub-national governments’ expenses tagged to federal revenue-sharing programmes.
• Personal transfers (which constitute a source of income to private agents).
• Total investment in buildings, domestic equipment and machinery, including off-budget investment projects (PIDIREGAS).
• The real component of domestic interest payments, including transfers to the deposit insurance fund (IPAB) and debtor relief programmes (ADE).12
11 The operational balance is defined as the primary surplus minus real interest payments. 12 This is obtained by subtracting the inflationary adjustment of the principal from nominal interest payments.
186 BIS Papers No 20

On the revenue side the following should be included:
• taxes;
• non-oil duties;
• social security contributions;
• federal domestic sales of goods and services (including off-budget sector).
Finally, the financial intermediation of development banks and public trust funds is also included because credit granted by these institutions may not reflect market conditions and is destined for sectors that would only have access to credits at very high rates or not at all.
The EOB is an indicator designed to register only those components of public finances that may have an impact on aggregate demand. Nevertheless, the economic deficit and primary surplus that the Ministry of Finance has traditionally published originally pursued a similar end. Thus, in what follows, the three concepts will be compared. In general, the behaviour of the EOB differs from that of the other two concepts. The PSBR, a broader measure of the public balance, is also included, although it does not have the specific purpose of evaluating the impact of fiscal policy on aggregate demand (Graph 3).
Graph 3
Indicators of fiscal policy stance1 % of GDP
–8.0
–6.0
–4.0
–2.0
0.0
2.0
4.0
6.0
1990 1991 1992 1993 1994 1995 1996 1997 1998 1999 2000 2001 2002
EOB Economic balance
Primary balance PSBR
1 A positive number represents a deficit, a negative number a surplus. Sources: Ministry of Finance; Banco de México.
To compare the usefulness of the suggested fiscal definitions, a VAR is used to measure the effect that each fiscal policy component has on GDP. Thus, the VAR includes GDP and public revenues, expenses and the fiscal balance for each of the definitions presented.13 Estimating separately the effect on GDP of revenues and expenses, in addition to the fiscal balance, allows their distinct effect on aggregate demand to be captured. The real exchange rate (EXRATE) is also included in order to control for other elements that influence GDP.
Three specifications were estimated using different concepts of public revenues and expenditures according to the different measures: (i) from the economic balance, total public expenditures (budget and off-budget) (TOTEXP), total public revenues (TOTREV) and the economic balance (ECOBAL); (ii) from the primary balance, public expenditures (TOTPRIMEXP), total public revenues (TOTREV)
13 This analysis is not possible for the PSBR because quarterly data are only available from 2000.
BIS Papers No 20 187

and the primary balance (PRIMBAL); and (iii) from the EOB, the modified public revenues (EOBREV), expenditures with financial intermediation (EOBEXPFI) and the expanded operational balance (EOB). Quarterly data expressed in real terms from 1990 to 2002 were used. Furthermore, the variables were in levels since cointegration could not be rejected (Annex D).
Graph 4 shows three columns of impulse response functions of GDP. Each column is associated with one of the fiscal measures considered. The response of GDP to a 1 percentage point increase in the variables associated with the economic balance is insignificant. Such functions are shown in the first column and correspond to the economic balance (ECOBAL), expenditures (TOTEXP) and revenues (TOTREV). This suggests that this concept is not the right definition to measure the effect of fiscal policy on the economy.
Graph 4
Impulse response functions
VAR estimated with TOTREV, TOTEXP, GDP and EXRATE
VAR estimated with TOTREV, TOTPRIMEXP,
GDP and EXRATE
VAR estimated with EOBREV, EOBEXPFI
GDP and EXRATE
Response of GDP to TOTREV
Response of GDP to TOTREV
Response of GDP to EOBREV
Response of GDP to TOTEXP
Response of GDP to TOTPRIMEXP
Response of GDP to EOBEXPFI
VAR estimated with ECOBAL, GDP and
EXRATE
VAR estimated with PRIMBAL, GDP and
EXRATE
VAR estimated with EOB, GDP and
EXRATE
Response of GDP to ECOBAL
Response of GDP to PRIMBAL
Response of GDP to EOB
-1.2 -1.0 -0.8 -0.6 -0.4 -0.2 0.0 0.2 0.4 0.6 0.8
1 2 3 4 5 6 7 8 9 10
% o
f GD
P
-1.0 -0.8 -0.6 -0.4 -0.2 0.0 0.2 0.4 0.6 0.8
1 2 3 4 5 6 7 8 9 10
% o
f GD
P
-3.0-2.5-2.0-1.5-1.0-0.50.00.51.01.52.0
1 2 3 4 5 6 7 8 9 10
% o
f GD
P
-0.6 -0.4 -0.2 0.0 0.2 0.4 0.6 0.8
1 2 3 4 5 6 7 8 9 10
% o
f GD
P
-1.0 -0.5 0.0 0.5 1.0 1.5
1 2 3 4 5 6 7 8 9 10
% o
f GD
P
-0.1
0.0
0.1
0.2
0.3
0.4
0.5
0.6
0.7
0.8
1 2 3 4 5 6 7 8 9 10
% o
f GD
P
-0.9 -0.6 -0.3 0.0 0.3 0.6 0.9
1 2 3 4 5 6 7 8 9 10
% o
f GD
P
-0.6 -0.3 0.0 0.3 0.6 0.9 1.2
1 2 3 4 5 6 7 8 9 10
% o
f GD
P
0.0
0.10.2
0.30.4
0.5
0.60.7
0.8
1 2 3 4 5 6 7 8 9 10
% o
f GD
P
188 BIS Papers No 20

In the lower section of the second column, the response of GDP to the primary balance (PRIMBAL) is significant and positive starting from the third quarter. Something similar occurs with its expenditure measure (TOTPRIMEXP), except that this one is insignificant in the fourth period. This result shows an improvement with respect to the economic balance. Finally, the response of GDP to a shock to EOB and its expenditures (EOBEXP) is positive and significant, for the first variable starting from the first period, and for the second beginning in the second quarter after the shock.
Although from the revenue side the response of the three measures is negative and insignificant, at a 10% confidence level the GDP response to a shock to EOB revenues (EOREV) is significant after four quarters. The behaviour of the balance measure for the three fiscal definitions (ECOBAL, PRIMBAL and EOB) is very closely related to the expenditure variable associated with each indicator. This may indicate that the expenditure side is responsible for most of the impact on GDP caused by the impulses in the balance variables. This is supported by the insignificant responses of GDP to the revenue variables (at conventional levels).
Graph 5
Fiscal measures (expressed in differences) and GDP growth % of GDP
–7.0
–4.0
–1.0
2.0
5.0
8.0
1990 1991 1992 1993 1994 1995 1996 1997 1998 1999 2000 2001 2002 Real GDP growth EOB
Economic balance Primary balance
PSBR
Sources: Ministry of Finance; Banco de México.
Fiscal impulse refers to the change in the fiscal balance, and it is seen as a measure of the impact of fiscal policy on aggregate demand. This concept is traditionally related to the structural fiscal balance, which excludes the effect of the business cycle and provides an estimate of discretionary fiscal policy (see the following subsection). Nonetheless, as an illustrative exercise, the change in the different measures of the fiscal balance (economic, primary, PSBR and EOB) and GDP growth are presented in Graph 5, where a procyclical fiscal policy is detected, especially with the EOB. This argument is reinforced when considering the correlation between GDP growth and the fiscal impulse, measured by the different definitions of fiscal balance (Table 4). This contrasts with fiscal policy in OECD countries, which is normally characterised as countercyclical, in accordance with theoretical propositions.14 However, to conclude that fiscal policy in Mexico has been procyclical, the effect of the business cycle on the fiscal accounts has to be considered.
14 Keynesian as well as business cycle models, although for different reasons, usually indicate that fiscal policy should be
countercyclical; see Madero and Ramos-Francia (2000).
BIS Papers No 20 189

Table 4
Correlation coefficient between real GDP growth and measure of fiscal impulse
EOB Economic balance Primary economic balance PSBR
1980-2002 0.62 0.11 0.62 ...
1980-1990 0.57 0.15 0.71 ...
1990-2002 0.57 –0.06 0.57 –0.14
Fiscal impulse
Discretionary fiscal policy is the deliberate attempt by the government to adjust the fiscal position. The fiscal impulse indicators evaluate this type of variation of the fiscal balance; see Chand (1993). It is important for the central bank to be aware of the intended adjustments of the fiscal authority.
Measuring the adjustment in the public balance due to the deliberate intervention of the government requires distinguishing between the cyclically adjusted and the actual balance. Public expenditures and revenues have country-specific cyclical components. Therefore, when economic activity is contracting, a deterioration of the fiscal accounts may occur for reasons other than a fiscal impulse, like the presence of automatic stabilisers. These are expenditure and taxation items already built in to stimulate economic activity during recessions and to temper it in periods of economic overheating. For developed countries, one of the most important stabilisers is unemployment compensation. When economic activity slows down, the expenditure on unemployment insurance increases, stimulating the economy. On the contrary, when economic activity is above potential, such unemployment insurance expenditure decreases.
In Mexico there is no unemployment insurance and the government has no other established mechanisms to offset recessions by increasing expenditures. Furthermore, Mexican law establishes that all state-owned enterprises might spend all extra income received during the same fiscal year, when approved by the Ministry of Finance, which is contrary to the recommended countercyclical policy.15
To accurately measure the fiscal impulse of discretionary policies, it is necessary to take into consideration the business cycle. In this section, three different methodologies of fiscal impulse are tested for the Mexican economy: the IMF, the OECD and the Dutch versions, all described in Annex A. For this exercise the EOB is used as the definition of fiscal balance. Potential GDP was calculated using a Hodrick-Prescott filter described in Annex B. For the IMF formula, 1997 was defined as the base year because GDP was close to its potential and public finances were nearly in balance. Finally, for the OECD methodology, income elasticities of fiscal revenues and expenditures were estimated following the methodology presented in Annex C. However, only fiscal revenues were adjusted, because in the absence of automatic expenditure stabilisers, as is the case in Mexico, the income elasticity of public expenditures mainly reflects the authorities’ discretionary changes and not cyclical components.
The results obtained with the three methodologies are very similar (Table 5 and Graph 6). This occurs because the same fiscal data and output gap are used. Thus, the three definitions point to the same direction of the fiscal authority’s discretionary action: a positive sign shows a fiscal impulse on aggregate demand whereas a negative one shows a restrictive fiscal policy.
15 The fiscal system contemplates the existence of an oil stabilisation fund that is intended to reduce the volatility of the oil
revenues. When the oil price is high, part of the extra revenues is saved, and when it is low, resources are spent to compensate for the low revenues. However, oil revenues are not directly related to economic activity. This means that oil revenue stabilisers cannot play an important role in a countercyclical fiscal policy. Besides, the oil stabilisation fund operates over a limited portion of current revenues. It cannot limit expenditures during booms nor compensate for non-oil revenues in recessions.
190 BIS Papers No 20
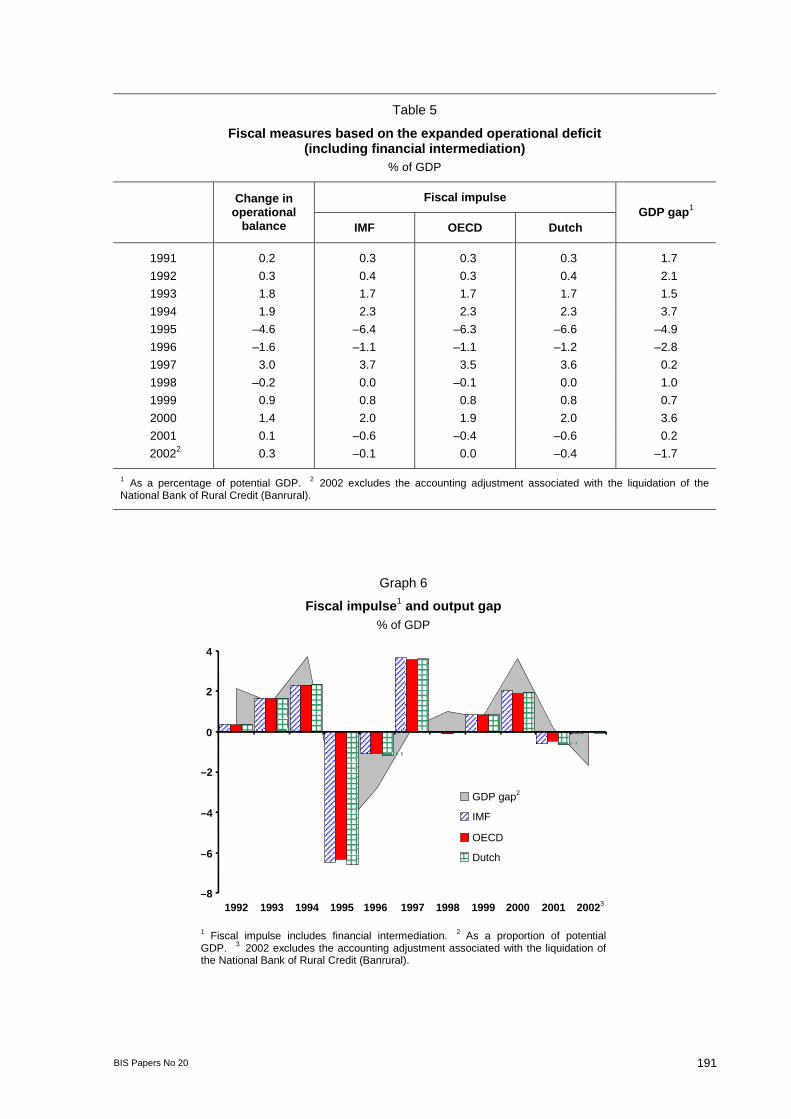
Table 5
Fiscal measures based on the expanded operational deficit (including financial intermediation)
% of GDP
Fiscal impulse Change in operational
balance IMF OECD Dutch GDP gap1
1991 0.2 0.3 0.3 0.3 1.7 1992 0.3 0.4 0.3 0.4 2.1 1993 1.8 1.7 1.7 1.7 1.5 1994 1.9 2.3 2.3 2.3 3.7 1995 –4.6 –6.4 –6.3 –6.6 –4.9 1996 –1.6 –1.1 –1.1 –1.2 –2.8 1997 3.0 3.7 3.5 3.6 0.2 1998 –0.2 0.0 –0.1 0.0 1.0 1999 0.9 0.8 0.8 0.8 0.7 2000 1.4 2.0 1.9 2.0 3.6 2001 0.1 –0.6 –0.4 –0.6 0.2 20022 0.3 –0.1 0.0 –0.4 –1.7
1 As a percentage of potential GDP. 2 2002 excludes the accounting adjustment associated with the liquidation of the National Bank of Rural Credit (Banrural).
Graph 6
Fiscal impulse1 and output gap % of GDP
–8
–6
–4
–2
0
2
4
1992 1993 1994 1995 1996 1997 1998 1999 2000 2001 20023
GDP gap2
IMF
OECD
Dutch
1 Fiscal impulse includes financial intermediation. 2 As a proportion of potential GDP. 3 2002 excludes the accounting adjustment associated with the liquidation ofthe National Bank of Rural Credit (Banrural).
BIS Papers No 20 191

The evidence of a procyclical fiscal policy remains after the fiscal measures are adjusted to eliminate the cyclical components derived from the business cycle. This behaviour of the fiscal authorities may be explained by the past nature of business cycles in Mexico. In this context, starting from the mid-1970s, and up to the mid-1990s, Mexico underwent recurrent balance of payments crises, which led to the contraction of public expenditures as part of the different economic stabilisation programmes. More recently, implementing a countercyclical policy has not been a policy option for the authorities, because of solvency risks faced by public finances and the need to improve their reputation for fiscal discipline.
In the past few years, the effort to maintain a credible macroeconomic framework has led to reductions in public expenditures, even during adverse situations such as lower international oil prices. This strategy of following a procyclical fiscal policy can be best understood in the context of an economy that is in the process of consolidating its fiscal accounts, and which still faces contingent liabilities not reflected in the broadest debt definition (primarily related to pension systems and other labour-related benefits). Therefore, priority has been given to the medium-term sustainability of the fiscal accounts and not to short-term cyclical considerations.
For the formulation of monetary policy it is important to be aware of the cyclical position of the economy as well as of the fiscal position that can be evaluated by the fiscal impulse. Deviations above potential growth may result in higher inflation; see Alesina et al (2001). When the economy is growing above its potential and the fiscal impulse is positive, it is more difficult for the monetary authority to reduce inflation. As an example, in 2000 when the Mexican economy grew 3.4 percentage points above potential and the fiscal impulse was 2% of GDP, monetary policy had to be tightened six times because of aggregate demand pressures (see the Banco de México’s 2000 Annual Report).
4. Conclusions
Fiscal policy raises two major concerns for monetary authorities: (a) avoiding fiscal dominance, and (b) inflationary pressures from the effects of fiscal measures on aggregate demand and supply. The supply shocks from fiscal policy decisions are particularly important in Mexico, since the government controls the prices of several goods and services in the economy (mainly energy-related).
Evidence has been presented in this paper that supports the idea that fiscal policy in Mexico, over the last two decades, has been procyclical, in contrast with what is normally seen in OECD countries. Nevertheless, this behaviour may be explained by the recent nature of business cycles in Mexico. In this context, for two decades between the mid-1970s and the mid-1990s there had been recurrent balance of payments crises, which forced severe contractions of public expenditures as part of stabilisation programmes. Implementing countercyclical fiscal policies has not been an option yet, because of the need to improve the reputation of fiscal discipline and to reduce solvency risks.
Fiscal policy has been procyclical because the Mexican economy is in the process of consolidating its fiscal accounts. Therefore, priority has been given to the medium-term sustainability of the fiscal accounts and not to short-term cyclical considerations. Even though this need of adjustment could induce larger swings in economic cycles in the short run, it has helped to improve the public sector debt dynamics and sustainability, which in turn have created a favourable environment for the reduction of inflation and inflationary expectations. Although stress tests show that only in severely adverse scenarios would the public debt deteriorate over the medium term, approval of the pending structural reforms by the congress would allow the government to reduce its financing requirements and redirect public expenditures to projects with a higher social impact. This would contribute to the consolidation of the fiscal accounts, which in turn would allow for a less procyclical fiscal policy, creating an environment where monetary policy could more effectively attain its inflation targets and reduce output volatility.
In sum, once fiscal dominance has been avoided, fiscal policy should aim to (a) keep price increases of goods and services provided by the government consistent with inflation expectations, cost considerations and, when relevant, with international prices, and (b) maintain a low and manageable fiscal deficit that does not constitute an unsuitable stimulus to aggregate demand.
192 BIS Papers No 20

Annex A: Measures of fiscal impulse
1. The IMF defines the cycle-adjusted fiscal stance (FS) as follows:
)()(0
0
0
0tPt
PtPtFMI Y
YTTY
YGGFS −−−=
Thus, the IMF measure of fiscal impulse (FI) can be expressed as:
)()(0
0
0
0 YYTTY
YGGFSFI P
PPFMIFMI ∆−∆−∆−∆=∆=
where:
Gt is public expenditure in period t
G0 is public expenditure during the base year
Tt is budgetary revenue in period t
T0 is budgetary revenue during the base year
Yt is GDP for the year
Y0 is GDP of the base year
YtP is potential output in period t
Y0P is potential output during the base year
2. The OECD calculates cycle-adjusted public revenues and expenditures:
))((1
1 pTADJ YY
YTTT −η−=
−
−
))((1
1 pGADJ YY
YGGG −η−=
−
−
where:
ηT is the income elasticity of taxes
ηG is the income elasticity of expenditures
G is public expenditure
G–1 is public expenditure the previous period
T is budgetary income
T–1 is budgetary income the previous period
Y is GDP
YP is potential output
GADJ is adjusted expenditures
TADJ is adjusted budgetary income
Thus, the fiscal impulse (FI) is defined as the change in the cycle-adjusted balance.
ADJADJOECD TGFI ∆−∆=
3. The formula for the Dutch version of fiscal impulse (FI) is:
)()( 11
11
−−
−−
∆−∆−∆−∆= TY
YTGYYGFI
P
P
Dutch
BIS Papers No 20 193

Annex B: GDP cyclical adjustment
The trend GDP used to cyclically adjust the fiscal balance was estimated using a Hodrick-Prescott filter.16 As can be seen in the following figures, the output gap is consistent with the recessions of 1982-83, 1986-88, 1995 and 2000-02.17
Actual and potential real GDP Output gap Percentage of potential GDP
800,000
900,000
1,000,000
1,100,000
1,200,000
1,300,000
1,400,000
1,500,000
1,600,000
1,700,000
1,800,000
80 82 84 86 88 90 92 94 96 98 00 02
Actual
Potential
–8
–6
–4
–2
0
2
4
6
80 82 84 86 88 90 92 94 96 98 00 02
16 The parameter lambda was set to a value of 1,600, as it is customary for quarterly data. 17 Recessions were defined as periods that start with two consecutive quarters of contraction and end with two consecutive
quarters of expansion.
194 BIS Papers No 20
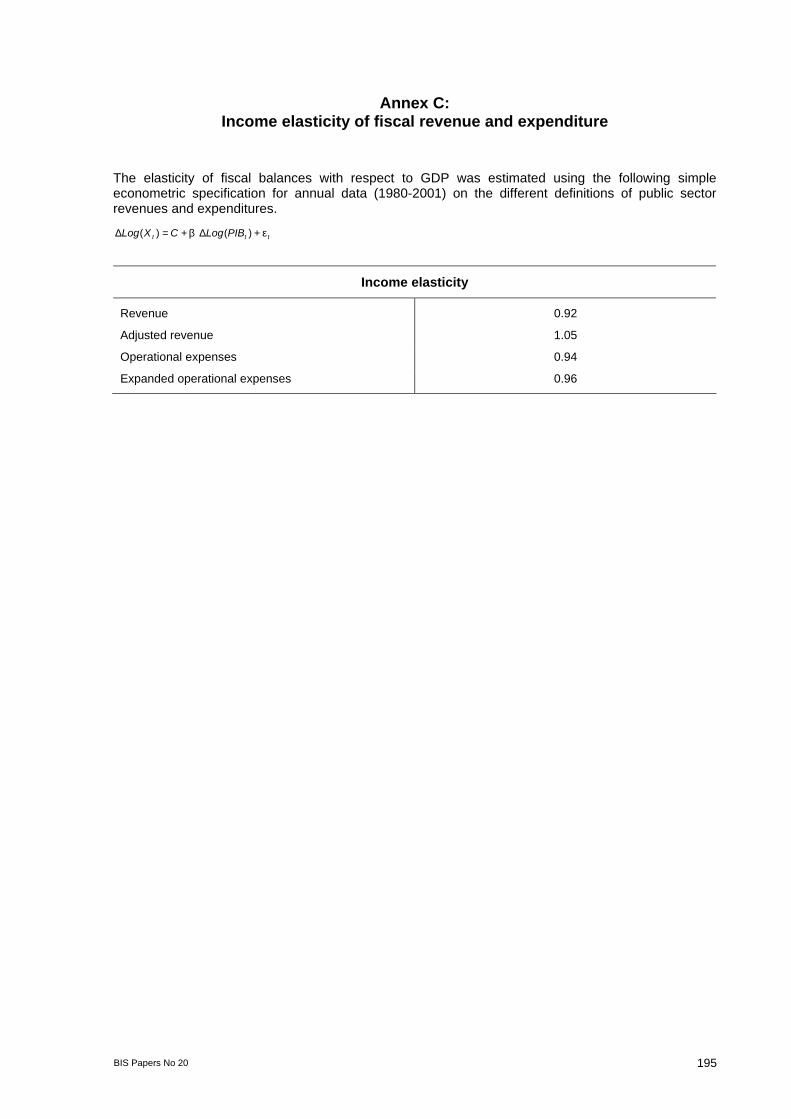
Annex C: Income elasticity of fiscal revenue and expenditure
The elasticity of fiscal balances with respect to GDP was estimated using the following simple econometric specification for annual data (1980-2001) on the different definitions of public sector revenues and expenditures.
ttt PIBLogCXLog ε+∆β+=∆ )()(
Income elasticity
Revenue 0.92
Adjusted revenue 1.05
Operational expenses 0.94
Expanded operational expenses 0.96
BIS Papers No 20 195

Annex D: Johansen cointegration tests
Johansen cointegration tests
Variables Null hypothesis Eigenvalue Statistic Critical
value 5% Critical
value 1%
TOTREV, TOTEXP, GDP, r = 0* 0.453 50.68 47.21 54.46 EXRATE r = 1 0.192 21.08 29.68 35.65
TOTREV, TOTPRIMEXP, r = 0** 0.547 64.24 47.21 54.46 GDP, EXRATE r = 1 0.244 25.44 29.68 35.65
EOBREV, EOBEXP, GDP, r = 0** 0.503 56.53 47.21 54.46 EXRATE r = 1 0.237 20.14 29.68 35.65
EOBREV, EOBEXPIF, GDP, r = 0** 0.671 80.57 47.21 54.46 EXRATE r = 1 0.283 22.78 29.68 35.65
r: number of cointegrating equations. *(**): null hypothesis is rejected at 5% (1%).
196 BIS Papers No 20

BIS Papers No 20 197
References
Alesina, A, O Blanchard, J Galí, F Giavazzi and H Uhlig (2001): “Defining a macroeconomic framework for the euro area”, Monitoring the European Central Bank, 3, CEPR.
Blanchard, O (1990): “Suggestions for a new set of fiscal indicators”, OECD Economics and Statistics Department Working Papers, no 79, OECD.
Blejer, M and A Cheasty (1991): “The measurement of fiscal deficits: analytical and methodological issues”, Journal of Economic Literature, vol 29, no 4, pp 1644-78.
Buiter, W (1997): “Aspects of fiscal performance in some transition economies under fund-supported programs”, International Monetary Fund Working Paper, no 97/31.
Chand, S (1993): “Fiscal impulse measures and their fiscal impact”, in M Blejer and A Cheasty (eds), How to measure the fiscal deficit, International Monetary Fund, Washington DC.
Dalsgaard, T (2000): “The tax system in Mexico: a need for strengthening the revenue-raising capacity”, OECD Economics Department Working Paper, no ECO/WKP(2000)6.
International Monetary Fund (2002): Assessing sustainability, IMF Policy Development and Review Department, mimeo.
Madero, D and M Ramos-Francia (2000): “Un panorama sobre la literatura económica en torno al manejo óptimo de la política fiscal”, Gaceta de Economía, Suplemento de Política Fiscal, Year 5, no 9, ITAM, pp 65-83.
Phelps, E (1973): “Inflation in a theory of public finance”, Swedish Journal of Economics, vol 75, pp 65-82.
Santaella, J (2001): “La viabilidad de la política fiscal: 2000-25” Gaceta de Economía, special issue, “Una agenda para las finazas públicas de México”, ITAM, pp 37-65.
Talvi, E and C Végh (2000): “La viabilidad de la política fiscal: un modelo macro básico”, in E Talvi and C Végh (eds), ¿Cómo armar el rompecabezas fiscal? Nuevos indicadores de sosteniblidad, Inter-American Development Bank, Washington DC.
Taylor, J (1995): Monetary policy implications of greater fiscal discipline, Stanford University.
Van Wijnbergen, S (1991): “Fiscal deficits, exchange rate crisis and inflation”, Review of Economic Studies, vol 58, no 1, pp 81-92.