Embed Size (px)
Citation preview
Vision Res. Vol. 27, No. 11, pp. 19034913, 1987 0042-6989/87 53.00 + 0.00 Printed in Great Britain. All fights reserved Copyright Q 1987 Pergamon Journals Ltd
IMPLICATIONS OF THE CRAIK-O’BRIEN ILLUSION FOR BRIGHTNESS PERCEPTION
DAVID C. BURR
Department of Psychology, University of Western Australia, Perth, WA 6009, Australia
(Receiupd 8 December 1986; in rev&d form 19 May 1987)
A@raet-Measurements are reported for detection thresholds of high and low-pass filtered squarewaves, and for brightness matches of those waveforms. The threshold measurements agree closely with those of Campbell, Howell and Johnstone [L Physiol., Land. 284, 193-201 (1978)J: contrasts at which a high-pass squarewave was indistinguishable from an unftltercd squarewave could be well predicted from detection thresholds for an appropriate low-pass squarewave. However, the brightness of high-pass squarewaves (the “Craik-O’Brien illusion”) was not related to the threshold measurements. Brightness was virtually constant with spatial frequency, even at spatial frequencies 10 times higher than the region of the low frequency cut. Brightness depended strongly on contrast, being relatively greater at low than at high contrasts. The results can be well accounted for by a recent theory of edge detection, and the existence of parallel channels in vision.
INTRODUCTION
It is well known that brightness is determined not only by object luminance, but also by other factors such as border contrast. Shapley’s (1986) recent paper gives many examples. Perhaps the clearest is the Craik-O’Brien-Cornsweet illusion (Craik, 1940, 1966; O’Brien, 1958; Cornsweet, 1970), illustrated in Fig. l(c). The centre panel appears darker than the surround although, except at a small region at the borders, it has the same luminance.
A common explanation for the illusion is that it results from some form of lateral inhibition, or high pass filtering by the visual system. Campbell ef al. (1978) account is the most explicit and q~nti~tive. They generated a ver- sion of the Craik-O’Brien illusion by removing the first harmonic from a squarewave grating. At low spatial frequencies (less than 1 c/deg), this grating was indi~~minable from a square- wave, at contrasts where the fundamental was not independently detectable. They concluded that the visual input is “analysed into its Fourier ~mponen~ and if these constitute a square sequence with no above threshold components missing it is seen as such” (p. 200). They also claimed that the explanation general&d to ac- count for the Craik-O’Brien illusion (p. 196).
Cornsweet (1970) proposed a similar expla- nation, except that his argument specifically applied to supra-threshold contrasts. He ob- tained what he believed to be the modulation transfer function of the human visual system,
using the contrast matching results of Davidson (1968). He argued that after filtering with the human MTF, the Craik-O’Brien profile and the real edge were similar. Interestingly, he does not address the issue of why neither waveform looks like the supposed filtered output, but both look square (cf. his explanation of Mach bands).
The explanations of both Campbell et al. and Cornsweet rely on high pass filtering by the visual system. If either version of the expla- nation is true, it should follow that the illusion occurs only at low spatial frequencies, where the visual system acts as an overall high-pass filter. Only when the fundamental (or other filtered harmonics) fall in the region of the low fre- quency cut, might sensitivity to these com- ponents be reduced so their absence escapes notice.
To test this idea, the strength of the Craik- O’Brien illusion was measured at various spatial frequencies. The stimuli for this experiment were smoothly filtered squarewaves, character- ized by the cutoff frequency of the waveform. The results show that the illusion is relatively independent of spatial frequency, but highly dependent on contrast.
METHODS
The stimuli for this experiment were square- wave gratings smoothly filtered in spatial fre- quency. Examples of the waveforms are shown in Fig. I. They were all generated from one cycle of squarewave grating, positioned to yield a
t903
1904 DAVID C. BURR
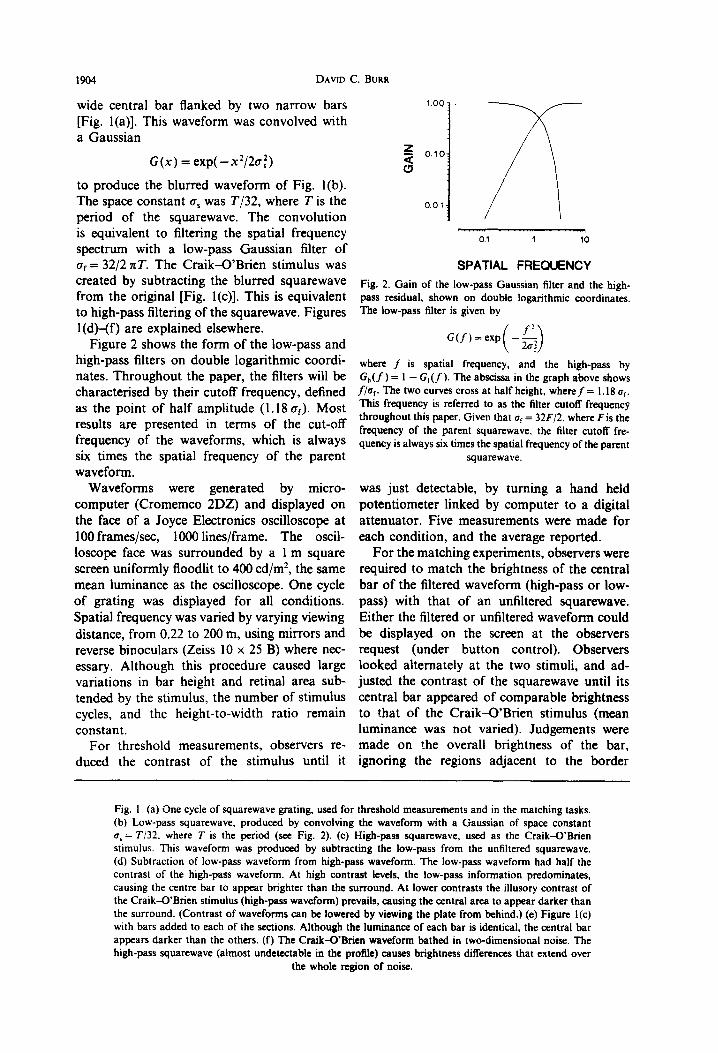
wide central bar flanked by two narrow bars [Fig. l(a)]. This waveform was convolved with a Gaussian
G(x) = exp( -x2/20f)
to produce the blurred waveform of Fig. l(b). The space constant cr, was T/32, where T is the period of the squarewave. The convolution is equivalent to filtering the spatial frequency spectrum with a low-pass Gaussian filter of err = 32/2 nT. The Craik-O’Brien stimulus was created by subtracting the blurred squarewave from the original [Fig. l(c)]. This is equivalent to high-pass filtering of the squarewave. Figures 1 (d)-(f) are explained elsewhere.
Figure 2 shows the form of the low-pass and high-pass filters on double logarithmic coordi- nates. Throughout the paper, the filters will be characterised by their cutoff frequency, defined as the point of half amplitude (1.18 or). Most results are presented in terms of the cut-off frequency of the waveforms, which is always six times the spatial frequency of the parent waveform.
Waveforms were generated by micro- computer (Cromemco 2DZ) and displayed on the face of a Joyce Electronics oscilloscope at 100 frames/set, 1000 lines/frame. The oscil- loscope face was surrounded by a 1 m square screen uniformly floodlit to 400 cd/m2, the same mean luminance as the oscilloscope. One cycle of grating was displayed for all conditions. Spatial frequency was varied by varying viewing distance, from 0.22 to 200 m, using mirrors and reverse binoculars (Zeiss 10 x 25 B) where nec- essary. Although this procedure caused large variations in bar height and retinal area sub- tended by the stimulus, the number of stimulus cycles, and the height-to-width ratio remain constant.
For threshold measurements, observers re- duced the contrast of the stimulus until it
1.00
z is 0.10
0.0 1 i :I /
0.1 1 lb
SPATIAL FREQUENCY
Fig. 2. Gain of the low-pass Gaussian filter and the high- pass residual, shown on double logarithmic coordinates. The low-pass filter is given by
where f is spatial frequency, and the high-pass by G,,(f) = 1 - G,(f). The abscissa in the graph above shows f/c+ The two curves cross at half height, when/ = 1. I8 er. This frequency is referred to as the filter cutoff frequency throughout this paper. Given that u1 = 32F/2, where F is the frequency of the parent squarewave, the filter cutoff fre- quency is always six times the spatial frequency of the parent
squarewave.
was just detectable, by turning a hand held potentiometer linked by computer to a digital attenuator. Five measurements were made for each condition, and the average reported.
For the matching experiments, observers were required to match the brightness of the central bar of the filtered waveform (high-pass or low- pass) with that of an unfiltered squarewave. Either the filtered or unfiltered waveform could be displayed on the screen at the observers request (under button control). Observers looked alternately at the two stimuli, and ad- justed the contrast of the squarewave until its central bar appeared of comparable brightness to that of the Craik-O’Brien stimulus (mean luminance was not varied). Judgements were made on the overall brightness of the bar, ignoring the regions adjacent to the border
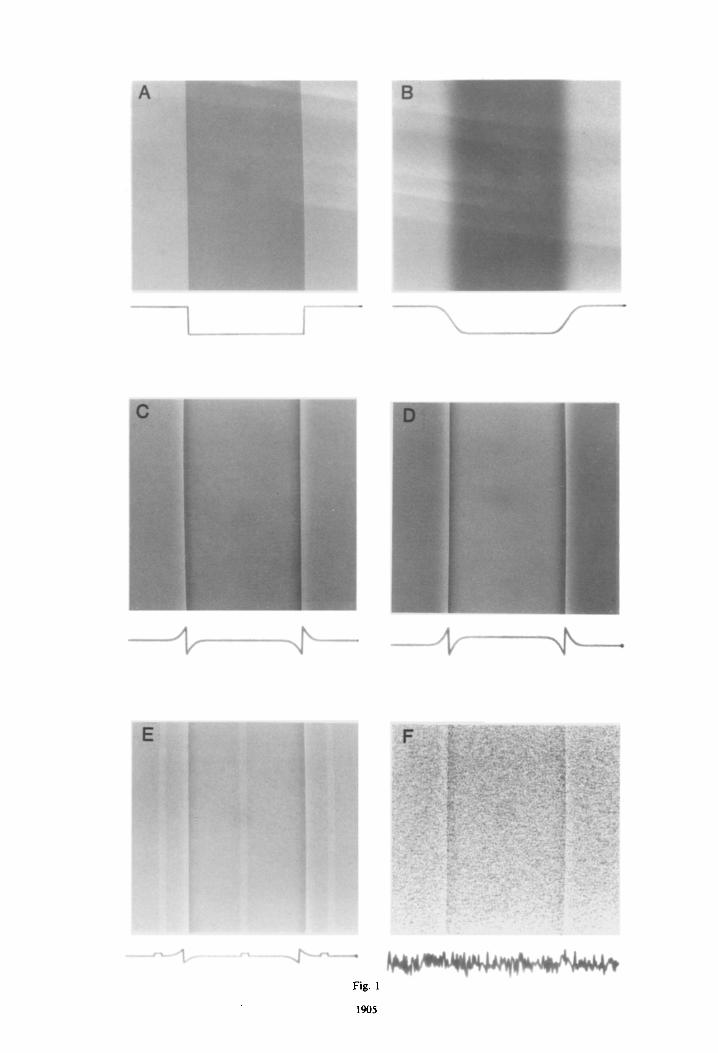
Fig. I. (a) One cycle of squarewave grating, used for threshold measurements and in the matching tasks. (b) Low-pass squarewave, produced by convolving the waveform with a Gaussian of space constant u, = T/32. where T is the period (see Fig. 2). (c) High-pass squarewave, used as the Craik-G’Brien stimulus. This waveform was produced by subtracting the low-pass from the unfiltered squarewave. (d) Subtraction of low-pass waveform from high-pass waveform. The low-pass waveform had half the contrast of the high-pass waveform. At high contrast levels, the low-pass information predominates, causing the centre bar to appear brighter than the surround. At lower contrasts the illusory contrast of the Craik-G’Brien stimulus (high-pass waveform) prevails, causing the central area to appear darker than the surround. (Contrast of waveforms can be lowered by viewing the plate from behind.) (e) Figure l(c) with bars added to each of the sections. Although the luminance of each bar is identical, the central bar appears darker than the others. (f) The Craik-CYBrien waveform bathed in two-dimensional noise. The high-pass squarewave (almost undetectable in the profile) causes brightness differences that extend over
the whole region of noise.
-._. _.. ,._., II. ._-._+A-_.
Fig. 1
1905
Craik-O’Brien illusion 1907
D. 0. o--o-o--c-c_~\ o-cJ-o_c
0’.
0.1 1.0 10 100 0.1 1.0 10 100
CUTOFF SPATIAL FREOUENCY wded
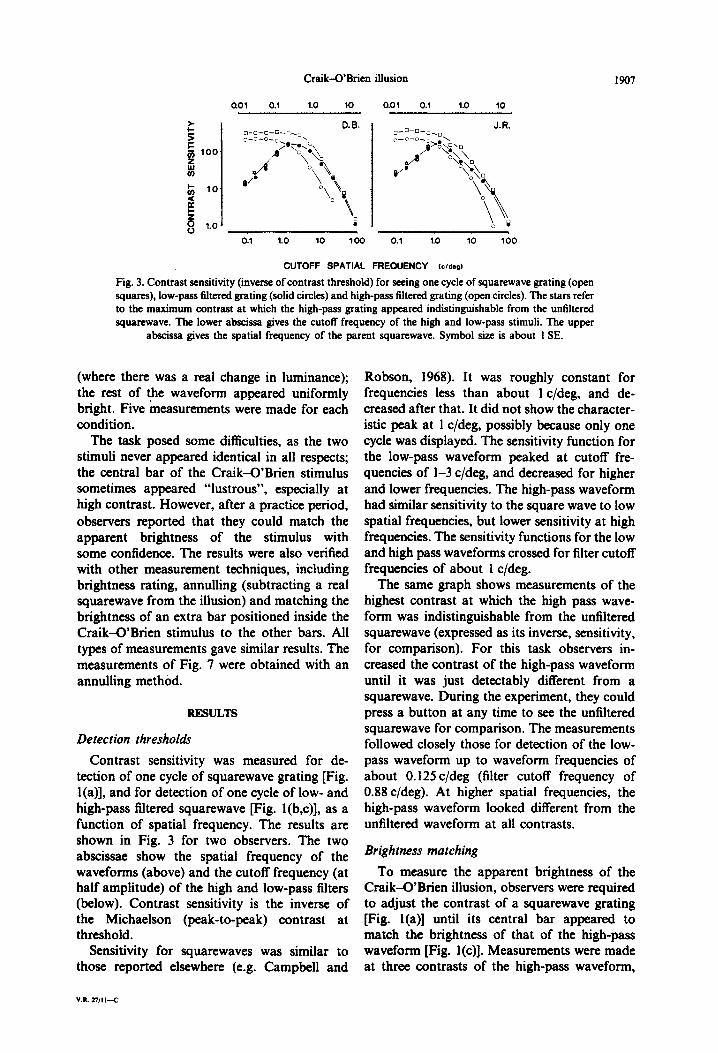
Fig. 3. Contrast sensitivity (inverse of contrast threshold) for seeing one cycle of squarewave grating (open squares), low-pass liked grating (solid circles) and high-pass filtered grating (open circles). The stars refer to the maximum contrast at which the high-pass grating appeared indistinguishable from the unfiltered squarewave. The lower abscissa gives the cutoff frequency of the high and low-pass stimuli. The upper
abscissa gives the spatial frequency of the parent squarewave. Symbol size is about I SE.
(where there was a real change in luminance); the rest of the waveform appeared uniformly bright. Five measurements were made for each condition.
The task posed some difficulties, as the two stimuli never appeared identical in all respects; the central bar of the Craik-O’Brien stimulus sometimes appeared “lustrous”, especially at high contrast. However, after a practice period, observers reported that they could match the apparent brightness of the stimulus with some confidence. The results were also verified with other measurement techniques, including brightness rating, annulling (subtracting a real squarewave from the illusion) and matching the brightness of an extra bar positioned inside the Craik-O’Brien stimulus to the other bars. All types of measurements gave similar results. The measurements of Fig. 7 were obtained with an annulling method.
RESULTS
Detection thresholds
Contrast sensitivity was measured for de- tection of one cycle of squarewave grating [Fig. l(a)], and for detection of one cycle of low- and high-pass filtered squarewave [Fig. l(b,c)], as a function of spatial frequency. The results are shown in Fig. 3 for two observers. The two abscissae show the spatial frequency of the waveforms (above) and the cutoff frequency (at half amplitude) of the high and low-pass filters (below). Contrast sensitivity is the inverse of the Michaelson (peak-to-peak) contrast at threshold.
Sensitivity for squarewaves was similar to those reported elsewhere (e.g. Campbell and
V.R. 27111-c
Robson, 1968). It was roughly constant for frequencies less than about 1 c/deg, and de- creased after that. It did not show the character- istic peak at 1 c/deg, possibly because only one cycle was displayed. The sensitivity function for the low-pass waveform peaked at cutoff fre- quencies of l-3 c/deg, and decreased for higher and lower frequencies. The high-pass waveform had similar sensitivity to the square wave to low spatial frequencies, but lower sensitivity at high frequencies. The sensitivity functions for the low and high pass waveforms crossed for filter cutoff frequencies of about 1 c/deg.
The same graph shows measurements of the highest contrast at which the high pass wave- form was indistinguishable from the unfiltered squarewave (expressed as its inverse, sensitivity, for comparison). For this task observers in- creased the contrast of the high-pass waveform until it was just detectably different from a squarewave. During the experiment, they could press a button at any time to see the unfiltered squarewave for comparison. The measurements followed closely those for detection of the low- pass waveform up to waveform frequencies of about 0.125 c/deg (filter cutoff frequency of 0.88 c/deg). At higher spatial frequencies, the high-pass waveform looked different from the unfiltered waveform at all contrasts.
Brightness matching
To measure the apparent brightness of the Craik-O’Brien illusion, observers were required to adjust the contrast of a squarewave grating [Fig. l(a)] until its central bar appeared to match the brightness of that of the high-pass waveform [Fig. l(c)]. Measurements were made at three contrasts of the high-pass waveform,
1908 DAVID C. BURR
! J. R.
,/-.-6.2 : q -,--eo-,_ l -0..
O-%0 o-oP_
c o-~.. ‘0 \
cl
0.1 1.0 10
CUTOFF SPATIAL FREQUENCY WdeO)
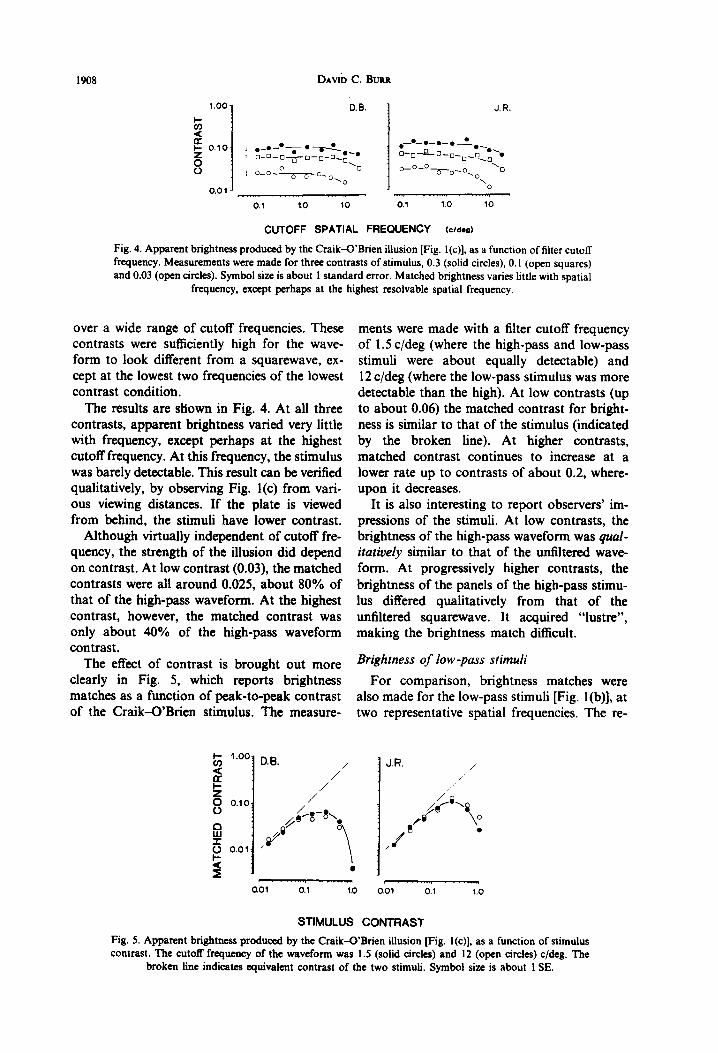
Fig. 4. Apparent brightness produced by the Craik-O’Brien illusion [Fig. l(c)), as a function of filter cutoff frequency. Measurements were made for three contrasts of stimulus, 0.3 (solid circles), 0.1 (open squares) and 0.03 (open circles). Symbol size is about 1 standard error. Matched brightness varies little with spatial
frequency, except perhaps at the highest resolvable spatial frequency.
over a wide range of cutoff frequencies. These contrasts were sufliciently high for the wave- form to look different from a squarewave, ex- cept at the lowest two frequencies of the lowest contrast condition.
The results are shown in Fig. 4. At all three contrasts, apparent brightness varied very little with frequency, except perhaps at the highest cutoff frequency. At this frequency, the stimulus was barely detectable. This result can be verified qualitatively, by observing Fig. l(c) from vari- ous viewing distances. If the plate is viewed from behind, the stimuli have lower contrast.
Although virtually independent of cutoff fre- quency, the strength of the illusion did depend on contrast. At low contrast (0.03), the matched contrasts were all around 0.025, about 80% of that of the high-pass waveform. At the highest contrast, however, the matched contrast was only about 40% of the high-pass waveform contrast.
The effect of contrast is brought out more clearly in Fig. 5, which reports brightness matches as a function of peak-to-peak contrast of the Craik-O’Brien stimulus. The measure-
ments were made with a filter cutoff frequency of 1.5 c/deg (where the high-pass and low-pass stimuli were about equally detectable) and 12 c/deg (where the low-pass stimulus was more detectable than the high). At low contrasts (up to about 0.06) the matched contrast for bright- ness is similar to that of the stimulus (indicated by the broken line). At higher contrasts, matched contrast continues to increase at a lower rate up to contrasts of about 0.2, where- upon it decreases.
It is also interesting to report observers’ im- pressions of the stimuli. At low contrasts, the brightness of the high-pass waveform was quuf- itutiuely similar to that of the unfiltered wave- form. At progressively higher contrasts, the brightness of the panels of the high-pass stimu- lus differed qualitatively from that of the unfiltered squarewave. It acquired “lust&‘, making the brightness match difficult.
Brightness of low-pass stimuli
For comparison, brightness matches were also made for the low-pass stimuli [Fig. l(b)], at two representative spatial frequencies. The re-
6 ‘.O” is
5 0 0.10 I
D.B.
/’ /
/ /
STIMULUS CONTRAST
Fig. 5. Apparent brightness produced by the Craik-O’Brien illusion [Fig. l(c)], as a function of stimulus contrast. The cutoff frequency of the waveform was 1.5 (solid circles) and 12 (open circles) c/deg. The
broken line indicates equivalent contrast of the two stimuli. Symbol size is about 1 SE.
Craik-O’Brien illusion 1909
J.R. / l
Ai’
,c’
001 0.1 1.0 0.01 0.1 1.0
STIMULUS CONTRAST
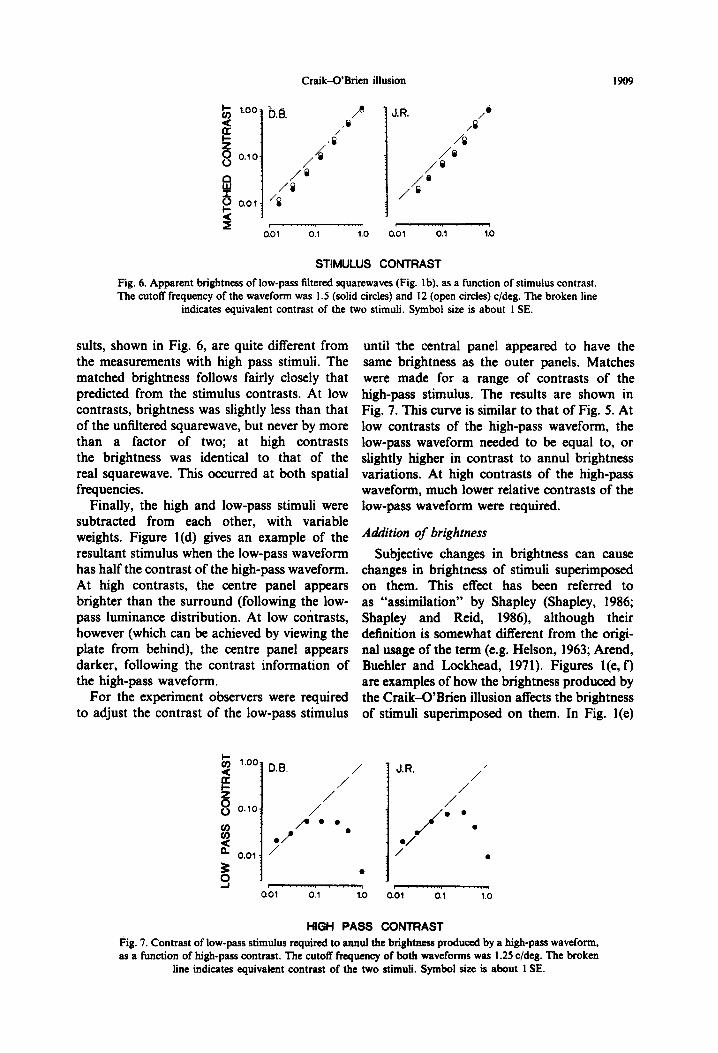
Fig. 6. Apparent brightness of low-pass filtered squarewaves (Fig. lb), as a function of stimulus contrast. The cutoff frequency of the waveform was 1.5 (solid circles) and 12 (open circles) c/deg. The broken line
indicates equivalent contrast of the two stimuli. Symbol size is about 1 SE.
sults, shown in Fig. 6, are quite different from the measurements with high pass stimuli. The matched brightness follows fairly closely that predicted from the stimulus contrasts. At low contrasts, brightness was slightly less than that of the unfiltered squarewave, but never by more than a factor of two; at high contrasts the brightness was identical to that of the real squarewave. This occurred at both spatial frequencies.
Finally, the high and low-pass stimuli were subtracted from each other, with variable weights. Figure l(d) gives an example of the resultant stimulus when the low-pass waveform has half the contrast of the high-pass waveform. At high contrasts, the centre panel appears brighter than the surround (following the low- pass luminance distribution. At low contrasts, however (which can be achieved by viewing the plate from behind), the centre panel appears darker, following the contrast information of the high-pass waveform.
For the experiment observers were required to adjust the contrast of the low-pass stimulus
until ‘the central panel appeared to have the same brightness as the outer panels. Matches were made for a range of contrasts of the high-pass stimulus. The results are shown in Fig. 7. This curve is similar to that of Fig. 5. At low contrasts of the high-pass waveform, the low-pass waveform needed to be equal to, or slightly higher in contrast to annul brightness variations. At high contrasts of the high-pass waveform, much lower relative contrasts of the low-pass waveform were required.
AaWtion of brightness
Subjective changes in brightness can cause changes in brightness of stimuli superimposed on them. This effect has been referred to as “assimilation” by Shapley (Shapley, 1986; Shapley and Reid, 1986), although their definition is somewhat different from the origi- nal usage of the term (e.g. Helson, 1963; Arend, Buehler and Lockhead, 1971). Figures l(e, f) are examples of how the brightness produced by the Craik-O’Brien illusion affects the brightness of stimuli superimposed on them. In Fig. l(e)
6 ‘DO D.B.
d / / 1 J.R.
/’
5
8 /
0.10: /
/’ .@
3 PO0
: .f . .
d 0.01: '
./ ./ .
4
. :
..-I t . . . . . . . . . ..I* a01 0.1 1.0 0.01 0.1 1.0
HIGH PASS CONTRAST Fig. 7. Contrast of low-pass stimulus required to annul the brightness produced by a high-pass waveform, as a function of high-pass contrast. The cutoff frequency of both waveforms was 1.25 c/deg. The broken
line indicates equivalent contrast of the two stimuli. Symbol size is about 1 SE.
1910 Davm C. BURR
bars all have the same luminance, yet those on A further point is that a full explanation must the apparently darker centre appear slightly account for the fact that both squarewaves and darker than those towards the edges. A more high-pass filtered squarewaves look squarish, extreme example is Fig. l(f), where two- rather than reflecting the high-pass filter proper- dimensional noise has been added. The noise ties of visual mechanisms. Campbell et al. recog- has equal mean luminance and power across the nized this, and suggested that the visual system whole picture, but the central noise appears searches for a squarewave sequence of Fourier darker. The Craik-G’Brien stimuli, although at harmonics, and signals a squarewave if there quite low contrast (almost undetectable in the was no evidence to the contrary: effectively a profile) affect the brightness of the high contrast “default to squarewave” rule. This argument noise bounded by them. encounters difficulties with Fig. l(f), where
noise has been added to the stimulus. The DISCUSSION Fourier components of the noise, at all fre-
quencies, would add to those of the Craik- The “missing fundamental” O’Brien stimulus, severely disguising the square-
The first stage of this study replicated like sequence. No simple default law could Campbell et aZ.‘s (1978) observations on the account for the fact that the average brightness “missing fundamental”, using smoothly filtered of noise and other stimuli can be influenced by waveforms. High-pass filtered squarewaves were the Craika’Brien illusion. indistinguishable from unfiltered squarewaves at low spatial frequencies, provided that Auditory analogy
their contrast was low enough. The contrast Campbell et al. (1978) claimed that the miss- thresholds at which high-pass squarewaves ing fundamental illusion in vision was anal- appeared identical to unfiltered squarewaves ogous to the missing fundamental or “residue” followed closely the contrast thresholds for de- phenomenon of hearing. Complex tones from tecting the low-pass squarewaves. That is to say, which the fundamental (and other) harmonics if the components that distinguish the two have been removed appear to have the same waveforms were not independently detectable, pitch as the unfiltered tones (Fletcher, 1929; then the two waveforms were indistinguishable. Schouten, 1940; de Boer, 1976). A familiar
However, the apparent brightness at supra- example is that human voices appear to have threshold contrasts could not be predicted from natural pitch when heard on the telephone, the threshold measurements. Apparent bright- although all frequencies below 300 Hz are heav- ness was virtually constant at all spatial fre- ily attenuated. However, Campbell et al. (1978) quencies. If brightness depended on selective failed to point out a major difference between attenuation by the visual system of low spatial the illusions in the two modalities. When the frequencies, as Campbell et al. (1978) suggest, fundamental is removed from a complex audi- then the illusory brightness should occur only at tory signal, observers can detect that it has been filter frequencies less than 1 c/deg, in the region removed (unless the intensity is very low). The of the low frequency cut. Our measurements pitch remains the same, but the sound loses show that strength of the illusion was un- some of its “body”: the timbre becomes some- changed at frequencies as high as 10 c/deg, and what sharper (Schouten, 1940). With Campbell still present at 20 c/deg. Clearly the contrast et al.‘s illusion, the missing fundamental ap- sensitivity function does not explain the supra- peared identical to the unfiltered squarewave. threshold appearance of the illusion. Furthermore, the components removed to
Nor does it seem likely that the illusion could create the illusion were not independently de- be explained by a supposed “modulation trans- tectable, which is not the case in audition. fer function” of vision at suprathreshold con- A stronger analogy with the hearing residual trasts, as suggested by Comsweet (1970). The is the Craik-O’Brien illusion. The waveform is function would have to be peaked at 20 c/deg or detectability different from the squarewave but higher, with a steep low frequency cut. This is brightness variations consistent with the re- not supported by any experimental evidence. sidual low frequency harmonics are seen. It is of The contrast matching data of Georgeson and course, a loose analogy. Local variations in Sullivan (1975) suggest that the overall human brightness occur at a certain spatial frequency; MTF becomes progressively flatter as contrast local variations in loudness are not themselves increases above threshold. audible-they are heard as having a pitch. Ex-
Craik-O’Brien illusion 1911
ploring the explanations for the,auditory re- sidual (e.g. Wightmann, 1973; Goldstein, 1973) is unlikely to yield clues for vision.
In order for the visual system to function efficiently over a wide luminance range, the gain of photoreceptors, bipolar cells and ganglion cells varies automatically with luminance. The processes occur locally over very small regions of retina (Burr ez al., 1984; Enroth-Cugell and Shapley, 1973), so different regions of retina can have greatly different gain settings. The visual system must therefore infer brightness from contrast information, which ganglion cells transmit to the higher centres. Information about the absolute luminance level is lost. The compensation for this is that brightness tends to follow the reflectance of object surfaces, irre- spective of the prevailing luminance level (Mach, 1906; Land and McCann, 1971; Shapley and Enroth-Cugell, 1984).
Shapley and Enroth-Cugell (1984) suggested that brightness is determined mainly by contrast near a border (see also Whittle and Challands, 1969; Arend and Buehler, 1971). Our results support this assertion only partially. Only at low contrasts (less than about 6%) does border contrast alone create brightness comparable with that of a real edge. At the highest contrasts, virtually no brightness change is produced by the Craik-O’Brien profile. Moreover, the low- pass filtered waveform, which has soft borders, induced a brightness change comparable to that of an unfiltered squarewave. When the high- pass waveform was pitted against the low-pass, the low-pass prevailed at the higher contrasts. Only at the very lowest contrast (1.5%) did the high-pass waveform induce more brightness than the low-pass. Clearly, while border con- trast is important, the contrast of regions re- mote from the border, and the absolute lumi- nance levels also contribute to brightness perception.
But what precisely is “border contrast”? We have recently suggested that the defining charac- teristic of an edge is zero phase alignment of all the Fourier components of a waveform (Morrone et al., 1986; Ross et al., 1987; Morrone and Burr, 1987; Burr and Morrone, 1987b; Morrone and Owens, 1987). It is often, but not always associated with a sharp step. We have further shown how the points of phase alignment or “phase coherence” can be detected efficiently from peaks in the “local energy”
transform (the sum of the squared waveform with its squared Hilbeit transform). Square- waves have two points of phase coherence per period, at 0 and 180” (corresponding to the positive and negatively going edges). High-pass and low-pass filtering of the waveform does not break the coherence, but merely reduces the number of coherent Fourier components. Both high and low-pass squarewaves have some har- monics coherent at zero and 180” phase at the borders, which cause strong peaks in the local energy profile: these should provide a signal for an edge. If edge information is also a signal for a change in brightness, both the high and low-pass waveforms will produce variations in brightness.
The phase dependent edge detection model can tolerate high levels of two-dimensional noise [Fig. l(d)}. The model seeks peaks in energy, which are given by congruence of phase. Although the noise of Fig. l(d) has high ampli- tude, the random phase minimizes con8ruence, and hence local energy peaks (see Morrone and Owens, 1987).
Our feature detection model (Burr and Morrone, 1987b; Morrone and Burr, 1987) sug- gests that the visual system regards peaks in local energy as rich sources of information, particularly at low and moderate contrast level. Peaks are caused by phase coherence, which signal lines, Mach bands etc. Edges could also provide an economical means of coding bright- ness: a region bounded by edges is assumed to have equal brightness, given by the sign and magnitude of the edges. Vision’s goal is to extract the essential information about an image, not to produce another image. An edge map (detailing the position, sign and strength of all edges) would be st&cient to represent the brightness of an entire image, without further elaboration.
To explain why edge-induced brightness effects are weakened at high peak-to-peak con- trast, some mechanism other than brightness- from-edges needs to be invoked. One possibility is provided by Shapley’s notion of two parallel pathways in vision, with different contrast sensi- tivity and gain. Kaplan and Shapley (1982) have shown that cells in the magnocellular layer of the lateral geniculate body of monkeys are about 10 times more sensitive than cells in the parvocelluiar layer (see Shapley and Lennie, 1985, for review). Cells in the magnocellular layer increase their response linearly with in- creasing contrast up to a (fairly low) saturation
1912 DAVID C. BURR
level. Parvocellular cells are sharply tuned for wavelength, and do not saturate at high con- trast. Shapley (1986) suggests that magnocelluar cells relay contrast information to the cortex, and those in the parvocellular relay colour information. The existence of two cell popu- lations is also supported by evoked potential studies on humans (Campbell and Maffei, 1970; Nakayama and Mackeben, 1982; Conte, Zemon et al., 1983; Burr and Morrone, 1987a). The contrast response curve to stimulation by counterphased gratings has at least two limbs, one at low contrasts and one at high, which could reflect the two pathways which Shapley refers to. The crossover point of the two limbs occurs at about 6% contrast.
Brightness from the “contrast channel” should be linearly related to contrast only at low contrasts, because of its low saturation point. Figures 5 and 7 show that a high-pass waveform is matched in apparent brightness by a square waveform of the same border contrasts up to contrasts of about 6%, the level where Shapley (1986) suggests that the contrast channel satur- ates. When the border contrast of a high-pass waveform is above 6%, the square that matches it in brightness is of lower contrast, substantially so at very high contrasts. Luminance infor- mation may be conveyed by a separate system not so susceptible to saturation, such as the “luminance units” described by Barlow and Levick (1969). These units increase their dis- charge monotonically with luminance over a range of some five log-units. They could in principle provide information that contributes towards brightness perception. A square that matches the high-pass waveform in border con- trast now fails to match it in brightness, because of additional input from a system less sus- ceptible to saturation, and having different gain. This second system may also explain why low- pass waveforms and squarewaves match in brightness at high contrasts. To understand better the role played by luminance, border contrast and contrast of low frequency com- ponents, a more detailed study of brightness is planned, using band-pass filtered stimuli of various width and ccntre frequency.
That two mechanisms are at work in deter- mining the brightness of the high-pass wave- form is indicated by the fact that they appear lustrous, particularly at high contrasts. Lustre is typically seen when the visual system has competing information about the same region in space, such as with binocular rivalry
(Helmholtz, 1890/1962) and motion rivalry (Burr et al., 1986).
In conclusion, the experiments reported in this paper show that the well known Craik- O’Brien illusion is not a simple by-product of low-pass attenuation of the human visual system. It occurs over a wide range of spatial frequencies, not only in the region of the low frequency cut. However, the illusion is predicted by our recent model of feature detection. The Craik-O’Brien waveform is merely a high-pass version of an edge, with all phase relationships preserved. According to our model (based on phase relationships) the waveform will be perceived by the visual system as an edge. We further suggest that image brightness is given largely by the position, sign and magnitude of perceived edges, at least at low image contrasts.
Acknowledgements--I thank Professor John Ross and Concetta Morrone for acting as observers, and for helpful discussions.
REFERENCES
Arend L. E., Buehler J. N. and Lockhead G. P. (1971) Difference information in brightness perception. Percept. Psychophys. 9, 367-370.
Barlow H. B. and Levick W. R. (1969) Changes in main- tained discharge with adaptation level in the cat retina. J. Physiol. Land. 202, 699-718.
Burr D. C., Ross J. and Morrone M. C. (1985) Local regulation of luminance gain. Vision Res. U, 717-728.
Burr D. C., Ross J. and Morrone M. C. (1986) A spatial illusion from motion rivalry. Perception 15, 59-66.
Burr D. C. and Morrone M. C. (1987a) Inhibitory inter- actions in the human visual system revealed in pattern visual evoked potentials. J. Physiol. Land. 389, I-21.
Burr D. C. and Morrone M. C. (1987b) Feature detection in biological and artificial visual systems. In Vision: Coding and Eficiency (Edited by C. Blakemore). Oxford Univ. Press. In press.
Campbell F. W., Howell E. R. and Johnstone J. R. (1978) A comparison of threshold and suprathreshold appear- ance of gratings with components in the low and high spatial frequency range. J. Physiof., Land. 284, 193-201.
Campbell F. W. and Maffei L. (1970) Electrophysiological evidence for the existence of orientation and size detectors in the human visual system. J. Physiof., Land. 207, 635-652.
Campbell F. W. and Robson J. G. (1968) On the application of Fourier analysis to the visibility of gratings. J. Physiol. Lond. 197, 551-556.
Conte M., Zemon V., Camisa J. and Milkman N. (1983) Comparing psychophysical and VEP contrast sensitivity. Invest. Ophrhal. visual Sci. 24, 47.
Comsweet T. N. (1970) Visual Perception. Academic Press, New York.
Craik K. J. W. (1940) Visual adaptation. Ph.D. thesis Univ. of Cambridge.
Craik K. J. W. (1966) The Name o/Psycho/ogy (Edited by Sherwood S.). Cambridge Univ. Press.
Craik-G’Brien illusion 1913
Davidson M. L. (1968) Perturbation approach to spatial Morrone M. C. and Burr Et‘ C& (1987) Feature detection in
brightness interaction in human vision. J. opr. Sot. Am. human vision: a phase dependent energy model. Proc. R.
58,1300-1309. Sot. Submitted.
De Boer E. (197’7) On the “residue” and auditory pitch perception. In balk of Sensory Physiofogy (Edited by Keidel W. D. and Neff W. D.), Vol. V/3. Springer, Berlin.
Enroth-Cugell C. and Shapley R. M. (1973) Adaptation and dynamics of cat retinal ganglion cells. J. Physiol. Land. 233, 271-309.
Morrone M. C. and Gwens R. (1987) Edge detection by Iocal energy. Pattern Recogn Mt. In prCsS.
Nakayama K. and Mackeben M. (1982) Steady state visual evoked potentials in the alert primate. Vision Res. 22, 1261-1271.
Fletcher H. (1924) Speech and heurtig. McMillan, New York.
Georgeson M. A. and Sullivan G. D. (1975) Contrast constancy: debhsrring in human vision by spatial fre- quency channels. .I. Physiol., Lund. 252, 627-656.
Goldstein J. L. (1973) An optimum processor theory for the central formation of the pitch of complex tones. A. (ICCOUSI. Sot. Am. 54, 14961516.
Helmhoftx H. Von (1909-1%2) Physjofogic~ Up&s, Vol. 3, Dover, New York (1962) English translation by J. P. C. Southwell for the Optical Society of America (1924) from the 3rd German edition of Handbuch der physiologischen Oprik, Voss, Hamberg (1909).
Helson H. (1963) Studies of anomalous contrast and assim- ilation. J. opt. Sot. Am. 53, 179-184.
Kaplan E. and Shapley R. M. (1982) X and Y cells in the lateral geniculate nucleus of macaque monkeys. J. Physiol., l&d. 330, 125-143.
Land E. H. and McCann J. J. (1971) The retinex theory of vision. J. opt. Sot. Am. 61, I-11.
Mach E. (1906) Uber den Einfluss Raumlich und xeitlich variierender Lichtreixe auf die Gesichtswahmehmung. S.-B. Akad. W&s. Wien, marh.-nag. Ki. 115, 633-648.
Morrone M. C., Ross J., Burr D. C. and Owens R. (1986) Mach bands depend on spatial phase. Nature, Land. 324, 250-253.
O’Brien V. (1958) Contour perception, illusion and reality. J. opt. Sot. Am. 48, 112-119.
Ross J., Burr D. C. and Morrone M. C. (1987) Conditions for the appearance of Mach bands. Vision Res. To be published.
Schouten J. F. (1940) The residue, a new component in subjective sound analysis. Proc. f&m. Acud. Wefensch., Neth. 43, 356-365.
Shapley R. (1986) The importance of contrast for the activity of single neurons, the VEP and perception. Firion &es. 26, 45-61.
Shapley R. and Enroth-Cugell C. (1984) Visual adaptation and retinal gain controls. In Progress in Retinal Reseurch (Edited by Osborne N. N. and Chader G. J. ), pp. 263-346 Pergamon Reas, Oxford.
Shapley R. M. and Lennie P. (1985) Spatiat frequency analysis in the visual system. Ann. Rev. Neurosci. 8, 547-583.
Shapley R. and Reid R. C. (1985) Contrast and assimilation in the perception of brightness Proc. natn. Acad. Sci. U.S.A. 8.2, 5983-5986.
Whittle P. and Chaliands P. D. C. (1969) The effect of background luminance of the brightness of flashes. Vision Res. 9, 1095-l 110.
Wi~~an F. L. (1973) The pattern ~ansfo~tion theory of pitch. J. accow. Sot. Am. 54, 407-916.