Embed Size (px)
Citation preview
MARINE ECOLOGY PROGRESS SERIESMar Ecol Prog Ser
Vol. 353: 177–190, 2008doi: 10.3354/meps07129
Published January 17
INTRODUCTION
Copepods of the genus Calanus are key players inhigh latitude marine ecosystems. They dominate themesozooplankton communities, are significant grazerson the primary production (Nielsen & Hansen 1995,Levinsen & Nielsen 2002), and constitute an importantprey item for numerous fish, bird, and whale popula-tions (Heide-Jørgensen & Acquarone 2002, Karnovskyet al. 2003). At the same time, Calanus have a role inthe supply of high quality food to the benthic commu-nities by acceleration of the vertical flux trough pro-duction of large fast-sinking fecal pellets (Pedersen et
al. 2006). In Greenlandic waters, 3 species of Calanusdominate the mesozooplankton community duringspring and early summer (Madsen et al. 2001, Mølleret al. 2005, Nielsen et al. 2007). C. hyperboreus andC. glacialis are true arctic species inhabiting polarwaters, while C. finmarchicus is a temperate speciesassociated with Atlantic waters (Conover 1988, Hircheet al. 1991). In Disko Bay, western Greenland, thenorthern border for C. finmarchicus and the southernfor C. glacialis, the 2 species meet and co-exist (Mad-sen et al. 2001). The life-history strategies of Calanusare adapted to the arctic, involving hibernation indeep waters during winter followed by an ascent to
© Inter-Research 2008 · www.int-res.com*Corresponding author. Email: [email protected]
Importance of feeding for egg production inCalanus finmarchicus and C. glacialis
during the Arctic spring
Signe Juul Madsen1, Torkel Gissel Nielsen1,*, Outi Maria Tervo2, Johan Söderkvist1
1National Environmental Research Institute, Department of Marine Ecology, Aarhus University Frederiksborgvej 399, PO Box 358, 4000 Roskilde, Denmark
2Arktisk Station, PO Box 504, 3953 Qeqertarsuaq, Greenland
ABSTRACT: The vertical distribution and in situ egg production of Calanus finmarchicus and C.glacialis were studied in Disko Bay, western Greenland, from winter throughout the spring bloom.The 2 species entered the surface water simultaneously, but their spawning patterns differed signif-icantly. Maximum egg production for C. glacialis of 48 ± 8 eggs female–1 d–1 was measured on May1, 2005 in association with the culmination of the bloom, while the highest egg production rate of C.finmarchicus of 44 ± 7 eggs female–1 d–1 was measured on May 25 after termination of the bloom. Dur-ing 3 phases of the spring bloom, the impact of starvation and saturating food conditions on the eggproduction rates of the 2 Calanus species was investigated in the laboratory. Experiments withstarved and ad libitum fed females showed a significant difference in the egg production ratebetween the 2 species, depending on sampling time, i.e. gonad maturity and feeding history. Theresults showed varying use of saturating food during the 3 phases of the bloom. For C. finmarchicus,no effect of food was observed during the first experiment in late April, whereas females collected inearly May, during the peak of the spring bloom, responded strongly to changes in food concentration,with egg production which was 3 times higher than that of the starved controls. In contrast, C.glacialis responded strongly to food concentration in both late April and early May. The presentinvestigations illustrate that Calanus females from the Disko Bay area continue to produce eggs with-out food more than twice as long as those reported from other northern populations. This observationcould indicate an adaptation to the Disko Bay environment, which has unpredictable ice conditionsand consequently large variations in the initiation of the spring bloom.
KEY WORDS: Calanus glacialis · C. finmarchicus · Egg production · Starvation · Spring bloom
Resale or republication not permitted without written consent of the publisher
OPENPEN ACCESSCCESS
Mar Ecol Prog Ser 353: 177–190, 2008
the productive layers in early spring, where spawn-ing, feeding, and refueling of lipid stores take place(Lee et al. 2006). In late summer, first C. hyperboreus,then C. glacialis and later C. finmarchicus descend todeep waters. C. glacialis initiates spawning prior tothe spring bloom, with gonad maturation and eggproduction (EP) fueled by internal lipid reserves(Smith 1990). EP reaches a maximum during thespring bloom, when a correlation between EP andchlorophyll a (chl a) concentration can be found(Nielsen & Hansen 1995, Hirche & Kosobokova 2003).Being a temperate species, C. finmarchicus hassmaller lipid reserves and depends on food in order tofinish gonad maturation and initiate spawning. EP istherefore highly dependent on the phytoplanktonconcentration, and spawning is initiated after feedingon the phytoplankton spring bloom has begun (Mad-sen et al. 2001, Niehoff et al. 2002). As C. hyperboreusspawns during winter (Hirche & Niehoff 1996, Mad-sen et al. 2001), it was not considered in the presentstudy.
Disko Bay is located at the southern border of thearctic sea ice and is therefore likely to be affected byclimatic changes. The break-up of sea ice in DiskoBay normally takes place between April and May,but oscillates considerably from year to year (Heide-Jørgensen et al. 2007), thereby influencing the timingof the phytoplankton spring bloom (Nielsen & Hansen1995, Madsen et al. 2001, Hansen et al. 2003, Thor etal. 2005). As the mechanisms triggering the termina-tion of Calanus winter hibernation are not fullyunderstood (Fiksen 2000, Hansen et al. 2003, Thoris-son 2006), it is not yet known to what degree cope-pods are capable of timing their ascent from deepwaters with the occurrence of the spring bloom. Mod-eling scenarios suggest that a possible mismatchbetween ascent and ice break-up could result incopepods experiencing periods of starvation or badfood quality. If the ice remains longer than normal,copepods may ascend at a time when no food isavailable, and if the ice breaks up early, then thephytoplankton bloom has already sedimented, mak-ing protozooplankton and ciliates the main food items(Hansen et al. 2003). Starvation experiments withC. finmarchicus (Hirche 1990, Hirche et al. 1997,Niehoff 2000, 2004) and with C. glacialis (Hirche &Bohrer 1987, Hirche 1989, Hirche & Kwasniewski1997, Kosobokova & Hirche 2001, Hirche & Kosobo-kova 2003) have shown a pronounced decrease inreproductive activity following even short periods ofstarvation. Knowledge about the sensitivity of repro-duction in relation to starvation is therefore crucialfor understanding future dynamics of the copepodcommunity in order to quantify their role in themarine food web in a changing environment.
The aim of the present study was to describe the springmigration of the Calanus populations to the surface layerin relation to spring bloom formation in Disko Bay, west-ern Greenland, and to investigate how the surface foodconditions on arrival influence EP rate of the 2 co-occur-ring copepod species C. finmarchicus and C. glacialisduring 3 phases of the spring bloom development.
MATERIALS AND METHODS
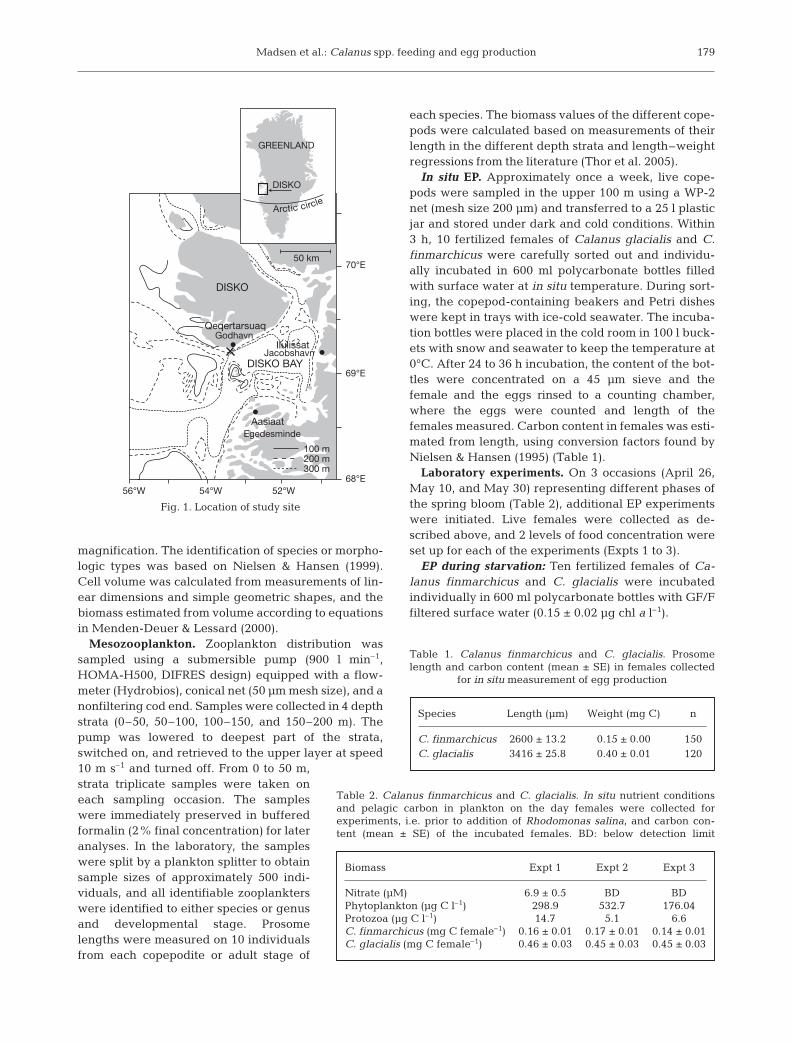
Study site. Sampling was conducted from RV ‘Porsild’(Arctic Station, University of Copenhagen) in the DiskoBay area close to Qeqertarsuaq in western Greenlandfrom February 22 to May 30, 2005. The sampling wascarried out at the permanent station located 1 nauticalmile off Qeqertarsuaq (69° 15’ N, 53° 33’ W) (Fig. 1),previously used for studying the pelagic community(Nielsen & Hansen 1995, Hansen et al. 1999, Madsen etal. 2001, Levinsen & Nielsen 2002, Thor et al. 2005, Ped-ersen et al. 2006). From February 22 to May 30, weeklycruises were made to the permanent station, whereCTD profiles, chl a, nutrient, and stratified copepodsamples were taken. From late April to the end of May,additional measurements of Calanus finmarchicus andC. glacialis EP were included in the program.
Hydrography and nutrients. The vertical distribu-tion of salinity and temperature was measured down to80 m using a Seabird SBE25-01 CTD. Water samplesfrom 1, 15, 30, 50, and 100 m were taken using a Niskin10 l water bottle, and stored in dark 10 l plastic con-tainers. Subsamples of 10 ml for determination ofnutrient concentration were frozen immediately aftersampling. The nutrient concentrations were later ana-lyzed at the National Environmental Research Institute(NERI) on an automatic nutrient analyzer (DanskHavteknik) following Grasshoff (1976). All nutrientsamples were analyzed in duplicate with a precision of0.06, 0.1, 0.3, and 0.2 µM for phosphorus, nitrate,ammonia, and silicate, respectively.
Phytoplankton. Three samples of 500 ml were fil-tered onto GF/F filters. Chl a was extracted overnightin 5 ml 96% ethanol (Jespersen & Christoffersen 1987)and measured before and after acid addition on aTurner Designs Model 700 Fluorometer calibratedagainst a pure chl a standard. Phytoplankton biomasswas calculated from chl a, applying a C/chl a conver-sion factor of 42.8 (Pedersen et al. 2006).
Ciliates and heterotrophic dinoflagellates. Theabundance and species composition of ciliates and het-erotrophic dinoflagellates were quantified in 100 mlseawater from 1 and 15 m depth, preserved in Lugol’ssolution (2% final concentration). The samples wereallowed to settle for 24 h in 50 ml chambers, prior toquantification under an inverted microscope at 200×
178
Madsen et al.: Calanus spp. feeding and egg production
magnification. The identification of species or morpho-logic types was based on Nielsen & Hansen (1999).Cell volume was calculated from measurements of lin-ear dimensions and simple geometric shapes, and thebiomass estimated from volume according to equationsin Menden-Deuer & Lessard (2000).
Mesozooplankton. Zooplankton distribution wassampled using a submersible pump (900 l min–1,HOMA-H500, DIFRES design) equipped with a flow-meter (Hydrobios), conical net (50 µm mesh size), and anonfiltering cod end. Samples were collected in 4 depthstrata (0–50, 50–100, 100–150, and 150–200 m). Thepump was lowered to deepest part of the strata,switched on, and retrieved to the upper layer at speed10 m s–1 and turned off. From 0 to 50 m,strata triplicate samples were taken oneach sampling occasion. The sampleswere immediately preserved in bufferedformalin (2% final concentration) for lateranalyses. In the laboratory, the sampleswere split by a plankton splitter to obtainsample sizes of approximately 500 indi-viduals, and all identifiable zooplankterswere identified to either species or genusand developmental stage. Prosomelengths were measured on 10 individualsfrom each copepodite or adult stage of
each species. The biomass values of the different cope-pods were calculated based on measurements of theirlength in the different depth strata and length–weightregressions from the literature (Thor et al. 2005).
In situ EP. Approximately once a week, live cope-pods were sampled in the upper 100 m using a WP-2net (mesh size 200 µm) and transferred to a 25 l plasticjar and stored under dark and cold conditions. Within3 h, 10 fertilized females of Calanus glacialis and C.finmarchicus were carefully sorted out and individu-ally incubated in 600 ml polycarbonate bottles filledwith surface water at in situ temperature. During sort-ing, the copepod-containing beakers and Petri disheswere kept in trays with ice-cold seawater. The incuba-tion bottles were placed in the cold room in 100 l buck-ets with snow and seawater to keep the temperature at0°C. After 24 to 36 h incubation, the content of the bot-tles were concentrated on a 45 µm sieve and thefemale and the eggs rinsed to a counting chamber,where the eggs were counted and length of thefemales measured. Carbon content in females was esti-mated from length, using conversion factors found byNielsen & Hansen (1995) (Table 1).
Laboratory experiments. On 3 occasions (April 26,May 10, and May 30) representing different phases ofthe spring bloom (Table 2), additional EP experimentswere initiated. Live females were collected as de-scribed above, and 2 levels of food concentration wereset up for each of the experiments (Expts 1 to 3).
EP during starvation: Ten fertilized females of Ca-lanus finmarchicus and C. glacialis were incubatedindividually in 600 ml polycarbonate bottles with GF/Ffiltered surface water (0.15 ± 0.02 µg chl a l–1).
179
50 km
100 m200 m300 m
56°W 54°W 52°W
70°E
69°E
68°E
DISKO
AasiaatEgedesminde
QeqertarsuaqGodhavn
DISKO BAY
IlulissatJacobshavn
Arctic circle
GREENLAND
DISKO
Fig. 1. Location of study site
Species Length (µm) Weight (mg C) n
C. finmarchicus 2600 ± 13.2 0.15 ± 0.00 150C. glacialis 3416 ± 25.8 0.40 ± 0.01 120
Table 1. Calanus finmarchicus and C. glacialis. Prosomelength and carbon content (mean ± SE) in females collected
for in situ measurement of egg production
Biomass Expt 1 Expt 2 Expt 3
Nitrate (µM) 6.9 ± 0.5 BD BDPhytoplankton (µg C l–1) 298.9 532.7 176.04Protozoa (µg C l–1) 14.7 5.1 6.6C. finmarchicus (mg C female–1) 0.16 ± 0.01 0.17 ± 0.01 0.14 ± 0.01C. glacialis (mg C female–1) 0.46 ± 0.03 0.45 ± 0.03 0.45 ± 0.03
Table 2. Calanus finmarchicus and C. glacialis. In situ nutrient conditionsand pelagic carbon in plankton on the day females were collected forexperiments, i.e. prior to addition of Rhodomonas salina, and carbon con-tent (mean ± SE) of the incubated females. BD: below detection limit
Mar Ecol Prog Ser 353: 177–190, 2008
EP at saturated food concentration: Ten females ofeach species were incubated individually in 600 mlpolycarbonate bottles with 45 µm screened surfacewater (9, 12, and 4 µg chl a l–1 for the 3 experiments,respectively) spiked with a phytoplankton culture(Rhodomonas salina) until an average chl a concentra-tion of 56.2 ± 6.6 µg chl a l–1 was achieved.
On a daily basis, the contents of the bottles weregently concentrated on a 45 µm submerged sieve andrinsed to a counting chamber. The females were imme-diately transferred using a large mouth pipette to newbottles with either fresh GF/F filtered water or dilutedRhodomona salina culture and brought back to thecold room. The spawned eggs were then counted. Inorder to keep the temperature subzero, all handling ofthe copepods was done in containers submerged inice-cold seawater. After 10 to 13 d, the experimentswere terminated and the length of the females mea-sured. Results of all experiments are presented asaverage values ± SE, unless otherwise stated.
RESULTS
Hydrography and phytoplankton
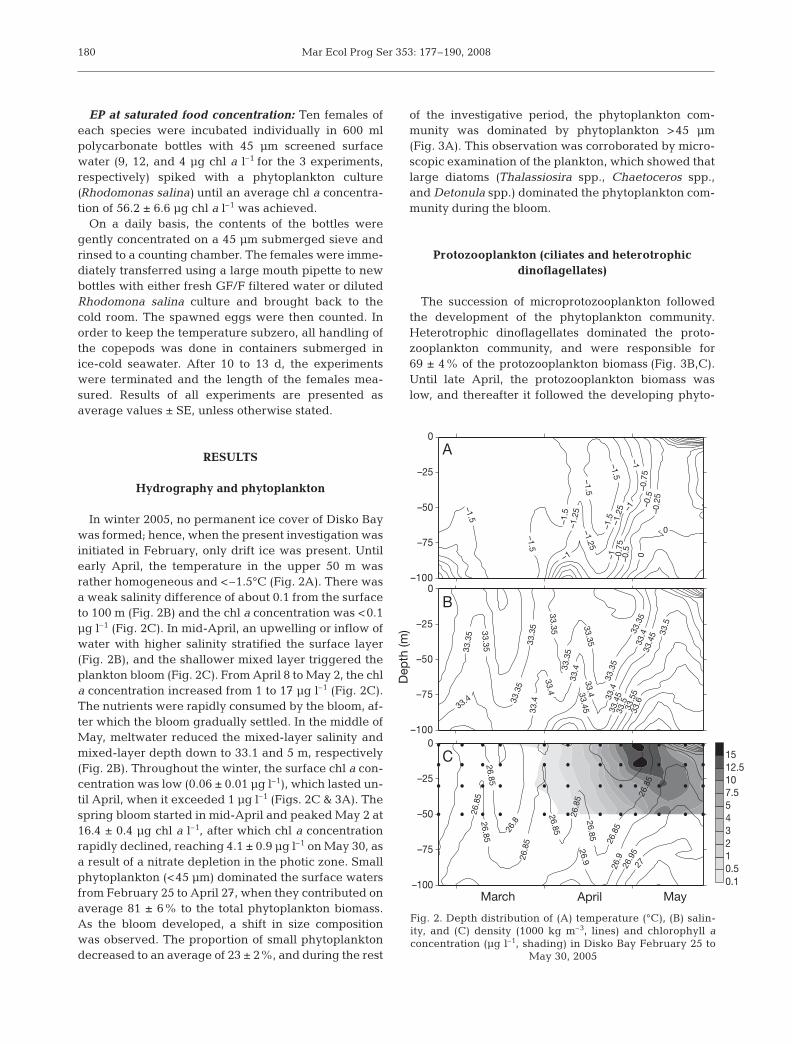
In winter 2005, no permanent ice cover of Disko Baywas formed; hence, when the present investigation wasinitiated in February, only drift ice was present. Untilearly April, the temperature in the upper 50 m wasrather homogeneous and <–1.5°C (Fig. 2A). There wasa weak salinity difference of about 0.1 from the surfaceto 100 m (Fig. 2B) and the chl a concentration was <0.1µg l–1 (Fig. 2C). In mid-April, an upwelling or inflow ofwater with higher salinity stratified the surface layer(Fig. 2B), and the shallower mixed layer triggered theplankton bloom (Fig. 2C). From April 8 to May 2, the chla concentration increased from 1 to 17 µg l–1 (Fig. 2C).The nutrients were rapidly consumed by the bloom, af-ter which the bloom gradually settled. In the middle ofMay, meltwater reduced the mixed-layer salinity andmixed-layer depth down to 33.1 and 5 m, respectively(Fig. 2B). Throughout the winter, the surface chl a con-centration was low (0.06 ± 0.01 µg l–1), which lasted un-til April, when it exceeded 1 µg l–1 (Figs. 2C & 3A). Thespring bloom started in mid-April and peaked May 2 at16.4 ± 0.4 µg chl a l–1, after which chl a concentrationrapidly declined, reaching 4.1 ± 0.9 µg l–1 on May 30, asa result of a nitrate depletion in the photic zone. Smallphytoplankton (<45 µm) dominated the surface watersfrom February 25 to April 27, when they contributed onaverage 81 ± 6% to the total phytoplankton biomass.As the bloom developed, a shift in size compositionwas observed. The proportion of small phytoplanktondecreased to an average of 23 ± 2%, and during the rest
of the investigative period, the phytoplankton com-munity was dominated by phytoplankton >45 µm(Fig. 3A). This observation was corroborated by micro-scopic examination of the plankton, which showed thatlarge diatoms (Thalassiosira spp., Chaetoceros spp.,and Detonula spp.) dominated the phytoplankton com-munity during the bloom.
Protozooplankton (ciliates and heterotrophicdinoflagellates)
The succession of microprotozooplankton followedthe development of the phytoplankton community.Heterotrophic dinoflagellates dominated the proto-zooplankton community, and were responsible for69 ± 4% of the protozooplankton biomass (Fig. 3B,C).Until late April, the protozooplankton biomass waslow, and thereafter it followed the developing phyto-
180
Dep
th (m
)
March April May
0
0.10.5123457.51012.515
–100
–75
–50
–25
0–100
–75
–50
–25
0
–100
–75
–50
–25
0
A
B
C
27
26.8526.85
26.85
26.8
5
26.8
5
26.8
5
26.85
26.8
526.8
26.9
5
26.9
26.9
26.8
5
33.3
5
33.3
5
33.3
5
33.4
33.4
33.4
33.4
33.4
33.4
533
.5
33.5
33.5
533
.633
.45
33.35
33.4
–1.5
–1.25
–1.5
–1.5
–0.5
–0.5 0–0.7
5
–0.7
5–0
.25
–1.2
5 –1
–1–1
–1.2
5
–1.5
–1.5
–1.5
–1
33.433.45
33.35
33.3
533.3
5
33.35
33.3
5
Fig. 2. Depth distribution of (A) temperature (°C), (B) salin-ity, and (C) density (1000 kg m–3, lines) and chlorophyll aconcentration (µg l–1, shading) in Disko Bay February 25 to
May 30, 2005
Madsen et al.: Calanus spp. feeding and egg production
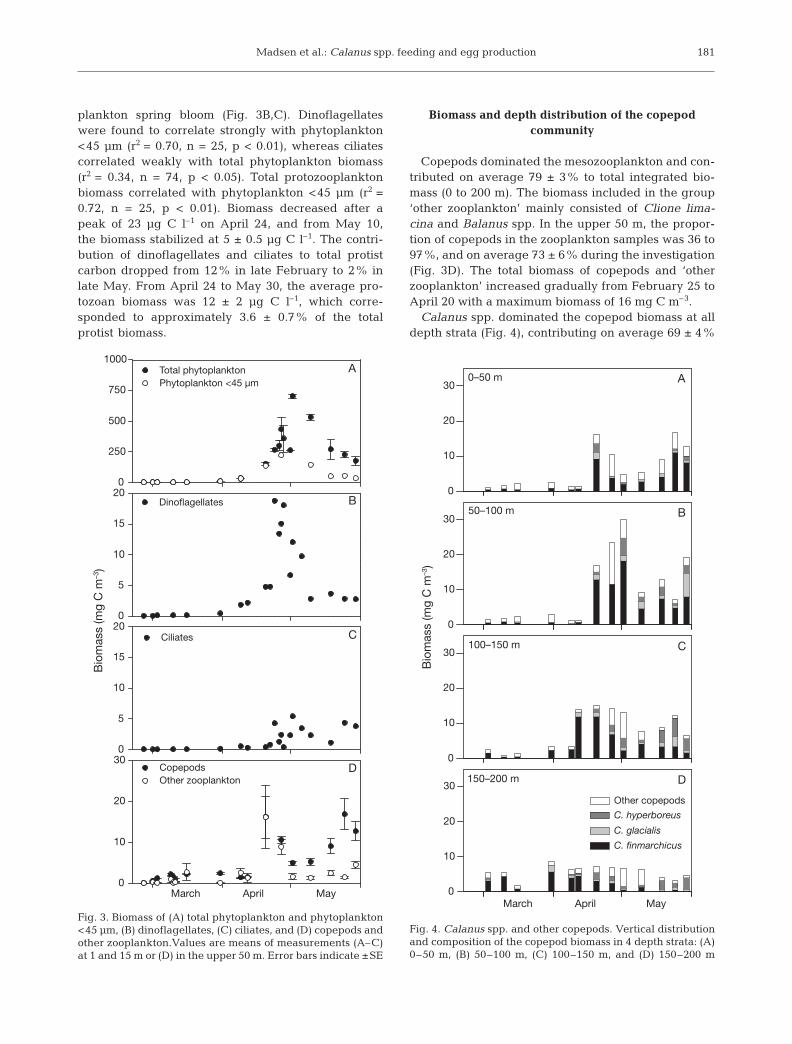
plankton spring bloom (Fig. 3B,C). Dinoflagellateswere found to correlate strongly with phytoplankton<45 µm (r2 = 0.70, n = 25, p < 0.01), whereas ciliatescorrelated weakly with total phytoplankton biomass(r2 = 0.34, n = 74, p < 0.05). Total protozooplanktonbiomass correlated with phytoplankton <45 µm (r2 =0.72, n = 25, p < 0.01). Biomass decreased after apeak of 23 µg C l–1 on April 24, and from May 10,the biomass stabilized at 5 ± 0.5 µg C l–1. The contri-bution of dinoflagellates and ciliates to total protistcarbon dropped from 12% in late February to 2% inlate May. From April 24 to May 30, the average pro-tozoan biomass was 12 ± 2 µg C l–1, which corre-sponded to approximately 3.6 ± 0.7% of the totalprotist biomass.
Biomass and depth distribution of the copepodcommunity
Copepods dominated the mesozooplankton and con-tributed on average 79 ± 3% to total integrated bio-mass (0 to 200 m). The biomass included in the group‘other zooplankton’ mainly consisted of Clione lima-cina and Balanus spp. In the upper 50 m, the propor-tion of copepods in the zooplankton samples was 36 to97%, and on average 73 ± 6% during the investigation(Fig. 3D). The total biomass of copepods and ‘otherzooplankton’ increased gradually from February 25 toApril 20 with a maximum biomass of 16 mg C m–3.
Calanus spp. dominated the copepod biomass at alldepth strata (Fig. 4), contributing on average 69 ± 4%
181
0
250
500
750
1000Total phytoplanktonPhytoplankton <45 µm
0
5
10
15
20Dinoflagellates
0
5
10
15
20Ciliates
Bio
mas
s (m
g C
m–3
)
March April May
A
B
C
0
10
20
30CopepodsOther zooplankton
D
Fig. 3. Biomass of (A) total phytoplankton and phytoplankton<45 µm, (B) dinoflagellates, (C) ciliates, and (D) copepods andother zooplankton.Values are means of measurements (A–C)at 1 and 15 m or (D) in the upper 50 m. Error bars indicate ±SE
100–150 m
0
10
20
30
50–100 m
0
10
20
30
0–50 m
0
10
20
30
Bio
mas
s (m
g C
m–3
)
A
B
C
150–200 m
0
10
20
30
C. finmarchicus
C. glacialis
C. hyperboreus
Other copepods
March MayApril
D
Fig. 4. Calanus spp. and other copepods. Vertical distributionand composition of the copepod biomass in 4 depth strata: (A)0–50 m, (B) 50–100 m, (C) 100–150 m, and (D) 150–200 m
Mar Ecol Prog Ser 353: 177–190, 2008
to the integrated copepod biomass (0 to 200 m). C. fin-marchicus was by far the most abundant species,responsible for on average 75 ± 4% of the integratedCalanus biomass, with the other 25% equally dividedbetween C. glacialis and C. hyperboreus. The group of‘other copepods’ primarily consisted of Pseudocalanussp., Metridia longa, and Oithona similis. Until mid-April, the biomass of copepods was low and relativelyconstant at all depths. During April, the copepodsgradually migrated towards the surface, and fromApril 20, the majority of the biomass was located above100 m, with a maximum biomass of 30 mg C m–3 mea-sured at 50 to 100 m depth on May 2.
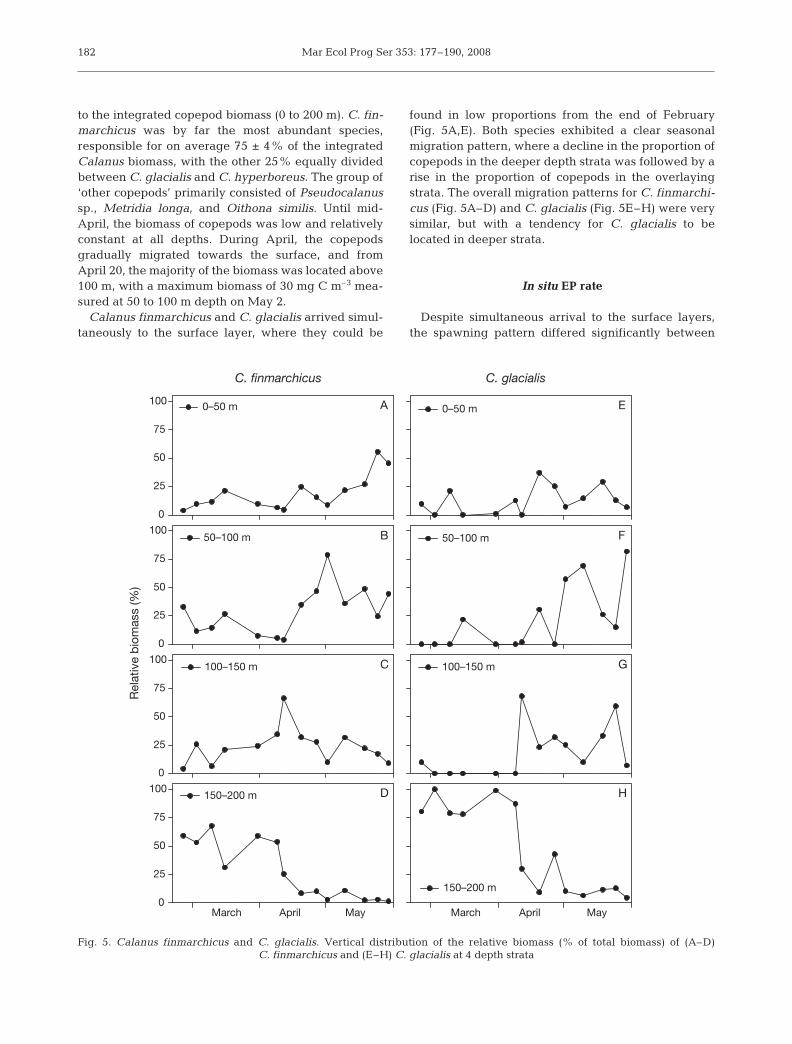
Calanus finmarchicus and C. glacialis arrived simul-taneously to the surface layer, where they could be
found in low proportions from the end of February(Fig. 5A,E). Both species exhibited a clear seasonalmigration pattern, where a decline in the proportion ofcopepods in the deeper depth strata was followed by arise in the proportion of copepods in the overlayingstrata. The overall migration patterns for C. finmarchi-cus (Fig. 5A–D) and C. glacialis (Fig. 5E–H) were verysimilar, but with a tendency for C. glacialis to belocated in deeper strata.
In situ EP rate
Despite simultaneous arrival to the surface layers,the spawning pattern differed significantly between
182
C. finmarchicus
0
25
50
75
100 0–50 m
0
25
50
75
10050–100 m
0
25
50
75
100100–150 m
0
25
50
75
100150–200 m
C. glacialis
0–50 m
50–100 m
100–150 m
150–200 m
A
B
C
D
E
F
G
H
Rel
ativ
e b
iom
ass
(%)
MayAprilMarch March April May
Fig. 5. Calanus finmarchicus and C. glacialis. Vertical distribution of the relative biomass (% of total biomass) of (A–D)C. finmarchicus and (E–H) C. glacialis at 4 depth strata
Madsen et al.: Calanus spp. feeding and egg production
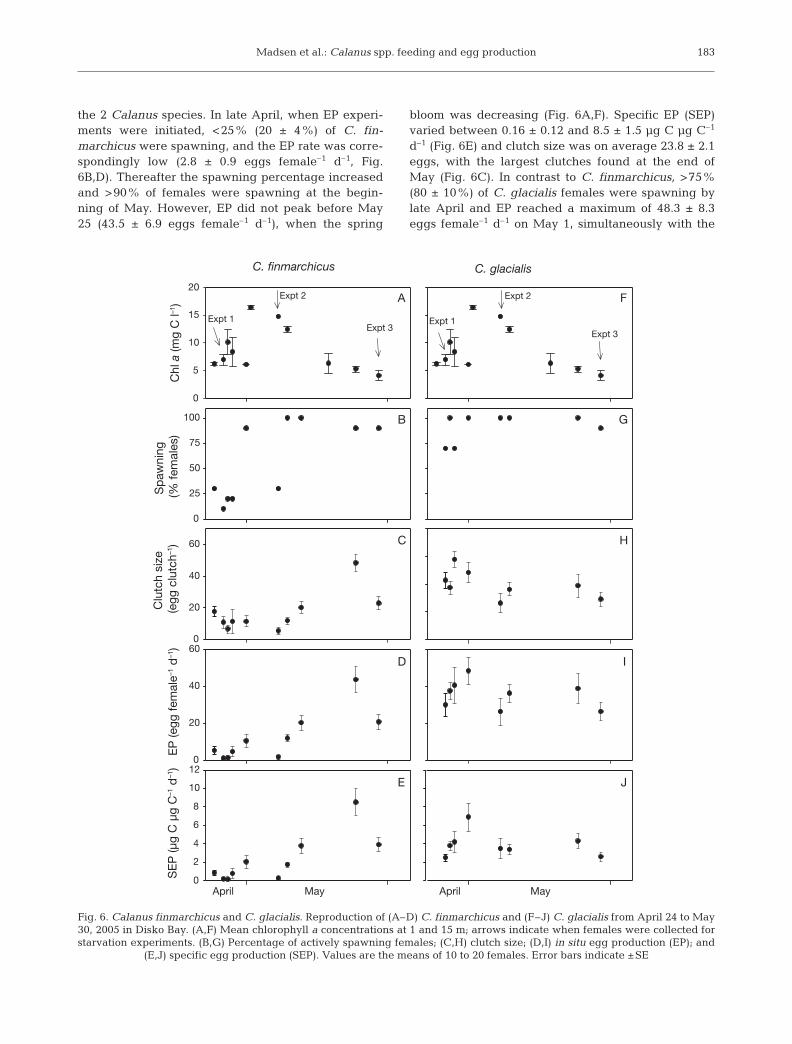
the 2 Calanus species. In late April, when EP experi-ments were initiated, <25% (20 ± 4%) of C. fin-marchicus were spawning, and the EP rate was corre-spondingly low (2.8 ± 0.9 eggs female–1 d–1, Fig.6B,D). Thereafter the spawning percentage increasedand >90% of females were spawning at the begin-ning of May. However, EP did not peak before May25 (43.5 ± 6.9 eggs female–1 d–1), when the spring
bloom was decreasing (Fig. 6A,F). Specific EP (SEP)varied between 0.16 ± 0.12 and 8.5 ± 1.5 µg C µg C–1
d–1 (Fig. 6E) and clutch size was on average 23.8 ± 2.1eggs, with the largest clutches found at the end ofMay (Fig. 6C). In contrast to C. finmarchicus, >75%(80 ± 10%) of C. glacialis females were spawning bylate April and EP reached a maximum of 48.3 ± 8.3eggs female–1 d–1 on May 1, simultaneously with the
183
Chl
a (m
g C
l–1)
0
5
10
15
20
C. finmarchicus
Sp
awni
ng
(% fe
mal
es)
0
25
50
75
100
Clu
tch
size
(e
gg c
lutc
h–1)
0
20
40
60
EP
(egg
fem
ale–1
d–1
)
0
20
40
60
SE
P (µ
g C
µg
C–1
d–1
)
0
2
4
6
8
10
12
A
B
C
D
E
G
H
I
J
Expt 1
Expt 2
Expt 3Expt 1
Expt 2
Expt 3
F
C. glacialis
May MayApril April
Fig. 6. Calanus finmarchicus and C. glacialis. Reproduction of (A–D) C. finmarchicus and (F–J) C. glacialis from April 24 to May30, 2005 in Disko Bay. (A,F) Mean chlorophyll a concentrations at 1 and 15 m; arrows indicate when females were collected forstarvation experiments. (B,G) Percentage of actively spawning females; (C,H) clutch size; (D,I) in situ egg production (EP); and
(E,J) specific egg production (SEP). Values are the means of 10 to 20 females. Error bars indicate ±SE
Mar Ecol Prog Ser 353: 177–190, 2008
peak of the spring bloom (Fig. 6G,I). During May,average EP remained high (31.7 ± 2.9 eggs female–1
d–1) and spawning percentage never dropped below90% (98 ± 2%). SEP for C. glacialis varied between2.5 ± 0.5 and 7.0 ± 1.5 µg C µg C–1 d–1 (Fig. 6J) andthe average clutch size was 38 ± 2 eggs, with thelargest clutches recorded from the end of April to thebeginning of May (Fig. 6H).
There was no significant correlation between the EPof Calanus finmarchicus and C. glacialis and the bio-mass of any of the potential prey organisms, i.e. phyto-plankton, protozooplankton, or total protist biomass.A day-by-day comparison of SEP rates between C.finmarchicus and C. glacialis revealed a significant
difference in the reproductive activity over the season(Mann-Whitney U-test p < 0.05). C. glacialis was foundto spawn earlier, with an EP peaking almost a monthbefore that of C. finmarchicus.
Laboratory experiments
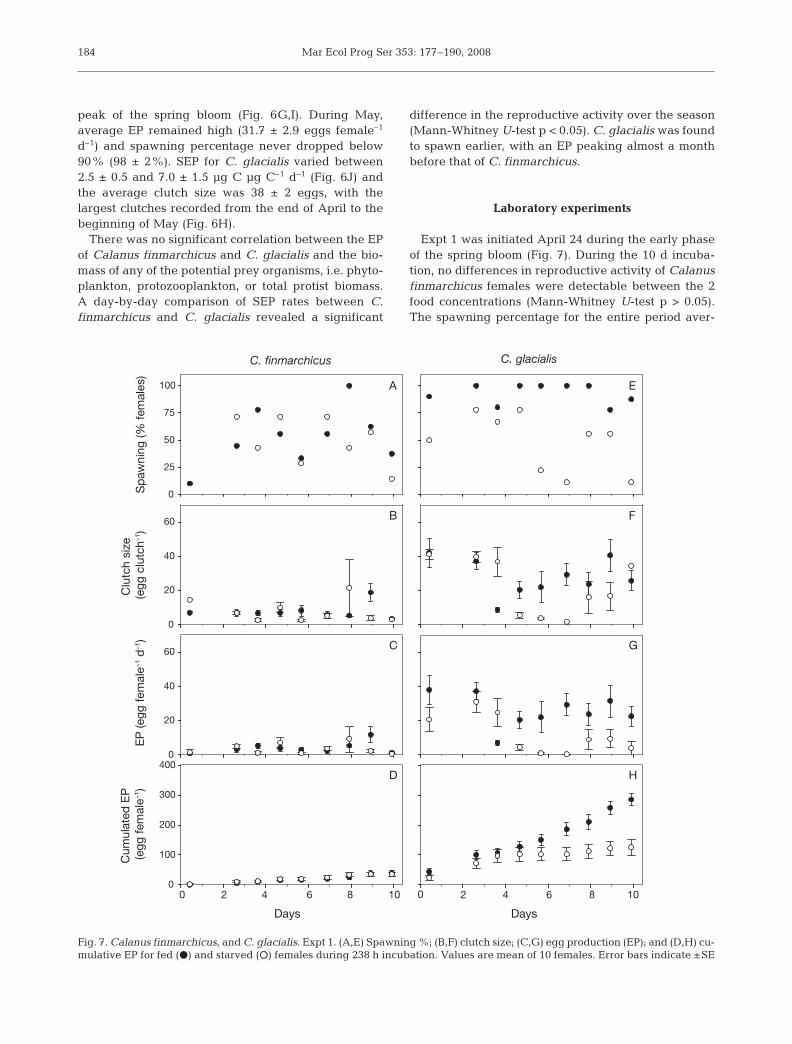
Expt 1 was initiated April 24 during the early phaseof the spring bloom (Fig. 7). During the 10 d incuba-tion, no differences in reproductive activity of Calanusfinmarchicus females were detectable between the 2food concentrations (Mann-Whitney U-test p > 0.05).The spawning percentage for the entire period aver-
184
C. finmarchicus
Sp
awni
ng (%
fem
ales
)
0
25
50
75
100
C. glacialis
EP
(egg
fem
ale–1
d–1
)
0
20
40
60
Clu
tch
size
(e
gg c
lutc
h–1)
0
20
40
60
Cum
ulat
ed E
P
(egg
fem
ale–1
)
0
100
200
300
400
A
B
C
D
E
F
G
H
Days Days
2 4 6 8 10 4 6 8 1020 0
Fig. 7. Calanus finmarchicus, and C. glacialis. Expt 1. (A,E) Spawning %; (B,F) clutch size; (C,G) egg production (EP); and (D,H) cu-mulative EP for fed (d) and starved (s) females during 238 h incubation. Values are mean of 10 females. Error bars indicate ±SE
Madsen et al.: Calanus spp. feeding and egg production
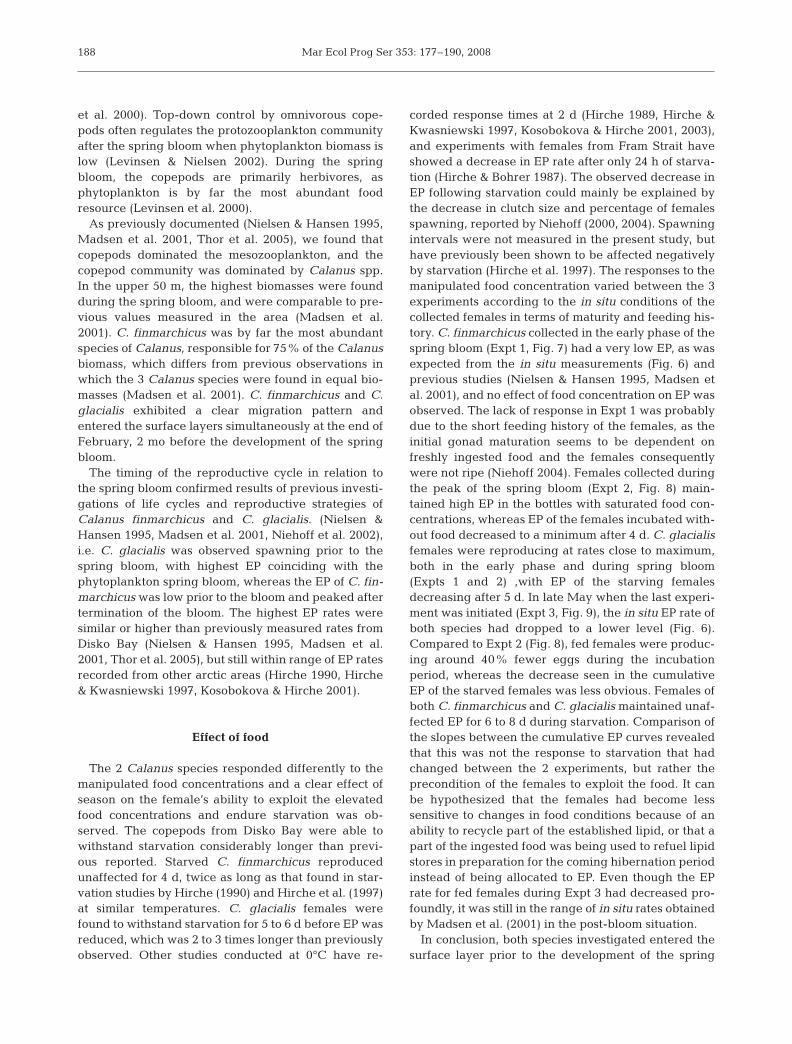
aged 50% for both fed and starved females (54 ± 9 and46 ± 8%, respectively, Fig. 7A) and clutch size aver-aged 7.5 ± 1 and 7.7 ± 1.8 eggs, respectively (Fig. 7B).Rates of EP were 4.0 ± 0.7 for fed females and 3.4 ± 0.9eggs female–1 d–1 for starved females (Fig. 7C), andcumulative EP after 10 d were 38.9 ± 9.2 and 35.9 ± 6.3eggs female–1 for fed and starved females, respectively(Fig. 7D).
In contrast to Calanus finmarchicus, C. glacialisshowed a clear decrease in reproduction due to starva-tion, with a significant difference in EP between fedand starved females after 5 d (Mann-Whitney U-testp < 0.05). While the spawning percentage of fedfemales remained constant at 92.3 ± 3.1% during theentire period, the spawning percentage for starvedfemales averaged 68.1 ± 6.6% the first 5 d and fell to31.1 ± 10.2% thereafter (Fig. 7E). Clutch sizes for fedand starved females were high the first 3 d, averaging39.5 ± 3.2 and 39.1 ± 3 eggs, respectively (Fig. 7F).Thereafter the clutch size for starved females fell to anaverage of 17.6 ± 3.6 eggs, whereas for fed females itwas averaging 23.9 ± 2.7 eggs. As a consequence of thedrastic decrease in the amount of females spawningand clutch size, EP for starved females dropped rapidlyfrom averaging 20.1 ± 3.4 eggs female–1 d–1 after 5 d, toan average of 4.6 ± 1.8 eggs female–1 d–1 (Fig. 7G). Incontrast, EP for fed females remained at 25.1 ± 3.3 eggsfemale–1 d–1. Furthermore, starved females had acumulative EP after 10 d which was half the size of thefed ones (125 ± 24 and 285 ± 17 eggs, respectively),with differences between fed and starved femalesbecoming significant after 6 d (Mann-Whitney U-testp < 0.05) (Fig. 7H).
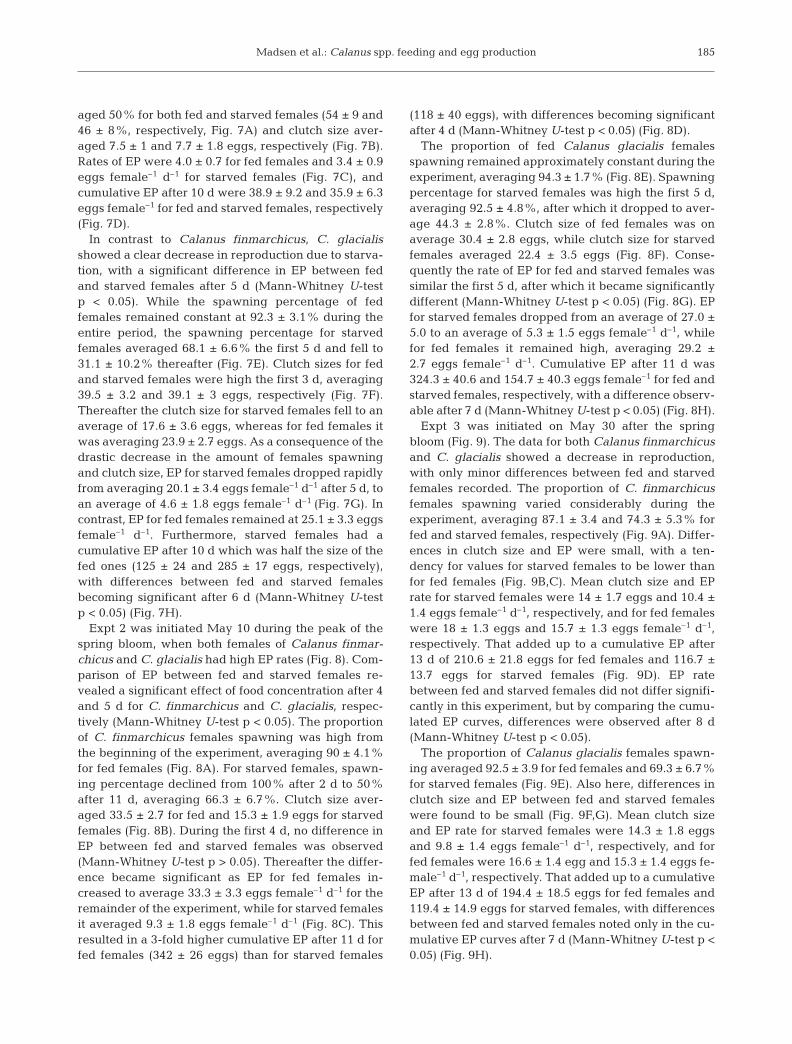
Expt 2 was initiated May 10 during the peak of thespring bloom, when both females of Calanus finmar-chicus and C. glacialis had high EP rates (Fig. 8). Com-parison of EP between fed and starved females re-vealed a significant effect of food concentration after 4and 5 d for C. finmarchicus and C. glacialis, respec-tively (Mann-Whitney U-test p < 0.05). The proportionof C. finmarchicus females spawning was high fromthe beginning of the experiment, averaging 90 ± 4.1%for fed females (Fig. 8A). For starved females, spawn-ing percentage declined from 100% after 2 d to 50%after 11 d, averaging 66.3 ± 6.7%. Clutch size aver-aged 33.5 ± 2.7 for fed and 15.3 ± 1.9 eggs for starvedfemales (Fig. 8B). During the first 4 d, no difference inEP between fed and starved females was observed(Mann-Whitney U-test p > 0.05). Thereafter the differ-ence became significant as EP for fed females in-creased to average 33.3 ± 3.3 eggs female–1 d–1 for theremainder of the experiment, while for starved femalesit averaged 9.3 ± 1.8 eggs female–1 d–1 (Fig. 8C). Thisresulted in a 3-fold higher cumulative EP after 11 d forfed females (342 ± 26 eggs) than for starved females
(118 ± 40 eggs), with differences becoming significantafter 4 d (Mann-Whitney U-test p < 0.05) (Fig. 8D).
The proportion of fed Calanus glacialis femalesspawning remained approximately constant during theexperiment, averaging 94.3 ± 1.7% (Fig. 8E). Spawningpercentage for starved females was high the first 5 d,averaging 92.5 ± 4.8%, after which it dropped to aver-age 44.3 ± 2.8%. Clutch size of fed females was onaverage 30.4 ± 2.8 eggs, while clutch size for starvedfemales averaged 22.4 ± 3.5 eggs (Fig. 8F). Conse-quently the rate of EP for fed and starved females wassimilar the first 5 d, after which it became significantlydifferent (Mann-Whitney U-test p < 0.05) (Fig. 8G). EPfor starved females dropped from an average of 27.0 ±5.0 to an average of 5.3 ± 1.5 eggs female–1 d–1, whilefor fed females it remained high, averaging 29.2 ±2.7 eggs female–1 d–1. Cumulative EP after 11 d was324.3 ± 40.6 and 154.7 ± 40.3 eggs female–1 for fed andstarved females, respectively, with a difference observ-able after 7 d (Mann-Whitney U-test p < 0.05) (Fig. 8H).
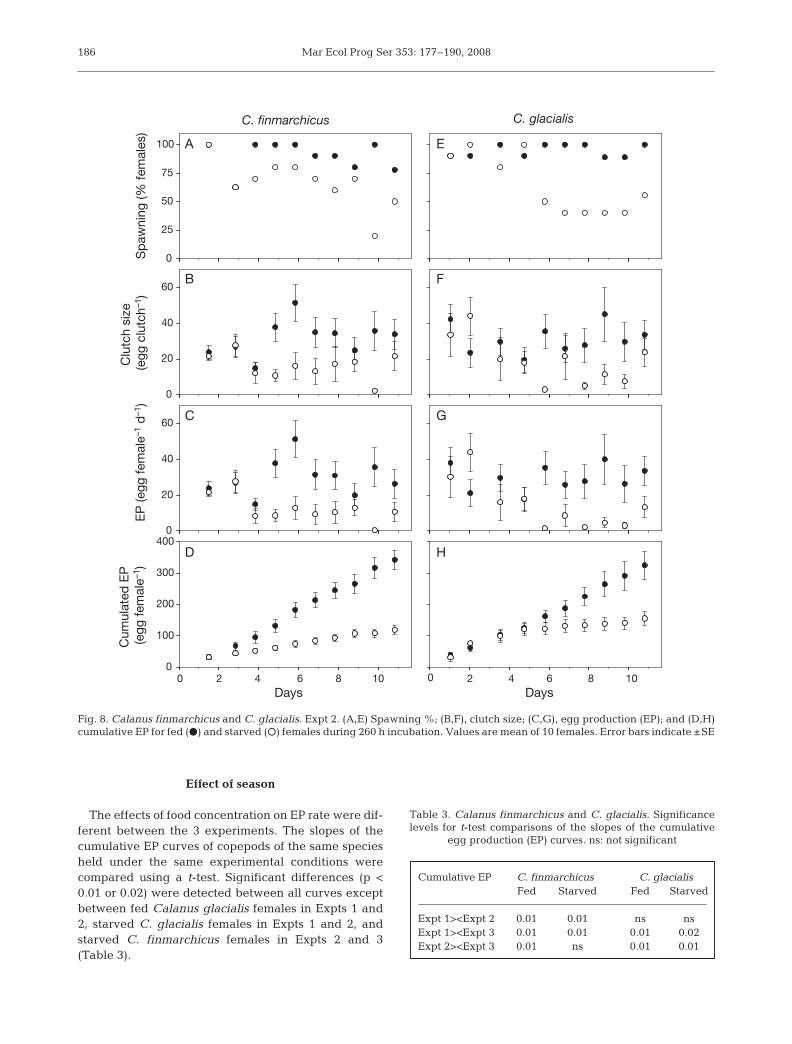
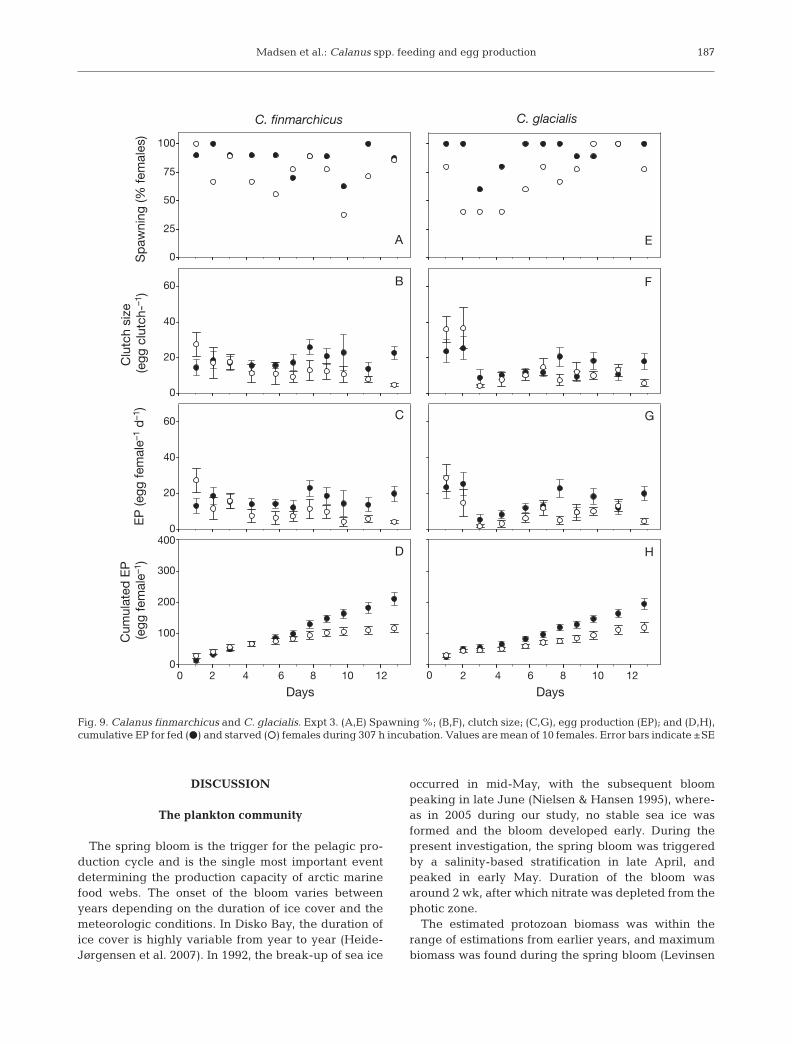
Expt 3 was initiated on May 30 after the springbloom (Fig. 9). The data for both Calanus finmarchicusand C. glacialis showed a decrease in reproduction,with only minor differences between fed and starvedfemales recorded. The proportion of C. finmarchicusfemales spawning varied considerably during theexperiment, averaging 87.1 ± 3.4 and 74.3 ± 5.3% forfed and starved females, respectively (Fig. 9A). Differ-ences in clutch size and EP were small, with a ten-dency for values for starved females to be lower thanfor fed females (Fig. 9B,C). Mean clutch size and EPrate for starved females were 14 ± 1.7 eggs and 10.4 ±1.4 eggs female–1 d–1, respectively, and for fed femaleswere 18 ± 1.3 eggs and 15.7 ± 1.3 eggs female–1 d–1,respectively. That added up to a cumulative EP after13 d of 210.6 ± 21.8 eggs for fed females and 116.7 ±13.7 eggs for starved females (Fig. 9D). EP ratebetween fed and starved females did not differ signifi-cantly in this experiment, but by comparing the cumu-lated EP curves, differences were observed after 8 d(Mann-Whitney U-test p < 0.05).
The proportion of Calanus glacialis females spawn-ing averaged 92.5 ± 3.9 for fed females and 69.3 ± 6.7%for starved females (Fig. 9E). Also here, differences inclutch size and EP between fed and starved femaleswere found to be small (Fig. 9F,G). Mean clutch sizeand EP rate for starved females were 14.3 ± 1.8 eggsand 9.8 ± 1.4 eggs female–1 d–1, respectively, and forfed females were 16.6 ± 1.4 egg and 15.3 ± 1.4 eggs fe-male–1 d–1, respectively. That added up to a cumulativeEP after 13 d of 194.4 ± 18.5 eggs for fed females and119.4 ± 14.9 eggs for starved females, with differencesbetween fed and starved females noted only in the cu-mulative EP curves after 7 d (Mann-Whitney U-test p <0.05) (Fig. 9H).
185
Mar Ecol Prog Ser 353: 177–190, 2008
Effect of season
The effects of food concentration on EP rate were dif-ferent between the 3 experiments. The slopes of thecumulative EP curves of copepods of the same speciesheld under the same experimental conditions werecompared using a t-test. Significant differences (p <0.01 or 0.02) were detected between all curves exceptbetween fed Calanus glacialis females in Expts 1 and2, starved C. glacialis females in Expts 1 and 2, andstarved C. finmarchicus females in Expts 2 and 3(Table 3).
186
Cumulative EP C. finmarchicus C. glacialisFed Starved Fed Starved
Expt 1><Expt 2 0.01 0.01 ns nsExpt 1><Expt 3 0.01 0.01 0.01 0.02Expt 2><Expt 3 0.01 ns 0.01 0.01
Table 3. Calanus finmarchicus and C. glacialis. Significancelevels for t-test comparisons of the slopes of the cumulative
egg production (EP) curves. ns: not significant
EP
(egg
fem
ale–1
d–1
)
0
20
40
60
Clu
tch
size
(e
gg c
lutc
h–1)
0
20
40
60
Days
Cum
ulat
ed E
P
(egg
fem
ale–1
)
0
100
200
300
400
Days
C. glacialisC. finmarchicus
Sp
awni
ng (%
fem
ales
)
0
25
50
75
100 A
B
C
D
E
F
G
H
2 4 6 8 10 2 4 6 8 100 0
Fig. 8. Calanus finmarchicus and C. glacialis. Expt 2. (A,E) Spawning %; (B,F), clutch size; (C,G), egg production (EP); and (D,H)cumulative EP for fed (d) and starved (s) females during 260 h incubation. Values are mean of 10 females. Error bars indicate ±SE
Madsen et al.: Calanus spp. feeding and egg production
DISCUSSION
The plankton community
The spring bloom is the trigger for the pelagic pro-duction cycle and is the single most important eventdetermining the production capacity of arctic marinefood webs. The onset of the bloom varies betweenyears depending on the duration of ice cover and themeteorologic conditions. In Disko Bay, the duration ofice cover is highly variable from year to year (Heide-Jørgensen et al. 2007). In 1992, the break-up of sea ice
occurred in mid-May, with the subsequent bloompeaking in late June (Nielsen & Hansen 1995), where-as in 2005 during our study, no stable sea ice wasformed and the bloom developed early. During thepresent investigation, the spring bloom was triggeredby a salinity-based stratification in late April, andpeaked in early May. Duration of the bloom wasaround 2 wk, after which nitrate was depleted from thephotic zone.
The estimated protozoan biomass was within therange of estimations from earlier years, and maximumbiomass was found during the spring bloom (Levinsen
187
C. finmarchicus
Sp
awni
ng (%
fem
ales
)C
lutc
h si
ze
(egg
clu
tch-
–1)
C. glacialis
EP
(egg
fem
ale–1
d–1
)
Days
Cum
ulat
ed E
P
(egg
fem
ale–1
)
Days
0
25
50
75
100
0
20
40
60
0
20
40
60
0
100
200
300
400
A
B
C
D
E
F
G
H
0 2 4 6 8 10 12 2 4 6 8 10 120
Fig. 9. Calanus finmarchicus and C. glacialis. Expt 3. (A,E) Spawning %; (B,F), clutch size; (C,G), egg production (EP); and (D,H),cumulative EP for fed (d) and starved (s) females during 307 h incubation. Values are mean of 10 females. Error bars indicate ±SE
Mar Ecol Prog Ser 353: 177–190, 2008
et al. 2000). Top-down control by omnivorous cope-pods often regulates the protozooplankton communityafter the spring bloom when phytoplankton biomass islow (Levinsen & Nielsen 2002). During the springbloom, the copepods are primarily herbivores, asphytoplankton is by far the most abundant foodresource (Levinsen et al. 2000).
As previously documented (Nielsen & Hansen 1995,Madsen et al. 2001, Thor et al. 2005), we found thatcopepods dominated the mesozooplankton, and thecopepod community was dominated by Calanus spp.In the upper 50 m, the highest biomasses were foundduring the spring bloom, and were comparable to pre-vious values measured in the area (Madsen et al.2001). C. finmarchicus was by far the most abundantspecies of Calanus, responsible for 75% of the Calanusbiomass, which differs from previous observations inwhich the 3 Calanus species were found in equal bio-masses (Madsen et al. 2001). C. finmarchicus and C.glacialis exhibited a clear migration pattern andentered the surface layers simultaneously at the end ofFebruary, 2 mo before the development of the springbloom.
The timing of the reproductive cycle in relation tothe spring bloom confirmed results of previous investi-gations of life cycles and reproductive strategies ofCalanus finmarchicus and C. glacialis. (Nielsen &Hansen 1995, Madsen et al. 2001, Niehoff et al. 2002),i.e. C. glacialis was observed spawning prior to thespring bloom, with highest EP coinciding with thephytoplankton spring bloom, whereas the EP of C. fin-marchicus was low prior to the bloom and peaked aftertermination of the bloom. The highest EP rates weresimilar or higher than previously measured rates fromDisko Bay (Nielsen & Hansen 1995, Madsen et al.2001, Thor et al. 2005), but still within range of EP ratesrecorded from other arctic areas (Hirche 1990, Hirche& Kwasniewski 1997, Kosobokova & Hirche 2001).
Effect of food
The 2 Calanus species responded differently to themanipulated food concentrations and a clear effect ofseason on the female’s ability to exploit the elevatedfood concentrations and endure starvation was ob-served. The copepods from Disko Bay were able towithstand starvation considerably longer than previ-ous reported. Starved C. finmarchicus reproducedunaffected for 4 d, twice as long as that found in star-vation studies by Hirche (1990) and Hirche et al. (1997)at similar temperatures. C. glacialis females werefound to withstand starvation for 5 to 6 d before EP wasreduced, which was 2 to 3 times longer than previouslyobserved. Other studies conducted at 0°C have re-
corded response times at 2 d (Hirche 1989, Hirche &Kwasniewski 1997, Kosobokova & Hirche 2001, 2003),and experiments with females from Fram Strait haveshowed a decrease in EP rate after only 24 h of starva-tion (Hirche & Bohrer 1987). The observed decrease inEP following starvation could mainly be explained bythe decrease in clutch size and percentage of femalesspawning, reported by Niehoff (2000, 2004). Spawningintervals were not measured in the present study, buthave previously been shown to be affected negativelyby starvation (Hirche et al. 1997). The responses to themanipulated food concentration varied between the 3experiments according to the in situ conditions of thecollected females in terms of maturity and feeding his-tory. C. finmarchicus collected in the early phase of thespring bloom (Expt 1, Fig. 7) had a very low EP, as wasexpected from the in situ measurements (Fig. 6) andprevious studies (Nielsen & Hansen 1995, Madsen etal. 2001), and no effect of food concentration on EP wasobserved. The lack of response in Expt 1 was probablydue to the short feeding history of the females, as theinitial gonad maturation seems to be dependent onfreshly ingested food and the females consequentlywere not ripe (Niehoff 2004). Females collected duringthe peak of the spring bloom (Expt 2, Fig. 8) main-tained high EP in the bottles with saturated food con-centrations, whereas EP of the females incubated with-out food decreased to a minimum after 4 d. C. glacialisfemales were reproducing at rates close to maximum,both in the early phase and during spring bloom(Expts 1 and 2) ,with EP of the starving femalesdecreasing after 5 d. In late May when the last experi-ment was initiated (Expt 3, Fig. 9), the in situ EP rate ofboth species had dropped to a lower level (Fig. 6).Compared to Expt 2 (Fig. 8), fed females were produc-ing around 40% fewer eggs during the incubationperiod, whereas the decrease seen in the cumulativeEP of the starved females was less obvious. Females ofboth C. finmarchicus and C. glacialis maintained unaf-fected EP for 6 to 8 d during starvation. Comparison ofthe slopes between the cumulative EP curves revealedthat this was not the response to starvation that hadchanged between the 2 experiments, but rather theprecondition of the females to exploit the food. It canbe hypothesized that the females had become lesssensitive to changes in food conditions because of anability to recycle part of the established lipid, or that apart of the ingested food was being used to refuel lipidstores in preparation for the coming hibernation periodinstead of being allocated to EP. Even though the EPrate for fed females during Expt 3 had decreased pro-foundly, it was still in the range of in situ rates obtainedby Madsen et al. (2001) in the post-bloom situation.
In conclusion, both species investigated entered thesurface layer prior to the development of the spring
188
Madsen et al.: Calanus spp. feeding and egg production
bloom and depended on food to maintain maximal EP.Before the spring bloom, Calanus finmarchicus wasless able to handle an extended period of starvationthan was C. glacialis, but once the bloom was under-way, both species had a similar response to starvation.Females of C. glacialis and C. finmarchicus from DiskoBay seemed to be capable of enduring considerablylonger starvation periods than females collected fromother areas before lipid stores were exhausted and aneffect on reproductive output was observed. This couldbe an adaptive response to the highly unpredictableenvironment of Disko Bay, and a possible explanationof the reproductive success of the Atlantic copepod C.finmarchicus in this Arctic area.
The strategy of Calanus glacialis to spawn prior tothe spring bloom could be an adaptation to the unpre-dictable food conditions in the arctic environment withoscillating ice cover. In a future warmer climate, theinitiation of the spring bloom will be more predictable,as the bloom will develop according to the light cyclerather than the ice break-up. In such a scenario, theadvantages of early spawning could change to aburden in the competition with the co-occurring C.finmarchicus. Consequently, in a warmer future, thesmaller, faster-growing C. finmarchicus with a shorterlife cycle could have an advantage and take over as thedominating copepod in this Arctic ecosystem.
Acknowledgements. This study was supported by DANCEAand the Danish National Research Council (grant #21-04-0391 to TGN). The Arctic station Qeqertarsuaq, University ofCopenhagen, provided an excellent working platform onland. F. Grønvold, captain of MS ‘Porsild’ and his staff pro-vided great technical support at sea. We greatly acknowledgeJ. Larsen for skilled technical assistance. M. Maar and P. Thorare acknowledged for comments to an earlier version of themanuscript.
LITERATURE CITED
Conover RJ (1988) Comparative life histories in the generaCalanus and Neocalanus in high latitudes of the northernhemisphere. Hydrobiologia 167/168:127–142
Fiksen Ø (2000) The adaptive timing of diapause: a search forevolutionarily robust strategies in Calanus finmarchicus.ICES J Mar Sci 57:1825–1833
Grasshoff K (1976) Methods for seawater analysis. Weinheim,New York
Hansen AS, Nielsen TG, Levinsen H, Madsen SD, ThingstadTF, Hansen BW (2003) Impact of changing ice cover onpelagic productivity and food web structure in Disko Bay,West Greenland: a dynamic model approach. Deep-SeaRes I 50:171–187
Hansen BW, Nielsen TG, Levinsen H (1999) Plankton commu-nity structure and carbon cycling on the western coast ofGreenland during the stratified summer situation. III.Mesozooplankton. Aquat Microb Ecol 16:233–249
Heide-Jørgensen MP, Acquarone M (2002) Size and trends ofthe bowhead, beluga and narwhal stocks wintering offWest Greenland. Sci N Atl Mar Mamm Comm 4:191–210
Heide-Jørgensen MP, Laidre KL, Logsdon ML, Nielsen TG(2007) Springtime coupling between phytoplankton, seaice, and sea surface temperature in Disko Bay, WestGreenland. Progr Oceanogr 73:79–95
Hirche HJ (1989) Egg production of the Arctic copepod Cala-nus glacialis: laboratory experiments. Mar Biol 103:311–318
Hirche HJ (1990) Egg production of Calanus finmarchicus atlow temperature. Mar Biol 106:53–58
Hirche HJ, Bohrer RN (1987) Reproduction of the Arctic cope-pod Calanus glacialis in Fraim Strait. Mar Biol 94:11–17
Hirche HJ, Kosobokova K (2003) Early reproduction anddevelopment of dominant calonoid copepods in the sea icezone of the Barents Sea: Need for a change of paradigms?Mar Biol 143:769–781
Hirche HJ, Kwasniewski S (1997) Distribution, reproductionand development of Calanus species in the NortheastWater in relation to environmental conditions. J Mar Syst10:299–317
Hirche HJ, Niehoff B (1996) Reproduction of the Arctic cope-pod Calanus hyperboreus in the Greenland Sea: field andlaboratory observations. Polar Biol 16:209–219
Hirche HJ, Baumann MEM, Kattner G, Gradinger R (1991)Plankton distribution and the impact of copepod grazingon primary production in Fram Strait, Greenland Sea.J Mar Syst 2:477–479
Hirche HJ, Meyer U, Niehoff B (1997) Egg production ofCalanus finmarchicus: effect of temperature, food andseason. Mar Biol 127:609–620
Jespersen AM, Christoffersen K (1987) Measurements ofchlorophyll-a from phytoplankton using ethanol as extrac-tion solvent. Arch Hydrobiol 109(3):445–454
Karnovsky N, Kwasniewski S, Weslawski JM, Walkusz W,Beszczynska-Möller A (2003) The foraging behaviour oflittle auks in a heterogenous environment. Mar Ecol ProgSer 253:289–303
Kosobokova K, Hirche HJ (2001) Reproduction of Calanusglacialis in the Laptev Sea, Arctic Ocean. Polar Biol 24:33–43
Lee RF, Hagen W, Kattner G (2006) Lipid storage in marinezooplankton. Mar Ecol Prog Ser 307:273–306
Levinsen H, Nielsen TG (2002) The trophic role of marine pel-agic ciliates and heterotrophic dinoflagellates in arctic andtemperate coastal ecosystems: a cross-latitude compa-rison. Limnol Oceanogr 47(2):427–439
Levinsen H, Turner JT, Nielsen TG, Hansen BW (2000) On thetrophic coupling between protists and copepods in arcticmarine ecosystems. Mar Ecol Prog Ser 204:65–77
Madsen SD, Nielsen TG, Hansen BW (2001) Annual popula-tion development and production by Calanus finmarchi-cus, C. glacialis and C. hyperboreus in Disko Bay, westernGreenland. Mar Biol 139:75–93
Menden-Deuer S, Lessard EJ (2000) Carbon to volume rela-tionships for dinoflagellates, diatoms and other protistplankton. Limnol Oceanogr 45:569–579
Møller EF, Nielsen TG, Richardson K (2005) The zooplanktoncommunity in the Greenlandic Sea: composition and roleof carbon turnover. Deep-Sea Res I 53:76–93
Niehoff B (2000) Effect of starvation on the reproductivepotential of Calanus finmarchicus. ICES J Mar Sci 57:1764–1772
Niehoff B (2004) The effect of food limitation on gonad deve-lopment and egg production of the planktonic copepodCalanus finmarchicus. J Exp Mar Biol Ecol 307:237–259
Niehoff B, Madsen SD, Hansen BW, Nielsen TG (2002) Repro-ductive cycles of three dominant Calanus species in DiskoBay, West Greenland. Mar Biol 140:567–576
189
Mar Ecol Prog Ser 353: 177–190, 2008
Nielsen TG, Hansen B (1995) Plankton community structureand carbon cycling on the western coast of Greenlandduring and after the sedimentation of a diatom bloom. MarEcol Prog Ser 125:239–257
Nielsen TG, Hansen PJ (1999) Dyreplankton i Danskefarvande TEMA-rapport fra DMU. Miljø-og Energimini-steriet, Copenhagen
Nielsen TG, Ottosen LD, Hansen BW (2007) Structure andfunction of the pelagic ecosystem in Young Sound, NEGreenland. In: Rysgaard S, Glud RN (eds) carbon cyclingin Arctic marine ecosystems: case study Young Sound.Meddeleser om Grønland Bioscience, Vol 58. Danish PolarCenter, Copenhagen, p 88–107
Pedersen TJ, Nielsen TG, Michel C, Møller EF and others(2006) Sedimentation following the spring bloom in DiskoBay, West Greenland, with special emphasis on the role ofcopepods. Mar Ecol Prog Ser 314:239–255
Smith SL (1990) Egg production and feeding by copepodsprior to the spring bloom of phytoplankton in the FramStrait area of the Greenland Sea. Mar Biol 106:59–69
Thor P, Nielsen TG, Tiselius P, Juul-Pedersen T and others(2005) Post-spring bloom community structure of pelagiccopepods in the Disko Bay, Western Greenland. J Plank-ton Res 27(4):341–356
Thorisson K (2006) How are the vertical migration of cope-pods controlled? J Exp Mar Biol Ecol 329:86–100
190
Editorial responsibility: Matthias Seaman (Assistant Editor-in-Chief), Oldendorf/Luhe, Germany
Submitted: January 2, 2007; Accepted: June 25, 2007Proofs received from author(s): December 19, 2007