Embed Size (px)
Citation preview

Naturschutzbund Deutschland (NABU) – Landesverband Hamburg e. V.
Importance of Fehmarn Belt Fixed Link for Rail Freight Services on the Scandinavia – Germany corridor
- Transport Market Study -
Hanseatic Transport Consultancy
HTC at a Glance HTC - Hanseatic Transport Consultancy, established in October 2008.
The founding members Prof. Dr. Jan Ninnemann and Dr. Thomas
Rössler are connected through many years of joint business consult-
ing. Both hold doctoral degrees in Business Administration.
Broad experience in consultancy combined with practical know how
are the basis for our independent, performance-driven, and compe-
tent consulting approach. Our portfolio includes classical strategy
and management consulting for private businesses as well as pro-
fessional guidance for the public sector, political bodies, and associ-
ations especially with regard to transport, infrastructure and logis-
tics issues.
With our efficient strategy regarding project implementation, we
support our clients to meet the increasing economic and ecological
requirements while realizing sustainable solutions. The combination
of high standards, independence and maximum flexibility paired
with methodical competence and profound knowledge of the
transport sector makes us a strong partner for our national and
international clients. With innovative solutions, we strive for for-
ward-looking ideas for politics, businesses, and communities e.g. in
public participation procedures.
In a globalised environment with permanent changes we strongly
believe in values such as reliability, integrity, and confidentiality,
which for us are best, represented through the Honourable Busi-
nessman concept.
HTC’s contribution to the current question presented by Na-
turschutzbund Deutschland (NABU) – Landesverband Hamburg e. V.
is based on the consultants’ profound knowledge of the Fehmarn
Belt Crossing and the project’s background due the participation in
previous related studies.
Contact
Hanseatic Transport Consultancy
Dr. Ninnemann & Dr. Rössler GbR
Schopenstehl 15 (Miramar-House)
D-20095 Hamburg
Managing Partners
Prof. Dr. Jan Ninnemann
Dr. Thomas Rössler
Ust-Id-Nr. DE261423842
Dr. Thomas Rössler
+49 (40) 18 17 54 06
+49 (172) 32 73 407
http://www.htc-consultancy.de
Hamburg, 17 March 2016

Table of Content
1 Abstract 1
2 Introduction and scope of work 3
3 General market development 4
3.1 Assignment of the relevant market area 4
3.2 Development of railway markets 6
3.3 FBFL-relevant freight market segments 21
3.4 Development of main competitor road transport 27
3.5 Rail freight traffic forecast 32
4 Commercial perspective 36
4.1 Conditions of infrastructure use 36
4.2 Potential effects on operations 39
5 Disclaimer 41
List of Figures
Figure 1 Map of TEN railway corridors (2013) ..................................................................................... 5
Figure 2 Total rail freight in Denmark 1990-2014 ................................................................................ 7
Figure 3 Danish rail freight transports by types of transport 1990-2014 ............................................ 7
Figure 4 Danish rail freight transports by types of transport (Percentage) 1990-2014 ...................... 8
Figure 5 Danish cross-border rail freight transports 2000-2014 ......................................................... 9
Figure 6 Danish cross-border rail freight transports 2000-2014 ......................................................... 9
Figure 7 Danish cross-border rail freight transports 2000-2014 (selected countries) ...................... 10
Figure 8 Average distances of Danish rail freight 2000-2014 ............................................................ 11
Figure 9 Rail freight performance in Sweden 1990-2014 .................................................................. 12
Figure 10 Rail freight volume development in Sweden by segments 2005-2014 ............................. 13
Figure 11 Total rail freight volume in Sweden by main segments 2005-2014 .................................. 14
Figure 12 Total rail freight performance by main segments in Sweden 2005-2014 ......................... 14
Figure 13 Swedish cross-border rail freight volume by segments 2005-2014 .................................. 15
Figure 14 Swedish cross-border rail freight performance by segments 2005-2014 ......................... 15
Figure 15 Swedish rail transport by selected Commodities of 2008-2014 (without ore) ................. 17
Figure 16 Average transport distances for selected Swedish rail categories 2005-2014 .................. 18
Figure 17 Rail freight overall development in Germany 1994-2015 ................................................. 19
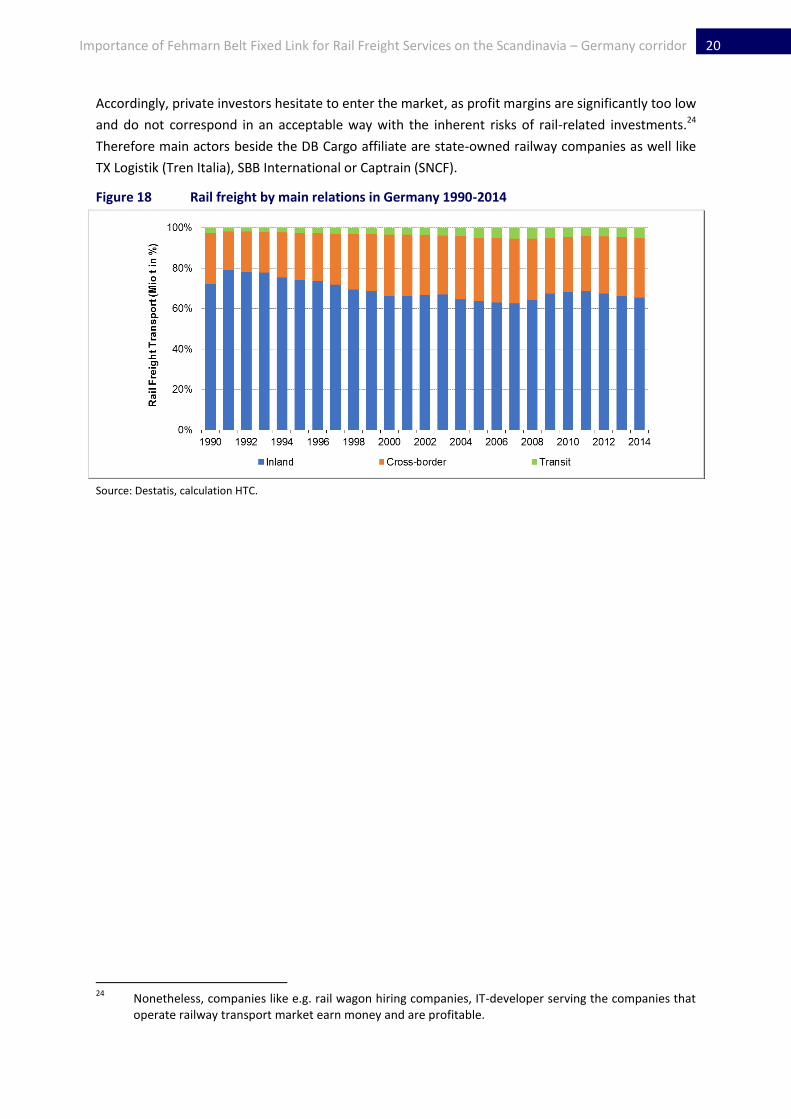
Figure 18 Rail freight by main relations in Germany 1990-2014 ....................................................... 20
Figure 19 Aggregated regional rail freight market segments 2005-2014/15 .................................... 21
Figure 20 Modal share of selected rail freight markets ..................................................................... 22
Figure 21 Aggregated international rail freight market segments 2005-2014/15 ............................ 23
Figure 22 Cross-border rail freight transport Denmark 2005-2014 ................................................... 24
Figure 23 Cross-border transports of railways in Sweden ................................................................. 25
Figure 24 Cross-border transports of railways in Norway ................................................................. 25
Figure 25 Cross-border transports of railways in Finland .................................................................. 26
Figure 26 Road freight in Denmark 1999-2014.................................................................................. 27
Figure 27 National transport of goods in Denmark by road between regions 2008-2014 ............... 28
Figure 28 Road freight transports by foreign vehicles 2000-2014 .................................................... 28
Figure 29 Road freight transport of Sweden 2000-2014 ................................................................... 29

Figure 30 Road freight transport in Germany 1990-2015 ................................................................. 30
Figure 31 FBFL traffic forecast 2025 .................................................................................................. 32
Figure 32 Rail freight performance in Denmark and Sweden (ton-Km, index 2008 = 100) ............... 33
Figure 33 Routing alternatives with cost relevant markings ............................................................. 36
List of Tables
Table 1 National rail freight volume by region 2007-2014 ................................................................ 11
Table 2 Cross-border road transport of Germany by destinations .................................................... 31
Table 3 Parameters for Danish rail network use ............................................................................... 37
Table 4 Sample calculation for alternative routings .......................................................................... 38

1 Importance of Fehmarn Belt Fixed Link for Rail Freight Services on the Scandinavia – Germany corridor
1 Abstract
Due to the ongoing discussion on the necessity of the planned Fehmarn Belt Fixed Link (FBFL) the
presented study firstly observes the development of rail based transport flows between Germany
and Scandinavia. Additionally, it provides a comparison of the future routing alternatives for railway
transportation – Jutland Route and FBFL – thereby considering commercial and operational parame-
ters. Contrary to the initial assumption of a growth perspective of doubled rail freight volume in the
near future on the relevant corridor experts currently assume that two thirds of rail freight volume
will shift from the existing Jutland Route to the FBFL at implementation stage. The static trend for
rail freight transports to and from Scandinavia indicates that the expected growth path may be too
optimistic. Since many years, the international rail freight transport to and from Denmark is declin-
ing and remains on a low level. Even though the total Danish rail freight market saw a slight increase
since the financial crisis; this was significantly driven through transit traffic. Following this develop-
ment the extension of existing infrastructure should be considered rather than building new infra-
structure.
The implementation of a rail link on Fehmarn Belt would in fact relieve the existing Jutland Route
which is especially important for the Danish rail freight transport. However, there is risk that with
the priorisation of the FBFL routing eisting bottlenecks on the Jutland Route will be eliminated at too
low priority and will not be addressed until the implementation of the FBFL. As a consequence, this
may have negative effects on the competeviness of rail freight transports. In fact, currently there are
bottlenecks on the Jutland Route which was confirmed by different market players. Due to
presented rather conservative future perspective of rail freight transports on the corridor as well as
the limited performance ability of the Jutland Route it is recommended to further verify if existing
bottlenecks should be addressed and the infrastructure should be upgraded partially following the
market development. This should include the double-track extension of rail line between Padborg
and Tinglev. As a consequence of the single-track line at current status this part of the Jutland Route
can be operated at a maximum speed of 120 kph. Additionally, ongoing construction works in order
to increase the weight capacity of the ”Rendsburger Hochbrücke”, the bridge crossing the Kiel-canal
leads to temporary blocking of the rail line on the German side of the route. Furthermore, the rail
freight transport on the existing Jutland Route is characterised by a costly operating procedure
which is a result of route profile and the given necessity to use special locomotives which are availa-
ble in limited numbers only. Alterative operating procedures such as double heading1 or pay load do
not contribute to the competiveness of rail freight transports on this corridor in a positive manner.
Facing a low-margin market environment the decision made by railway operators or logistics provid-
ers for either of the competing routing alternatives will be cost-driven. The question whether the
reduced transport time on the FBFL can be transferred into a cost reduction cannot be answered
ultimately at this stage. There is a potential for a cost advantage regarding rail freight transports on
the FBFL. However, the crucial question concerning the costs for the prospective rail line remains
open.
1 Operations with two locomotives.

2 Importance of Fehmarn Belt Fixed Link for Rail Freight Services on the Scandinavia – Germany corridor
As part of the comparative analysis calculations of rail infrastructure fees for intermodal transit traf-
fic revealed that the costs for the shorter routing are at the same level as for the existing longer
route takeing the existing infrastructure fee parameters into account. The reason for this can be
found in the environmental subsidy paid by the Danish railway provider based on tonne-kilometres
which would be lower for a shorter distance (here FBFL routing). The advantage of a faster transport
time leads to the expectation of positive effects also on the cost side. Nevertheless, the assumption
that a reduced transport distance automatically results in time and cost reduction on the same level
may be too easy. A time reduction on paper of 2-3 hours may be obsolete due to unscheduled down
times. Additionally, experts say that even transit traffic may partially remain on the existing Jutland
Route as these transports follow a running setup and optimised utilisation of equipment.

3 Importance of Fehmarn Belt Fixed Link for Rail Freight Services on the Scandinavia – Germany corridor
2 Introduction and scope of work
The Fehmarn Belt fixed link is one of the major infrastructure projects in Europe and part of the EU’s
Trans-European Transport Network (TEN-T) initiative. The link between the German island Fehmarn
and the Danish island Lolland is planned as a tunnel with a length of 18 km including a double-
tracked electrified railway line and a four-lane road. The project also includes the corresponding
road/rail hinterland connections on both, German and Danish sides. According to current planning
the beginning of project implementation is at moment planned for 2018; preliminary date of open-
ing of the full route is likely not before 2024. However, due to continuing discussions on fluctuating
cost estimations, financing gaps, and the time schedule regarding the German railway connection
increase the probability of a later implementation of the route with full capacity. Accordingly, signifi-
cant impacts on the development of transport flows will not be expected before 2025.
Discussions on the benefit of the fixed link are often driven by the expectation of increasing rail
freight volumes between Sweden and Germany due to better conditions, which improve rail opera-
tions. Following the project initiator’s arguments one of the major benefits lies in the optimisation
option, avoiding the route via Padborg respectively the access to Jutland. This optimisation may have
several dimensions (selection):
Reduced costs for railway transports due to reduced transport distance of approx. 160 km
Consequently operational benefits for railway operators such as reduced duration of round-trips,
and more efficient railcar utilisation.
In this context, certain questions and parameters need to be addressed and quantified. Among oth-
ers these include:
How did Scandinavian rail freight volumes develop in the last years?
How important is an optimisation impact through a fixed link specifically for rail freight traffic on
selected Swedish-German transport routes?
Do future rail freight transports have to avoid the route via Padborg due to predefined rules from
infrastructure managers in Germany and/or Denmark?
What are the current commercial parameters and fees for the fixed link usage by rail freight traf-
fic?
How does the avoided diversion correlate to additional infrastructure fees for the fixed link?
The study aims at presenting a standard of comparison for the importance of the reduced distance.
This transport market study describes the market environment for rail freight considering two infra-
structure options for transports between Scandinavia and Central Europe. It does not comment or
judge either of the alternatives.

4 Importance of Fehmarn Belt Fixed Link for Rail Freight Services on the Scandinavia – Germany corridor
3 General market development
The Baltic Sea region is one of the main economic areas of the European Union (EU). In terms of land
transportation (rail and road traffic) Denmark has a key role as it provides a fixed link between Swe-
den (and Norway) and the rest of Continental Europe. During the last decades this corridor was em-
powered through major infrastructure projects such as the Øresund Bridge between Sweden and
Denmark or the Great Belt (Storebælt) Bridge between the Danish islands of Funen (Fyn) and Zea-
land (Sjaelland) proving a link between the western and the eastern part of Denmark. In order to
improve the road- and rail-based connectivity of this region also on a European level the land bridge
is part of the TEN-Corridor-Concept of the EU.
3.1 Assignment of the relevant market area
The relevant geographical area primarily comprises the countries of Denmark, Sweden and Germany.
Their national economies are advanced, have a more or less direct access to the prospective FBFL.
Additionally, Finland and Norway are considered as second-tier relevant regions as these countries
will likely have only limited and long-term advantages through the FBFL.
The axis-analysis will consequently focus on the three main areas of the corridor, Denmark, Germany
and Sweden. If necessary this focus will be broadened for selected topics.
The following map shows the geographical parameters and the placement of the FBFL in context of
the EU’s long-term concept for railway corridors. In case of realisation, the FBFL will become part of
the Scandinavian-Mediterranean Corridor, which is considered to be a crucial north-south axis for
European economy.2 In the future this corridor will cross the Baltic Sea from Finland to Sweden (in-
cluding a link to Norway), will pass Germany and Austria, and will finally reach Italy respectively Mal-
ta. The corridor will link the major urban centres and ports of Scandinavia and Northern Germany
with the industrialised regions of Southern Germany, Austria and Northern Italy. Additionally, the
South of Italy shall be linked by rail as well as the island of Malta (by ferry).3
2 EU Commission, Infrastructure - TEN-T - Connecting Europe. Link: http://ec.europa.eu/ trans-
port/themes/infrastructure/ten-t-guidelines/corridors/scan-med_en.htm (28.02.2016). 3 General aim of the TEN initiative is to “provide industry, business and citizens with a fully functional
network, combining all transport modes for swift services, uniting Europe from north to south and from east to west, creating the backbone that is needed for economic growth and prosperity.” The Trans-European Transport Network, Common Progress Report of the European Coordinators, first year of im-plementation of the Core Network Corridors, April 2015, p.3. Link: http://ec.europa.eu/trans-port/themes/infrastructure/ten-t-guidelines/corridors/doc/common_progress_report.pdf (28.02.2016).

5 Importance of Fehmarn Belt Fixed Link for Rail Freight Services on the Scandinavia – Germany corridor
Figure 1 Map of TEN railway corridors (2013)
Source: EU Commission, detailed display HTC.

6 Importance of Fehmarn Belt Fixed Link for Rail Freight Services on the Scandinavia – Germany corridor
From a future perspective for the rail corridor from Germany to Scandinavia two optional routes will
be available:
1. via Flensburg – Padborg, and
2. via Lubeck – Puttgarden – Køge.
The FBFL is considered as an “additional” route to the existing corridor via Flensburg – Padborg (so
called Jutland Route) and transit rail freight transports are not expected to be shifted to FBFL com-
pletely.4 Contradictory, the general assumption at the beginning of the participatory process (“Di-
alogforum”) in Ostholstein was that rail freight volume on the corridor will roughly double and run
exclusively via FBFL. Today, common expectation is that perhaps two-thirds may be shifted to the
Belt corridor.
3.2 Development of railway markets
The analysis will comprise Denmark, Sweden and Germany. If required, aspects regarding Finland
and/or Norway will be considered, too.
3.2.1 Denmark
3.2.1.1 Rail freight market in total
Between 1990 and 2014 the overall trend for Danish rail freight transports regarding total volume is
slightly negative. Since the late 1990’s, no considerable growth of volumes can be observed. The
drop in 20095 could be quickly compensated in 2010 and further increased in 2010, but volumes
since 2011 remain on a constant level at about 8 m tonnes. Total rail freight performance developed
accordingly until 2009. Since then, it increased significantly to more than 2.5 bn ton-km in 2010 and
almost stayed at this level until 2014.
4 According to comments made by participants during the hearing concerning FBFL in Kiel at 9 Nov 2015.
5 This is most likely a consequence of the financial crisis (decreasing total transport flows in all market
segments) and trails to revitalize the trade cycle by special state-financed economic stimuli programs (strong growth of the national economy in the following two years.
7 Importance of Fehmarn Belt Fixed Link for Rail Freight Services on the Scandinavia – Germany corridor
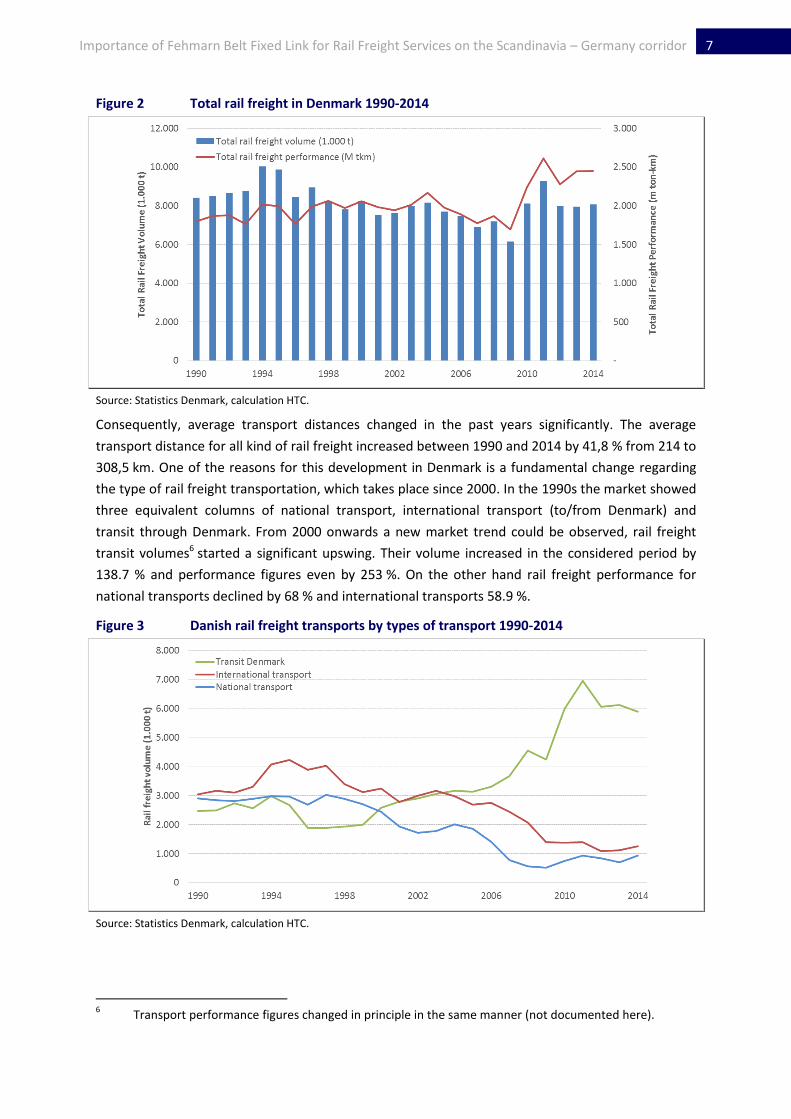
Figure 2 Total rail freight in Denmark 1990-2014
Source: Statistics Denmark, calculation HTC.
Consequently, average transport distances changed in the past years significantly. The average
transport distance for all kind of rail freight increased between 1990 and 2014 by 41,8 % from 214 to
308,5 km. One of the reasons for this development in Denmark is a fundamental change regarding
the type of rail freight transportation, which takes place since 2000. In the 1990s the market showed
three equivalent columns of national transport, international transport (to/from Denmark) and
transit through Denmark. From 2000 onwards a new market trend could be observed, rail freight
transit volumes6 started a significant upswing. Their volume increased in the considered period by
138.7 % and performance figures even by 253 %. On the other hand rail freight performance for
national transports declined by 68 % and international transports 58.9 %.
Figure 3 Danish rail freight transports by types of transport 1990-2014
Source: Statistics Denmark, calculation HTC.
6 Transport performance figures changed in principle in the same manner (not documented here).

8 Importance of Fehmarn Belt Fixed Link for Rail Freight Services on the Scandinavia – Germany corridor
Subsequently, Danish rail freight transports highly depend on transit transports, today.
Since 2011 more than 70 % of the total rail freight transport volume is transit (> 85 % of perfor-
mance). Since 2010 international transports (incl. transit) provide more than 85 % of total rail freight.
Accordingly, inner Danish rail freight volume is of negligible size, today as presented in the following
chart.7
The net effect of this structural change is neutral respectively slightly negative as total volume fig-
ures are concerned. Total rail freight volumes reduce especially since mid of the 1990ies.
The performance figures of the Danish rail freight developed in a similar way until the global finance
crisis. Since 2009 the total market (performance) increased by 44.5 % until 2014 (see 0).
Figure 4 Danish rail freight transports by types of transport (Percentage) 1990-2014
Source: Statistics Denmark, calculation HTC.
From rail freight perspective Denmark became a transit country. Subsequently, the infrastructure
priorities will follow and mainly serve foreign customers in Germany and/or Sweden.8 The type and
range of use of railways for Danish forwarders will be discussed in the following.
3.2.1.2 Rail freight cross-border transports
With regard to international (cross-border) rail freight transports9, Denmark’s railway sector (and
their customers as well) experienced a tremendous change in the last years. Since 2000, the volume
for cross-border rail freight transports declined by 61.4 % from 3.2 m tonnes in 2000 to 1.3 m tonnes
in 2014. At the same time, the performance declined in a similar manner by -67.5 % to 227 m ton-km
in 2014. It needs to be emphasised, that there is a revitalizing movement in the market since 2012.
Whether this reflects a fundamental change of the general trend can be answered finally.
7 In November 2015 a joint group of The Danish Ministry of Transport and Building and The Ministry of
Economic Affairs, Employment, Transport and Technology in Schleswig-Holstein presented the report “Transport infrastructure in the Jutland Corridor”. Link: http://www.trm.dk/~/media/files/publica-tion/english/report-danish-german-transport-commission.pdf (16.03.2016). One statement on p.22 is, international freight is the driving force of the market development and transit loses volumes since about 10 years. As shown the driving force in fact is transit segment.
8 Transit trains typically do not serve inland customers to run their export or import business.
9 Rail freight transport from foreign countries to Denmark and from Denmark to foreign countries.
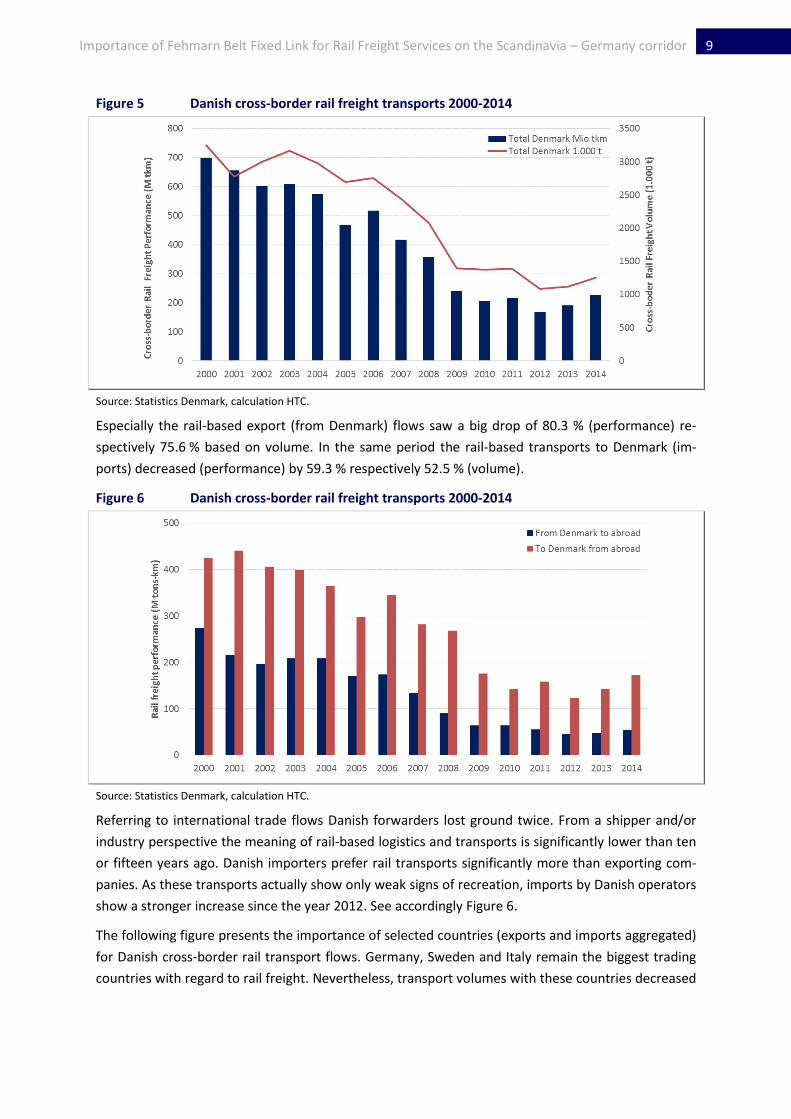
9 Importance of Fehmarn Belt Fixed Link for Rail Freight Services on the Scandinavia – Germany corridor
Figure 5 Danish cross-border rail freight transports 2000-2014
Source: Statistics Denmark, calculation HTC.
Especially the rail-based export (from Denmark) flows saw a big drop of 80.3 % (performance) re-
spectively 75.6 % based on volume. In the same period the rail-based transports to Denmark (im-
ports) decreased (performance) by 59.3 % respectively 52.5 % (volume).
Figure 6 Danish cross-border rail freight transports 2000-2014
Source: Statistics Denmark, calculation HTC.
Referring to international trade flows Danish forwarders lost ground twice. From a shipper and/or
industry perspective the meaning of rail-based logistics and transports is significantly lower than ten
or fifteen years ago. Danish importers prefer rail transports significantly more than exporting com-
panies. As these transports actually show only weak signs of recreation, imports by Danish operators
show a stronger increase since the year 2012. See accordingly Figure 6.
The following figure presents the importance of selected countries (exports and imports aggregated)
for Danish cross-border rail transport flows. Germany, Sweden and Italy remain the biggest trading
countries with regard to rail freight. Nevertheless, transport volumes with these countries decreased

10 Importance of Fehmarn Belt Fixed Link for Rail Freight Services on the Scandinavia – Germany corridor
in the past: Germany -59 %, Sweden -72.8 %, and Italy -55.4 %.10 France as well as ‘other countries’
(e.g. Switzerland -88.9 %, Austria -81.7 %, Belgium -64.9 %, Netherlands -66.7 %) lost transport vol-
ume since 2000.
Considering rail as mode of transport it has be concluded, that the catchment area of the Danish
international trade relationships has significantly changed during the last years. Apparently, rail is
not or no longer in the position to compete successfully especially with the road sector. Operational
cross-border cooperation initiatives between leading rail freight companies such as Rail Cargo Aus-
tria or SBB Cargo do not seem to meet requirements regarding competitive services requested by
Danish customers.
Figure 7 Danish cross-border rail freight transports 2000-2014 (selected countries)
Source: Statistics Denmark, calculation HTC.
3.2.1.3 Average transport distances of rail freight
Due to the described structural changes of the rail freight sector, the positioning of rail in total in the
Danish market has changed as well. Cross-border rail transports (volume) decreased by 61.4 % be-
tween 2000 and 2014. As national transports also lost importance, transit on the other hand gained
market share. Furthermore, transport distances changed in the considered period. For Denmark the
average rail freight transport distance for total rail freight was mostly below 300 km. Normally, a
level of 300 km is given as necessary to run rail freight business under profitable conditions. In 2013,
rail freight topped that threshold for the first time. In 2014, the average distance was 303.5 km.
This is basically a result of the growing meaning of transit. The expanding transit segment is the driv-
ing force of the total market as it varies at about 330 km average distance since many years. Trans-
ports by rail to North Rhine-Westphalia seem to be likely. Caused by the growing meaning of transit
also the figures for the total market increased in the past.
10
Research showed deviations between national statistics and Eurostat data.

11 Importance of Fehmarn Belt Fixed Link for Rail Freight Services on the Scandinavia – Germany corridor
Figure 8 Average distances of Danish rail freight 2000-2014
Source: Statistics Denmark, calculation HTC.
On the other hand rail-oriented imports and exports decreased and now have the lowest figures.
Regarding Germany an average distance of 175 km means that flows are likely ending or beginning
in Hamburg or Lower Saxony.
In context with the significant decline of the meaning of national rail freight logistics, a detailed ob-
servation of the distribution of inland or cross-border rail transports provides further insights on the
main regional sites of that loss.11 Referring to the following Table 1, national rail freight reached the
peak of 0.93 m tonnes handled in 2014.12 Compared with 2007 this is a rise of 27.9 %. The change of
the distribution of volumes to some respect is significant. The regions of North Jutland, Zealand and
the Capital Region suffer strong reductions of rail freight between -30.1 % and -82.7 %; in fact today
in the smallest segment there are nearly no longer rail freight operations. At the same time only the
Middle Jutland region was in the position to increase their meaning in a reasonable way. The share
was of more than two-thirds, the growth compared to 2007 about +152 % in 2014.
Table 1 National rail freight volume by region 2007-2014
(1.000 t) 2007 2008 2009 2010 2011 2012 2013 2014 2007-2014
(absolute)
2007-2014
(CAGR)
All Denmark 727 512 480 737 912 826 697 930 27.9 % 3.6 %
Capital Region
(Hovedstaden) 302 237 239 310 289 226 195 211 -30.1 % -5 %
Region Zealand
(Sjælland) 19 0 0 1 0 2 0 4 -79 % -20 %
Region South Denmark
(Syddanmark) 260 231 193 346 547 557 470 655 151.9 % 14.1 %
Region Middle Jutland
(Midtjylland) 41 4 39 68 66 40 18 43 4.9 % 0.7 %
Region North Jutland
(Nordjylland) 104 40 8 12 11 2 13 18 -82.7 % -22.2 %
Source: Statistics Denmark.
11
Due to available figures, the years before 2007 cannot be considered. 12
For comparison purpose: For Germany the relevant figure according to Destatis is 238.7 m tons (2014).
12 Importance of Fehmarn Belt Fixed Link for Rail Freight Services on the Scandinavia – Germany corridor
Assuming that the main locations of inland transports are also potential loading points for ex-
port/import commodities, the majority of these volumes will be transported via the prospective
FBFL infrastructure, if this is more attractive regarding time and cost than the Jutland route. Freight
from the Jutland region, understood as the industrial centre of Denmark, would choose the shortest
and most cost-effective way to reach the German railway network via Padborg. The FBFL so far pri-
marily focusses on transit transport and will favour railway-based export and import transports es-
pecially for players in Germany and Sweden.
3.2.2 Sweden
3.2.2.1 Rail freight market in total
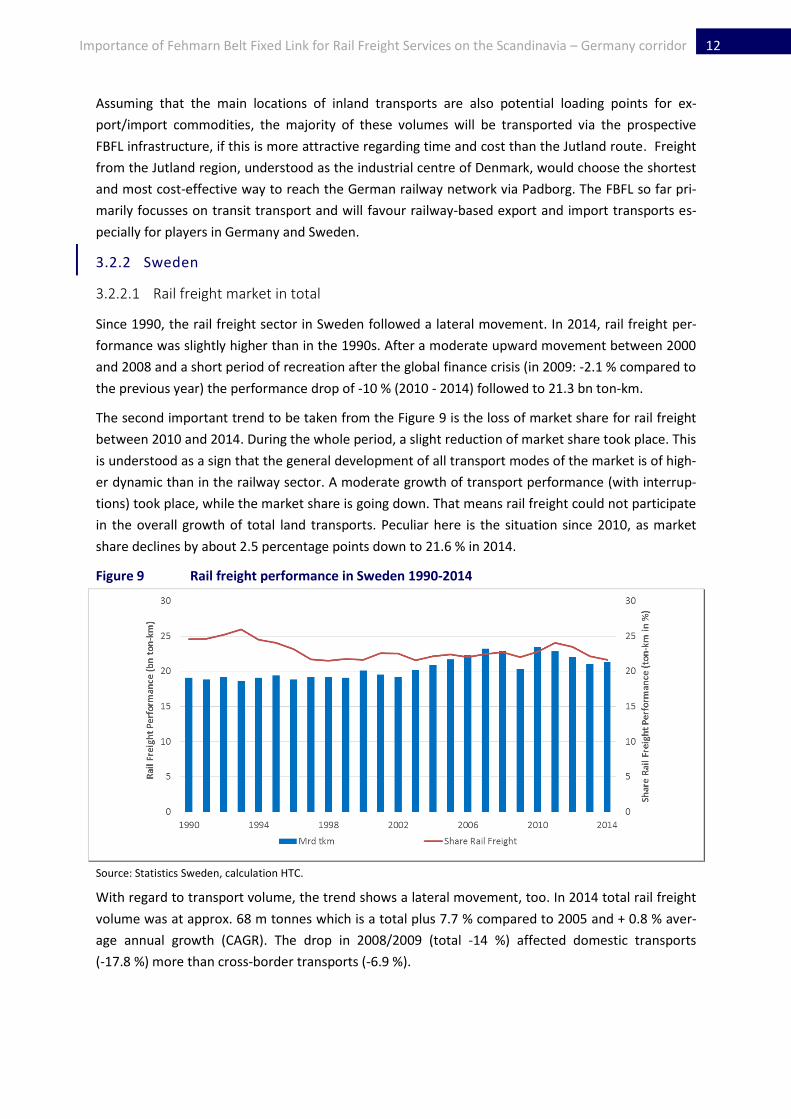
Since 1990, the rail freight sector in Sweden followed a lateral movement. In 2014, rail freight per-
formance was slightly higher than in the 1990s. After a moderate upward movement between 2000
and 2008 and a short period of recreation after the global finance crisis (in 2009: -2.1 % compared to
the previous year) the performance drop of -10 % (2010 - 2014) followed to 21.3 bn ton-km.
The second important trend to be taken from the Figure 9 is the loss of market share for rail freight
between 2010 and 2014. During the whole period, a slight reduction of market share took place. This
is understood as a sign that the general development of all transport modes of the market is of high-
er dynamic than in the railway sector. A moderate growth of transport performance (with interrup-
tions) took place, while the market share is going down. That means rail freight could not participate
in the overall growth of total land transports. Peculiar here is the situation since 2010, as market
share declines by about 2.5 percentage points down to 21.6 % in 2014.
Figure 9 Rail freight performance in Sweden 1990-2014
Source: Statistics Sweden, calculation HTC.
With regard to transport volume, the trend shows a lateral movement, too. In 2014 total rail freight
volume was at approx. 68 m tonnes which is a total plus 7.7 % compared to 2005 and + 0.8 % aver-
age annual growth (CAGR). The drop in 2008/2009 (total -14 %) affected domestic transports
(-17.8 %) more than cross-border transports (-6.9 %).

13 Importance of Fehmarn Belt Fixed Link for Rail Freight Services on the Scandinavia – Germany corridor
3.2.2.2 Rail freight cross-border transports
The following figure illustrates the lateral trend of Swedish rail logistics in general based on freight
volume as well the growing dependency of cross-border transports for total Swedish rail freight.
Annual freight volume fluctuates between 67 to 69 m tons. Between 2005 and 2014, the share of
cross-border transports increased from 39 % to 45 %, as inland market stagnates or rather declines.
According to the development during the last 10 years it cannot be surprising that Swedish railway
operator Green Cargo just announced to look for future segments of growth.13 It has to be left open
whether the intermodal share (see Figure 9) can be improved as a consequence of the intended
activities. The plan of Green Cargo is indirectly a result of the insolvency of private-owned Cargo-
link.14
Figure 10 Rail freight volume development in Sweden by segments 2005-2014
Source: Statistics Sweden, calculation HTC.
Regarding the main forms of railway operations, the official statistics also allow an illustration of
current rail production developments in Sweden. The segment of “classic” (conventional) wagonload
freight on average (2005-2014) has a share of about 42 %. The iron ore transports15 use special
equipment (inter alia rolling stock) are of similar importance; their share varies between 39 % and
44 %. The importance of intermodal transports (ISO containers, swap-bodies etc.) grew from 11 %
share in 2005 to 15 % share in 2014. The intermodal volume in 2014 was 29 m tons.16
13
See: Green Cargo plant mehr Geschäft in Norwegen, in: Deutsche Verkehrs- und Logistik-Zeitung, 22.02.2016. Green Cargo most likely chooses the same strategy as DB Cargo. Since many years, the rail freight unit of Deutsche Bahn Group fosters their international transports because of enormous pres-sure it faces on the home market. On the one hand, there is no intermodal shift to rail what is limiting growth perspective. On the other hand, in the past competitors in Germany could increase their market share significantly.
14 See: Norwegische Güterbahn Cargolink muss aufgeben, in: Deutsche Verkehrs- und Logistik-Zeitung,
15.02.2016. Cargolink complained about missing level-playing field in the Norwegian railway sector as the incumbent got subsidies several times. The regulating authority directly rejected this criticism.
15 Operated on the Luleå – Narvik line connecting Sweden and Norway. Length is 473 km. Trains are oper-
ated by MTAB, SJ and Green Cargo. 16
For comparison purpose: For Germany the relevant figure according to Destatis is 85,1 m tons (2014).

14 Importance of Fehmarn Belt Fixed Link for Rail Freight Services on the Scandinavia – Germany corridor
Figure 11 Total rail freight volume in Sweden by main segments 2005-2014
Source: Statistics Sweden, calculation HTC.
With regard to transport performance (Figure 12), the segment of wagonloads dominates the situa-
tion; an average share of more than 57 % of the rail transport performance is generated here. How-
ever, since a couple of years the share declines as intermodal services gained meaning. Because ore
transports are of short distances, the performance-related significance is significantly smaller in
comparison to volumes.
Figure 12 Total rail freight performance by main segments in Sweden 2005-2014
Source: Statistics Sweden, calculation HTC.
As shown the cross-border business is of growing significant for the players in the rail freight market.
Figure 13 illustrates the volume development here in the past. After the break in 2009 the market
grew by 41,9 % (2014). The ore transports between Norway and Sweden are considered as one of
the main columns of the Swedish rail freight market. Nearly 63 % (average) of the total cross-border
volume refers to ore transports. The importance of iron ore transports noteworthy increased be-
tween 2009 and 2014. The increase of cross-border rail freight without iron ore would have been
“only” 33,4 %. On that condition Swedish cross-border volume with relevance for transit via Den-
mark in 2014 would have been about 11,9 m tons.

15 Importance of Fehmarn Belt Fixed Link for Rail Freight Services on the Scandinavia – Germany corridor
Figure 13 Swedish cross-border rail freight volume by segments 2005-2014
Source: Statistics Sweden, calculation HTC.
Based on freight volumes, the share (average 63 %) of ore transports even increased. At the same
time, the share of volume of wagonloads declined with a recovery in 2013/14. The meaning of in-
termodal consignment increased since 2005. In 2014 this type of production contributed nearly 14 %
of total volume.
With regard to transport performance, Swedish rail operators face a continuing decline of the mean-
ing of the “classical” wagonload freight. Its share in 2005 was 61 % and 2014 42.5 %. This reduction
on one hand reflects the structural changes in the manufacturing industries like less meaning of bulk
commodities, a growing share smaller and lighter products, applying more and more concepts like
“just-in-time” or “just-in-sequence”. Here the railway sector in total still has no strategic answer and
cannot provide a competitive eligible logistical answer. Changes on the demand side are of relevance
for Sweden and it’s e.g. paper industry. One result is less “classic” wagonload transports, as e.g. pa-
per is too heavy and therefore not suitable for efficient container transports.
Figure 14 Swedish cross-border rail freight performance by segments 2005-2014
Source: Statistics Sweden, calculation HTC.

16 Importance of Fehmarn Belt Fixed Link for Rail Freight Services on the Scandinavia – Germany corridor
On the other hand, wagonloads need a dedicated and adequate rail infrastructure. Examples are
sidings, loading tracks and marshalling yards on both sides of the logistic chain. As far as wagonloads
are not operated as block trains, additional shunting yards are necessary. Here the consequences of
the market liberalisation becomes tangible.
Since the beginning of market opening process within the EU in 1991, most of the rail infrastructure
companies (today mostly part of so-called “integrated railway groups”) try to improve the commer-
cial performance of the in principle loss-making infrastructure business units.17 Optimisation in that
respect means reduction of infrastructure offered to the market.
Since the beginning of market opening process, as well most of the so-called integrated railway
companies within EU try to abolish the - commonly judged as too “expensive” - rail production
method of wagonload (groups of wagons or “single-wagon-load”). Intermodal competition here let
the margins erode enormously18, although there is no competition by other rail companies. Private
operators under the current legal conditions are in general not in the position to run their business
with the necessary commercial success. E.g. in Italy this type of business was closed down, in other
countries like Austria, Germany or Switzerland the downsizing process – more or less distinctive -
still is under way.19
Next “logical” measure, when railway transport companies had begun to optimize (reduce) their
transport services, is that the infrastructure companies as well react through the optimisation of
their network offered to all of the market players. First the optimisation of the own transports busi-
ness takes place, second step is the shutdown of rail infrastructure. One example is Germany: Since
1994 and 2015 the railway in Federal ownership shortened the network length by 19 %. About 80 %
of the siding tracks and about 50 % of the switches and crossings were dismantled.20 Nowadays only
a few of the large companies still have a direct connection with the long-distance railway network.
Many of those companies that are cut off from direct infrastructure access are lost clients for rail
services, because a shift to intermodal transport often is neither possible nor favoured.21
17
Examples for 2014: SBB, SNCF, SNCB, DBAG, ÖBB. FS. 18
The very special topic of efficiency improvements in state-owned companies here is not considered. However, it is obvious, that labor unions claim a new strategic orientation for DB Cargo. See: EVG, DB Cargo muss seine Geisterfahrt beenden! Press release 09.03.2016. Link: https://www.evg-online.org/Arbeitswelt/Gueterverkehr/.Aktuelles/16_03_09_Cargo/ (16.03.2016).
19 The railways in Eastern Europe act under specific conditions and are not mentioned here, although the
railways in Poland etc. feel a stronger need for restructuring, e.g. because of the ongoing fundamental change of national economies coming from communist system.
20 To a certain extent the reduction of rail infrastructure is consequence of structural changes of the Ger-
man national economy (reunification, migration of coal and steel industry towards Asia etc.). Another major reason to reduce rail infrastructure is the requirement to manage infrastructure - as one part of an “integrated model” with transport and infrastructure within one cooperate organisation (such as Deutsche Bahn AG) - like a “normal” resource of a company. But the railway infrastructure in fact is a monopoly. But strategic targets and commercial requirements of one of the market players are not necessarily similar to the needs of the whole market. See accordingly in detail Bahn 2015: Wettbew-erbspolitik aus der Spur?, Special expertise of the Monopolkommission appropriate § 36 AEG, 22.07.2015. Link: http://www.monopolkommission.de/images/PDF/SG/s69_volltext.pdf (26.02.2016).
21 The next step of this spiral is to be expected in the nearer future for Germany. DBAG announced to
close about 350 of the ca. 1.500 loading sites (Güterverkehrsstellen) in the coming years. See: Erster Verlust seit mehr als zehn Jahren, in: Handelsblatt, 16.03.2016, p.15.

17 Importance of Fehmarn Belt Fixed Link for Rail Freight Services on the Scandinavia – Germany corridor
Infrastructure supply and their availability in any respect has direct influence on operational activi-
ties of the railway companies. Relevant infrastructure changes in Germany of course will affect for-
eign railway cross-border transports of e.g. Sweden and Denmark. So transport market changes
there also can be attributed to infrastructural changes on the other side.
Regarding the stagnating respectively declining cross-border business of railways like in Sweden (and
Denmark as well), it has to be added, which companies today run that kind of business. Most of the
cross-border trains are operated by large and mainly state-owned companies (DB Cargo, TX Logistics
(FS), Green Cargo)22. Private railways in most cases are medium-sized and too small to run that busi-
ness alone. Accordingly, a cooperation is a last resort. International respectively cross-border rail
logistics from the market perspective are seen to be in many cases as too expensive and not of com-
petitive quality, especially in comparison to road and other modes. Correspondingly, the demand for
that kind of service is low and/or declines as already documented elsewhere in this study.
3.2.2.3 Commodities transported by rail freight
The Swedish Railway Sector has a clear and stable focus on certain commodities, which are trans-
ported year per year. According to official statistics (NST 2007) during the last years, about 45 % of
the total volume is “ore or other extracting products”. The following figure shows the distribution of
commodities (freight volume) for the remaining commodities (about 55 % of total volumes).
Figure 15 Swedish rail transport by selected Commodities of 2008-2014 (without ore)
Source: Statistics Sweden, calculation HTC.
22
As a further example on the Alpine crossing corridor, see also Lokomotion (owned by DB, Kombiverkehr, Brenner Schienentransport) or SBB Cargo International (owned by SBB, Bertschi).

18 Importance of Fehmarn Belt Fixed Link for Rail Freight Services on the Scandinavia – Germany corridor
Besides “ore” the commodity of “undefinable goods” (mainly containers and swap-bodies) is of rea-
sonable meaning (approx. 20 %), their share slightly declines since 2012. Together with the commod-
ities “products of agriculture, forestry, and fishing products” and “wood and products of wood and
cork, pulp, paper, and paper products” the most important three commodities bundle more than
60 % (approx. one third of all) of the total volume. The remaining volumes are spread on 16 catego-
ries of goods. Together with the commodity of “basic metals, fabricated metal products, except ma-
chinery and equipment”, about 80 % base on four classes of goods. The remaining 20 % come in-
clude 15 other commodities.
3.2.2.4 Average transport distances of rail freight
The market analysis for Denmark has made clear, that during the last years transit became the driv-
ing force for the general market development. In order to get a more precise picture about what is
behind the transit, the analysis of Swedish inbound and outbound rail transports is of special im-
portance, as these flows are up to a certain extent corresponding to unspecified Danish transit.
Figure 16 Average transport distances for selected Swedish rail categories 2005-2014
Source: Statistics Sweden, calculation HTC.
The average transport distance of railways in Sweden in many respect changed during the last years.
Domestic and cross-border (aggregated) since 2009 declined down to 313 km. Especially total cross-
border experience a cut of 17,4 % and still was 255,4 km in 2014. Especially in the segments of in-
termodal cross-border consignments and cross-border wagonloads a decrease took place. In 2014
cross-border wagonloads on average still run 434 km, cross-border intermodal consignments
reached a volume 423 km. Domestic wagonloads developed stable, the figure for 2014 is 394 km. In
general, the described changes seem to be not uncritical. The minimum transport distance for prof-
itable rail transports commonly is given with 300 km. Rail is judged to be the transport alternative on
long-distance hauls. The contrary seems to take place as average figures here often decline. At the
same time truck load average transport distances grow since many years.

19 Importance of Fehmarn Belt Fixed Link for Rail Freight Services on the Scandinavia – Germany corridor
3.2.3 Germany
3.2.3.1 Rail freight market in total
Since market opening in 1994 (so called “Bahnreform”) the overall rail freight market in Germany is
influenced by a slight growth path and an ongoing substitution of the state owned DB AG by private
or (mainly) other state-owned railway companies. Their market share today is above 35 %.23
The political target of “shifting more cargo to rail” in absolute terms is realized, an effective modal
shift up-to-date has not begun. The market share of rail freight was 16,74 % in 1994 and 16,70 % in
2015 (based on transport performance). In that context, it is important to point out, that the rail
freight performance slightly declines since a couple of years. In Germany, this trend reflects the re-
duced intermodal competitiveness of this industry. Marketing opening also led to new administra-
tive and documentation obligations for the stakeholders. At the same time driver shortage hit both
transport modes. The continuing low fuel prices bettered the cost position of the truck forwarders
so that freight shifts back from road to rail.
Figure 17 Rail freight overall development in Germany 1994-2015
Source: Destatis, calculation HTC.
3.2.3.2 Rail freight cross-border transports
0 illustrates for the last 25 years that the freight railway sector in total is to a certain extent of inter-
national character. A dedicated trend for more international businesses cannot be seen. The German
freight railway sector remains still focussed on inland. More than 60 % of the transport volume is
national and this share increased after the finance crisis. The share of transit slightly grew of the last
years. Some of the reasons for this situation have been already discussed above.
One argument shall added here: Competition led to extreme conditions in the German market. Non
of the railway companies earns their capital costs. Return on sale is on average less than 1 % and
reflects the missing power of the railway sector in general to enforce own prices. The rail mode in
most cases can be substituted easily by truck mode or else and this factor limits the ability to assert
rail interests.
23
See statement of the labor union, which addresses the need of a strategic reorientation of DB Cargo.
20 Importance of Fehmarn Belt Fixed Link for Rail Freight Services on the Scandinavia – Germany corridor
Accordingly, private investors hesitate to enter the market, as profit margins are significantly too low
and do not correspond in an acceptable way with the inherent risks of rail-related investments.24
Therefore main actors beside the DB Cargo affiliate are state-owned railway companies as well like
TX Logistik (Tren Italia), SBB International or Captrain (SNCF).
Figure 18 Rail freight by main relations in Germany 1990-2014
Source: Destatis, calculation HTC.
24
Nonetheless, companies like e.g. rail wagon hiring companies, IT-developer serving the companies that operate railway transport market earn money and are profitable.
21 Importance of Fehmarn Belt Fixed Link for Rail Freight Services on the Scandinavia – Germany corridor
3.3 FBFL-relevant freight market segments
After the country-wise analysis for Denmark, Sweden and Germany, a joint picture will be presented
here. This step shall illustrate the possible market framework for future infrastructure discussions.25
3.3.1.1 Overall view
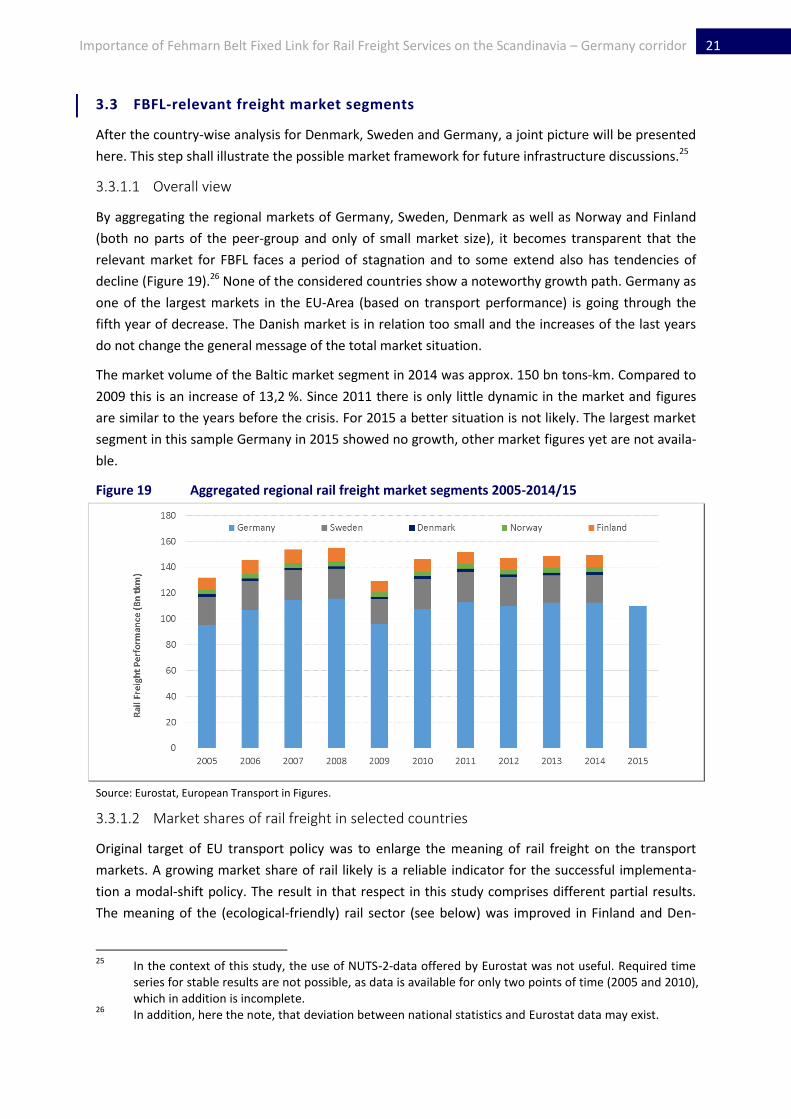
By aggregating the regional markets of Germany, Sweden, Denmark as well as Norway and Finland
(both no parts of the peer-group and only of small market size), it becomes transparent that the
relevant market for FBFL faces a period of stagnation and to some extend also has tendencies of
decline (Figure 19).26 None of the considered countries show a noteworthy growth path. Germany as
one of the largest markets in the EU-Area (based on transport performance) is going through the
fifth year of decrease. The Danish market is in relation too small and the increases of the last years
do not change the general message of the total market situation.
The market volume of the Baltic market segment in 2014 was approx. 150 bn tons-km. Compared to
2009 this is an increase of 13,2 %. Since 2011 there is only little dynamic in the market and figures
are similar to the years before the crisis. For 2015 a better situation is not likely. The largest market
segment in this sample Germany in 2015 showed no growth, other market figures yet are not availa-
ble.
Figure 19 Aggregated regional rail freight market segments 2005-2014/15
Source: Eurostat, European Transport in Figures.
3.3.1.2 Market shares of rail freight in selected countries
Original target of EU transport policy was to enlarge the meaning of rail freight on the transport
markets. A growing market share of rail likely is a reliable indicator for the successful implementa-
tion a modal-shift policy. The result in that respect in this study comprises different partial results.
The meaning of the (ecological-friendly) rail sector (see below) was improved in Finland and Den-
25
In the context of this study, the use of NUTS-2-data offered by Eurostat was not useful. Required time series for stable results are not possible, as data is available for only two points of time (2005 and 2010), which in addition is incomplete.
26 In addition, here the note, that deviation between national statistics and Eurostat data may exist.

22 Importance of Fehmarn Belt Fixed Link for Rail Freight Services on the Scandinavia – Germany corridor
mark. Finland is a non-pier country, Denmark is one of the smaller market segments and achieved
the lowest market share of the rail sector in this panel, some progress was achieved since 2008/09.27
In major countries like Germany and Sweden and as well in Norway lost meaning during the last
about five to ten years.
Figure 20 Modal share of selected rail freight markets
Source: Destatis, Eurostat, European Transport in Figures, calculation HTC.
It can be summarized, that on EU-level the market opening initiative 1991 to date commonly did not
lead to higher market shares and there are only a few countries, where market shares increased in a
noteworthy manner. Jointly responsible for that situation is the way, how in these countries the
railway reform packages had been implemented. This structural condition is of relevance for the
forecast of future rail freight transports (not only in context with FBFL). At least for the moment ap-
parently the rules of the market allow the rail freight sector only to grow to a certain extent, which is
too small to improve the intermodal market situation substantially.
27
The picture given here is not representative for the whole EU. However, there are strong signals in the markets reflecting the need of a further development of the legal and administrative framework of rail freight in total. Not only in Germany attempts take place to reinvent the sector in order to set new em-phasis to effectively focus on the customer’s needs, higher cost effectiveness, successful innovations and total market success. See Güterbahnen auf der Suche nach einem Neustart, Initiative für eine zu-kunftsfähige Infrastruktur, 23.02.2016. Link: http://www.damit-deutschland-vorne-bleibt.de/Blickpunkt/Infrastruktur-aktuell/04493/Artikel/Gueterbahnen-auf-der-Suche-nach-einem-Neustart/04211 (26.02.2016). Schienengüterverkehr braucht Innovationen für Markterfolge, Initiative für eine zukunftsfähige Infrastruktur, 23.02.2016. Link: http://www.damit-deutschland-vorne-bleibt.de/Blickpunkt/Infrastruktur-aktuell/04493/Artikel/Schienengueterverkehr-braucht-Innovationen-fuer-Markterfolge/04212 (26.02.2016). Schienengüterverkehr will produktiver werden, VDV – Verband Deutscher Verkehrsunternehmen, Pressemitteilung 27.01.2016. Link: https://www.vdv.de/pressemitteilungen.aspx?mode=detail&id=cc5aec7f-4c1e-49ae-99e7-5e1e5420edcd (26.02.2016).
23 Importance of Fehmarn Belt Fixed Link for Rail Freight Services on the Scandinavia – Germany corridor
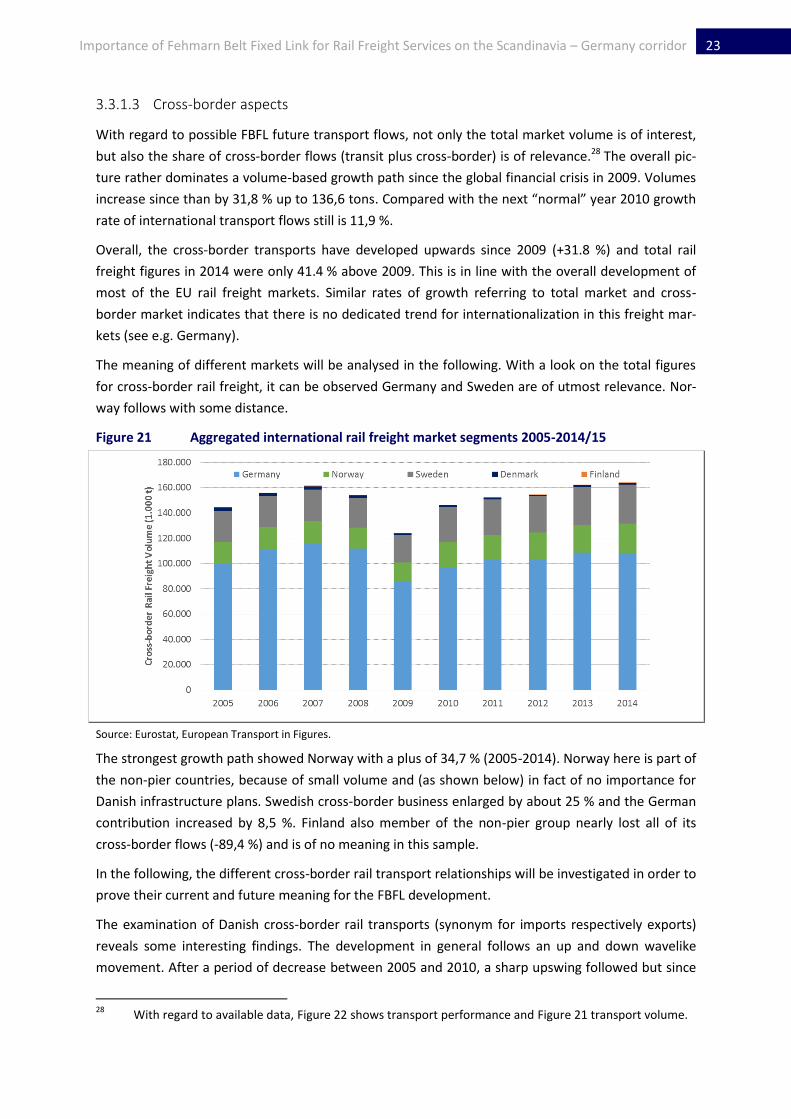
3.3.1.3 Cross-border aspects
With regard to possible FBFL future transport flows, not only the total market volume is of interest,
but also the share of cross-border flows (transit plus cross-border) is of relevance.28 The overall pic-
ture rather dominates a volume-based growth path since the global financial crisis in 2009. Volumes
increase since than by 31,8 % up to 136,6 tons. Compared with the next “normal” year 2010 growth
rate of international transport flows still is 11,9 %.
Overall, the cross-border transports have developed upwards since 2009 (+31.8 %) and total rail
freight figures in 2014 were only 41.4 % above 2009. This is in line with the overall development of
most of the EU rail freight markets. Similar rates of growth referring to total market and cross-
border market indicates that there is no dedicated trend for internationalization in this freight mar-
kets (see e.g. Germany).
The meaning of different markets will be analysed in the following. With a look on the total figures
for cross-border rail freight, it can be observed Germany and Sweden are of utmost relevance. Nor-
way follows with some distance.
Figure 21 Aggregated international rail freight market segments 2005-2014/15
Source: Eurostat, European Transport in Figures.
The strongest growth path showed Norway with a plus of 34,7 % (2005-2014). Norway here is part of
the non-pier countries, because of small volume and (as shown below) in fact of no importance for
Danish infrastructure plans. Swedish cross-border business enlarged by about 25 % and the German
contribution increased by 8,5 %. Finland also member of the non-pier group nearly lost all of its
cross-border flows (-89,4 %) and is of no meaning in this sample.
In the following, the different cross-border rail transport relationships will be investigated in order to
prove their current and future meaning for the FBFL development.
The examination of Danish cross-border rail transports (synonym for imports respectively exports)
reveals some interesting findings. The development in general follows an up and down wavelike
movement. After a period of decrease between 2005 and 2010, a sharp upswing followed but since
28
With regard to available data, Figure 22 shows transport performance and Figure 21 transport volume.
24 Importance of Fehmarn Belt Fixed Link for Rail Freight Services on the Scandinavia – Germany corridor
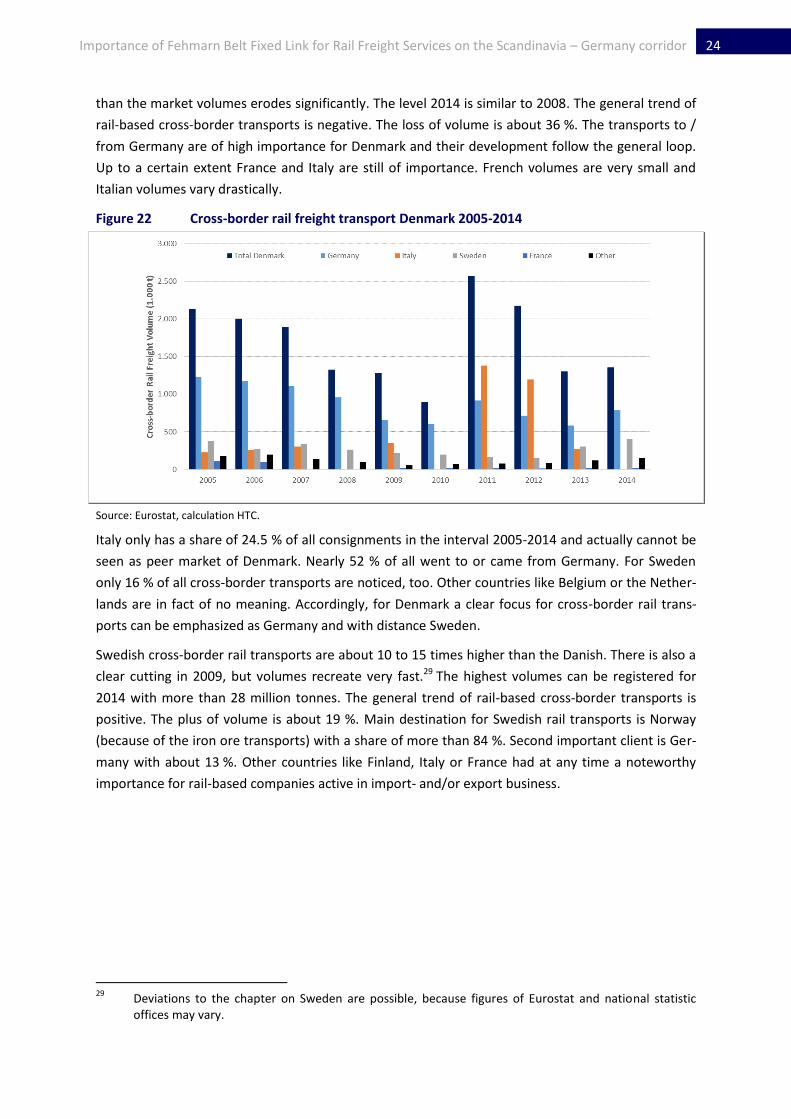
than the market volumes erodes significantly. The level 2014 is similar to 2008. The general trend of
rail-based cross-border transports is negative. The loss of volume is about 36 %. The transports to /
from Germany are of high importance for Denmark and their development follow the general loop.
Up to a certain extent France and Italy are still of importance. French volumes are very small and
Italian volumes vary drastically.
Figure 22 Cross-border rail freight transport Denmark 2005-2014
Source: Eurostat, calculation HTC.
Italy only has a share of 24.5 % of all consignments in the interval 2005-2014 and actually cannot be
seen as peer market of Denmark. Nearly 52 % of all went to or came from Germany. For Sweden
only 16 % of all cross-border transports are noticed, too. Other countries like Belgium or the Nether-
lands are in fact of no meaning. Accordingly, for Denmark a clear focus for cross-border rail trans-
ports can be emphasized as Germany and with distance Sweden.
Swedish cross-border rail transports are about 10 to 15 times higher than the Danish. There is also a
clear cutting in 2009, but volumes recreate very fast.29 The highest volumes can be registered for
2014 with more than 28 million tonnes. The general trend of rail-based cross-border transports is
positive. The plus of volume is about 19 %. Main destination for Swedish rail transports is Norway
(because of the iron ore transports) with a share of more than 84 %. Second important client is Ger-
many with about 13 %. Other countries like Finland, Italy or France had at any time a noteworthy
importance for rail-based companies active in import- and/or export business.
29
Deviations to the chapter on Sweden are possible, because figures of Eurostat and national statistic offices may vary.

25 Importance of Fehmarn Belt Fixed Link for Rail Freight Services on the Scandinavia – Germany corridor
Figure 23 Cross-border transports of railways in Sweden
Source: Eurostat, calculation HTC.
From the Norwegian perspective, Sweden is the most important partner. The Norwegian market
with 21.7 million tonnes cross-border volume is nearly as large as the Swedish railway market.
The general trend of rail-based cross-border flows is positive. The increase in volume is about 25 %.
93 % of total cross-border volumes 2005-2014 concern Sweden. Second largest partner country is
Finland with a 6.8 % share. Other countries now are of no meaning. Small shipments at the begin-
ning of the interval were not continued. Other countries have no meaning.
Figure 24 Cross-border transports of railways in Norway
Source: Eurostat, calculation HTC.
Finland is a comparably very small market segment with <50.000 t (2014). The general trend of rail-
based cross-border flows is extremely negative and the loss of volume is about -89 %. There is a
strong focus on Sweden with a share of 82 %. With 3.4 % here are only little volumes transported
between Germany and Norway. Other countries are of no importance (exception 2007).
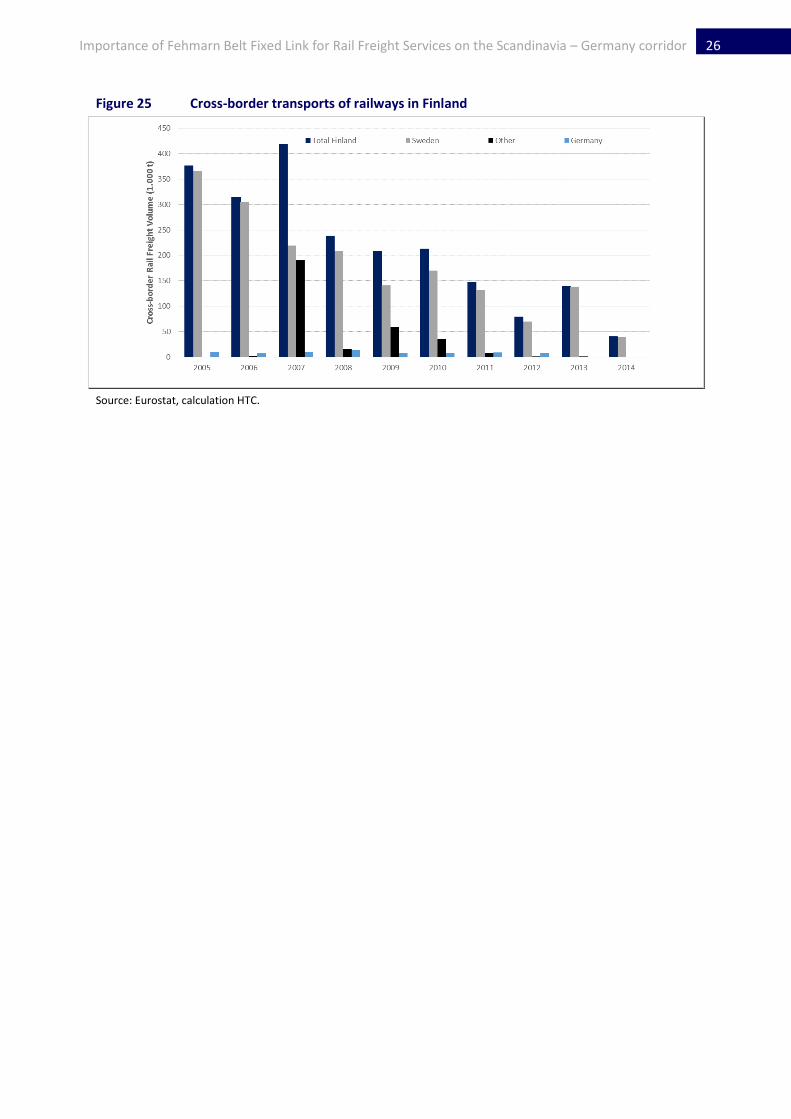
26 Importance of Fehmarn Belt Fixed Link for Rail Freight Services on the Scandinavia – Germany corridor
Figure 25 Cross-border transports of railways in Finland
Source: Eurostat, calculation HTC.

27 Importance of Fehmarn Belt Fixed Link for Rail Freight Services on the Scandinavia – Germany corridor
3.4 Development of main competitor road transport
Previous issues of the rail transport sector were discusses with a focus on the German – Swedish
corridor. In order to give some more details for a better understanding in the following some major
aspects of the main competitor of rail operators on the transport markets are breefly described in
the following.
3.4.1.1 Denmark
During the last couple of years, the Danish road transport took a path of slight decrease. The follow-
ing figures reflect the sharp impact of the global financial crisis and the overall trend since 1999. The
annual volume contracted since 2000 in total by about 17%. In 2014 the annual volume is lower than
in the years before the financial crisis. Since 2011 the freight volume stagnates by about 170 Mio t.
The yearly road transport performance grew in the mentioned interval. The number for 2014 was
nearly 13 Bln tkm. This is a plus of nearly 18% compared to 1999.
Figure 26 Road freight in Denmark 1999-2014
Source: Statistics Denmark, calculation HTC.
In contrast to the railway sector, the main competitor continuously enhanced the average transport
distance from 52 km in 1999 up to 75.6 km in 2014.
Statistics regarding the national transport of goods by road between regions give an impression
about the strongholds of the Danish producing commerce and industry.30 As presented in the follow-
ing chart, the road transport has its operational focus mainly in the western part of Denmark. The
distribution between the mentioned regions is rather robust. The four provinces of Jylland alone on
average bundle more than 64% of the road transport volume; in the provinces of Sydjylland and
Østjylland nearly 40 % of the total volumes are located. The provinces of Byen København and Kø-
benhavns omegn are of lowest meaning with a share of 4 to 6 %. Provinces like Vest- og Sydsjælland
and Fyn are of higher meaning and on average bundle some 17 to 18 % of the total road-based mar-
ket segment.
30
Here only the road freight volumes are considered, as the development of road freight performance is very similar.

28 Importance of Fehmarn Belt Fixed Link for Rail Freight Services on the Scandinavia – Germany corridor
The regional distribution of the national operational activities is insofar relevant for the future use of
the FBQ, as intermodal competition on one hand and customer’s requirements on the other hand
force the forwarders to avoid any unnecessary input of time and cost.
Figure 27 National transport of goods in Denmark by road between regions 2008-2014
Source: Statistics Denmark, calculation HTC.
Subsequently for international transports –assuming that national and international transports have
in general similar locations of appearance – the FBFL becomes interesting especially for those for-
warders, which could save time and cost by serving their clients through a use of the new crossing
building. The longer the round trip the lower the propensity that forwarders may use the FBFL.
Figure 28 Road freight transports by foreign vehicles 2000-2014
Source: Statistics Denmark, calculation HTC.
One further look on transport statistics may further lighten the international logistical integration of
the Danish national economy. In addition to the development of the national transport segment, the
figure above shows the meaning of foreign forwarders for serving consumers and producers with
imported and/or exported commodities. Most important logistic provider is Germany but its mean-

29 Importance of Fehmarn Belt Fixed Link for Rail Freight Services on the Scandinavia – Germany corridor
ing declines since 2008 forwarders of other citizenships gain importance: e. g. Poland (>+840 %) or
Lithuania (>+300 %).
As the figure illustrates, Scandinavian countries are today of minor importance for the Danish road
transport sector as their volumes declined significantly since the beginning of this century. All of
them more or less lost volumes: Norway -9 %, Sweden -76 % and Finland -100 % (since 2010 no fig-
ures reported). Also the meaning of leading maritime nations like Belgium or Netherland changed.
Since ca 2005 Belgium nearly lost nearly all meaning with sporadic annual volumes of less than
50.000 t. Also for the Netherlands, there is no positive trend to report. Since the financial crisis
2008/09 volumes went down by approx. 30%.
3.4.1.2 Sweden
The Swedish road transport sector until the beginning of the financial crisis took a slight growth path.
Volumes grew by 13 %, freight performance figures by nearly 19 %. As the following figure shows,
the downturn continued since 2013. The reduction of freight volume was larger than the loss of
freight performance. According to Eurostat 2014 was the best year in that interval. Volumes and
performance could improve significantly.
Figure 29 Road freight transport of Sweden 2000-2014
Source: Eurostat, calculation HTC.
The mean transport distance of Swedish road sector increased over the past years up 102 km 2014.
International road freight is apparently of small meaning. During the last years the volume-based
share of international transports continuously decreased from 2,3 % in 2006 to 1,7 % in 2014.31
31
See Statistisk årsbok 2014, Transporter och kommunikationer, chapter 10.14, Lastbilstransporter med svenska fordon. Link: http://www.scb.se/en_/Finding-statistics/Publishing-calendar/Show-detailed-information/?publobjid=21101+ (28.02.2016).

30 Importance of Fehmarn Belt Fixed Link for Rail Freight Services on the Scandinavia – Germany corridor
3.4.1.3 Germany
Reliable backbone of the complete German economy in the past was and still is today the truck-
based transport and logistic sector. During the last years, many challenges had to be taken by this
sector like e. g. the shortage of truck drivers, the implementation of the digital tachometer or the
rising respectively volatile development of diesel prices. Nevertheless, the transport sector with
roughly 38.000 companies repeatedly proves its outstanding capability to improve quality and save
cost for their clients at the same by providing the “better” solution for their customers in compari-
son to other transport sectors.
Moreover, since the beginning of the “Bahnreform” in 1994 there are political attempts to shift
“more traffic to rail”, but yet the results are poor. The dependence on sufficient oil supply is high
and the issue of the consequences for the environment and the society like noise, land consumption
and exhaust is still pending.
As the following figure illustrates, the truck transport volume grew since 1990 by more than 24 %. In
the mentioned interval, the transport performance rose by about 179 %.32
Figure 30 Road freight transport in Germany 1990-2015
Source: BGL, Destatis, calculation HTC.
The market share was nearly 72% in 2015. The average transport distance today is about 146 km,
the peak here was reached in 2006/07 with ca. 159 km on average.
The segment of cross-border road transport is compared to the total market figures of little meaning.
In 2013 2,8 % of the freight volume of commercial road transport and works transport was running
cross-border (3,7 % tkm).33 As far as German trucks are involved, most of the freight volume (59,3 %)
moved within Germany and abroad concerns only a few (4) federal states. In 2013 19,3 % of all re-
32
This figure can be interpreted with the background of the unification of Germany. The enlarged territo-ry led to a strong growth of freight transport performance. This unique situation today has overcome. Anyhow, the volume of annual transport services is still growing by on average 3 % per year.
33 See Verkehrswirtschaftliche Zahlen 2014/2015, edited by Bundesverband Güterkraftverkehr, Logistik
und Entsorgung (BGL), Frankfurt 2015, p.36.
31 Importance of Fehmarn Belt Fixed Link for Rail Freight Services on the Scandinavia – Germany corridor
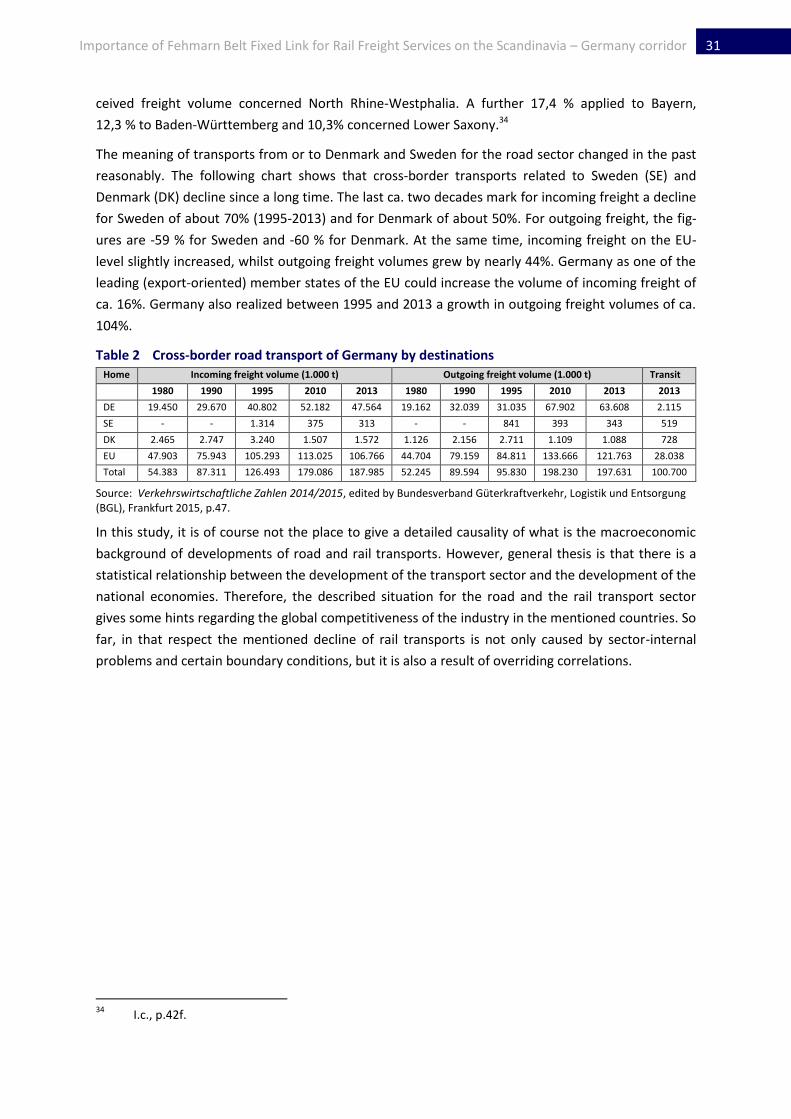
ceived freight volume concerned North Rhine-Westphalia. A further 17,4 % applied to Bayern,
12,3 % to Baden-Württemberg and 10,3% concerned Lower Saxony.34
The meaning of transports from or to Denmark and Sweden for the road sector changed in the past
reasonably. The following chart shows that cross-border transports related to Sweden (SE) and
Denmark (DK) decline since a long time. The last ca. two decades mark for incoming freight a decline
for Sweden of about 70% (1995-2013) and for Denmark of about 50%. For outgoing freight, the fig-
ures are -59 % for Sweden and -60 % for Denmark. At the same time, incoming freight on the EU-
level slightly increased, whilst outgoing freight volumes grew by nearly 44%. Germany as one of the
leading (export-oriented) member states of the EU could increase the volume of incoming freight of
ca. 16%. Germany also realized between 1995 and 2013 a growth in outgoing freight volumes of ca.
104%.
Table 2 Cross-border road transport of Germany by destinations Home Incoming freight volume (1.000 t) Outgoing freight volume (1.000 t) Transit
1980 1990 1995 2010 2013 1980 1990 1995 2010 2013 2013
DE 19.450 29.670 40.802 52.182 47.564 19.162 32.039 31.035 67.902 63.608 2.115
SE - - 1.314 375 313 - - 841 393 343 519
DK 2.465 2.747 3.240 1.507 1.572 1.126 2.156 2.711 1.109 1.088 728
EU 47.903 75.943 105.293 113.025 106.766 44.704 79.159 84.811 133.666 121.763 28.038
Total 54.383 87.311 126.493 179.086 187.985 52.245 89.594 95.830 198.230 197.631 100.700
Source: Verkehrswirtschaftliche Zahlen 2014/2015, edited by Bundesverband Güterkraftverkehr, Logistik und Entsorgung (BGL), Frankfurt 2015, p.47.
In this study, it is of course not the place to give a detailed causality of what is the macroeconomic
background of developments of road and rail transports. However, general thesis is that there is a
statistical relationship between the development of the transport sector and the development of the
national economies. Therefore, the described situation for the road and the rail transport sector
gives some hints regarding the global competitiveness of the industry in the mentioned countries. So
far, in that respect the mentioned decline of rail transports is not only caused by sector-internal
problems and certain boundary conditions, but it is also a result of overriding correlations.
34
I.c., p.42f.
32 Importance of Fehmarn Belt Fixed Link for Rail Freight Services on the Scandinavia – Germany corridor
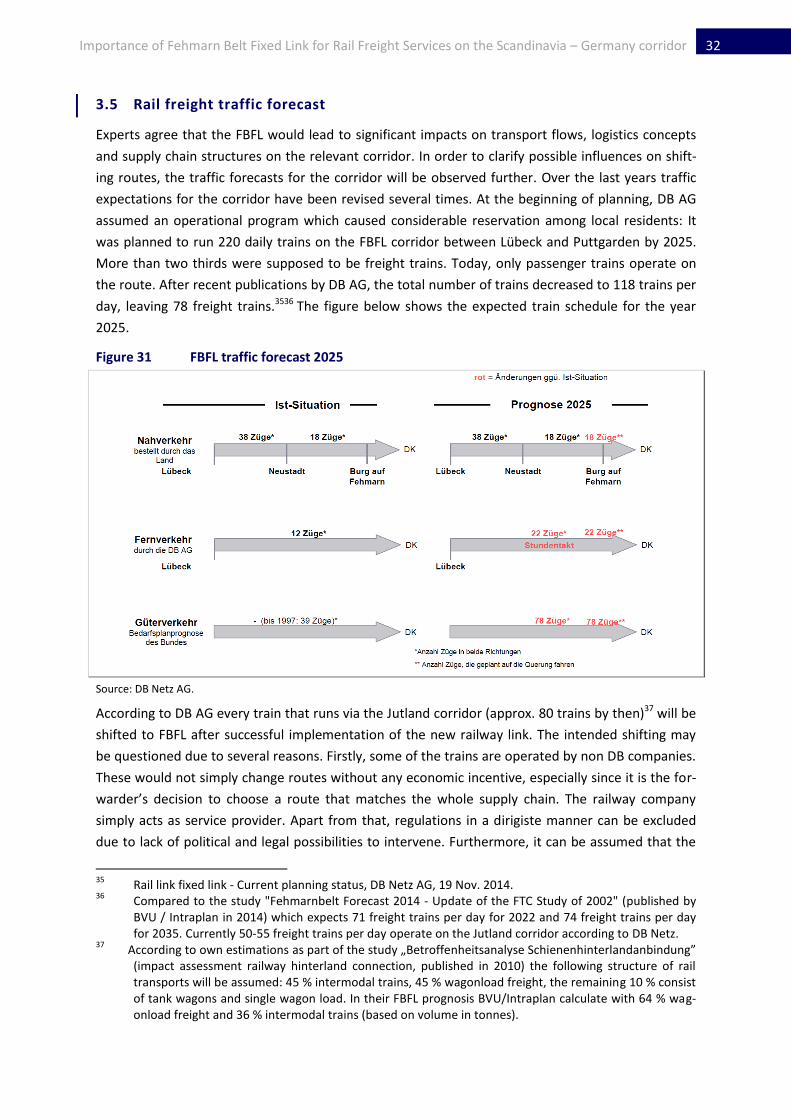
3.5 Rail freight traffic forecast
Experts agree that the FBFL would lead to significant impacts on transport flows, logistics concepts
and supply chain structures on the relevant corridor. In order to clarify possible influences on shift-
ing routes, the traffic forecasts for the corridor will be observed further. Over the last years traffic
expectations for the corridor have been revised several times. At the beginning of planning, DB AG
assumed an operational program which caused considerable reservation among local residents: It
was planned to run 220 daily trains on the FBFL corridor between Lübeck and Puttgarden by 2025.
More than two thirds were supposed to be freight trains. Today, only passenger trains operate on
the route. After recent publications by DB AG, the total number of trains decreased to 118 trains per
day, leaving 78 freight trains.3536 The figure below shows the expected train schedule for the year
2025.
Figure 31 FBFL traffic forecast 2025
Source: DB Netz AG.
According to DB AG every train that runs via the Jutland corridor (approx. 80 trains by then)37 will be
shifted to FBFL after successful implementation of the new railway link. The intended shifting may
be questioned due to several reasons. Firstly, some of the trains are operated by non DB companies.
These would not simply change routes without any economic incentive, especially since it is the for-
warder’s decision to choose a route that matches the whole supply chain. The railway company
simply acts as service provider. Apart from that, regulations in a dirigiste manner can be excluded
due to lack of political and legal possibilities to intervene. Furthermore, it can be assumed that the
35
Rail link fixed link - Current planning status, DB Netz AG, 19 Nov. 2014. 36
Compared to the study "Fehmarnbelt Forecast 2014 - Update of the FTC Study of 2002" (published by BVU / Intraplan in 2014) which expects 71 freight trains per day for 2022 and 74 freight trains per day for 2035. Currently 50-55 freight trains per day operate on the Jutland corridor according to DB Netz.
37 According to own estimations as part of the study „Betroffenheitsanalyse Schienenhinterlandanbindung”
(impact assessment railway hinterland connection, published in 2010) the following structure of rail transports will be assumed: 45 % intermodal trains, 45 % wagonload freight, the remaining 10 % consist of tank wagons and single wagon load. In their FBFL prognosis BVU/Intraplan calculate with 64 % wag-onload freight and 36 % intermodal trains (based on volume in tonnes).

33 Importance of Fehmarn Belt Fixed Link for Rail Freight Services on the Scandinavia – Germany corridor
rail connection on the German side planned as double-tracked, electrified line will not be completed
by the time of the tunnel opening.38 Accordingly, this would result in temporary diesel operations on
the Puttgarden-Lübeck section which means additional costs for changing and providing different
locomotives. Consequently, most of the rail freight services would remain on the existing Jutland
route. Moreover, 10 % of the 50-55 freight trains are designated Jutland connections (e.g. Padborg,
Taulov), anyway. Currently, DB Netz experts expect a significant lower number of trains on the FBFL
of approx. 40 trains per day. In contrast, assumptions underlying the new Federal Transport Infra-
structure Plan39 name 71 trains per day.40
Whether the FBFL can be an economic alternative, which is accepted by the market, depends on a
number of factors. It is essential for rail freight to pass the Baltic Sea Region at lowest costs to be
competitive with other modes of transport.41 If the FBFL can add value in that regard highly depends
on the fee policy for infrastructure use. It will be relevant to observe ferry companies’ reaction (es-
pecially Scandlines) and their pricing strategy. The increasing competition between the tunnel and
ferry will eventually also benefit trucking companies being able to present services at a lower price
to the market. Accordingly, the competitive situation for rail freight becomes even tougher. Conse-
quences may be reduced numbers of trains on two routing alternatives which will reduce the profit-
ability of a large infrastructure project, eventually. The question of a “bad investment” arises by
looking on the development of rail freight performance in Denmark and Sweden, which does not
follow a sustainable growth path over the last years.42
Figure 32 Rail freight performance in Denmark and Sweden (ton-Km, index 2008 = 100)
Source: National Statistics.
38
According to DB Netz the implementation of the new railway line between Lübeck and the FBFL is planned for 2025.
39 Bundesverkehrswegeplan (BVWP) published on 16 March 2016.
40 Femern A/S.
41 For rail freight is often assumed, that bypasses including longer distances "acceptable". This thesis has
to be scrutinized to the extent as the intermodal competition between transport modes, but especially intramodal competition between railway companies needs to be observed. Due to the current market situation these approaches may lead to higher costs for the train operator, so that traffic might move to other modes of transport.
42 Despite given statistical data BVU/intraplan assume annual growth rates of 1.6 % for rail freight trans-
ports between Scandinavia and Central Europe until 2035 (base year: 2011).

34 Importance of Fehmarn Belt Fixed Link for Rail Freight Services on the Scandinavia – Germany corridor
The European Commission intends to stimulate rail freight transport with a European railway net-
work including prioritised freight corridors. The Scandinavia-Germany-Italy corridor with routing via
Padborg (Jutland Route) is one part of it.
With reference to the presented forecasts for the FBFL corridor further thoughts on the plausibility
of the provided figures are necessary. The new and clearly reduced numbers are based on increased
efficiency in rail operations. Assumptions regarding the payload were raised from 350 tons per train
to 480 tons per train which means that efficiency of operations increased by 37 % within 15 years.
Compared to efficiency improvements for production processes in other industries it becomes obvi-
ous how ambitious this target really is. Furthermore, it is expected that it will take about 15 years
until the route is adopted by regions and markets (so called ramp up phase).
Moreover, the FBFL is related to projects in order to run longer trains between Scandinavia and
Germany. Since 2008, trains with a length of 835 m are operated as part of a pilot project between
Denmark and Germany (Padborg – Hamburg-Maschen). Since December 2012, these long freight
trains run in regular operations with specific transport conditions. Projects that promote operations
of even longer freight trains with lengths of up to 1,500 meters are still in the testing or pilot stage.
Generally, rail operations further developed towards a very complex system over the last decades
with multiple correlations between infrastructure and vehicles. The initial thoughts on longer trains
will affect this balance significantly. The grid for technical signal classification (signal distance, axle
counters, etc.) of the rail network typically is ≤ 750 m. That means operations of trains with a total
length of up to 750 should be set as the superior development objective on German and European
level. With reference to the current status, not only in Germany, it becomes obvious that there is still
a long way to go. In Germany for instance, only about half of the passing loops meet this require-
ment. Large parts of the rail network in Eastern parts of the country (formerly operated by Deutsche
Reichsbahn) are designed for trains with a maximum length of up to 600 m. In order to operate
trains also outside dedicated corridors comprehensive expansion measures are necessary.43 Indeed,
German infrastructure operator DB Netz AG plans with a nationwide rail network for 750 m freight
trains as basis for the Federal Transport Infrastructure Plan 201544. However, it cannot be predicted
when the implementation will be finalised.
Continuing trends relevant for the transport and logistics market make it even harder for rail freight
to compete. Service processes are increasingly driven by high frequency and a growing number of
smaller goods. The importance of lighter semi-finished and finished goods increases. Besides tradi-
tional rail freight markets with high volumes such as iron, ore, coal, oil, automotive; the rail industry
needs to focus on the new markets as well in order to grow in transport volume/performance and
potentially gain new market shares.
With reference to the FBFL it is planned to operate trains with a length of 835 m on this corridor as
well. (Danish connectivity regarding track requirements at implementation stage will allow 835 m
trains to run). This probably applies for the route to Hamburg-Maschen as a further extension to
marshalling yards Seelze and Hagen will be further examined according to DB Netz. With regard to
43
Funding gaps regarding public investments in addition to budget reductions reduce chances for a fast implementation.
44 Publication on 16 March 2016.

35 Importance of Fehmarn Belt Fixed Link for Rail Freight Services on the Scandinavia – Germany corridor
the presented challenges of extra-long freight trains on the German rail network it can be assumed
that these services will be limited to very few corridors/routes as the focus lies on a 750 m network.
Today, transport chains in European North-South traffic are often split at Baltic Sea ports in order to
generate efficient personnel deployment and optimised equipment circulation. Pre-carriage and last
mile are planned in accordance to legal driving and resting periods. Some of these routes including
transport processes have been optimised over decades and remains open how fast these logistics
concepts can be adapted.

36 Importance of Fehmarn Belt Fixed Link for Rail Freight Services on the Scandinavia – Germany corridor
4 Commercial perspective
With the planned FBFL including a tunnel with double tracked railway line the transport distance for
transit traffic between Germany and Sweden will decrease by 160 km. Today, the between the Rhine
Ruhr area and Malmö (approx. 900 km) is between 15 and 18 hours depending on the availability of
time slots and potential down times. With the given transport time (average speed of 50-60 kph) the
potential time saving with the FBFL would be 2-3 hours. Whether the time saving can be transferred
into a cost benefit depends on time tables (availability of slots) and the ability of rail companies to
further optimise their round trips and consequently reduce capital costs for locomotives and wagons.
4.1 Conditions of infrastructure use
The fees for infrastructure use are a crucial part for rail operations. In order to quantify potential
cost savings with reduced distance the two routes were calculated according to current parameters.
Figure 33 Routing alternatives with cost relevant markings
Source: HTC based on Banedanmark.

37 Importance of Fehmarn Belt Fixed Link for Rail Freight Services on the Scandinavia – Germany corridor
Infrastructure fees for Danish rail network use the follow key parameters which are listed in the ta-
ble below.
Table 3 Parameters for Danish rail network use45
DKK (EURO)46
Kilometre charge (per km) 4.80 (0.64)
Bridge tariff (per train): Great Belt 6,337.23 (849.28)
Bridge tariff (per train): Øresund47 2,592.99 (347.50)
Environmental subsidies (per tonne-kilometre)48 0.0138 (0.0018)
Source: Banedanmark.
Environmental subsidies as part of the infrastructure fees are granted by the Danish rail network
provider Banedanmark (BDK). These subsidies apply to all domestic trains, transit and international
intermodal trains, and international wagonload freight trains. The amount is based on tonne-
kilometre, whereas the net weight49 is taken into account and the bridges are not included into cal-
culation. Due to bottlenecks and congestions infrastructure fees previously also included capacity
charges for certain areas and railway lines50. These do not apply anymore. However, it can be as-
sumed that these surcharges have been included into the basic kilometre charges which used to be
at a much lower level (2.19 DKK / 0.29 € per km).
According to current parameters the following cost calculation aims at providing a comparison of
potential infrastructure fees for the use of Danish railway network on the two potential transit rout-
ings, Jutland (via Padborg) and FBFL (via Puttgarden/Rødby) from Germany towards the Danish-
Swedish border. Therefore it will be assumed that the tariff for the FBFL crossing which is not indi-
cated yet will be at the same level as the crossing of the Great Belt Bridge.
45
Net prices excluding 25 % VAT. 46
1 € = 7.46191 DKK (22 Feb 2016). 47
“In addition to which operators will be charged the Swedish tariff for carriage on the Swedish stretch of the bridge.” see: http://uk.bane.dk/visArtikel_eng.asp?artikelID=1146.
48 “The total deduction must not exceed 50 per cent of the total sales price ex. VAT for the transport as
stated on the invoice.” see: http://uk.bane.dk/visArtikel_eng.asp?artikelID=1146. 49
Excluding wagon and locomotive, including the transport box (ISO container, swap body, trailer) for intermodal trains.
50 These included the following railway lines: Copenhagen Airport, Kastrup – Kalvebod, Hvidovre Fjern -
Høje Taastrup, Vojens – Vamdrup.
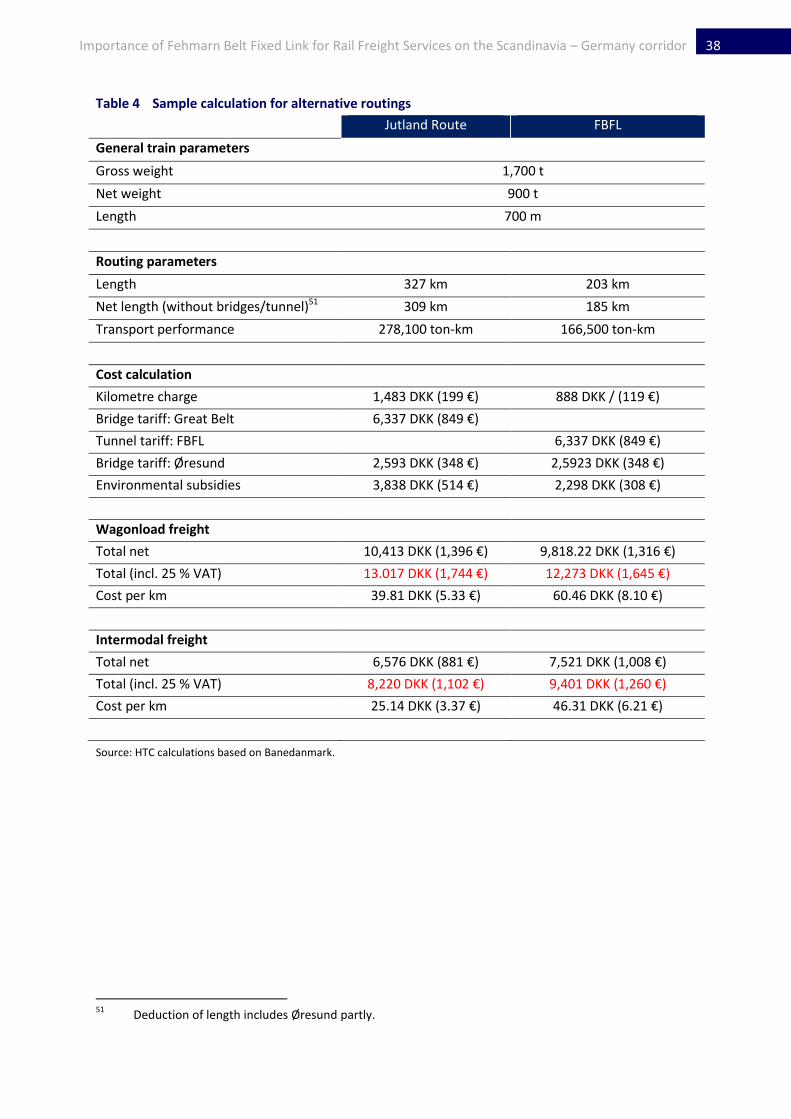
38 Importance of Fehmarn Belt Fixed Link for Rail Freight Services on the Scandinavia – Germany corridor
Table 4 Sample calculation for alternative routings
Jutland Route FBFL
General train parameters
Gross weight 1,700 t
Net weight 900 t
Length 700 m
Routing parameters
Length 327 km 203 km
Net length (without bridges/tunnel)51 309 km 185 km
Transport performance 278,100 ton-km 166,500 ton-km
Cost calculation
Kilometre charge 1,483 DKK (199 €) 888 DKK / (119 €)
Bridge tariff: Great Belt 6,337 DKK (849 €)
Tunnel tariff: FBFL 6,337 DKK (849 €)
Bridge tariff: Øresund 2,593 DKK (348 €) 2,5923 DKK (348 €)
Environmental subsidies 3,838 DKK (514 €) 2,298 DKK (308 €)
Wagonload freight
Total net 10,413 DKK (1,396 €) 9,818.22 DKK (1,316 €)
Total (incl. 25 % VAT) 13.017 DKK (1,744 €) 12,273 DKK (1,645 €)
Cost per km 39.81 DKK (5.33 €) 60.46 DKK (8.10 €)
Intermodal freight
Total net 6,576 DKK (881 €) 7,521 DKK (1,008 €)
Total (incl. 25 % VAT) 8,220 DKK (1,102 €) 9,401 DKK (1,260 €)
Cost per km 25.14 DKK (3.37 €) 46.31 DKK (6.21 €)
Source: HTC calculations based on Banedanmark.
51
Deduction of length includes Øresund partly.

39 Importance of Fehmarn Belt Fixed Link for Rail Freight Services on the Scandinavia – Germany corridor
Key findings:
- Wagonload freight: costs for Jutland Route are higher than for FBFL routing
- Intermodal trains: costs for shorter route are higher than for Jutland due reduced environmental
subsidies.
The calculation of infrastructure fees on the German rail network follows a different logic. Depend-
ing on the route class the price increases with increased distance. Subsidies for rail infrastructure use
like in Denmark do not exist in Germany. It can be assumed that a reduced distance will lead to a
reduction of costs.52
4.2 Potential effects on operations
Generally, market players describe the capacity on the Jutland Route as sufficient by. Following the
Danish network operator no major bottlenecks currently exist. However, a partly limited infrastruc-
ture or requirements that increase complexity for rail operations do exist as the following aspects
show space for optimisation. At the same time track availability during peak times e.g. during night53
like on other corridors is.
Great Belt Bridge:
The Great Belt Bridge with a length of 18 km opened in 1998 links East and West Denmark. Due to
the high gradient the crossing of the Great Belt Bridge with maximum capacity (max. 2,300 tons54)
requires the use of six axle locomotives. These locomotives were built only to cross the Great Belt
Bridge and are available at a limited number55 only. Alternative ways of operations include the use of
two locomotives at the same time, so called double heading or operations of train at lower capacity.
Both forms would lead to a decreased cost-benefit ratio. Intermodal trains which are usually lighter
(approx. 1,700 tons) can be operated with usual locomotives (e.g. 185 series).
Tinglev-Padborg:
The route between Tinglev and Padborg is single tracked and consequently limited to a speed of 120
kph.
Rendsburger Hochbrücke (bridge crossing the Kiel canal):
The bridge crossing the Kiel Canal was built in 1913 and is affected by ongoing construction works as
it needs to expanded for high weights which ultimately enables two trains to pass the bridge at the
same time. While constructions the bridge is closed Sunday between 01:00-07:00 am.
52
Trassenpreisinformationssystem (TPS) DB Netz AG. 53
Many companies prefer to operate trains during night with departure in the evening and arrival in the morning in order to meet their customer’s requirements regarding opening hours.
54 Applies to wagonload freight, especially for 835 m to/from Hamburg.
55 13 locomotives type DSB EG currently operate.

40 Importance of Fehmarn Belt Fixed Link for Rail Freight Services on the Scandinavia – Germany corridor
Rail knot Hamburg:
Rail transports to and from Scandinavia usually pass Hamburg and its rail infrastructure. Rail traffic
around Hamburg can be described as highly condensed. An additional rail corridor would automati-
cally lead to a higher utilisation of the Hamburg-Lübeck route and the rail infrastructure in Hamburg
itself. As part of the rail infrastructure on the German side of the FBFL the following projects are
planned:
Double tracked railway line and electrification Lübeck-Puttgarden, Extension or new Fehmarnsund Bridge, Extension route Hamburg-Lübeck: HH-Hasselbrook-Bargteheide („S4-Ost“).
Already existing:
Double tracked expansion of the Hamburg Rothenburgsort – Hamburg Hornroute (vmax = 80 km/h),
Electrification of Hamburg – Lübeck / Lübeck-Travemünde (vmax = 160 km/h), and Double tracked expansion between Schwartau-Waldhalle and Lübeck-Kücknitz.
Undoubted there are bottlenecks on the Jutland Route. It is recommended that the Jutland route
and its existing rail infrastructure need to be examined further in order to identify necessary
measures to increase capacity and eliminate bottlenecks. It can be assumed that the extension of
existing infrastructure is more cost effective than building new infrastructure.
Scandinavia is a well-developed market with no new potentials in terms of transport growth. Inter-
modal shifting will be influenced by the pricing strategies56 of the different market players. Further
modal shifting will remain a matter of speculation. It can be assumed that besides rail transports
from the existing Jutland Route ferry transports via the Baltic Seaports (incl. train ferry57) as well as
feeder connections to/from the German North Sea ports Hamburg and Bremerhaven may be affect-
ed. For the Baltic Seaports the question arises how accompanied and unaccompanied transport
flows will develop.
56
With low oil prices the market sees trucking companies with aggressive prices (0,50 €/km). 57
According to latest research Stena Line is the only company that still operates train ferries to from Ger-many, on their Rostock-Trelleborg service. The Baltic Port of Sassnitz used to be a strong train ferry port but since demand declined the service was stopped.
41 Importance of Fehmarn Belt Fixed Link for Rail Freight Services on the Scandinavia – Germany corridor
5 Disclaimer
This report was prepared by HTC Hanseatic Transport Consultancy on behalf of Naturschutzbund
Deutschland (NABU) – Landesverband Hamburg e. V. The provided information and estimations of
this report are result of a joint project and does not reflect the opinions of the involved companies.
HTC made huge efforts to use latest releases of statistical data as well as relevant, precise, and cur-
rent information. HTC notwithstanding cannot take any responsibility for liability of the results of
this report, unavoidable mistakes or omissions and the correctness of cited sources.