Embed Size (px)
Citation preview
Better Crops, Better Environment … through Science
Importance of Phosphorus in Plant and Human Nutrition
The Role of Fertilizer in Global Food Security and
“World Phosphate Reserves and Resources” Report Release
Wednesday, September 22, 2010Center for Strategic & International Studies
Terry Roberts, PhDPresident, IPNI
International Plant Nutrition Institute
• IPNI is a not-for-profit, scientific organization
– established in 2007 from the Potash Phosphate Institute (PPI)
– Agronomic programs in Africa, China, India, Eastern Europe & Central Asia, Middle East, Oceania, North and South America
• We provide a unified, scientific voice for the world’s fertilizer industry; independent, but scientifically credible
The mission of IPNI is to develop and promote scientific information about the responsible management of plant nutrition for the benefit of the human family
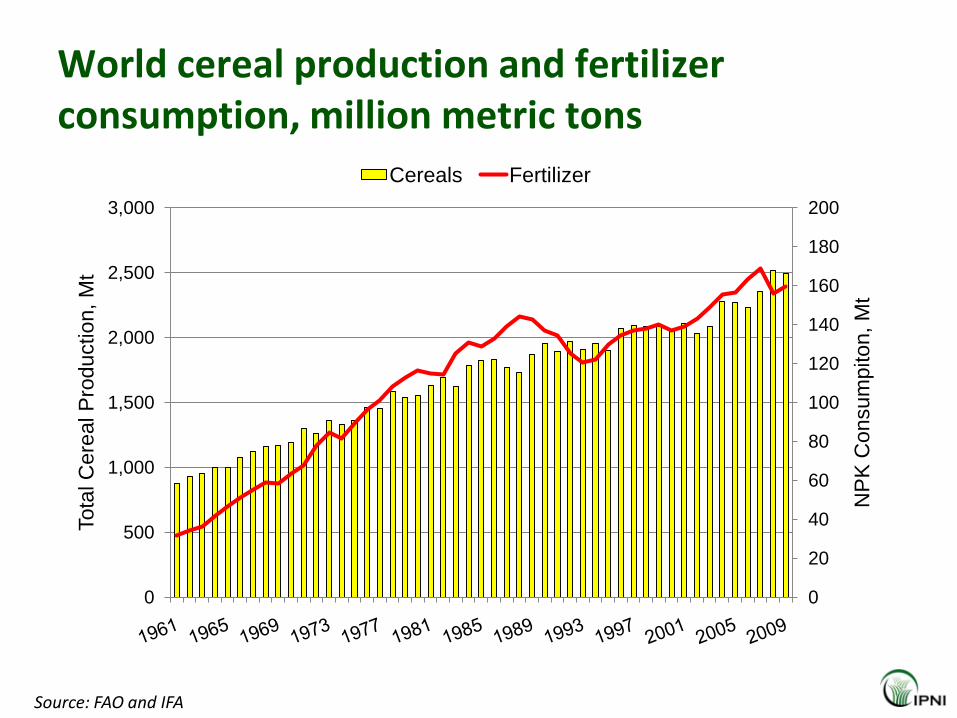
World cereal production and fertilizer consumption, million metric tons
0
20
40
60
80
100
120
140
160
180
200
0
500
1,000
1,500
2,000
2,500
3,000
NP
K C
onsum
piton,
Mt
To
tal C
ere
al P
rod
uctio
n,
Mt
Cereals Fertilizer
Source: FAO and IFA
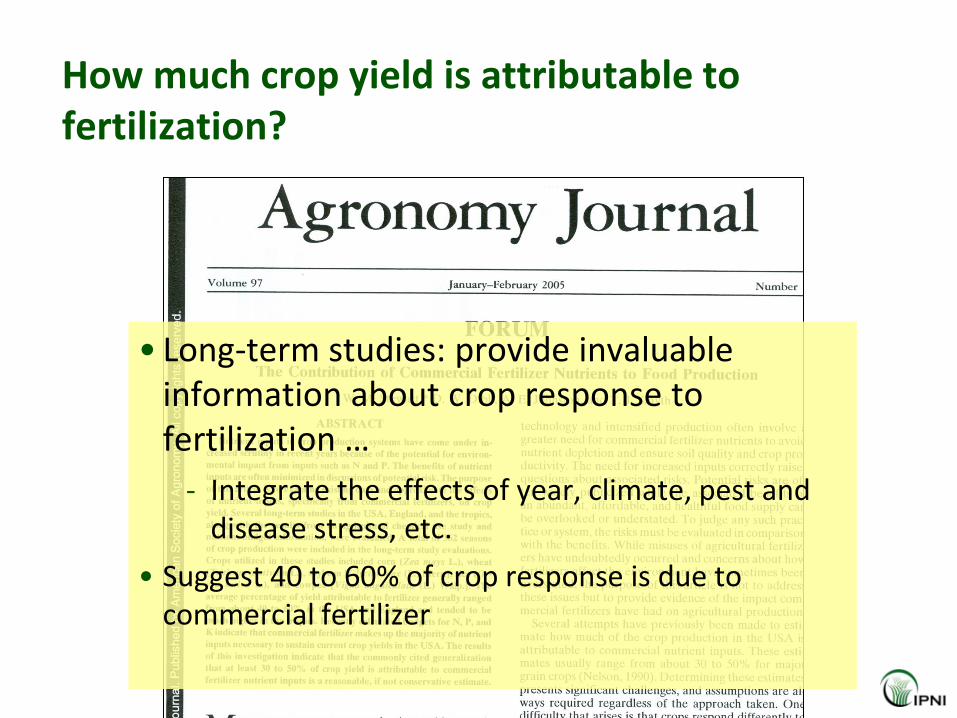
How much crop yield is attributable to fertilization?
• Long-term studies: provide invaluable information about crop response to fertilization …
- Integrate the effects of year, climate, pest and disease stress, etc.
• Suggest 40 to 60% of crop response is due to commercial fertilizer
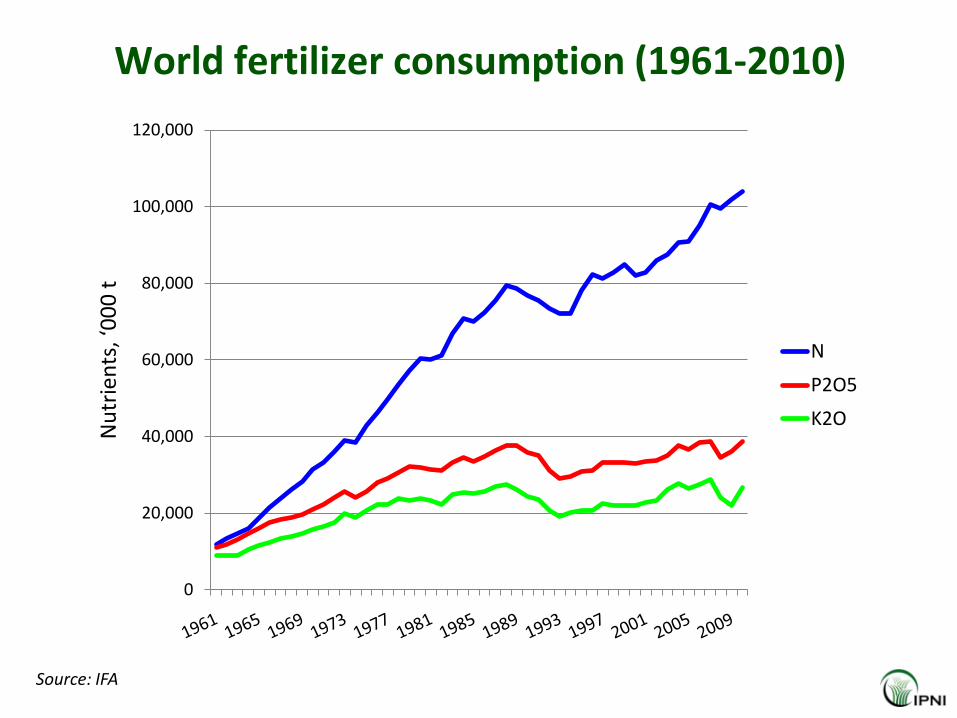
World fertilizer consumption (1961-2010)
0
20,000
40,000
60,000
80,000
100,000
120,000N
utr
ien
ts, ‘
00
0 t
N
P2O5
K2O
Source: IFA
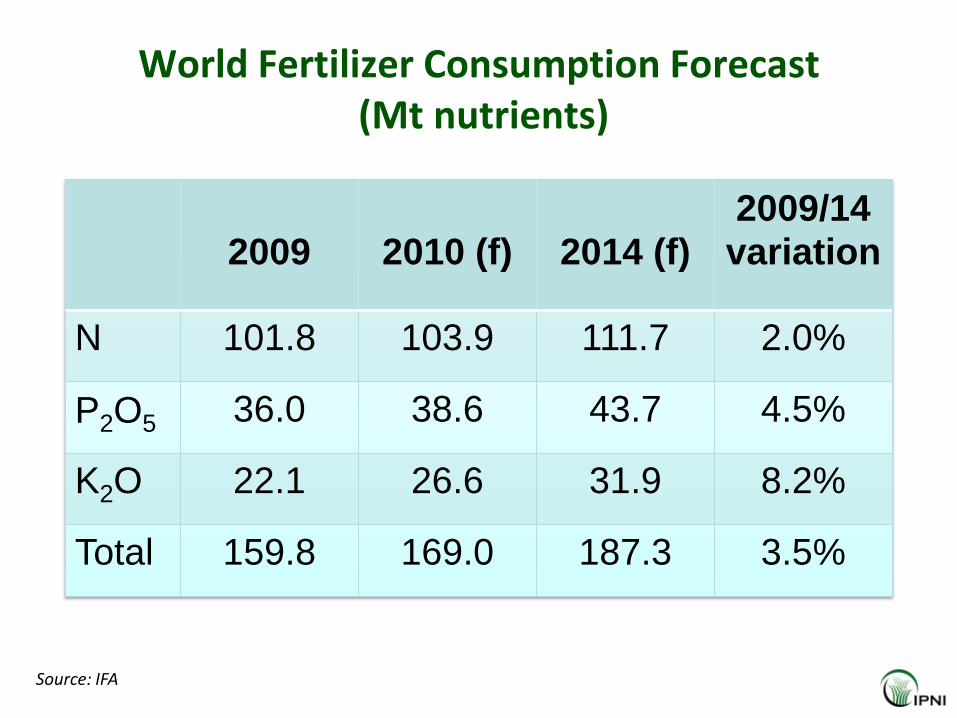
World Fertilizer Consumption Forecast(Mt nutrients)
2009 2010 (f) 2014 (f)2009/14 variation
N 101.8 103.9 111.7 2.0%
P2O5 36.0 38.6 43.7 4.5%
K2O 22.1 26.6 31.9 8.2%
Total 159.8 169.0 187.3 3.5%
Source: IFA
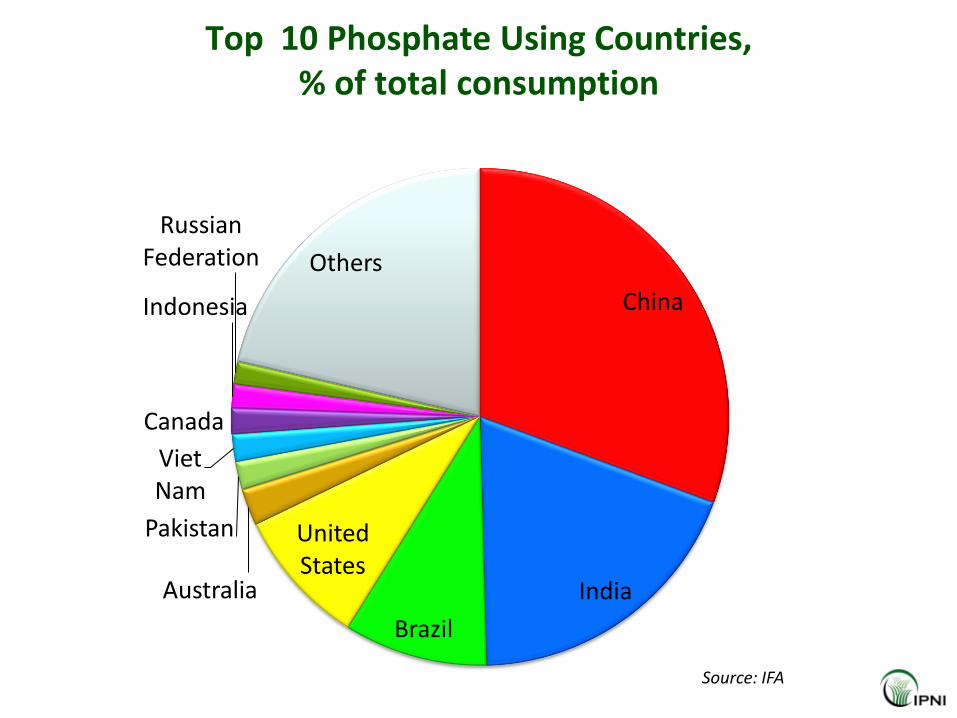
Top 10 Phosphate Using Countries, % of total consumption
China
India
Brazil
United States
Australia
Pakistan
Viet Nam
Canada
Indonesia
Russian Federation Others
Source: IFA
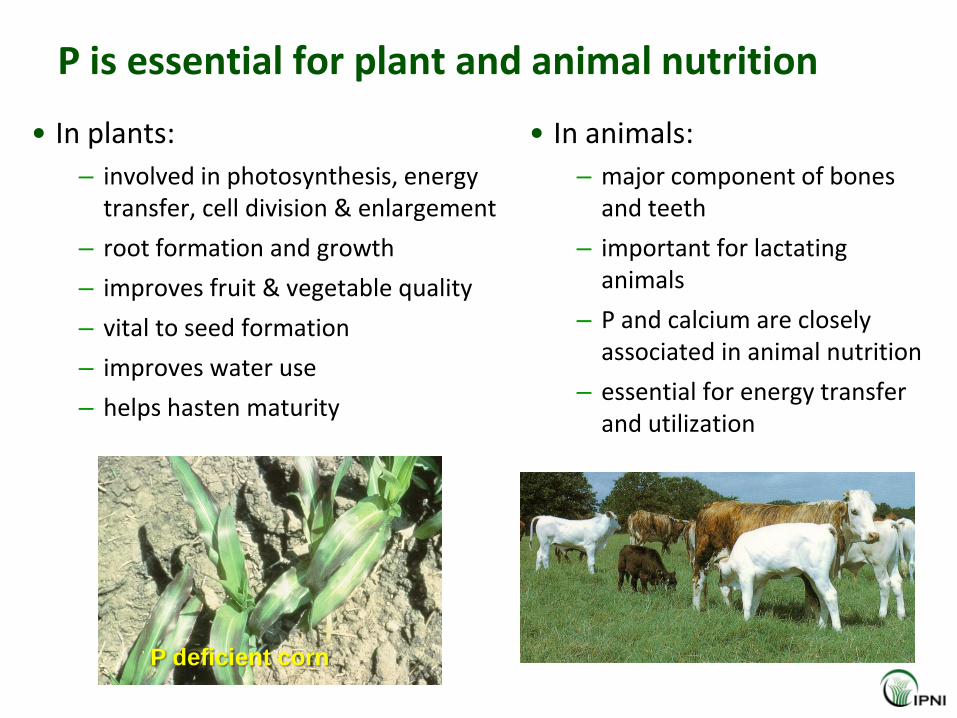
P is essential for plant and animal nutrition
• In plants:
– involved in photosynthesis, energy transfer, cell division & enlargement
– root formation and growth
– improves fruit & vegetable quality
– vital to seed formation
– improves water use
– helps hasten maturity
P deficient corn
• In animals:
– major component of bones and teeth
– important for lactating animals
– P and calcium are closely associated in animal nutrition
– essential for energy transfer and utilization
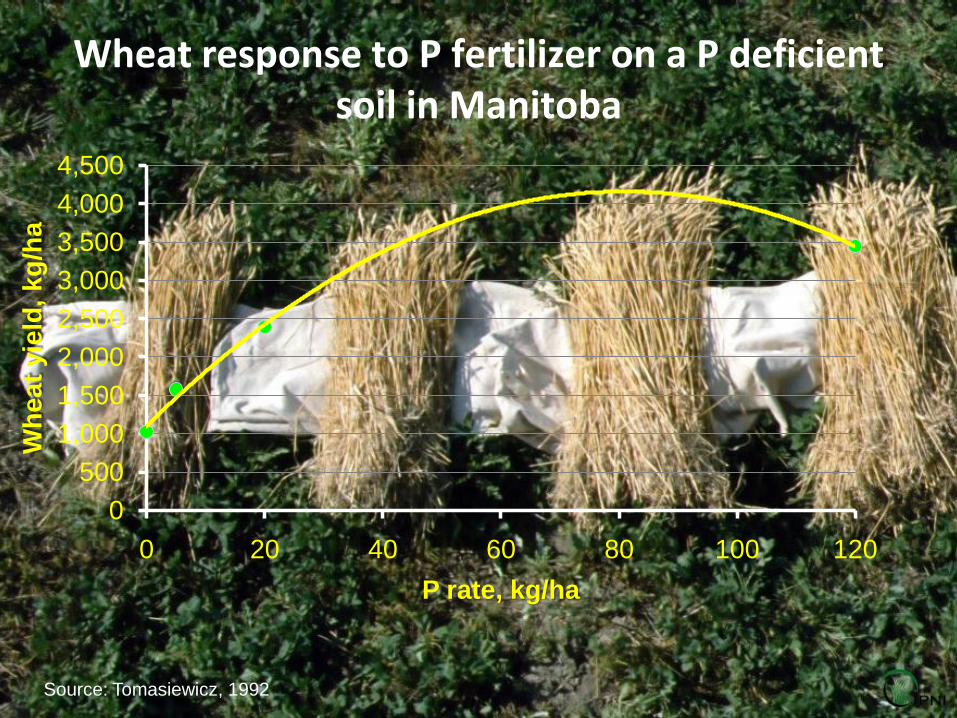
Wheat response to P fertilizer on a P deficient soil in Manitoba
0
500
1,000
1,500
2,000
2,500
3,000
3,500
4,000
4,500
0 20 40 60 80 100 120
Wh
ea
t yie
ld,
kg
/ha
P rate, kg/ha
Source: Tomasiewicz, 1992
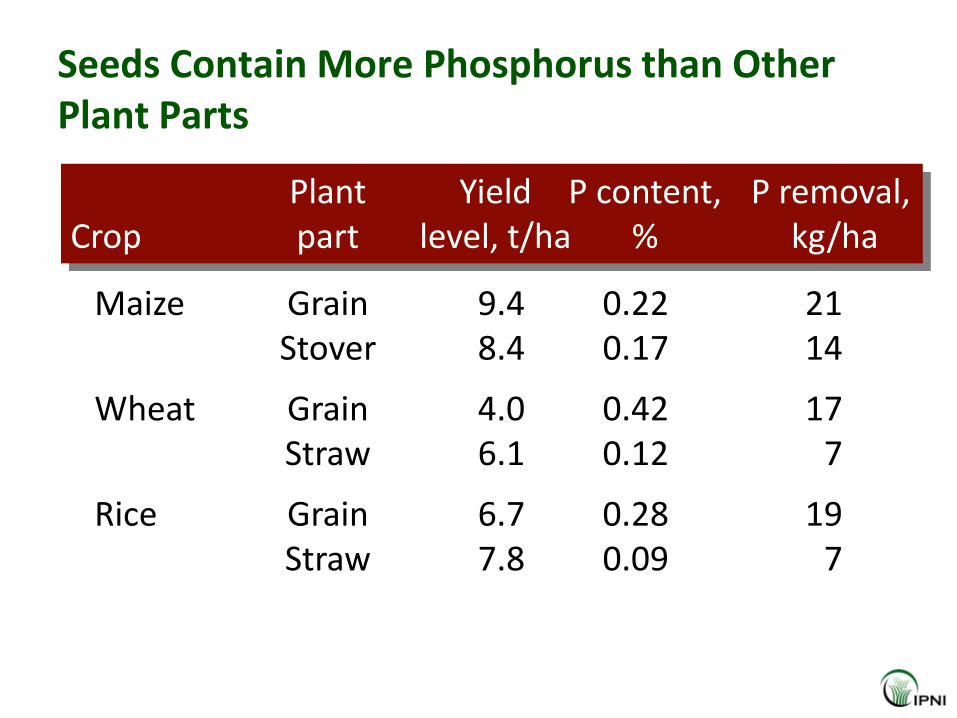
Seeds Contain More Phosphorus than Other Plant Parts
Plant Yield P content, P removal,Crop part level, t/ha % kg/ha
Maize Grain 9.4 0.22 21Stover 8.4 0.17 14
Wheat Grain 4.0 0.42 17Straw 6.1 0.12 7
Rice Grain 6.7 0.28 19Straw 7.8 0.09 7
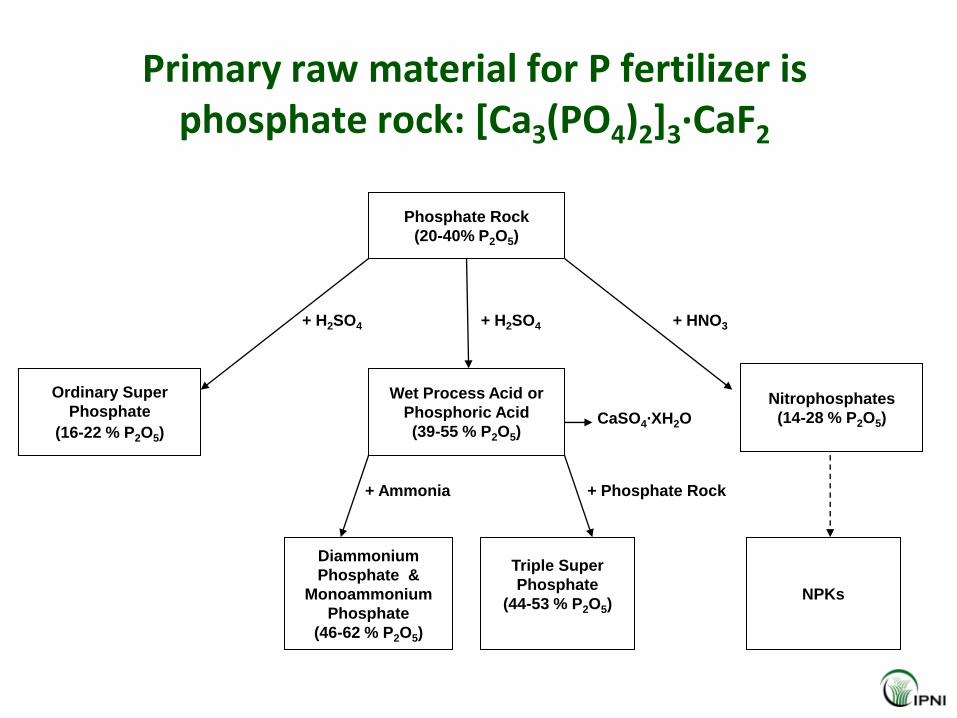
Primary raw material for P fertilizer is phosphate rock: [Ca3(PO4)2]3·CaF2
Phosphate Rock
(20-40% P2O5)
Wet Process Acid or
Phosphoric Acid
(39-55 % P2O5)
Ordinary Super
Phosphate
(16-22 % P2O5)
Nitrophosphates
(14-28 % P2O5)
Diammonium
Phosphate &
Monoammonium
Phosphate
(46-62 % P2O5)
Triple Super
Phosphate
(44-53 % P2O5)NPKs
CaSO4·XH2O
+ H2SO4+ H2SO4 + HNO3
+ Phosphate Rock+ Ammonia
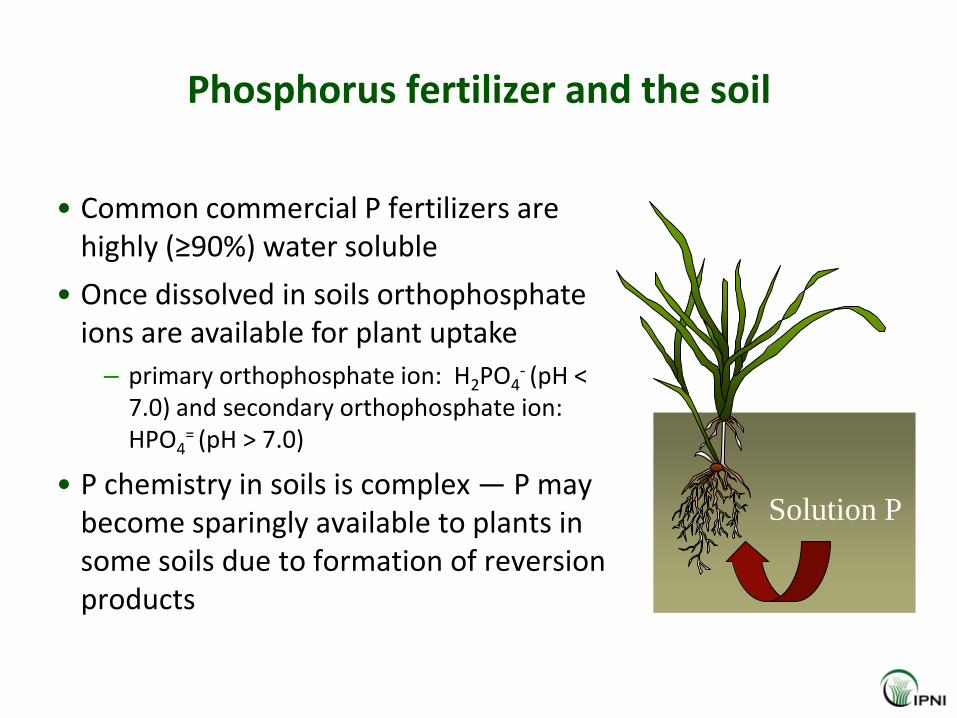
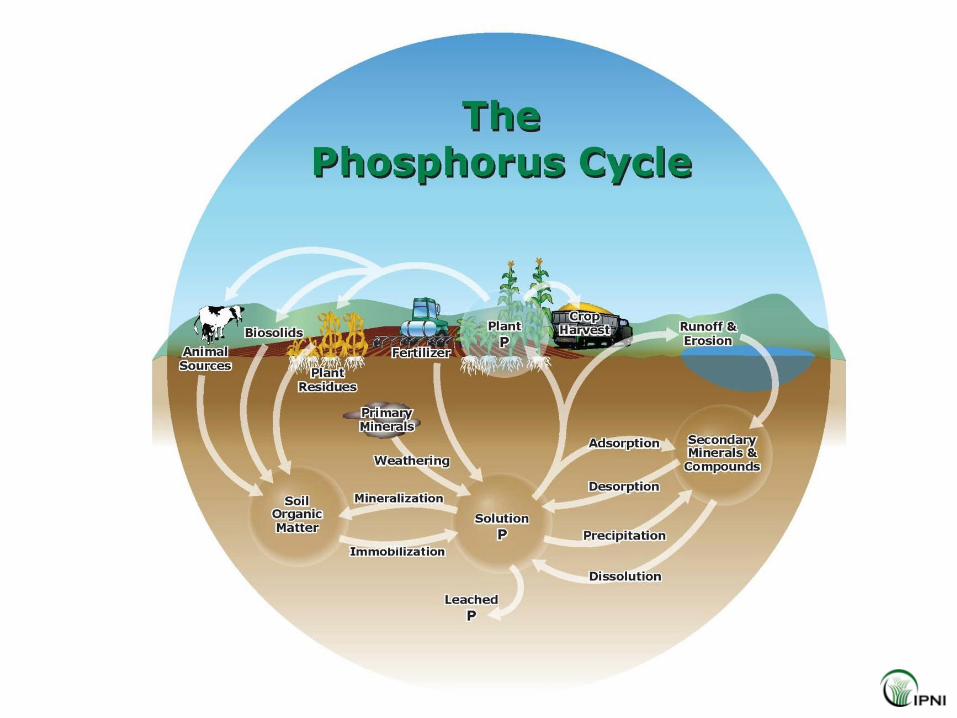
Phosphorus fertilizer and the soil
• Common commercial P fertilizers are highly (≥90%) water soluble
• Once dissolved in soils orthophosphate ions are available for plant uptake
– primary orthophosphate ion: H2PO4- (pH <
7.0) and secondary orthophosphate ion: HPO4
= (pH > 7.0)
• P chemistry in soils is complex — P may become sparingly available to plants in some soils due to formation of reversion products
Solution P
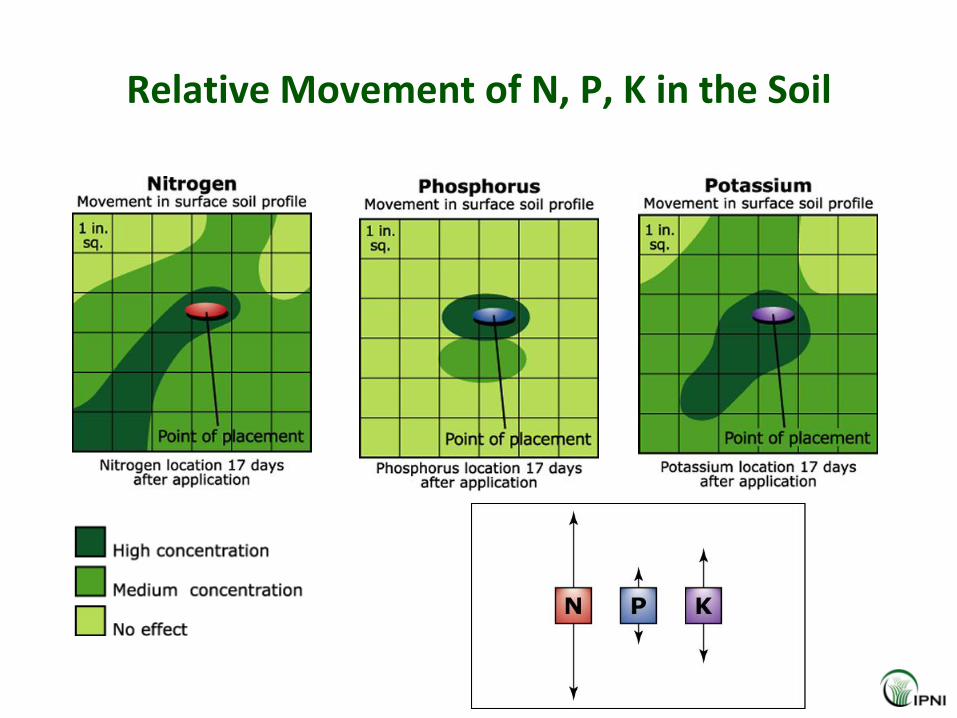
Relative Movement of N, P, K in the Soil
60
80
100
120
140
160
180
200
0 20 40 60 80 100 120 140 160 180 200
N rate, lb/A
with P
without P
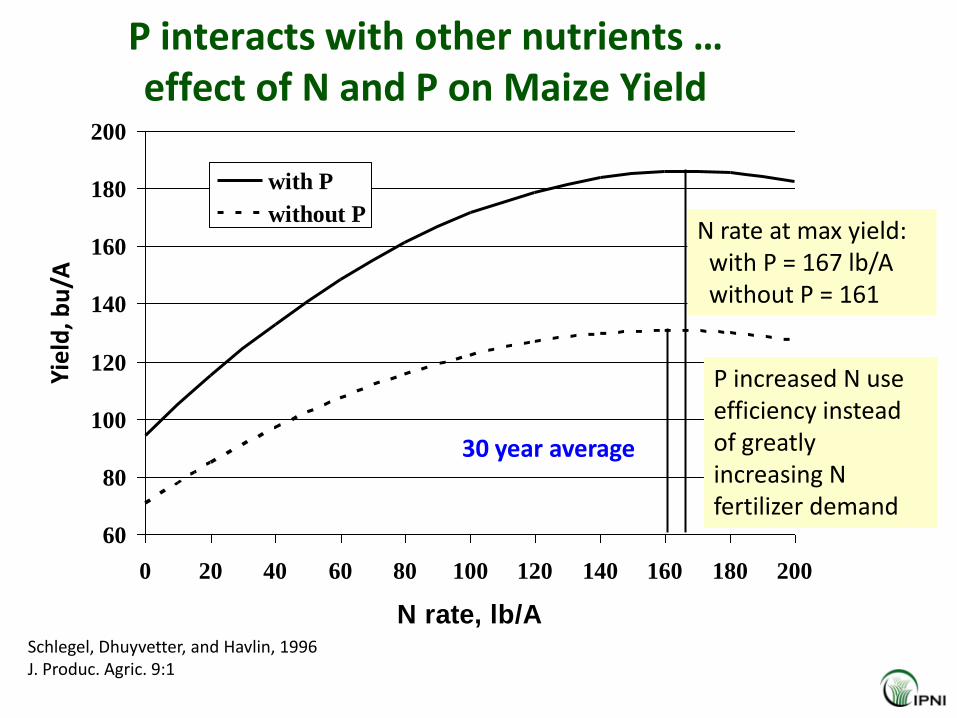
P interacts with other nutrients … effect of N and P on Maize Yield
Schlegel, Dhuyvetter, and Havlin, 1996J. Produc. Agric. 9:1
N rate at max yield:with P = 167 lb/Awithout P = 161
P increased N use efficiency instead of greatly increasing N fertilizer demand
30 year average
0
50
100
150
200
0 40 80 120 160 200
N rate, lb/A
So
il N
O3-N
in
up
per
10 f
t, l
b/A
with P
without P
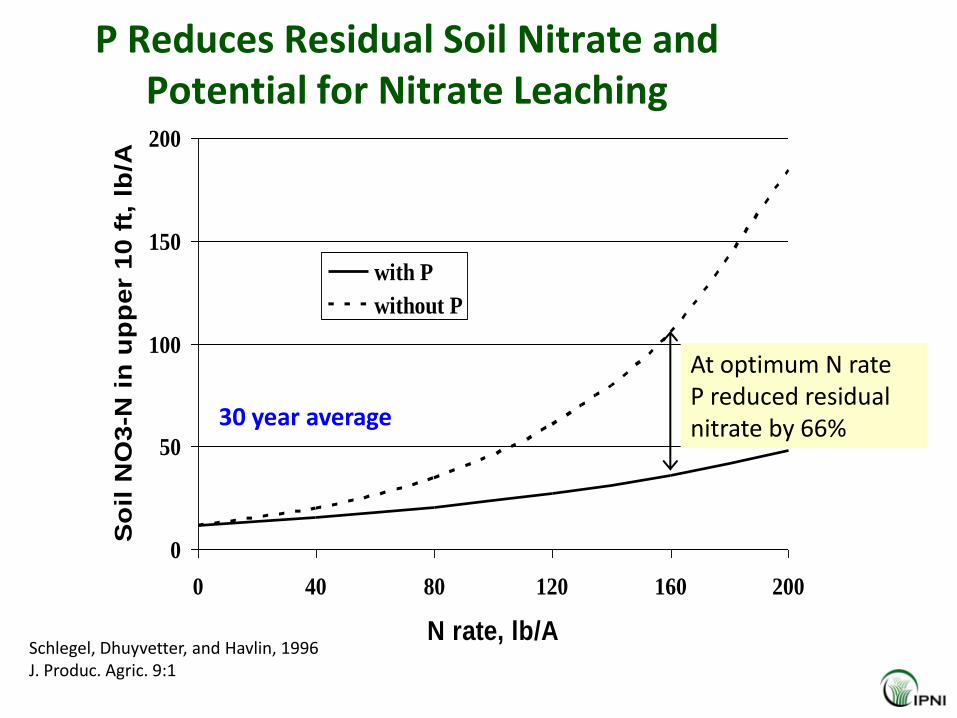
P Reduces Residual Soil Nitrate and Potential for Nitrate Leaching
At optimum N rate P reduced residual nitrate by 66%
Schlegel, Dhuyvetter, and Havlin, 1996J. Produc. Agric. 9:1
30 year average
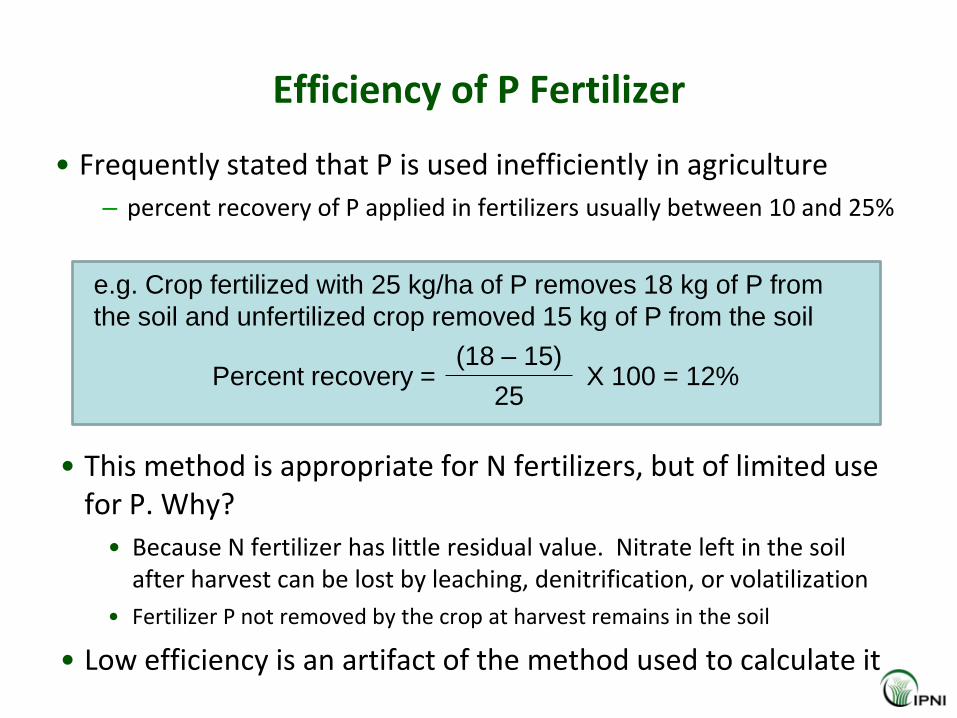
Efficiency of P Fertilizer
• Frequently stated that P is used inefficiently in agriculture
– percent recovery of P applied in fertilizers usually between 10 and 25%
• This method is appropriate for N fertilizers, but of limited use for P. Why?
• Because N fertilizer has little residual value. Nitrate left in the soil after harvest can be lost by leaching, denitrification, or volatilization
• Fertilizer P not removed by the crop at harvest remains in the soil
• Low efficiency is an artifact of the method used to calculate it
Percent recovery = Uptake Fert – Uptake No fert
Fertilizer AppliedX 100
e.g. Crop fertilized with 25 kg/ha of P removes 18 kg of P from
the soil and unfertilized crop removed 15 kg of P from the soil
Percent recovery =(18 – 15)
25X 100 = 12%
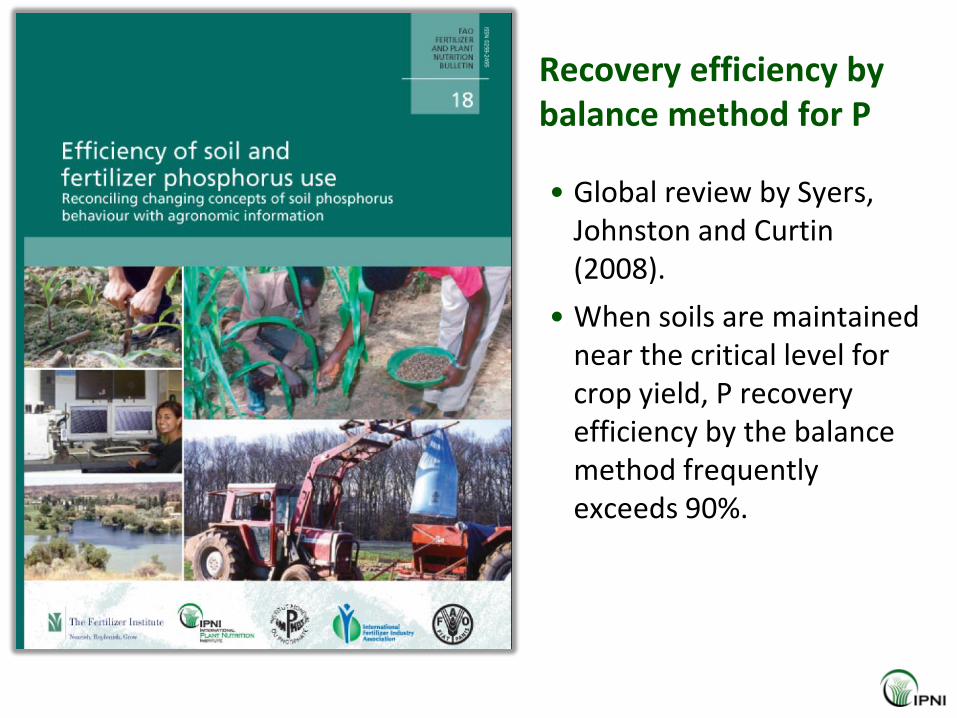
Recovery efficiency by balance method for P
• Global review by Syers, Johnston and Curtin (2008).
• When soils are maintained near the critical level for crop yield, P recovery efficiency by the balance method frequently exceeds 90%.
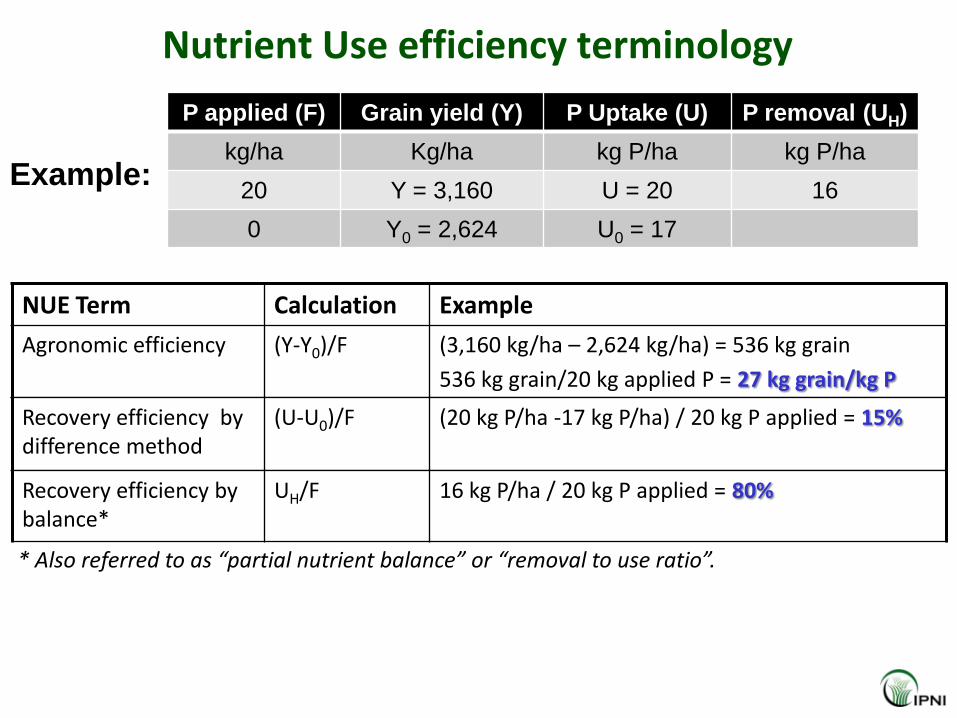
Nutrient Use efficiency terminology
NUE Term Calculation Example
Agronomic efficiency (Y-Y0)/F (3,160 kg/ha – 2,624 kg/ha) = 536 kg grain
536 kg grain/20 kg applied P = 27 kg grain/kg P
P applied (F) Grain yield (Y) P Uptake (U) P removal (UH)
kg/ha Kg/ha kg P/ha kg P/ha
20 Y = 3,160 U = 20 16
0 Y0 = 2,624 U0 = 17
Example:
Recovery efficiency by difference method
(U-U0)/F (20 kg P/ha -17 kg P/ha) / 20 kg P applied = 15%
* Also referred to as “partial nutrient balance” or “removal to use ratio”.
Recovery efficiency by balance*
UH/F 16 kg P/ha / 20 kg P applied = 80%
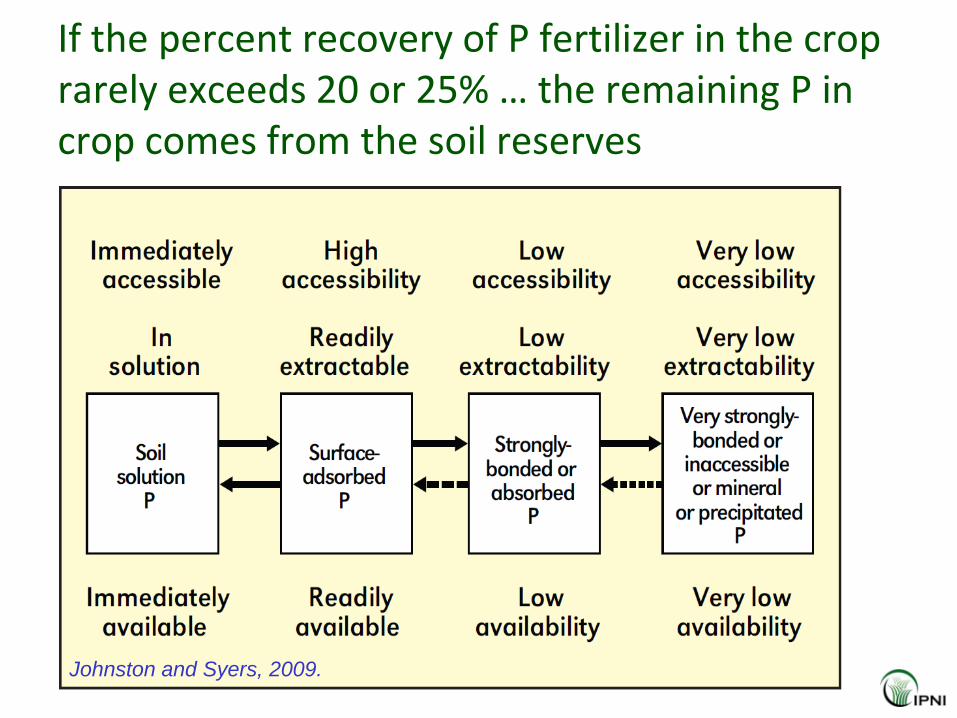
If the percent recovery of P fertilizer in the crop rarely exceeds 20 or 25% … the remaining P in crop comes from the soil reserves
Recovery efficiency
by difference method
(U-U0)/F (20 kg P/ha -17 kg P/ha) / 20 kg
P applied = 15%
P applied (F) Grain yield (Y) P Uptake (U) P removal (UH)
kg/ha (P2O5) Kg/ha kg P/ha kg P/ha
20 (45) Y = 3,160 U = 20 16
0 Y0 = 2,624 U0 = 17
Johnston and Syers, 2009.
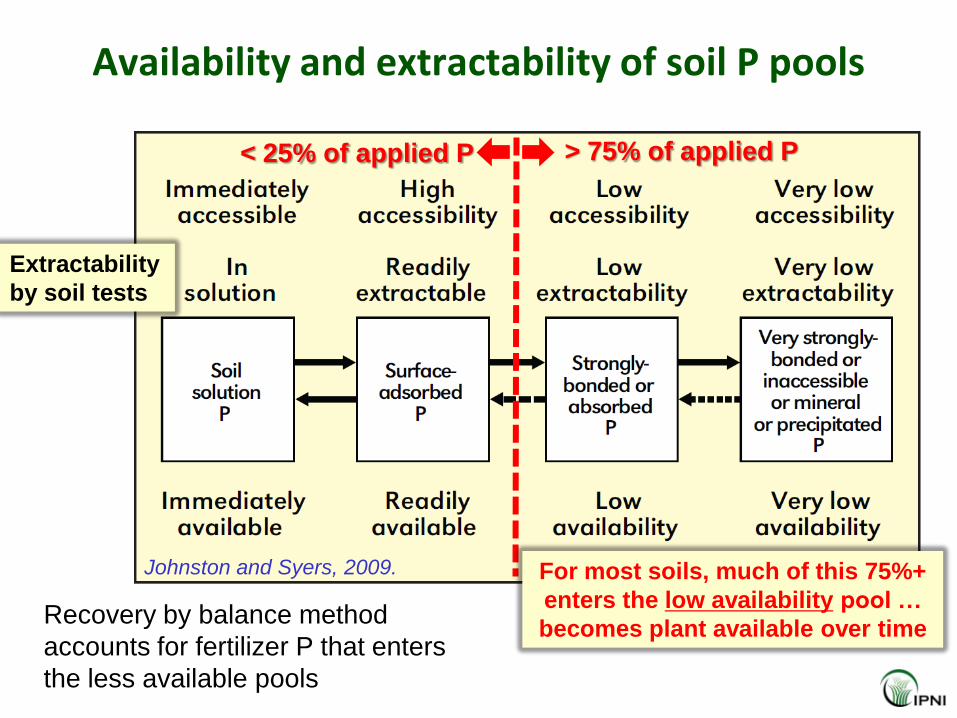
Availability and extractability of soil P pools
Johnston and Syers, 2009.
Extractability
by soil tests
< 25% of applied P
For most soils, much of this 75%+
enters the low availability pool …
becomes plant available over time
> 75% of applied P
Recovery by balance method
accounts for fertilizer P that enters
the less available pools
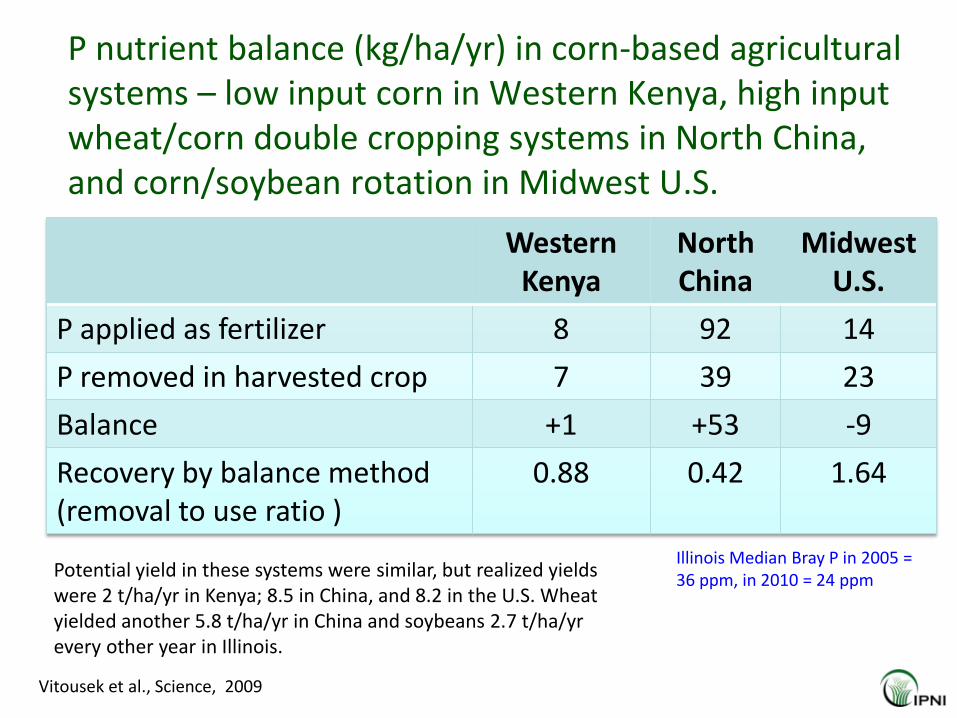
P nutrient balance (kg/ha/yr) in corn-based agricultural systems – low input corn in Western Kenya, high input wheat/corn double cropping systems in North China, and corn/soybean rotation in Midwest U.S.
Western Kenya
NorthChina
Midwest U.S.
P applied as fertilizer 8 92 14
P removed in harvested crop 7 39 23
Balance +1 +53 -9
Recovery by balance method (removal to use ratio )
0.88 0.42 1.64
Vitousek et al., Science, 2009
Illinois Median Bray P in 2005 = 36 ppm, in 2010 = 24 ppm
Potential yield in these systems were similar, but realized yields were 2 t/ha/yr in Kenya; 8.5 in China, and 8.2 in the U.S. Wheat yielded another 5.8 t/ha/yr in China and soybeans 2.7 t/ha/yr every other year in Illinois.
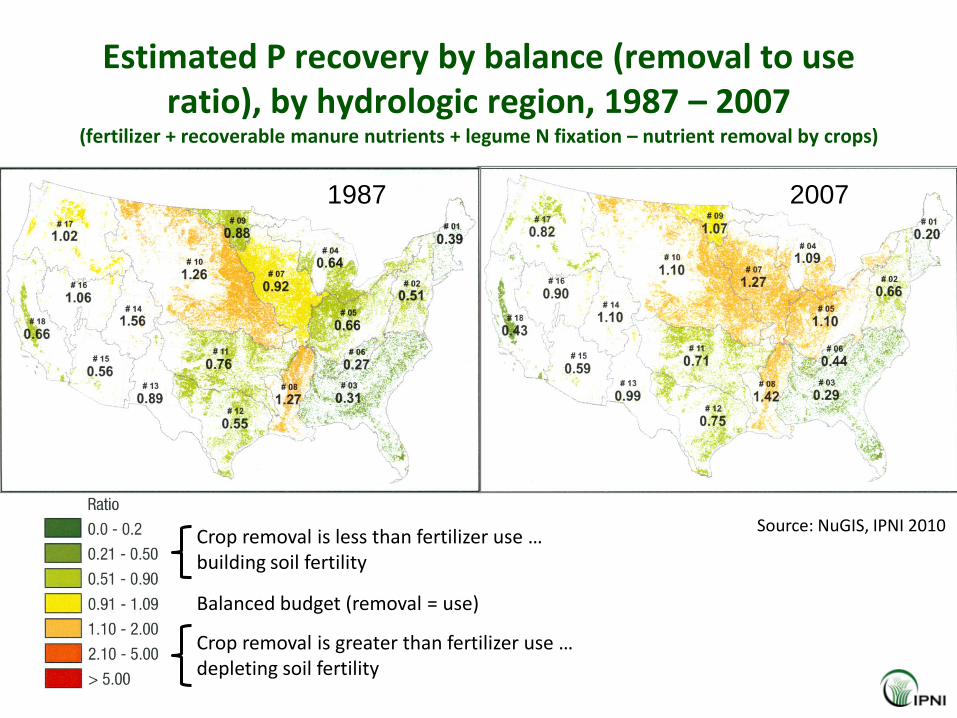
Source: NuGIS, IPNI 2010
Balanced budget (removal = use)
Crop removal is less than fertilizer use … building soil fertility
Crop removal is greater than fertilizer use … depleting soil fertility
Estimated P recovery by balance (removal to use ratio), by hydrologic region, 1987 – 2007
(fertilizer + recoverable manure nutrients + legume N fixation – nutrient removal by crops)
1987 2007
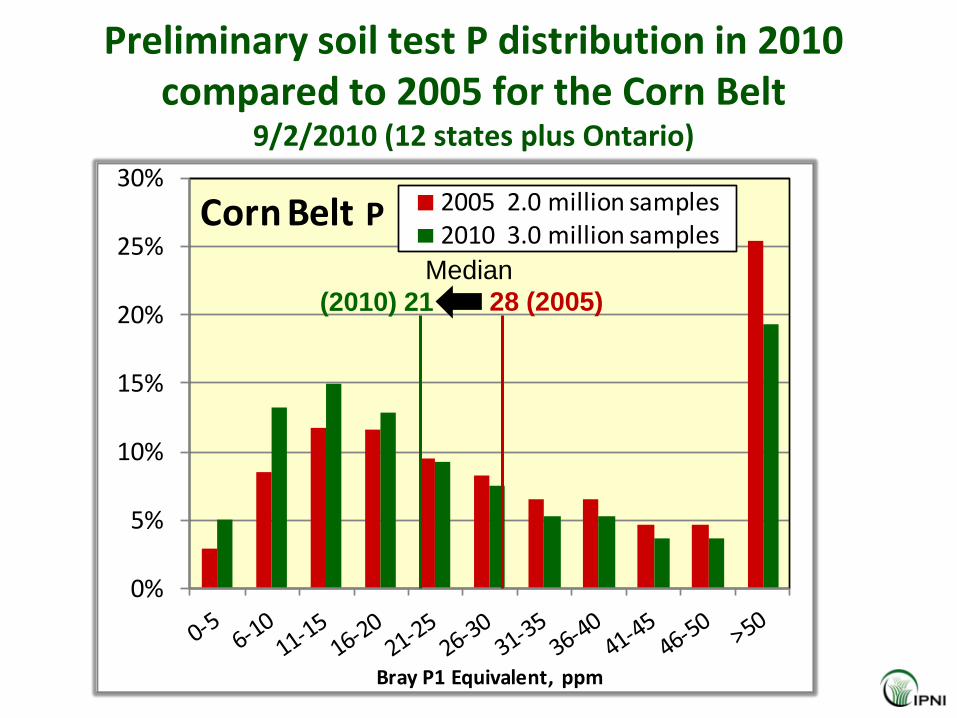
Preliminary soil test P distribution in 2010 compared to 2005 for the Corn Belt
9/2/2010 (12 states plus Ontario)
0%
5%
10%
15%
20%
25%
30%
Bray P1 Equivalent, ppm
Corn Belt P 2005 2.0 million samples2010 3.0 million samples
(2010) 21 28 (2005)
Median
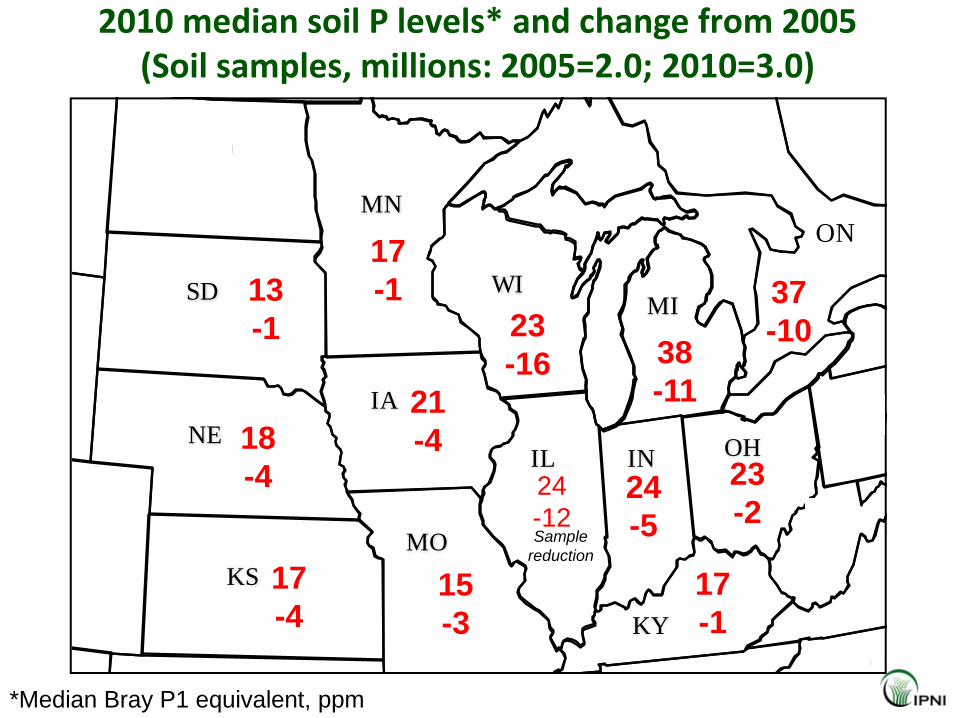
2010 median soil P levels* and change from 2005(Soil samples, millions: 2005=2.0; 2010=3.0)
ND
SKMB
ON
BCAB
WA
OR
MT
ID
SD
MN
PQ
NY
PA
OHINIL
IA
WIMI
WY
UT
NV
CA
AZ NM
NB
NS
PEI
ME
VT
MA NHCT RI
NE
KS
MO
KY
WV
VA
MD
DE
NJ
NC
TN
AROK
TXLA
MS AL GA
SC
FL
CO
ON
*Median Bray P1 equivalent, ppm
13
-1
24
-5
15
-3
21
-4
24
-12
37
-1023
-16
17
-4
18
-4
17
-1
23
-2
38
-11
17
-1
Sample
reduction
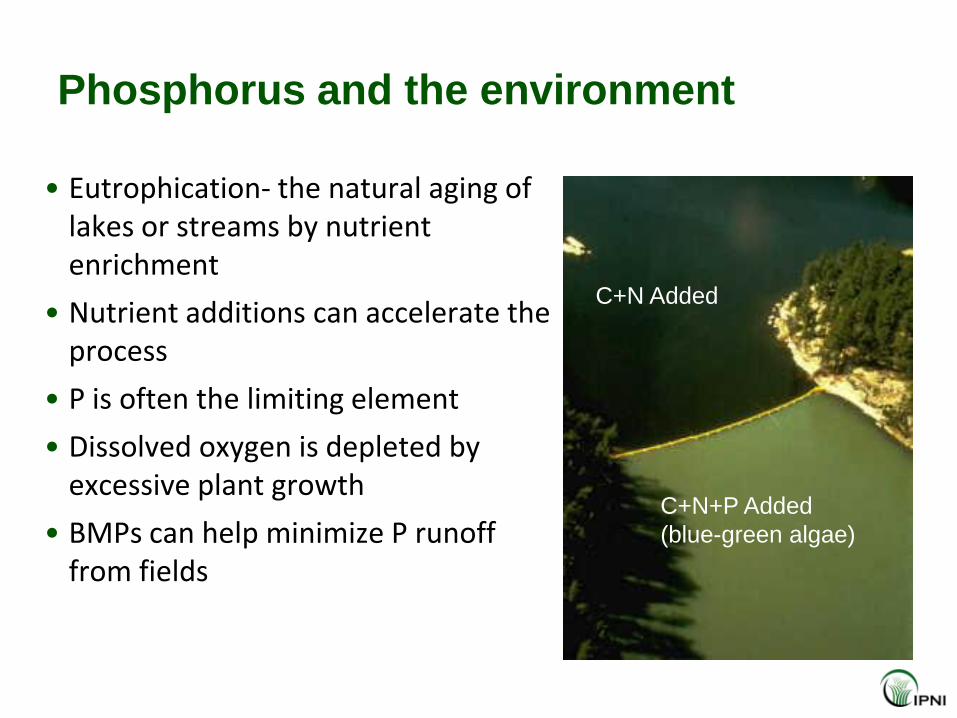
Phosphorus and the environment
• Eutrophication- the natural aging of lakes or streams by nutrient enrichment
• Nutrient additions can accelerate the process
• P is often the limiting element
• Dissolved oxygen is depleted by excessive plant growth
• BMPs can help minimize P runoff from fields
C+N Added
C+N+P Added
(blue-green algae)
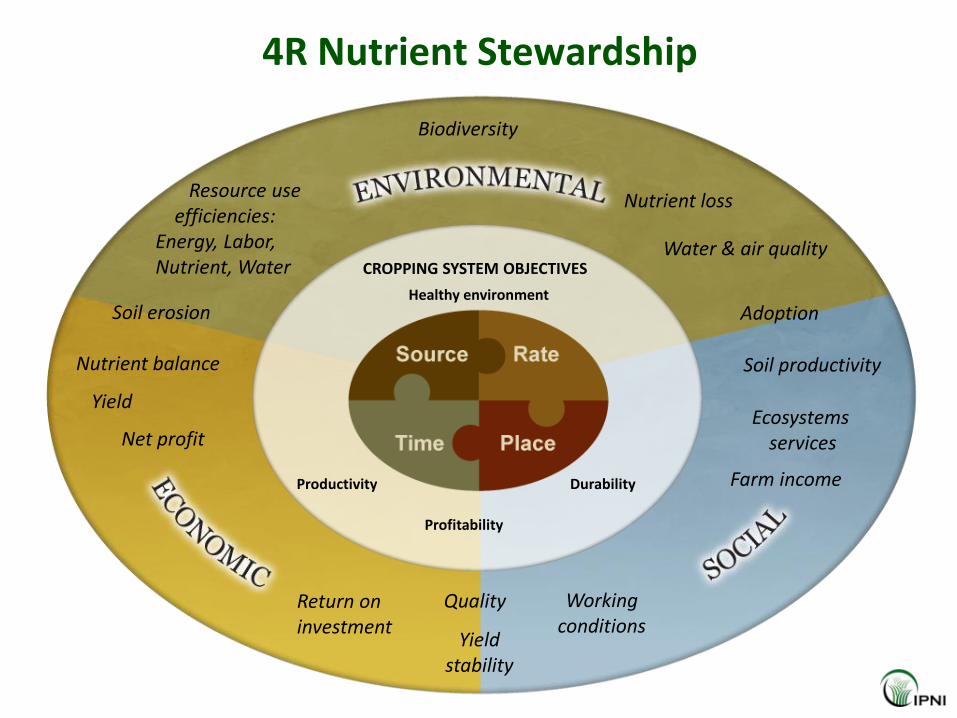
Productivity
Profitability
Durability
Healthy environment
CROPPING SYSTEM OBJECTIVES
Net profit
Resource use efficiencies:
Energy, Labor, Nutrient, Water
Return on investment
Yield stability
Water & air quality
Farm income
Working conditions
Nutrient balance
Nutrient loss
Yield
Quality
Soil erosion
Biodiversity
Ecosystems services
Adoption
Soil productivity
4R Nutrient Stewardship
www.ipni.net
Better Crops, Better Environment … through Science
Thank You
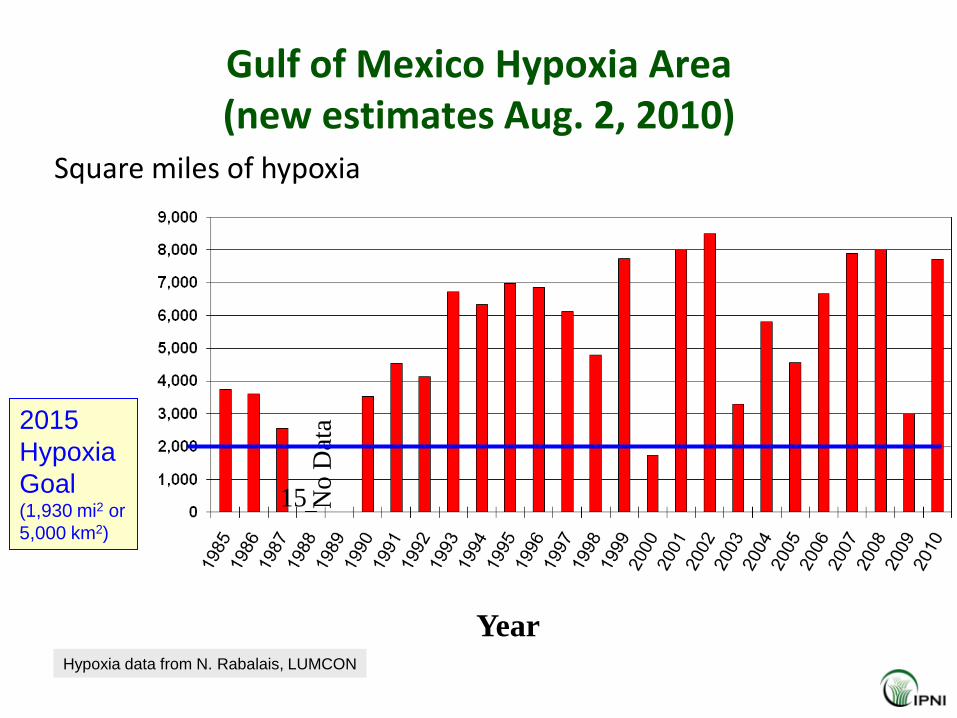
Gulf of Mexico Hypoxia Area(new estimates Aug. 2, 2010)
Square miles of hypoxia
Year
No
Dat
a
15
Hypoxia data from N. Rabalais, LUMCON
2015
Hypoxia
Goal (1,930 mi2 or
5,000 km2)
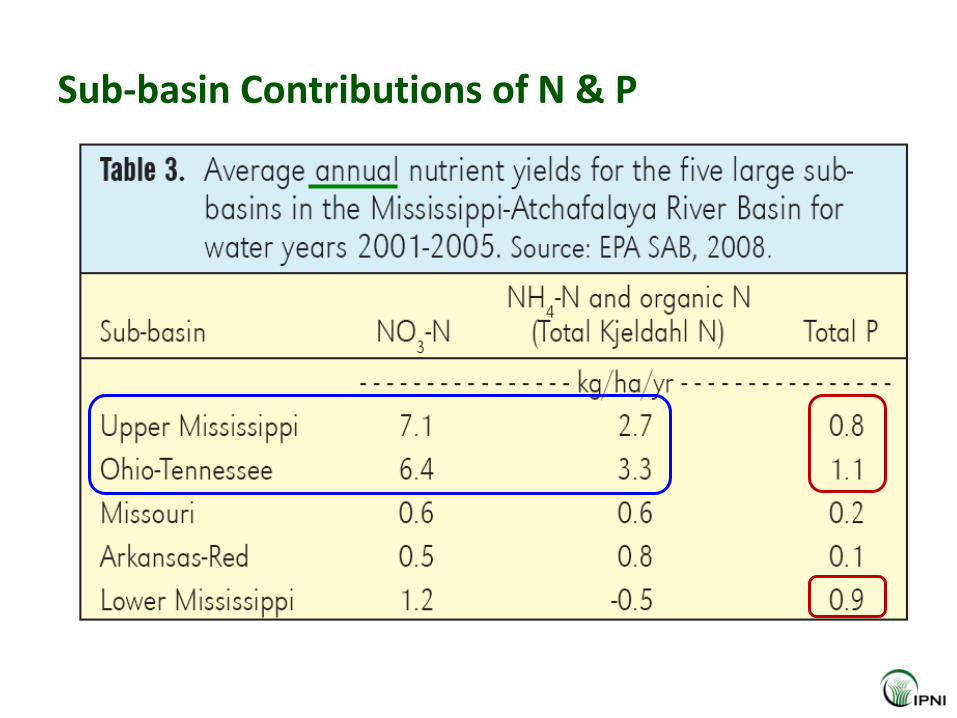
Sub-basin Contributions of N & P
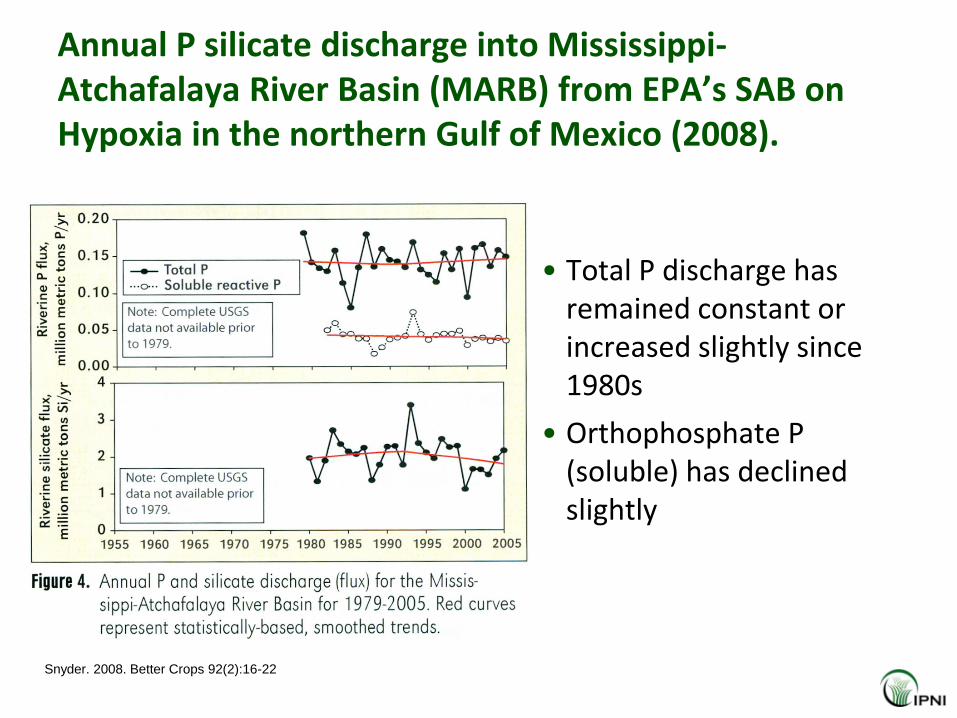
Annual P silicate discharge into Mississippi-Atchafalaya River Basin (MARB) from EPA’s SAB on Hypoxia in the northern Gulf of Mexico (2008).
• Total P discharge has remained constant or increased slightly since 1980s
• Orthophosphate P (soluble) has declined slightly
Snyder. 2008. Better Crops 92(2):16-22
Snyder. 2008. Better Crops 92(2):16-22
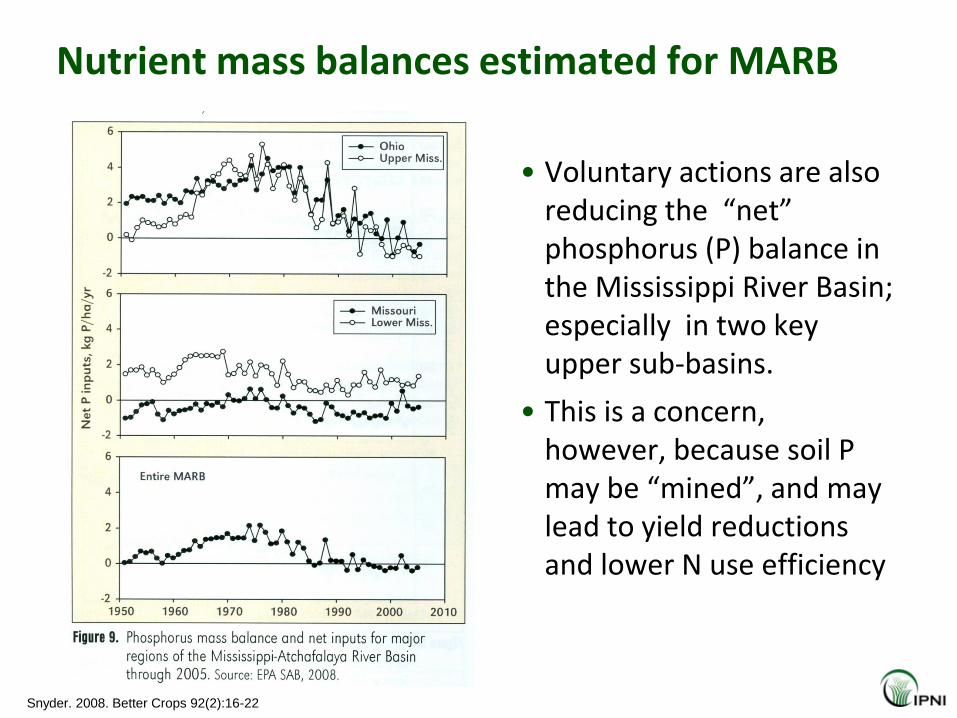
Nutrient mass balances estimated for MARB
• Voluntary actions are also reducing the “net” phosphorus (P) balance in the Mississippi River Basin; especially in two key upper sub-basins.
• This is a concern, however, because soil P may be “mined”, and may lead to yield reductions and lower N use efficiency