Embed Size (px)
Citation preview

12/6/2013
1
© University of South Wales
Dr. Sandra Esteves
Importance of Process Monitoring in
Optimising Biogas Production
BIOGAS13 Congress4th December 2013 - St Pölten , Austria
Hydrogen Energy
Biohydrogen Systems
Advanced Nanomaterials
Bio Energy Systems
Anaerobic Digestion
Waste and Wastewater Treatment
Monitoring and Control
Environmental Analysis
Bioelectrochemical Devices
The
Hydrogen
Centre
Bioplastics Production
Biogas upgrading and utilisation

12/6/2013
2
• Established in 2008 with financial support from
WG and ERDF
• Expand knowledge and expertise for a rapid and
successful deployment of AD
• The Centre acts as a process development platform
and delivers:
– Industrial focus R&D
– feasibility studies
– feedstock and digestate analysis
– system monitoring, diagnostics and optimisation
– analytical method development
– development of new of improved
products/processes – funding available to SMEs
– regulatory and policy development support
– awareness raising and training events
www.walesadcentre.org.uk
Wales Centre of Excellence for Anaerobic Digestion
1. Establishing the current
situation and strategies for
actions
2. Encouraging and facilitating
new AD and biomethane
plants
3. Developing positive
environment for biomethane
production
4. Quality management for
efficient operation and
increased gas yields
5. Communication

12/6/2013
3
© University of South Wales
Full-Scale Plants
Optimisation
Increase methane production in full-scale AD plants through the deployment of
monitoring and management strategies
2012 - 2013 Evaluating the scope for improvements at Cardiff Sewage Treatment Plant
2011-2013 Made improvements (almost doubled biogas) at Insource Energy AD Plant in Rogerstonetreating food wastes
Investigations are continuing
© University of South Wales
Full-Scale Plants
Optimisation
Increase methane production in full-scale AD plants through the deployment of
monitoring and management strategies
2011 - 2013 Evaluating the scope for improvements at Thornton and Leyland Plants - Organic Fraction of Municipal Solid Wastes
2012-2013 Evaluating the scope for improvement at the Wrexham AD plant - animal slurries
Investigations are continuing

12/6/2013
4
Monitoring Matrices
Biogas and BiomethaneFlow Rate
Gas content in terms of CH4, CO2, O2, H2S, H2O and
NH3
Other content –particulates, siloxanes,
volatile organics, mercaptans, oxygen and
halogens
Calorific value and Wobbe Index
Microbial agents
TS
VS
COD and Biochemical Oxygen Demand (BOD)
pH
N, P, K, Na, Ca, Mg and S content
Pathogens
BMP
VFAs
Physical contaminants (glass / plastic, etc)
Potential toxic elements or inhibitors to plants, animals and microbial receptors (e.g. heavy
metals)
Organic and Hydraulic Loading Rates
Retention time
TS and VS
C:N ratio
Organic Nitrogen and Ammonium
Metal Ions (Na, Ca, K, Mg)
pH/ Buffering Capacity
Temperature
Redox Potential (ORP)
VFAs and longer chain fatty acids
Macro and Micronutrients
Biogas Flowrate and Composition (CH4, CO2,
O2, NH3, H2S and H2)
Dissolved Hydrogen
Microbial Enzyme Activity & Populations
TS
VS
COD
C:H:N:P:K:S ratios
Trace Elements
Organic Nitrogen and Ammonium
Carbohydrates, Proteins and Lipids
Metals (including light and heavy)
Temperature
pH and Alkalinity
Pathogens
Biocides
Biogas or Methane Potential
Particle Size
Esteves et al. (2012)
Monitoring
Review and Guide
For the Optimisation of
AD and Biomethane Plants
Esteves et al. (2012)
Deliverable of
IEE Biomethane Regions Project
www.walesadcentre.org.uk/News.aspx

12/6/2013
5
Monitoring AD systems
for Control.....
In-situ monitor
Ex-situ analysis In-line or in-loop monitor
On-site analysis
External lab analysis
Data received/input off-line
Data received on-line
(in real-time or past data)
Digester
Sample fluxes Data fluxes
Feedstocks digestates biogas
Esteves et al. (2012)
Near Infrared Spectroscopy In
Feedstock/Bioreactor Performance
Monitoring (Sewage Sludge)
1.0
1.2
1.4
1.6
1.8
2.0
Wavenumber (cm -1)
0/10020/8040/6070/30100/0
12000 800010000 6000 4000
Absorbance
1.0
1.2
1.4
1.6
1.8
2.0
-1)
0/10020/8040/6070/30100/0
0/1000/10020/8020/8040/6040/6070/3070/30100/0100/0
12000 800010000 6000 4000
Absorbance
Primary/Secondary
Ratios
Data Point
3.1
3.3
3.5
3.7
3.91 2 3 4 5 76 8
2.1
2.3
2.5
Volatile Solids
Total Solids
Bicarbonate Alkalinity
1500
2000
2500
3000
3500
4000
-400
-200
0
200
400
600
800
1000
1200
1400
1600
5 9 13 17 21 25 29 33 37 41 45 49 53 57 61 65 69 73 77
Volatile Fatty Acidsmg.L-1
mg.L-1
g.L-1
g.L-1
Data Point
3.1
3.3
3.5
3.7
3.91 2 3 4 5 76 8
2.1
2.3
2.5
2.1
2.3
2.5
2.1
2.3
2.5
2.1
2.3
2.5
Volatile Solids
Total Solids
Bicarbonate Alkalinity
1500
2000
2500
3000
3500
4000
-400
-200
0
200
400
600
800
1000
1200
1400
1600
5 9 13 17 21 25 29 33 37 41 45 49 53 57 61 65 69 73 77
-400
-200
0
200
400
600
800
1000
1200
1400
1600
5 9 13 17 21 25 29 33 37 41 45 49 53 57 61 65 69 73 77
Volatile Fatty Acidsmg.L-1
mg.L-1
g.L-1
g.L-1
Reed et al. (2011)
12/6/2013
6
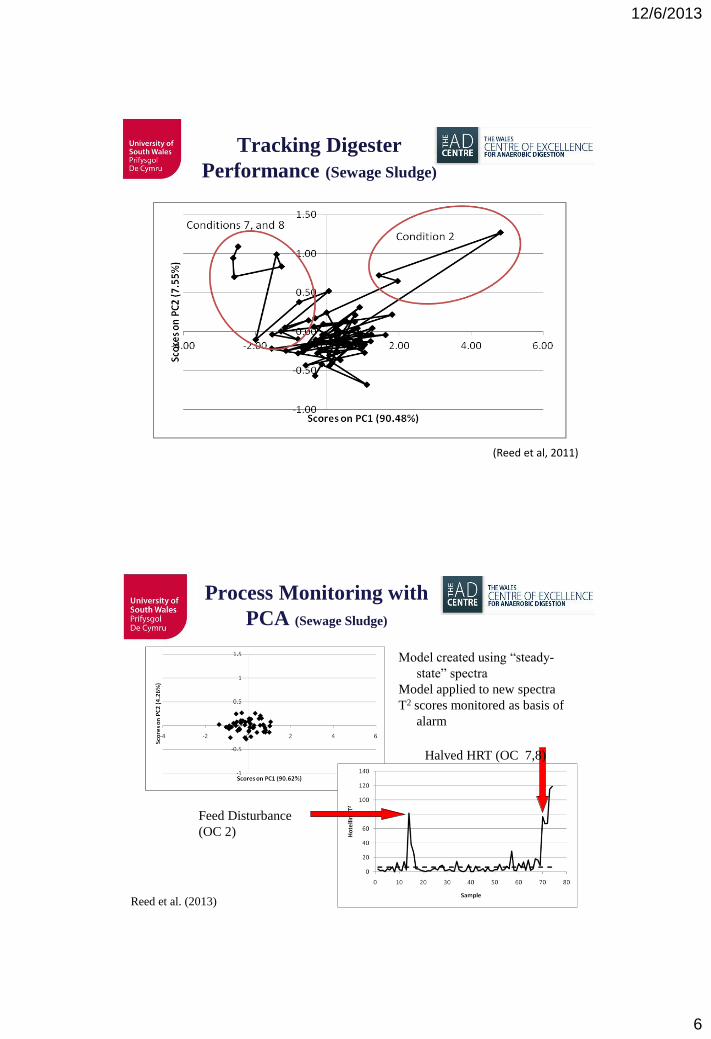
Tracking Digester
Performance (Sewage Sludge)
(Reed et al, 2011)
Process Monitoring with
PCA (Sewage Sludge)
Feed Disturbance
(OC 2)
Halved HRT (OC 7,8)
Model created using “steady-
state” spectra
Model applied to new spectra
T2 scores monitored as basis of
alarm
Reed et al. (2013)

12/6/2013
7
Use of FT-NIR for
Measuring Solids
Content, BMP .....
Reed et al. In preparation
R&D and Optimisation at Full
Scale AD plants
Rogerstone - food waste
500 kWe

12/6/2013
8
© University of South Wales
Flow chart of Full-scale AD plant
Volume 3090 m3
Load 30-50 m3 /d
HRT 60-100 d
MECHANICAL SEPARATION
PASTEURISATION
Plastics
ANAEROBIC DIGESTION
CHP
DEWATERING Solid fraction
Liquid effluent
HEAT
ELECTRICITY
RF BROOKES
Food Wastes
DAF Sludge
Waste Potato
Removed for
recycling
Biogas
Pasteurised
Slurry
HEAT
Electricity
Applied to
land
© University of South Wales
Variation in the chemical parameters of
the digester
Acetate
Propionate

12/6/2013
9
© University of South Wales
Sample
DNA extraction
Selection of primers & probes
Amplification
Quantification
Yu Y, Lee C, Kim J & Hwang S (2005).
Group- Specific Primer and Probe Sets to
detect Methanogenic Communities Using
Quantitative Real-Time Polymerase Chain
Reaction. Biotechnology and
Bioengineering 89: 670-679.
Quantitative PCR (qPCR)
© University of South Wales
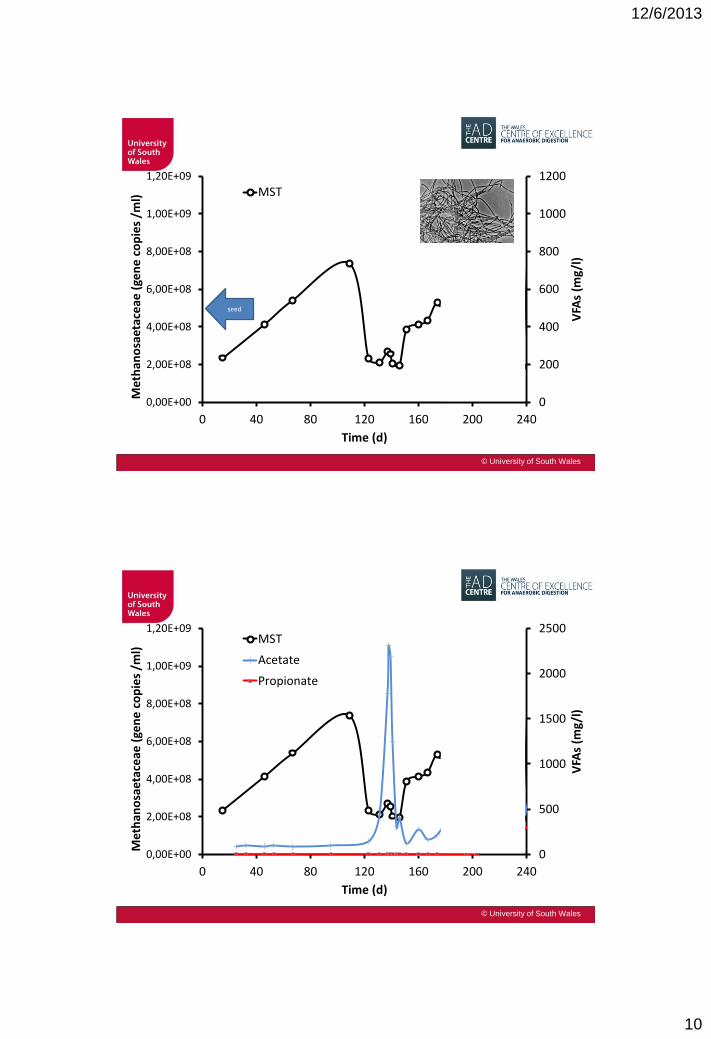
Microbial Populations Present in
the Sewage Sludge Seed
Microbial Target Group Number of gene copies ml-1
Total eubacteria 3.8 x 10¹⁰
Methanosaetaceae 4.6 x 10⁸
Methanosarcinaceae n.d
Methanococcales n.d
Methanomicrobiales 2.6 x10⁶
Methanobacteriales 3.2 x 10⁶
n.d not detected (< 200 gene copies ml-1)
12/6/2013
10
© University of South Wales
0
200
400
600
800
1000
1200
0,00E+00
2,00E+08
4,00E+08
6,00E+08
8,00E+08
1,00E+09
1,20E+09
0 40 80 120 160 200 240
VFA
s (m
g/l)
Met
han
osa
etac
eae
(ge
ne
co
pie
s /m
l)
Time (d)
MST
Propionate
seed
© University of South Wales
0
500
1000
1500
2000
2500
0,00E+00
2,00E+08
4,00E+08
6,00E+08
8,00E+08
1,00E+09
1,20E+09
0 40 80 120 160 200 240
VFA
s (m
g/l)
Met
han
osa
etac
eae
(ge
ne
co
pie
s /m
l)
Time (d)
MST
Acetate
Propionate
12/6/2013
11
© University of South Wales
0
500
1000
1500
2000
2500
0,00E+00
2,00E+08
4,00E+08
6,00E+08
8,00E+08
1,00E+09
1,20E+09
0 40 80 120 160 200 240
VFA
s (m
g/l)
Met
han
osa
etac
eae
(ge
ne
co
pie
s /m
l)
Time (d)
MST
Acetate
Propionate
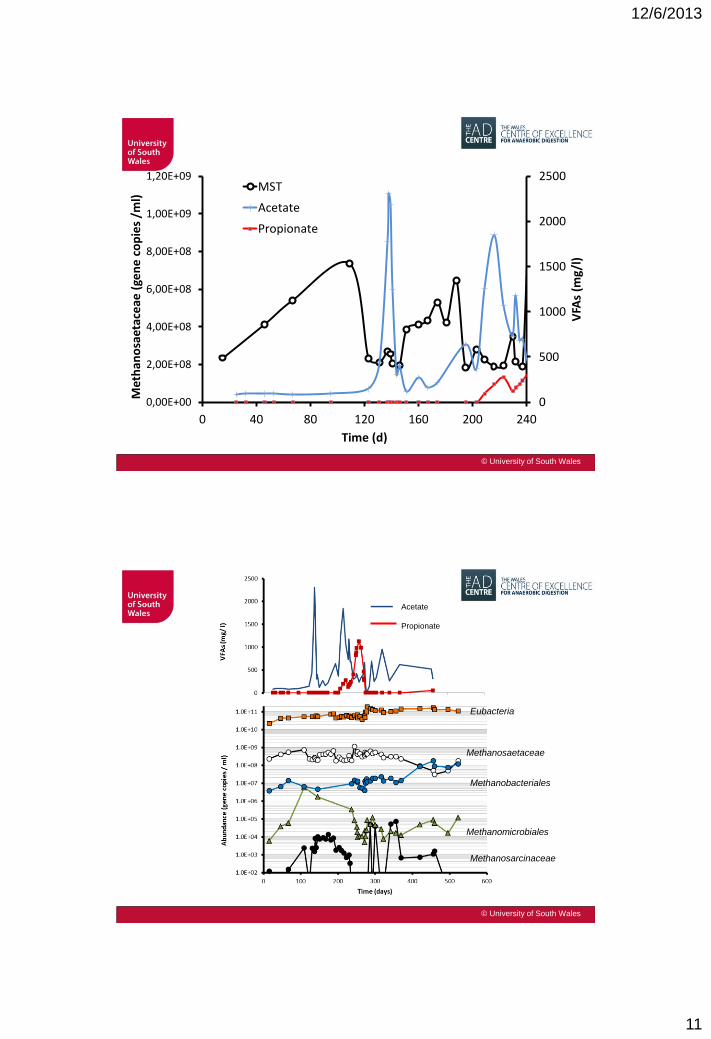
© University of South Wales
Acetate
Propionate
Eubacteria
Methanosaetaceae
Methanobacteriales
Methanomicrobiales
Methanosarcinaceae

12/6/2013
12
Characteristics of Methanosarcina & Methanosaeta sp.
Parameter Methanosaeta Methanosarcina
μmax (d−1) 0.20 0.60
Ks (mg COD L−1) 10–50 200–280
NH4+ (mg L−1) <3000 <7000
Na+ (mg L−1) <10,000 <18,000
pH-range 6.5–8.5 5–8
pH-shock <0.5 0.8–1
Temperature range (°C) 7–65 1–70
Acetate concentration (mg L−1) <3000 <15,000De Vrieze et al., 2012
© University of South Wales
0,0E+00
5,0E+07
1,0E+08
1,5E+08
2,0E+08
2,5E+08
3,0E+08
3,5E+08
4,0E+08
4,5E+08
5,0E+08
1.000
1.200
1.400
1.600
1.800
2.000
2.200
2.400
2.600
300 330 360 390 420 450 480 510
Met
han
oge
ns
(ge
ne
co
pie
s /
ml)
Am
mo
niu
m c
on
cen
trat
ion
(m
g /l
)
Time (days)
NH4
MST
MBT
Ammonium inhibition

12/6/2013
13
© University of South Wales
0,0E+00
4,0E+10
8,0E+10
1,2E+11
1,6E+11
2,0E+11
Eub
acte
ria
0
200
400
600
800
1000
1200
3,0E+03
3,0E+04
3,0E+05
3,0E+06
3,0E+07
140 170 200 230 260 290 320
Met
han
oge
ns
(ge
ne
co
pie
s m
l-1)
Time (days)
MMB
MBT
Propionic acid
Propionate & LithotrophicMethanogens
Propionate
VF
A (
mg
/ l
)
R&D and Optimisation at
Full Scale AD plants
Cardiff STWs
TH Pretreatment
4.5 MW

12/6/2013
14
AD of Sewage Sludges
• >70% VS red. for primary sludges
• Secondary sludge is more difficult to
digest than primary
– 30-45% VS destruction
– Much of the organics are within the
extracellular polymers and encased within the
cell wall
– The cell is protected from lysis by a semi-rigid
structure of the cell wall (glycan and peptide
strands are cross-linked)
– Hydrolysis is the limiting step for secondary
sludge digestion
Microscope image (x100) of
stained pre-thermal hydrolysis SAS sample
Microscope image (x100) of
stained post-thermal hydrolysis SAS sample
~ 5 µm
University of Glamorgan, Feb 2013 ~ 5 µm
University of Glamorgan, Feb 2013
TH and Acid Pretreatment of Mixed
Sludges
Type of
Sludge
Biogas
ml/g VS
added
%CH4
End of trial
Untreated 346 59
pH2 295 56
Thermal
Hydrolysis 472 63
TH had a greater
effect when sludge
have a high
proportion of WAS,
with up to 47%
increased in biogas
yield
Devlin et al. In preparationOLR ~ 3.5 kg/m3.d
and HRT of 12 days

12/6/2013
15
Pretreatments Impact on
MethanogensLab. Experiments (Mixed Sludges)
TH resulted in higher level of methanogens, Methanosaeta
(2-fold), Methanosarcina (6-fold) and Methanomicrobium
(0.6 fold) compared to untreated Devlin et al. In preparation
Differences in Microbial Populations in
Digesters Operating on Mixed Sludges and
Secondary Sludges Thermally Hydrolysed
Oliveira et al. In preparation
No
t d
etec
ted
<150 mg/l VFAs
<1300 mg/l ammonium300 - 500 mg/l VFAs
~3600 mg/l ammonium

12/6/2013
16
Characteristics of Methanosarcina
& Methanosaeta sp.
Parameter Methanosaeta Methanosarcina
μmax (d−1) 0.20 0.60
Ks (mg COD L−1) 10–50 200–280
NH4+ (mg L−1) <3000 <7000
Na+ (mg L−1) <10,000 <18,000
pH-range 6.5–8.5 5–8
pH-shock <0.5 0.8–1
Temperature range (°C) 7–65 1–70
Acetate concentration (mg L−1) <3000 <15,000
De Vrieze et al., 2012
Differences in Secondary Digestions of
Digestate and Mixture of Digestates
© University of South Wales
Mixture - More than double than the separate digestates; 20% of current Plant recovery;
Why:
Dilution of Inhibition? Population Profile, Diversity and Activity? Others?

12/6/2013
17
© University of South Wales
Effect of pH at constant temperature: digestate
Potential consumption of alkali
(for pH 10-10.5):
249-299 kg NaOH / Ton TS
0
10
20
30
40
50
60
70
80
90
100
6 h 24h 48h
NH
4+
rem
ov
al (%
)
Time (hours)
At constant temperature of 60o C
pH 8
pH 10
0,0
0,5
1,0
1,5
2,0
2,5
3,0
3,5
4,0
4,5
5,0
0
10
20
30
40
50
60
70
80
90
100
0 10 20 30 40 50
[NH
4+]
(g/k
g F
M)
NH
4+
rem
ov
al (%
)
Time (hours)
% removed at 60 C pH10
% removed at 60 C pH 8
[NH4+] at pH 8 and 60 C
[NH4+] at pH 10 and 60 C
Ammonia Removal
for Cardiff STWs
© University of South Wales
0
10
20
30
40
50
60
70
80
90
100
pH 10 pH 10.5
NH
4+
rem
ov
al (%
)
At constant temperature of 60o C
6 h 24h 48h
Potential consumption of alkali (for pH 10 or 10.5):
68-80 kg NaOH /Ton TS
Effect of pH at constant temperature: Thermally hydrolysed WAS
0,00
0,10
0,20
0,30
0,40
0,50
0,60
0,70
0,80
0,90
1,00
0
10
20
30
40
50
60
70
0 20 40 60
[NH
4+]
(g/k
g F
M)
% N
H4
+re
mo
va
l
Time(h)
pH 10 at 60 C
pH 10.5 at 60 C
[NH4+] at pH 10
and 60 C
[NH4+] at pH 10.5
and 60 C
Ammonia Removal for Cardiff STWs

12/6/2013
18
R&D and Optimisation at Full Scale AD plants
35
ADBA (Anaerobic Digester & Biogas Association)
2012 Award for the “Best Integration of AD into a
Farming Business”
Wrexham AD Plant for Animal Slurries
160 kWe
© University of South Wales
Microbes and Energy Loss
Due to De-gritting
Removal of grit and inerts from feedstocks or digesters is essentialHowever digester degritting strategies should be evaluated and optimised to avoid important losses
Esteves et al. In
preparation
½ microbial culture lost; de-gritting occurs ~ 3 weeksImmediate reduction of conversion but afterwards improved
performance

12/6/2013
19
R&D and Optimisation at Full Scale AD plants
Thornton and
Leyland OFMSW
2*1 MW
Enzyme Enhanced VFA and Biogas Production

12/6/2013
20
0
10000
20000
30000
40000
50000
60000
70000
0 20 40 60 80
sCO
D (
mg
/l)
Time (h)
water control
water control
0.03% Cellulase N11/12
0.03% Cellulase N11/12
0.03% Cellulase N11/12
0.1% Cellulase N11/12
0.1% Cellulase N11/12
0.1% Cellulase N11/12
0.3% Cellulase N11/12
0.3% Cellulase N11/12
0.3% Cellulase N11/12
1% Cellulase N11/12
1% Cellulase N11/12
0.3% Protease N11/11
0.3% Celluclast
Williams et al. (2011)
Soluble COD Released To
Percolate Liquor
Methane Yield From Batch Tests

12/6/2013
21
VFAs in Percolate (Full Scale)
Oliveira et al. In preparation
Double solubilisation or organics to be digested instead of composted
Conclusions
• Routine monitoring of microbial populations and VFAs provide valuable insights into the digestion process and can be used to predict digester stability and manage performance
• Microbial consortia is important to the outcome of digester performance
• Early warning of instability can be provided by measuring the actual workers ‘bacteria and archae’
• Control actions e.g. reduction of OLR and the timing for the addition of trace elements and alkalinity based on microbial abundance and diversity allowed maintenance of digester stability, which led to an allowed increased load and resulting additional biogas production
42© University of South Wales

12/6/2013
22
Conclusions
• Feedstock characteristics and pre-treatments influence digester population and performance
• Inhibition such as from ammonia may need to be reduced in order to increase digester performance
• De-gritting is essential to maintain a digester, which takes in inert material operational in the long run, but de-gritting strategies can be optimised based on microbial measurements
• Solubilisation of organics via the use of enzymes in a pre-leaching process can increase biogas production
43© University of South Wales
© University of South Wales
The sole responsibility for the content of this document lies with the authors. It does not necessarily reflect the funders opinion.
Neither the authors or the funders are responsible for any use that may be made of the information contained therein.
Acknowledgments
Dr. Julie Williams, Dr. Des Devlin, Ivo Oliveira, Dr, James Reed, Ikechukwu
Tolefe, Fergal Hegarty, Dr. Gregg Williams, Prof. Richard Dinsdale, and Prof.
Alan Guwy