Embed Size (px)
Citation preview
Atmos. Chem. Phys., 11, 1989–2013, 2011www.atmos-chem-phys.net/11/1989/2011/doi:10.5194/acp-11-1989-2011© Author(s) 2011. CC Attribution 3.0 License.
AtmosphericChemistry
and Physics
Importance of secondary sources in the atmospheric budgets offormic and acetic acids
F. Paulot1, D. Wunch1, J. D. Crounse2, G. C. Toon3, D. B. Millet 4, P. F. DeCarlo5,12,*, C. Vigouroux6,N. M. Deutscher7,** , G. Gonzalez Abad8, J. Notholt9, T. Warneke9, J. W. Hannigan10, C. Warneke11,12,J. A. de Gouw11,12, E. J. Dunlea12,13, M. De Maziere6, D. W. T. Griffith 7, P. Bernath8, J. L. Jimenez12,13, andP. O. Wennberg1
1Division of Engineering and Applied Sciences, California Institute of Technology, Pasadena, California, USA2Division of Chemistry and Chemical Engineering, California Institute of Technology, Pasadena, California, USA3Jet Propulsion Laboratory, California Institute of Technology, Pasadena, California, USA4University of Minnesota, Department of Soil, Water and Climate, St. Paul, Minnesota, USA5Department of Atmospheric and Oceanic Sciences, University of Colorado, Boulder, Colorado, USA6Belgian Institute for Space Aeronomy, Brussels, Belgium7School of Chemistry, University of Wollongong, Wollongong, Australia8Department of Chemistry, University of York, York, UK9Institute of Environmental Physics, Bremen, Germany10National Center for Atmospheric Research, Boulder, Colorado, USA11Earth System Research Laboratory, Chemical Sciences Division, NOAA, Boulder, Colorado, USA12Cooperative Institute for Research in Environmental Sciences, University of Colorado, Boulder, Colorado, USA13Department of Chemistry and Biochemistry, University of Colorado, Boulder, Colorado, USA* now at: AAAS Science and Technology Policy Fellow hosted at the US EPA, Washington, DC, USA** now at: Institute of Environmental Physics, Bremen, Germany
Received: 18 September 2010 – Published in Atmos. Chem. Phys. Discuss.: 20 October 2010Revised: 23 February 2011 – Accepted: 25 February 2011 – Published: 4 March 2011
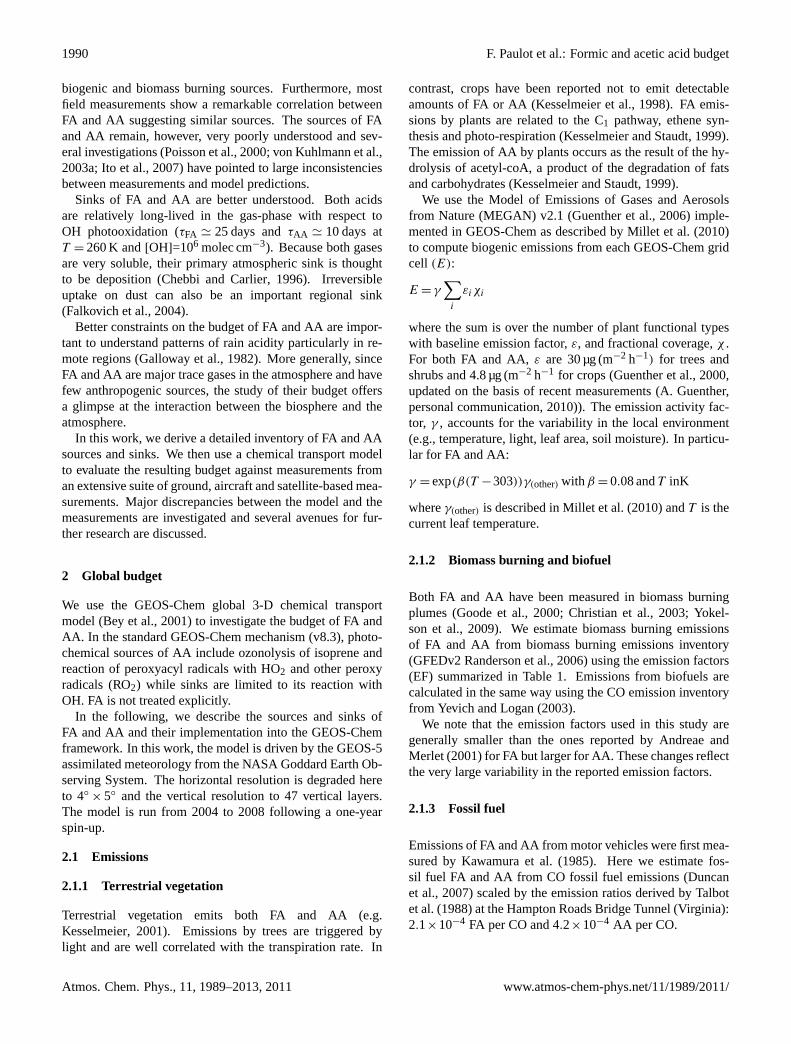
Abstract. We present a detailed budget of formic and aceticacids, two of the most abundant trace gases in the atmo-sphere. Our bottom-up estimate of the global source offormic and acetic acids are∼1200 and∼1400 Gmol yr−1,dominated by photochemical oxidation of biogenic volatileorganic compounds, in particular isoprene. Their sinksare dominated by wet and dry deposition. We use theGEOS-Chem chemical transport model to evaluate this bud-get against an extensive suite of measurements from ground,ship and satellite-based Fourier transform spectrometers, aswell as from several aircraft campaigns over North Amer-ica. The model captures the seasonality of formic and aceticacids well but generally underestimates their concentration,particularly in the Northern midlatitudes. We infer that thesource of both carboxylic acids may be up to 50% greaterthan our estimate and report evidence for a long-lived miss-ing secondary source of carboxylic acids that may be asso-ciated with the aging of organic aerosols. Vertical profiles
Correspondence to:F. Paulot([email protected])
of formic acid in the upper troposphere support a negativetemperature dependence of the reaction between formic acidand the hydroxyl radical as suggested by several theoreticalstudies.
1 Introduction
Formic (HCOOH, hereafter FA) and acetic (CH3COOH,hereafter AA) acids are among the most abundant and ubiq-uitous trace gases in the atmosphere. They have been de-tected in remote, rural, polar, marine and urban environmentsin the gas-phase as well as in clouds and in aerosols (Keeneand Galloway, 1988; Chebbi and Carlier, 1996; Khare et al.,1999).
Sources of FA and AA include direct emissions frombiomass burning, biofuel, fossil fuel, soil, vegetation, as wellas secondary production from gas-phase and aqueous pho-tochemistry (Chebbi and Carlier, 1996; Khare et al., 1999).Measurements of the isotopic composition of FA and AAhave shown that they are primarily composed of moderncarbon (Glasius et al., 2000, 2001), consistent with major
Published by Copernicus Publications on behalf of the European Geosciences Union.
1990 F. Paulot et al.: Formic and acetic acid budget
biogenic and biomass burning sources. Furthermore, mostfield measurements show a remarkable correlation betweenFA and AA suggesting similar sources. The sources of FAand AA remain, however, very poorly understood and sev-eral investigations (Poisson et al., 2000; von Kuhlmann et al.,2003a; Ito et al., 2007) have pointed to large inconsistenciesbetween measurements and model predictions.
Sinks of FA and AA are better understood. Both acidsare relatively long-lived in the gas-phase with respect toOH photooxidation (τFA ' 25 days andτAA ' 10 days atT = 260 K and[OH]=106 molec cm−3). Because both gasesare very soluble, their primary atmospheric sink is thoughtto be deposition (Chebbi and Carlier, 1996). Irreversibleuptake on dust can also be an important regional sink(Falkovich et al., 2004).
Better constraints on the budget of FA and AA are impor-tant to understand patterns of rain acidity particularly in re-mote regions (Galloway et al., 1982). More generally, sinceFA and AA are major trace gases in the atmosphere and havefew anthropogenic sources, the study of their budget offersa glimpse at the interaction between the biosphere and theatmosphere.
In this work, we derive a detailed inventory of FA and AAsources and sinks. We then use a chemical transport modelto evaluate the resulting budget against measurements froman extensive suite of ground, aircraft and satellite-based mea-surements. Major discrepancies between the model and themeasurements are investigated and several avenues for fur-ther research are discussed.
2 Global budget
We use the GEOS-Chem global 3-D chemical transportmodel (Bey et al., 2001) to investigate the budget of FA andAA. In the standard GEOS-Chem mechanism (v8.3), photo-chemical sources of AA include ozonolysis of isoprene andreaction of peroxyacyl radicals with HO2 and other peroxyradicals (RO2) while sinks are limited to its reaction withOH. FA is not treated explicitly.
In the following, we describe the sources and sinks ofFA and AA and their implementation into the GEOS-Chemframework. In this work, the model is driven by the GEOS-5assimilated meteorology from the NASA Goddard Earth Ob-serving System. The horizontal resolution is degraded hereto 4◦
× 5◦ and the vertical resolution to 47 vertical layers.The model is run from 2004 to 2008 following a one-yearspin-up.
2.1 Emissions
2.1.1 Terrestrial vegetation
Terrestrial vegetation emits both FA and AA (e.g.Kesselmeier, 2001). Emissions by trees are triggered bylight and are well correlated with the transpiration rate. In
contrast, crops have been reported not to emit detectableamounts of FA or AA (Kesselmeier et al., 1998). FA emis-sions by plants are related to the C1 pathway, ethene syn-thesis and photo-respiration (Kesselmeier and Staudt, 1999).The emission of AA by plants occurs as the result of the hy-drolysis of acetyl-coA, a product of the degradation of fatsand carbohydrates (Kesselmeier and Staudt, 1999).
We use the Model of Emissions of Gases and Aerosolsfrom Nature (MEGAN) v2.1 (Guenther et al., 2006) imple-mented in GEOS-Chem as described byMillet et al. (2010)to compute biogenic emissions from each GEOS-Chem gridcell (E):
E = γ∑
i
εiχi
where the sum is over the number of plant functional typeswith baseline emission factor,ε, and fractional coverage,χ .For both FA and AA,ε are 30 µg (m−2 h−1) for trees andshrubs and 4.8 µg (m−2 h−1 for crops (Guenther et al., 2000,updated on the basis of recent measurements (A. Guenther,personal communication, 2010)). The emission activity fac-tor, γ , accounts for the variability in the local environment(e.g., temperature, light, leaf area, soil moisture). In particu-lar for FA and AA:
γ = exp(β(T −303))γ(other) with β = 0.08 andT inK
whereγ(other) is described inMillet et al. (2010) andT is thecurrent leaf temperature.
2.1.2 Biomass burning and biofuel
Both FA and AA have been measured in biomass burningplumes (Goode et al., 2000; Christian et al., 2003; Yokel-son et al., 2009). We estimate biomass burning emissionsof FA and AA from biomass burning emissions inventory(GFEDv2Randerson et al., 2006) using the emission factors(EF) summarized in Table1. Emissions from biofuels arecalculated in the same way using the CO emission inventoryfrom Yevich and Logan(2003).
We note that the emission factors used in this study aregenerally smaller than the ones reported byAndreae andMerlet(2001) for FA but larger for AA. These changes reflectthe very large variability in the reported emission factors.
2.1.3 Fossil fuel
Emissions of FA and AA from motor vehicles were first mea-sured byKawamura et al.(1985). Here we estimate fos-sil fuel FA and AA from CO fossil fuel emissions (Duncanet al., 2007) scaled by the emission ratios derived byTalbotet al.(1988) at the Hampton Roads Bridge Tunnel (Virginia):2.1×10⁻⁴ FA per CO and 4.2×10⁻⁴ AA per CO.
Atmos. Chem. Phys., 11, 1989–2013, 2011 www.atmos-chem-phys.net/11/1989/2011/
F. Paulot et al.: Formic and acetic acid budget 1991
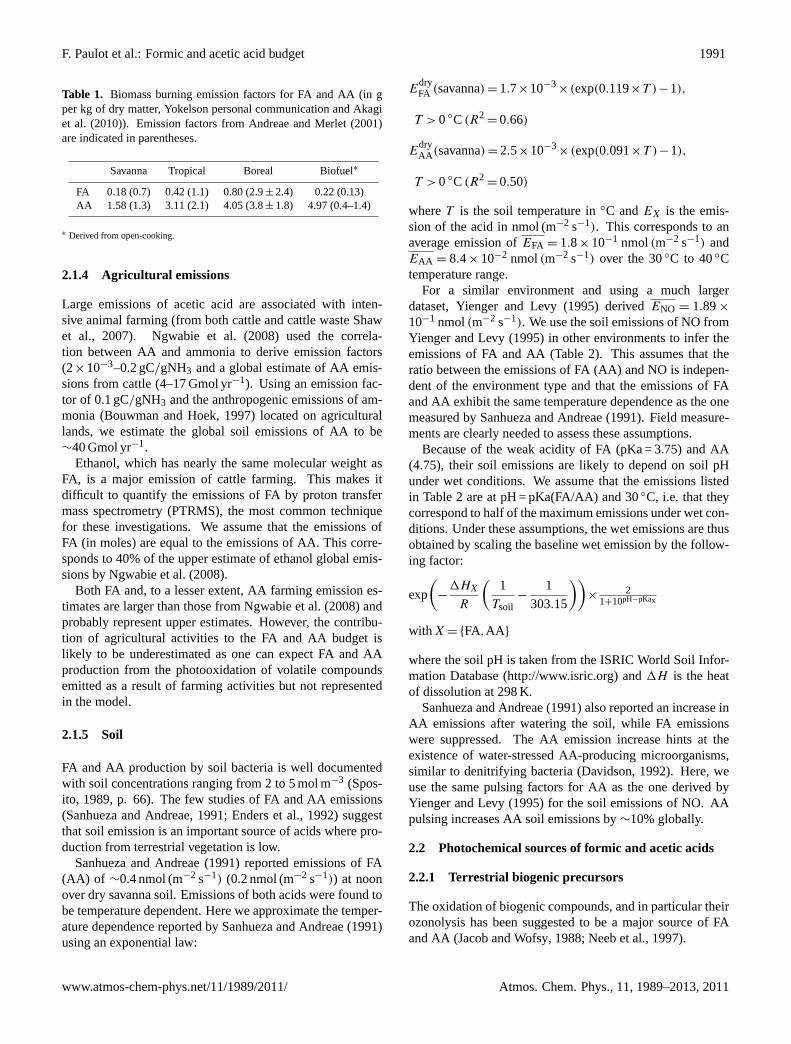
Table 1. Biomass burning emission factors for FA and AA (in gper kg of dry matter, Yokelson personal communication andAkagiet al. (2010)). Emission factors fromAndreae and Merlet(2001)are indicated in parentheses.
Savanna Tropical Boreal Biofuel∗
FA 0.18 (0.7) 0.42 (1.1) 0.80 (2.9± 2.4) 0.22 (0.13)AA 1.58 (1.3) 3.11 (2.1) 4.05 (3.8± 1.8) 4.97 (0.4–1.4)
∗ Derived from open-cooking.
2.1.4 Agricultural emissions
Large emissions of acetic acid are associated with inten-sive animal farming (from both cattle and cattle wasteShawet al., 2007). Ngwabie et al.(2008) used the correla-tion between AA and ammonia to derive emission factors(2×10⁻³–0.2 gC/gNH3 and a global estimate of AA emis-sions from cattle (4–17 Gmol yr−1). Using an emission fac-tor of 0.1 gC/gNH3 and the anthropogenic emissions of am-monia (Bouwman and Hoek, 1997) located on agriculturallands, we estimate the global soil emissions of AA to be∼40 Gmol yr−1.
Ethanol, which has nearly the same molecular weight asFA, is a major emission of cattle farming. This makes itdifficult to quantify the emissions of FA by proton transfermass spectrometry (PTRMS), the most common techniquefor these investigations. We assume that the emissions ofFA (in moles) are equal to the emissions of AA. This corre-sponds to 40% of the upper estimate of ethanol global emis-sions byNgwabie et al.(2008).
Both FA and, to a lesser extent, AA farming emission es-timates are larger than those fromNgwabie et al.(2008) andprobably represent upper estimates. However, the contribu-tion of agricultural activities to the FA and AA budget islikely to be underestimated as one can expect FA and AAproduction from the photooxidation of volatile compoundsemitted as a result of farming activities but not representedin the model.
2.1.5 Soil
FA and AA production by soil bacteria is well documentedwith soil concentrations ranging from 2 to 5 mol m−3 (Spos-ito, 1989, p. 66). The few studies of FA and AA emissions(Sanhueza and Andreae, 1991; Enders et al., 1992) suggestthat soil emission is an important source of acids where pro-duction from terrestrial vegetation is low.
Sanhueza and Andreae(1991) reported emissions of FA(AA) of ∼0.4 nmol (m−2 s−1) (0.2 nmol (m−2 s−1)) at noonover dry savanna soil. Emissions of both acids were found tobe temperature dependent. Here we approximate the temper-ature dependence reported bySanhueza and Andreae(1991)using an exponential law:
EdryFA (savanna) = 1.7×10⁻³
×(exp(0.119×T )−1),
T > 0◦C(R2= 0.66)
EdryAA (savanna) = 2.5×10⁻³
×(exp(0.091×T )−1),
T > 0◦C(R2= 0.50)
whereT is the soil temperature in◦C andEX is the emis-sion of the acid in nmol (m−2 s−1). This corresponds to anaverage emission ofEFA = 1.8× 10⁻¹ nmol(m−2 s−1) andEAA = 8.4× 10⁻² nmol(m−2 s−1) over the 30◦C to 40◦Ctemperature range.
For a similar environment and using a much largerdataset,Yienger and Levy(1995) derived ENO = 1.89×
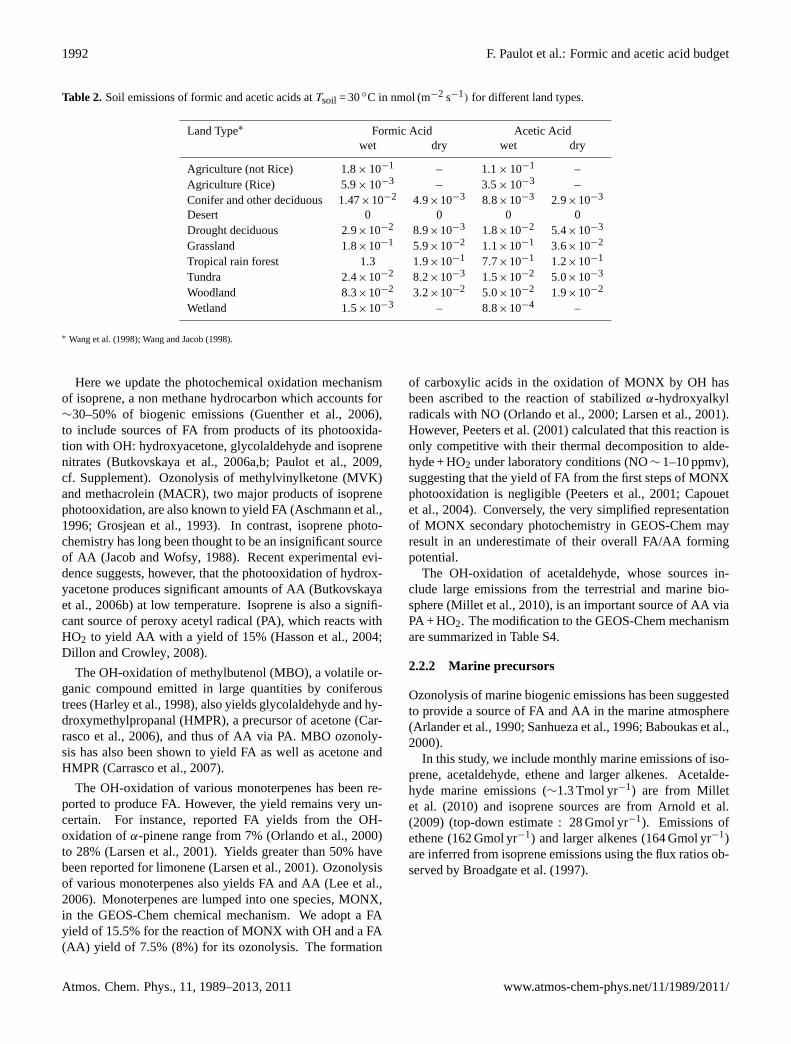
10−1 nmol(m−2 s−1). We use the soil emissions of NO fromYienger and Levy(1995) in other environments to infer theemissions of FA and AA (Table2). This assumes that theratio between the emissions of FA (AA) and NO is indepen-dent of the environment type and that the emissions of FAand AA exhibit the same temperature dependence as the onemeasured bySanhueza and Andreae(1991). Field measure-ments are clearly needed to assess these assumptions.
Because of the weak acidity of FA (pKa = 3.75) and AA(4.75), their soil emissions are likely to depend on soil pHunder wet conditions. We assume that the emissions listedin Table2 are at pH = pKa(FA/AA) and 30◦C, i.e. that theycorrespond to half of the maximum emissions under wet con-ditions. Under these assumptions, the wet emissions are thusobtained by scaling the baseline wet emission by the follow-ing factor:
exp
(−
1HX
R
(1
Tsoil−
1
303.15
))×
21+10pH−pKax
with X = {FA,AA}
where the soil pH is taken from the ISRIC World Soil Infor-mation Database (http://www.isric.org) and1H is the heatof dissolution at 298 K.
Sanhueza and Andreae(1991) also reported an increase inAA emissions after watering the soil, while FA emissionswere suppressed. The AA emission increase hints at theexistence of water-stressed AA-producing microorganisms,similar to denitrifying bacteria (Davidson, 1992). Here, weuse the same pulsing factors for AA as the one derived byYienger and Levy(1995) for the soil emissions of NO. AApulsing increases AA soil emissions by∼10% globally.
2.2 Photochemical sources of formic and acetic acids
2.2.1 Terrestrial biogenic precursors
The oxidation of biogenic compounds, and in particular theirozonolysis has been suggested to be a major source of FAand AA (Jacob and Wofsy, 1988; Neeb et al., 1997).
www.atmos-chem-phys.net/11/1989/2011/ Atmos. Chem. Phys., 11, 1989–2013, 2011
1992 F. Paulot et al.: Formic and acetic acid budget
Table 2. Soil emissions of formic and acetic acids atTsoil = 30◦C in nmol (m−2 s−1) for different land types.
Land Type∗ Formic Acid Acetic Acidwet dry wet dry
Agriculture (not Rice) 1.8× 10⁻¹ – 1.1× 10⁻¹ –Agriculture (Rice) 5.9× 10⁻³ – 3.5× 10⁻³ –Conifer and other deciduous 1.47×10⁻² 4.9×10⁻³ 8.8×10⁻³ 2.9×10⁻³
Desert 0 0 0 0Drought deciduous 2.9×10⁻² 8.9×10⁻³ 1.8×10⁻² 5.4×10⁻³
Grassland 1.8×10⁻¹ 5.9×10⁻² 1.1×10⁻¹ 3.6×10⁻²
Tropical rain forest 1.3 1.9×10⁻¹ 7.7×10⁻¹ 1.2×10⁻¹
Tundra 2.4×10⁻² 8.2×10⁻³ 1.5×10⁻² 5.0×10⁻³
Woodland 8.3×10⁻² 3.2×10⁻² 5.0×10⁻² 1.9×10⁻²
Wetland 1.5×10⁻³ – 8.8×10⁻⁴ –
∗ Wang et al.(1998); Wang and Jacob(1998).
Here we update the photochemical oxidation mechanismof isoprene, a non methane hydrocarbon which accounts for∼30–50% of biogenic emissions (Guenther et al., 2006),to include sources of FA from products of its photooxida-tion with OH: hydroxyacetone, glycolaldehyde and isoprenenitrates (Butkovskaya et al., 2006a,b; Paulot et al., 2009,cf. Supplement). Ozonolysis of methylvinylketone (MVK)and methacrolein (MACR), two major products of isoprenephotooxidation, are also known to yield FA (Aschmann et al.,1996; Grosjean et al., 1993). In contrast, isoprene photo-chemistry has long been thought to be an insignificant sourceof AA (Jacob and Wofsy, 1988). Recent experimental evi-dence suggests, however, that the photooxidation of hydrox-yacetone produces significant amounts of AA (Butkovskayaet al., 2006b) at low temperature. Isoprene is also a signifi-cant source of peroxy acetyl radical (PA), which reacts withHO2 to yield AA with a yield of 15% (Hasson et al., 2004;Dillon and Crowley, 2008).
The OH-oxidation of methylbutenol (MBO), a volatile or-ganic compound emitted in large quantities by coniferoustrees (Harley et al., 1998), also yields glycolaldehyde and hy-droxymethylpropanal (HMPR), a precursor of acetone (Car-rasco et al., 2006), and thus of AA via PA. MBO ozonoly-sis has also been shown to yield FA as well as acetone andHMPR (Carrasco et al., 2007).
The OH-oxidation of various monoterpenes has been re-ported to produce FA. However, the yield remains very un-certain. For instance, reported FA yields from the OH-oxidation ofα-pinene range from 7% (Orlando et al., 2000)to 28% (Larsen et al., 2001). Yields greater than 50% havebeen reported for limonene (Larsen et al., 2001). Ozonolysisof various monoterpenes also yields FA and AA (Lee et al.,2006). Monoterpenes are lumped into one species, MONX,in the GEOS-Chem chemical mechanism. We adopt a FAyield of 15.5% for the reaction of MONX with OH and a FA(AA) yield of 7.5% (8%) for its ozonolysis. The formation
of carboxylic acids in the oxidation of MONX by OH hasbeen ascribed to the reaction of stabilizedα-hydroxyalkylradicals with NO (Orlando et al., 2000; Larsen et al., 2001).However,Peeters et al.(2001) calculated that this reaction isonly competitive with their thermal decomposition to alde-hyde + HO2 under laboratory conditions (NO∼ 1–10 ppmv),suggesting that the yield of FA from the first steps of MONXphotooxidation is negligible (Peeters et al., 2001; Capouetet al., 2004). Conversely, the very simplified representationof MONX secondary photochemistry in GEOS-Chem mayresult in an underestimate of their overall FA/AA formingpotential.
The OH-oxidation of acetaldehyde, whose sources in-clude large emissions from the terrestrial and marine bio-sphere (Millet et al., 2010), is an important source of AA viaPA + HO2. The modification to the GEOS-Chem mechanismare summarized in Table S4.
2.2.2 Marine precursors
Ozonolysis of marine biogenic emissions has been suggestedto provide a source of FA and AA in the marine atmosphere(Arlander et al., 1990; Sanhueza et al., 1996; Baboukas et al.,2000).
In this study, we include monthly marine emissions of iso-prene, acetaldehyde, ethene and larger alkenes. Acetalde-hyde marine emissions (∼1.3 Tmol yr−1) are from Milletet al. (2010) and isoprene sources are fromArnold et al.(2009) (top-down estimate : 28 Gmol yr−1). Emissions ofethene (162 Gmol yr−1) and larger alkenes (164 Gmol yr−1)are inferred from isoprene emissions using the flux ratios ob-served byBroadgate et al.(1997).
Atmos. Chem. Phys., 11, 1989–2013, 2011 www.atmos-chem-phys.net/11/1989/2011/
F. Paulot et al.: Formic and acetic acid budget 1993
2.2.3 Anthropogenic/biomass burning precursors
In addition to fresh emissions from biomass burning or an-thropogenic sources, production of FA and AA within fireplumes has been measured in many (Goode et al., 2000; Gaoet al., 2003; Yokelson et al., 2003; Herndon et al., 2007) butnot all instances (de Gouw et al., 2006). Here, we include for-mation of FA and AA from the photooxidation of acetylene(Hatakeyama et al., 1986), ethene and propene (and higheralkenes).
Anthropogenic inventories for CO are described byBeyet al. (2001) and biofuel emissions byYevich and Logan(2003). Recent updates of these inventories are described byMillet et al. (2010). Emissions and photooxidation of acety-lene, propene and ethene, which are precursors of FA andAA, were recently included or updated byFu et al.(2008)in the GEOS-Chem model. In addition we include biomassburning emission of hydroxyacetone and glycolaldehyde (Fuet al., 2008), two precursors of FA and AA.
2.3 Sources not treated
Graedel and Eisner(1988) estimate that emissions of FAfrom formicine ants could exceed motor vehicle and biomassburning emissions. The overall contribution of formicineants to the FA budget is, however, likely to be limited (Chebbiand Carlier, 1996) but may be important in ecosystems whereformicine ants are abundant (e.g., tropical forests).
Aqueous phase oxidation of formaldehyde within cloudshas been proposed to be a non-negligible source of FA in re-mote environments (Chameides, 1984; Jacob, 1986). How-everLelieveld and Crutzen(1991) argued that the very fastaqueous oxidation of FA would greatly diminish the role ofcloud chemistry as a source of FA.
The source of FA and AA from enol photochemistry isnot included in the model (Archibald et al., 2007). Enol areknown intermediates in combustion (Taatjes et al., 2005) andcould originate from keto-enol tautomerizations catalyzed bycarboxylic acids (da Silva, 2010). However, the importanceof these processes as a source of FA and AA is poorly knownand additional experimental constraints are needed to includethese processes in a global model.
2.4 Sinks
2.4.1 Photochemical
FA reacts with OH primarily via abstraction of the acidic hy-drogen with a recommended temperature independent rate of4.5×10−13cm3 (molec s−1) (Atkinson et al., 2006). The un-certainty of this rate coefficient is relatively large (1log=
0.15 at 298 K (Atkinson et al., 2006)) because of experimen-tal challenges (dimerization of FA). To our knowledge, thisrate coefficient has not been determined below 298 K. The-oretical calculations suggest, however, that the acidic (R1),
dominant at ambient temperature, and formyl (R2) channelshave opposite temperature dependence (Galano et al., 2002;Sun and Saeys, 2008).
HCOOH+OH → HCOO·+H2O (R1)
→·COOH+H2O (R2)
This results in a relatively “flat” temperature profile near298 K where the laboratory investigations were conductedbut a strong negative temperature dependence at lower tem-perature. This will be examined in Sect.4.3.
In contrast, the AA reaction with OH has been studiedover a much wider temperature range. The reaction fol-lows a mechanism similar to FA (Butkovskaya et al., 2004)and exhibits a negative activation energy. The tempera-ture dependence remains uncertain and we use the IUPACrecommendation, 4.2× 10⁻¹⁴exp(855/T ) cm3 (molec s−1)
(1log= 0.15 at 298 K) (Atkinson et al., 2006), which is inexcellent agreement with the two most recent determinationsof this reaction rate coefficient (Butkovskaya et al., 2004;Huang et al., 2009).
2.4.2 Dry deposition
Dry deposition of oxidants and water soluble species is com-puted using a resistance-in-series model based on the for-mulation ofWesely(1989) implemented in GEOS-Chem byWang and Jacob(1998). The dry deposition velocities ofFA and AA depend on surface momentum and sensible heatfluxes, temperature, solar radiation as well as the effectiveHenry’s constant of FA and AA (H), which are calculatedat a pH of 7, a reasonable assumption for most surfaces(Wesely, 1989). We use the median of the reported mea-surements: HFA = 5400 M atm−1, HAA = 5350 M atm−1
(Sander, 1999).
2.4.3 Wet deposition
Wet deposition is thought to be the most important sink of FAand AA (Chebbi and Carlier, 1996). The GEOS-Chem wetdeposition scheme includes scavenging of soluble tracers inconvective updrafts, as well as rainout and washout of solu-ble tracers (Mari et al., 2000; Liu et al., 2001). We assume arain pH of 5 and that the acids are fully retained at freezing,as with HNO3.
We modify the GEOS-Chem deposition scheme to in-clude the uptake of FA and AA in ice clouds. Briefly, as-suming equilibrium between the ice surface concentration[X]s (molec cm−3) and the gas-phase concentration[X]g(molec cm−3), non-dissociative uptake and non competitiveadsorption,[X]s can be related to the surface area of ice (Sice(cm2 cm−3)), the maximum number of molecules which canbe adsorbed on the surface (Nmax (molecules cm−2)) and thefractional coverage (θ ) by:
www.atmos-chem-phys.net/11/1989/2011/ Atmos. Chem. Phys., 11, 1989–2013, 2011
1994 F. Paulot et al.: Formic and acetic acid budget
[X]s= SiceθNmax
θ is given by the Hill-Langmuir equation:
θ =
KNmax
[X]g
1+K
Nmax[X]g
whereK (cm) is a temperature dependent partition coeffi-cient:K = α×exp(β/T ) with αFA = 5.8×10⁻¹¹ cm,αAA =
1.0×10⁻¹⁰ cm andβFA = 6500 K,βAA = 6600 K (Marecalet al., 2010; Crowley et al., 2010).
2.4.4 Dust
Field measurements have identified formate and acetate oncollected mineral aerosols (Lee et al., 2000, 2002; Russellet al., 2002; Falkovich et al., 2004). Falkovich et al.(2004)found that formate and acetate were the most abundant monocarboxylic anions in dust particles and that their uptake wasfacilitated at higher relative humidity (RH).
Consistent with these observations, efficient uptake of car-boxylic acids on various components of dust (Usher et al.,2003) has been measured: FA on clay (montmorillonite)(Hatch et al., 2007) and CaCO3 (Al-Hosney et al., 2005); AAon SiO2, α−Al2O3, α−Fe2O3 (Carlos-Cuellar et al., 2003)and CaCO3 (Prince et al., 2008). Increased water enhance thecapacity of the mineral dust to take up carboxylic acids (Al-Hosney et al., 2005; Hatch et al., 2007; Prince et al., 2008)but does not change the accommodation coefficient (γ ) sig-nificantly.
Surface saturation needs to be explicitly treated as itseverely reduces the efficiency of this removal mechanism(Hatch et al., 2007). Accounting for the saturation limit,Hatch et al.(2007) estimated that up to 40% of gaseous AAcould be removed during a dust storm.
In GEOS-Chem, dust is carried into four different sizebins. Here we use emissions from the dust entrainmentand deposition (DEAD) scheme (Zender et al., 2003; Fair-lie et al., 2007). FromHatch et al.(2007), we useγFA = 4×
10−4 andγAA = 3×10⁻⁴ for RH< 30%; γFA = 5.4×10⁻⁴
and γAA = 14× 10−4 for RH≥ 30%. The dependence ofsurface saturation (S in mg(acid)/g(dust)) on RH is approx-imated by fitting an exponential toHatch et al.(2007) mea-surements:SFA = 2+4.7×(1−exp(−8.6×10⁻³
×RH)) andSAA = 2+ 5.8× (1− exp(−2.6× 10⁻²
× RH)). Heteroge-neous degradation of FA (Al-Hosney et al., 2005) and AA(Prince et al., 2008) to CO2 is not represented but may fur-ther enhance the uptake of FA and AA.
2.5 Simulated distribution
2.5.1 Formic acid
The total source of formic acid in the model is about1200 Gmol yr−1 (Table3). This is about twice as large as pre-vious estimates (Ito et al., 2007; von Kuhlmann et al., 2003a).
Modeled FA sources are dominated by photochemical pro-duction from the oxidation of biogenic precursors. More thana third of the FA photochemical source stems from glyco-laldehyde and hydroxyacetone via the Butkovskaya’s mech-anism (Butkovskaya et al., 2006a,b). These sources werenot included in previous estimates and account for much ofthe difference (Table3). Other important sources includeisoprene ozonolysis (14% of the photochemical production)and monoterpenes photooxidation (6%). Acetylene is thedominant non-biogenic precursor (6.5%).
Over three quarters of FA photochemical production is de-rived from isoprene photooxidation, many aspects of whichremain uncertain. In particular, it is worth noting that themechanism recently proposed byPeeters et al.(2009) re-sults in large modifications of the distribution of isoprenephotooxidation products determined from chamber experi-ments (including hydroxyacetone and glycolaldehyde). Ifcorrect, this could significantly affect the modeled budget ofFA. Nevertheless, despite our incomplete knowledge of iso-prene photooxidation, its representation in the GEOS-Chemmechanism is much more explicit than for most other bio-genic volatile organic compounds. This probably results inan overestimation of the importance of isoprene as a precur-sor for FA as the photooxidation of other biogenic volatileorganic compounds, such as the different monoterpenes, ismuch more simplified.
Direct emissions of FA are small (∼15%) and dominatedby terrestrial vegetation and biomass burning. Emissionsfrom vehicles do not contribute significantly to the mod-eled FA budget, consistent with observations fromde Gouwet al. (2005). Our modeled FA budget suggests, however,that more than 90% of FA is composed of modern carbonglobally (Table S2). This percentage is lower in the north-ern mid and high latitudes, though FA is still predicted to belargely dominated by modern sources (Table S2), consistentwith isotope studies in Europe (Glasius et al., 2001).
The enhancement in FA (1FA) in aged biomass burningplumes and its correlation with1CO has frequently beenused to derive emission factors from ground or satellite basedobservations (e.g.Paton-Walsh et al., 2005; Rinsland et al.,2007; Gonzalez Abad et al., 2009). Our study suggests thatFA is rapidly removed from the boundary layer by wet anddry deposition, so that little FA emitted or formed in theboundary layer is advected over long distances or transportedinto the free troposphere. Therefore1FA observed in agedplumes is unlikely to represent direct emissions, as com-monly assumed, but rather the production of FA from thephotooxidation of biomass burning emitted precursors. Thus,1FA cannot be used, in general, to derive emission factorsfar away from emission regions.
FA sinks are dominated by depositions. Dust is not a sig-nificant sink globally but can result in a large decrease ofacids in the vicinity of large deserts.
The modeled atmospheric lifetime of FA is 3.2 days, con-sistent with previous estimates (Chebbi and Carlier, 1996).
Atmos. Chem. Phys., 11, 1989–2013, 2011 www.atmos-chem-phys.net/11/1989/2011/
F. Paulot et al.: Formic and acetic acid budget 1995
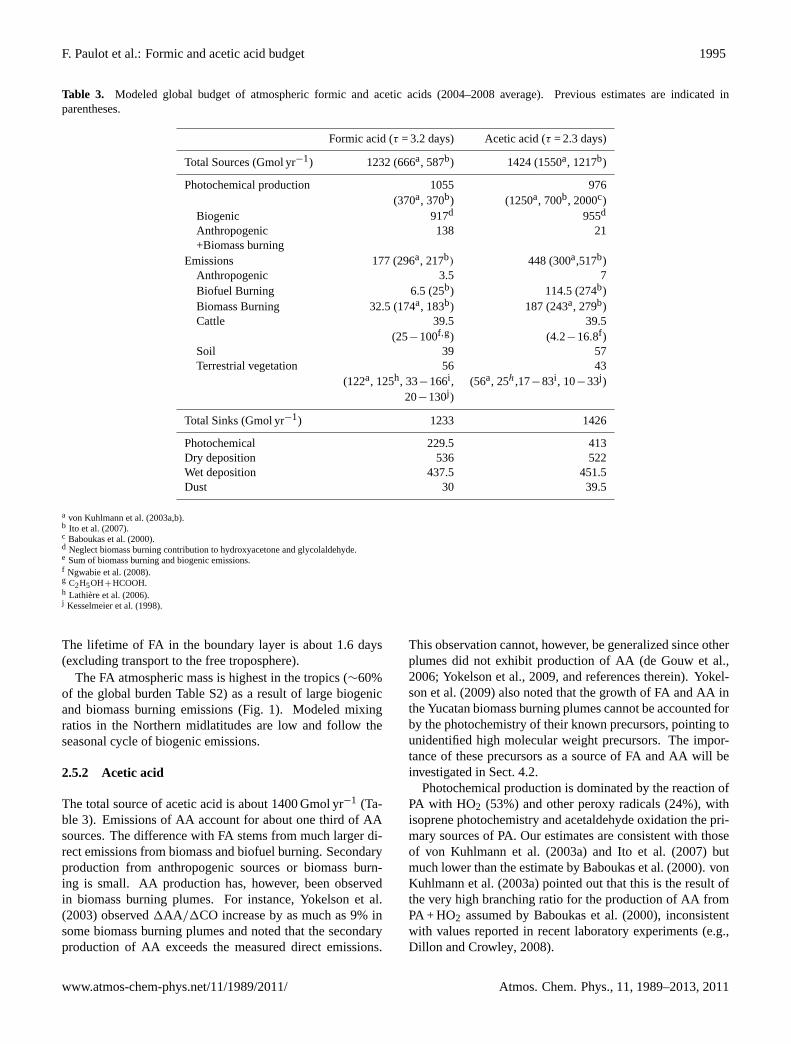
Table 3. Modeled global budget of atmospheric formic and acetic acids (2004–2008 average). Previous estimates are indicated inparentheses.
Formic acid (τ = 3.2 days) Acetic acid (τ = 2.3 days)
Total Sources (Gmol yr−1) 1232 (666a, 587b) 1424 (1550a, 1217b)
Photochemical production 1055 976(370a, 370b) (1250a, 700b, 2000c)
Biogenic 917d 955d
Anthropogenic 138 21+Biomass burning
Emissions 177 (296a, 217b) 448 (300a,517b)Anthropogenic 3.5 7Biofuel Burning 6.5 (25b) 114.5 (274b)Biomass Burning 32.5 (174a, 183b) 187 (243a, 279b)Cattle 39.5 39.5
(25−100f,g) (4.2−16.8f )Soil 39 57Terrestrial vegetation 56 43
(122a, 125h, 33−166i , (56a, 25h,17−83i , 10−33j )20−130j )
Total Sinks (Gmol yr−1) 1233 1426
Photochemical 229.5 413Dry deposition 536 522Wet deposition 437.5 451.5Dust 30 39.5
a von Kuhlmann et al.(2003a,b).b Ito et al.(2007).c Baboukas et al.(2000).d Neglect biomass burning contribution to hydroxyacetone and glycolaldehyde.e Sum of biomass burning and biogenic emissions.f Ngwabie et al.(2008).g C2H5OH+HCOOH.h Lathiere et al.(2006).j Kesselmeier et al.(1998).
The lifetime of FA in the boundary layer is about 1.6 days(excluding transport to the free troposphere).
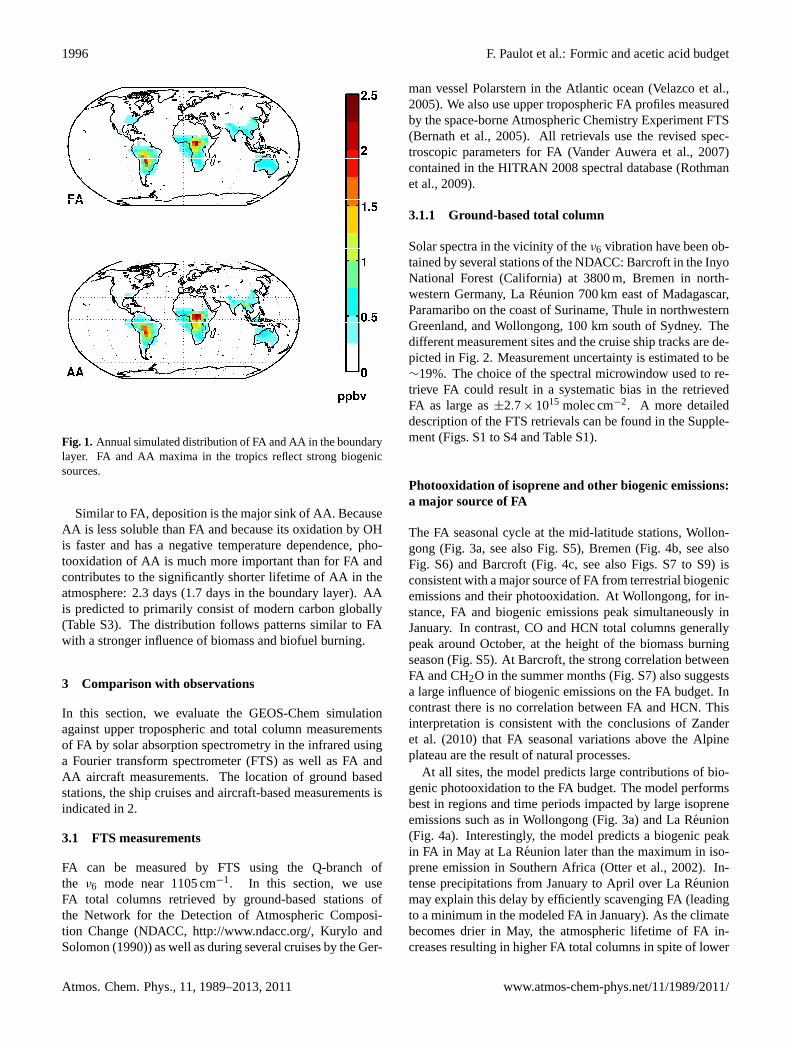
The FA atmospheric mass is highest in the tropics (∼60%of the global burden Table S2) as a result of large biogenicand biomass burning emissions (Fig.1). Modeled mixingratios in the Northern midlatitudes are low and follow theseasonal cycle of biogenic emissions.
2.5.2 Acetic acid
The total source of acetic acid is about 1400 Gmol yr−1 (Ta-ble 3). Emissions of AA account for about one third of AAsources. The difference with FA stems from much larger di-rect emissions from biomass and biofuel burning. Secondaryproduction from anthropogenic sources or biomass burn-ing is small. AA production has, however, been observedin biomass burning plumes. For instance,Yokelson et al.(2003) observed1AA/1CO increase by as much as 9% insome biomass burning plumes and noted that the secondaryproduction of AA exceeds the measured direct emissions.
This observation cannot, however, be generalized since otherplumes did not exhibit production of AA (de Gouw et al.,2006; Yokelson et al., 2009, and references therein).Yokel-son et al.(2009) also noted that the growth of FA and AA inthe Yucatan biomass burning plumes cannot be accounted forby the photochemistry of their known precursors, pointing tounidentified high molecular weight precursors. The impor-tance of these precursors as a source of FA and AA will beinvestigated in Sect.4.2.
Photochemical production is dominated by the reaction ofPA with HO2 (53%) and other peroxy radicals (24%), withisoprene photochemistry and acetaldehyde oxidation the pri-mary sources of PA. Our estimates are consistent with thoseof von Kuhlmann et al.(2003a) and Ito et al. (2007) butmuch lower than the estimate byBaboukas et al.(2000). vonKuhlmann et al.(2003a) pointed out that this is the result ofthe very high branching ratio for the production of AA fromPA + HO2 assumed byBaboukas et al.(2000), inconsistentwith values reported in recent laboratory experiments (e.g.,Dillon and Crowley, 2008).
www.atmos-chem-phys.net/11/1989/2011/ Atmos. Chem. Phys., 11, 1989–2013, 2011
1996 F. Paulot et al.: Formic and acetic acid budget
Fig. 1. Annual simulated distribution of FA and AA in the boundarylayer. FA and AA maxima in the tropics reflect strong biogenicsources.
Similar to FA, deposition is the major sink of AA. BecauseAA is less soluble than FA and because its oxidation by OHis faster and has a negative temperature dependence, pho-tooxidation of AA is much more important than for FA andcontributes to the significantly shorter lifetime of AA in theatmosphere: 2.3 days (1.7 days in the boundary layer). AAis predicted to primarily consist of modern carbon globally(Table S3). The distribution follows patterns similar to FAwith a stronger influence of biomass and biofuel burning.
3 Comparison with observations
In this section, we evaluate the GEOS-Chem simulationagainst upper tropospheric and total column measurementsof FA by solar absorption spectrometry in the infrared usinga Fourier transform spectrometer (FTS) as well as FA andAA aircraft measurements. The location of ground basedstations, the ship cruises and aircraft-based measurements isindicated in2.
3.1 FTS measurements
FA can be measured by FTS using the Q-branch ofthe ν6 mode near 1105 cm−1. In this section, we useFA total columns retrieved by ground-based stations ofthe Network for the Detection of Atmospheric Composi-tion Change (NDACC,http://www.ndacc.org/, Kurylo andSolomon(1990)) as well as during several cruises by the Ger-
man vessel Polarstern in the Atlantic ocean (Velazco et al.,2005). We also use upper tropospheric FA profiles measuredby the space-borne Atmospheric Chemistry Experiment FTS(Bernath et al., 2005). All retrievals use the revised spec-troscopic parameters for FA (Vander Auwera et al., 2007)contained in the HITRAN 2008 spectral database (Rothmanet al., 2009).
3.1.1 Ground-based total column
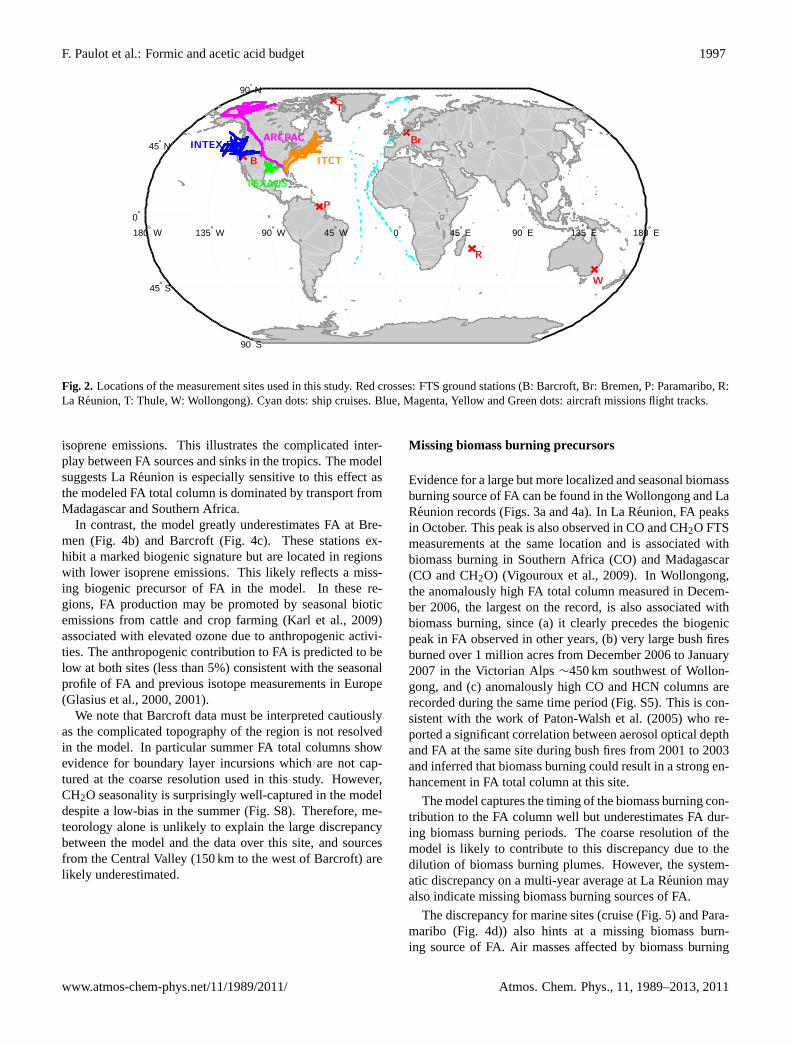
Solar spectra in the vicinity of theν6 vibration have been ob-tained by several stations of the NDACC: Barcroft in the InyoNational Forest (California) at 3800 m, Bremen in north-western Germany, La Reunion 700 km east of Madagascar,Paramaribo on the coast of Suriname, Thule in northwesternGreenland, and Wollongong, 100 km south of Sydney. Thedifferent measurement sites and the cruise ship tracks are de-picted in Fig.2. Measurement uncertainty is estimated to be∼19%. The choice of the spectral microwindow used to re-trieve FA could result in a systematic bias in the retrievedFA as large as±2.7× 10¹⁵ molec cm−2. A more detaileddescription of the FTS retrievals can be found in the Supple-ment (Figs. S1 to S4 and Table S1).
Photooxidation of isoprene and other biogenic emissions:a major source of FA
The FA seasonal cycle at the mid-latitude stations, Wollon-gong (Fig.3a, see also Fig. S5), Bremen (Fig.4b, see alsoFig. S6) and Barcroft (Fig.4c, see also Figs. S7 to S9) isconsistent with a major source of FA from terrestrial biogenicemissions and their photooxidation. At Wollongong, for in-stance, FA and biogenic emissions peak simultaneously inJanuary. In contrast, CO and HCN total columns generallypeak around October, at the height of the biomass burningseason (Fig. S5). At Barcroft, the strong correlation betweenFA and CH2O in the summer months (Fig. S7) also suggestsa large influence of biogenic emissions on the FA budget. Incontrast there is no correlation between FA and HCN. Thisinterpretation is consistent with the conclusions ofZanderet al. (2010) that FA seasonal variations above the Alpineplateau are the result of natural processes.
At all sites, the model predicts large contributions of bio-genic photooxidation to the FA budget. The model performsbest in regions and time periods impacted by large isopreneemissions such as in Wollongong (Fig.3a) and La Reunion(Fig. 4a). Interestingly, the model predicts a biogenic peakin FA in May at La Reunion later than the maximum in iso-prene emission in Southern Africa (Otter et al., 2002). In-tense precipitations from January to April over La Reunionmay explain this delay by efficiently scavenging FA (leadingto a minimum in the modeled FA in January). As the climatebecomes drier in May, the atmospheric lifetime of FA in-creases resulting in higher FA total columns in spite of lower
Atmos. Chem. Phys., 11, 1989–2013, 2011 www.atmos-chem-phys.net/11/1989/2011/
F. Paulot et al.: Formic and acetic acid budget 1997
180° W 135° W 90° W 45° W 0° 45° E 90° E 135° E 180° E
90° S
45° S
0°
45° N
90° N
B
TEXAQS
INTEX-BARCPAC
ITCT
P
Br
W
R
T
Fig. 2. Locations of the measurement sites used in this study. Red crosses: FTS ground stations (B: Barcroft, Br: Bremen, P: Paramaribo, R:La Reunion, T: Thule, W: Wollongong). Cyan dots: ship cruises. Blue, Magenta, Yellow and Green dots: aircraft missions flight tracks.
isoprene emissions. This illustrates the complicated inter-play between FA sources and sinks in the tropics. The modelsuggests La Reunion is especially sensitive to this effect asthe modeled FA total column is dominated by transport fromMadagascar and Southern Africa.
In contrast, the model greatly underestimates FA at Bre-men (Fig.4b) and Barcroft (Fig.4c). These stations ex-hibit a marked biogenic signature but are located in regionswith lower isoprene emissions. This likely reflects a miss-ing biogenic precursor of FA in the model. In these re-gions, FA production may be promoted by seasonal bioticemissions from cattle and crop farming (Karl et al., 2009)associated with elevated ozone due to anthropogenic activi-ties. The anthropogenic contribution to FA is predicted to below at both sites (less than 5%) consistent with the seasonalprofile of FA and previous isotope measurements in Europe(Glasius et al., 2000, 2001).
We note that Barcroft data must be interpreted cautiouslyas the complicated topography of the region is not resolvedin the model. In particular summer FA total columns showevidence for boundary layer incursions which are not cap-tured at the coarse resolution used in this study. However,CH2O seasonality is surprisingly well-captured in the modeldespite a low-bias in the summer (Fig. S8). Therefore, me-teorology alone is unlikely to explain the large discrepancybetween the model and the data over this site, and sourcesfrom the Central Valley (150 km to the west of Barcroft) arelikely underestimated.
Missing biomass burning precursors
Evidence for a large but more localized and seasonal biomassburning source of FA can be found in the Wollongong and LaReunion records (Figs.3a and4a). In La Reunion, FA peaksin October. This peak is also observed in CO and CH2O FTSmeasurements at the same location and is associated withbiomass burning in Southern Africa (CO) and Madagascar(CO and CH2O) (Vigouroux et al., 2009). In Wollongong,the anomalously high FA total column measured in Decem-ber 2006, the largest on the record, is also associated withbiomass burning, since (a) it clearly precedes the biogenicpeak in FA observed in other years, (b) very large bush firesburned over 1 million acres from December 2006 to January2007 in the Victorian Alps∼450 km southwest of Wollon-gong, and (c) anomalously high CO and HCN columns arerecorded during the same time period (Fig. S5). This is con-sistent with the work ofPaton-Walsh et al.(2005) who re-ported a significant correlation between aerosol optical depthand FA at the same site during bush fires from 2001 to 2003and inferred that biomass burning could result in a strong en-hancement in FA total column at this site.
The model captures the timing of the biomass burning con-tribution to the FA column well but underestimates FA dur-ing biomass burning periods. The coarse resolution of themodel is likely to contribute to this discrepancy due to thedilution of biomass burning plumes. However, the system-atic discrepancy on a multi-year average at La Reunion mayalso indicate missing biomass burning sources of FA.
The discrepancy for marine sites (cruise (Fig.5) and Para-maribo (Fig. 4d)) also hints at a missing biomass burn-ing source of FA. Air masses affected by biomass burning
www.atmos-chem-phys.net/11/1989/2011/ Atmos. Chem. Phys., 11, 1989–2013, 2011
1998 F. Paulot et al.: Formic and acetic acid budget
(a)
0
50
100
%
2004 2005 2006 2007 2008 20090
0.5
1
1.5
2
2.5
3
mol
ec/c
m2
(x10
16)
(a) Wollongong, Australia (34.5◦S, 150◦E, 20 masl)
0
50
100
%
2004 2005 2006 2007 2008 20090
1
2
3
4
5
6
7
mol
ec/c
m2
(x10
15)
(b) Thule, Greenland (76.53◦N, 68.74◦W, 220 masl)
Fig. 3: The observed seasonal cycle of FA total column (blue, lower panel) is well capturedby the model at the Wollongong site (red, lower panel) and is consistent with a strong biogenicinfluence (green, upper panel). This is not the case in the high latitude site at Thule where modelunder predicts measured FA. Upper panel : modeled contribution of biogenic sources (green :emission + photochemical production) and biomass burning (black: emissions + photochemicalproduction) to FA total column. Lower panel: modeled (red) and measured (blue) FA totalcolumn. Measurements and model are averaged over a two day time period.
24
(b)
0
50
100
%
2004 2005 2006 2007 2008 20090
0.5
1
1.5
2
2.5
3
mol
ec/c
m2
(x10
16)
(a) Wollongong, Australia (34.5◦S, 150◦E, 20 masl)
0
50
100
%
2004 2005 2006 2007 2008 20090
1
2
3
4
5
6
7
mol
ec/c
m2
(x10
15)
(b) Thule, Greenland (76.53◦N, 68.74◦W, 220 masl)
Fig. 3: The observed seasonal cycle of FA total column (blue, lower panel) is well capturedby the model at the Wollongong site (red, lower panel) and is consistent with a strong biogenicinfluence (green, upper panel). This is not the case in the high latitude site at Thule where modelunder predicts measured FA. Upper panel : modeled contribution of biogenic sources (green :emission + photochemical production) and biomass burning (black: emissions + photochemicalproduction) to FA total column. Lower panel: modeled (red) and measured (blue) FA totalcolumn. Measurements and model are averaged over a two day time period.
24
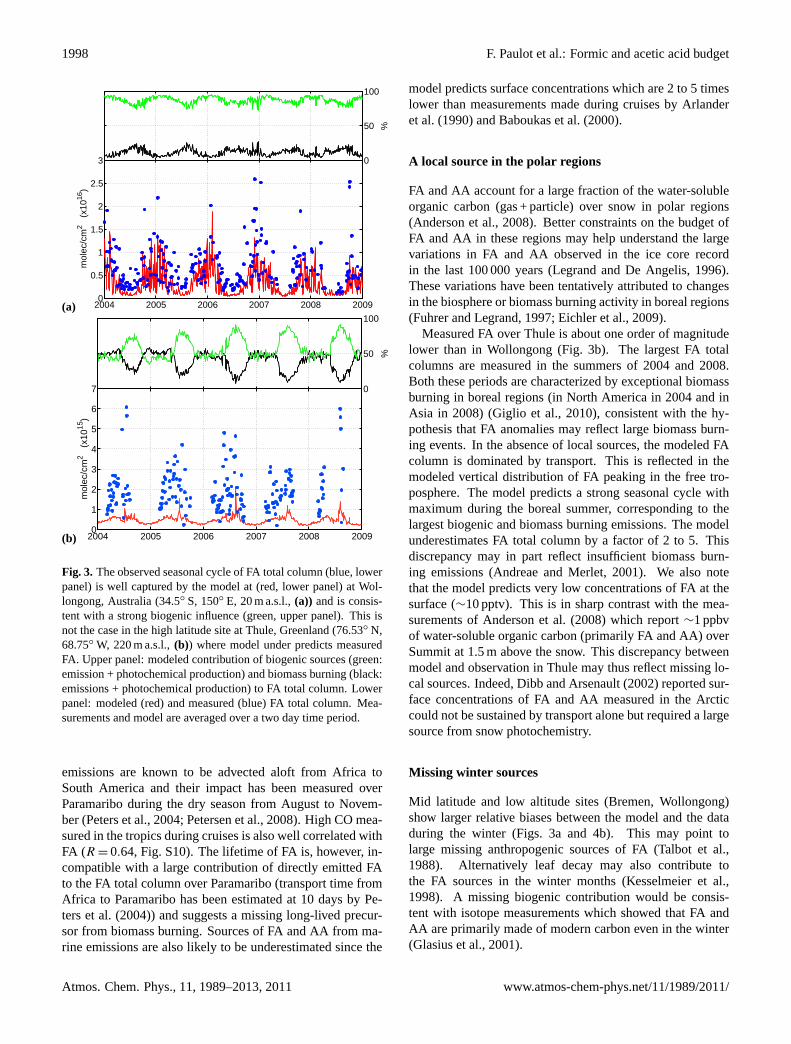
Fig. 3. The observed seasonal cycle of FA total column (blue, lowerpanel) is well captured by the model at (red, lower panel) at Wol-longong, Australia (34.5◦ S, 150◦ E, 20 m a.s.l.,(a)) and is consis-tent with a strong biogenic influence (green, upper panel). This isnot the case in the high latitude site at Thule, Greenland (76.53◦ N,68.75◦ W, 220 m a.s.l.,(b)) where model under predicts measuredFA. Upper panel: modeled contribution of biogenic sources (green:emission + photochemical production) and biomass burning (black:emissions + photochemical production) to FA total column. Lowerpanel: modeled (red) and measured (blue) FA total column. Mea-surements and model are averaged over a two day time period.
emissions are known to be advected aloft from Africa toSouth America and their impact has been measured overParamaribo during the dry season from August to Novem-ber (Peters et al., 2004; Petersen et al., 2008). High CO mea-sured in the tropics during cruises is also well correlated withFA (R = 0.64, Fig. S10). The lifetime of FA is, however, in-compatible with a large contribution of directly emitted FAto the FA total column over Paramaribo (transport time fromAfrica to Paramaribo has been estimated at 10 days byPe-ters et al.(2004)) and suggests a missing long-lived precur-sor from biomass burning. Sources of FA and AA from ma-rine emissions are also likely to be underestimated since the
model predicts surface concentrations which are 2 to 5 timeslower than measurements made during cruises byArlanderet al.(1990) andBaboukas et al.(2000).
A local source in the polar regions
FA and AA account for a large fraction of the water-solubleorganic carbon (gas + particle) over snow in polar regions(Anderson et al., 2008). Better constraints on the budget ofFA and AA in these regions may help understand the largevariations in FA and AA observed in the ice core recordin the last 100 000 years (Legrand and De Angelis, 1996).These variations have been tentatively attributed to changesin the biosphere or biomass burning activity in boreal regions(Fuhrer and Legrand, 1997; Eichler et al., 2009).
Measured FA over Thule is about one order of magnitudelower than in Wollongong (Fig.3b). The largest FA totalcolumns are measured in the summers of 2004 and 2008.Both these periods are characterized by exceptional biomassburning in boreal regions (in North America in 2004 and inAsia in 2008) (Giglio et al., 2010), consistent with the hy-pothesis that FA anomalies may reflect large biomass burn-ing events. In the absence of local sources, the modeled FAcolumn is dominated by transport. This is reflected in themodeled vertical distribution of FA peaking in the free tro-posphere. The model predicts a strong seasonal cycle withmaximum during the boreal summer, corresponding to thelargest biogenic and biomass burning emissions. The modelunderestimates FA total column by a factor of 2 to 5. Thisdiscrepancy may in part reflect insufficient biomass burn-ing emissions (Andreae and Merlet, 2001). We also notethat the model predicts very low concentrations of FA at thesurface (∼10 pptv). This is in sharp contrast with the mea-surements ofAnderson et al.(2008) which report∼1 ppbvof water-soluble organic carbon (primarily FA and AA) overSummit at 1.5 m above the snow. This discrepancy betweenmodel and observation in Thule may thus reflect missing lo-cal sources. Indeed,Dibb and Arsenault(2002) reported sur-face concentrations of FA and AA measured in the Arcticcould not be sustained by transport alone but required a largesource from snow photochemistry.
Missing winter sources
Mid latitude and low altitude sites (Bremen, Wollongong)show larger relative biases between the model and the dataduring the winter (Figs.3a and4b). This may point tolarge missing anthropogenic sources of FA (Talbot et al.,1988). Alternatively leaf decay may also contribute tothe FA sources in the winter months (Kesselmeier et al.,1998). A missing biogenic contribution would be consis-tent with isotope measurements which showed that FA andAA are primarily made of modern carbon even in the winter(Glasius et al., 2001).
Atmos. Chem. Phys., 11, 1989–2013, 2011 www.atmos-chem-phys.net/11/1989/2011/
F. Paulot et al.: Formic and acetic acid budget 1999
(a)
0
50
100
%
Jan Apr Jul Oct Jan0
0.5
1
1.5
2
mol
ec/c
m2
(x10
16)
(b)
0
50
100
%
Jan Apr Jul Oct Jan0
0.5
1
1.5
2
2.5
3
mol
ec/c
m2
(x10
16)
(c)
0
50
100
%
Jan Apr Jul Oct Jan−0.5
0
0.5
1
1.5
mol
ec/c
m2
(x10
16)
(d)
0
50
100
%
Jan Apr Jul Oct Jan0
0.5
1
1.5
2
2.5
mol
ec/c
m2
(x10
16)
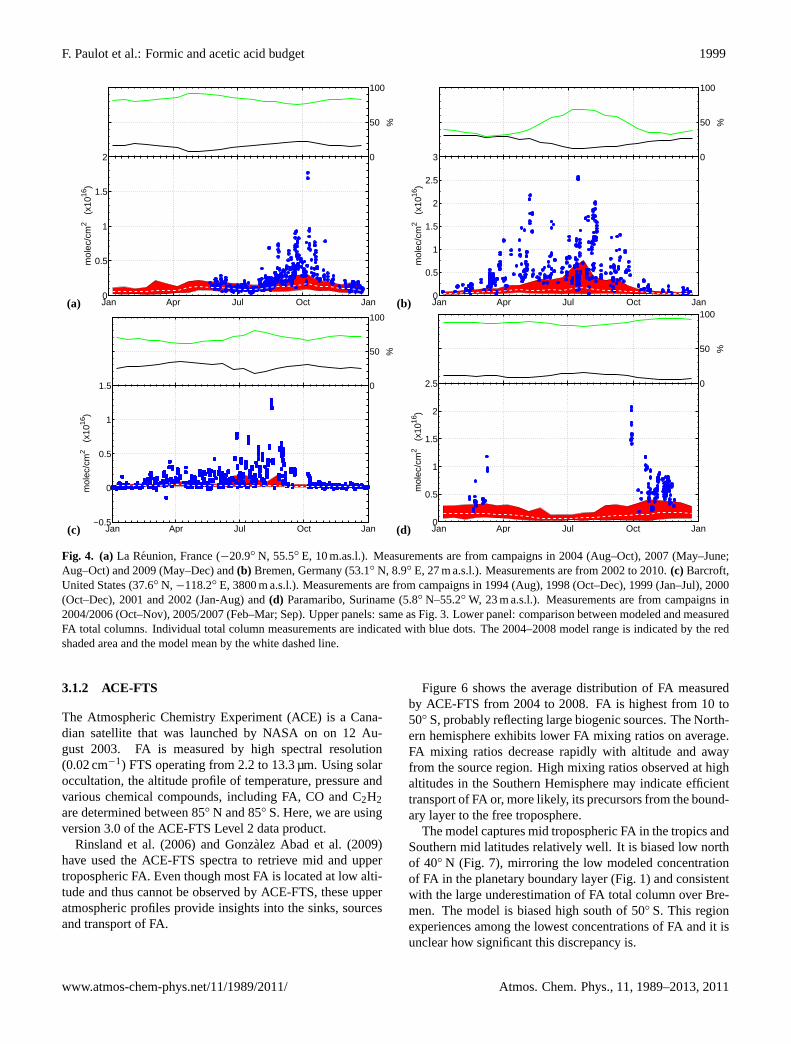
Fig. 4. (a)La Reunion, France (−20.9◦ N, 55.5◦ E, 10 m.as.l.). Measurements are from campaigns in 2004 (Aug–Oct), 2007 (May–June;Aug–Oct) and 2009 (May–Dec) and(b) Bremen, Germany (53.1◦ N, 8.9◦ E, 27 m a.s.l.). Measurements are from 2002 to 2010.(c) Barcroft,United States (37.6◦ N, −118.2◦ E, 3800 m a.s.l.). Measurements are from campaigns in 1994 (Aug), 1998 (Oct–Dec), 1999 (Jan–Jul), 2000(Oct–Dec), 2001 and 2002 (Jan-Aug) and(d) Paramaribo, Suriname (5.8◦ N–55.2◦ W, 23 m a.s.l.). Measurements are from campaigns in2004/2006 (Oct–Nov), 2005/2007 (Feb–Mar; Sep). Upper panels: same as Fig.3. Lower panel: comparison between modeled and measuredFA total columns. Individual total column measurements are indicated with blue dots. The 2004–2008 model range is indicated by the redshaded area and the model mean by the white dashed line.
3.1.2 ACE-FTS
The Atmospheric Chemistry Experiment (ACE) is a Cana-dian satellite that was launched by NASA on on 12 Au-gust 2003. FA is measured by high spectral resolution(0.02 cm−1) FTS operating from 2.2 to 13.3 µm. Using solaroccultation, the altitude profile of temperature, pressure andvarious chemical compounds, including FA, CO and C2H2are determined between 85◦ N and 85◦ S. Here, we are usingversion 3.0 of the ACE-FTS Level 2 data product.
Rinsland et al.(2006) and Gonzalez Abad et al.(2009)have used the ACE-FTS spectra to retrieve mid and uppertropospheric FA. Even though most FA is located at low alti-tude and thus cannot be observed by ACE-FTS, these upperatmospheric profiles provide insights into the sinks, sourcesand transport of FA.
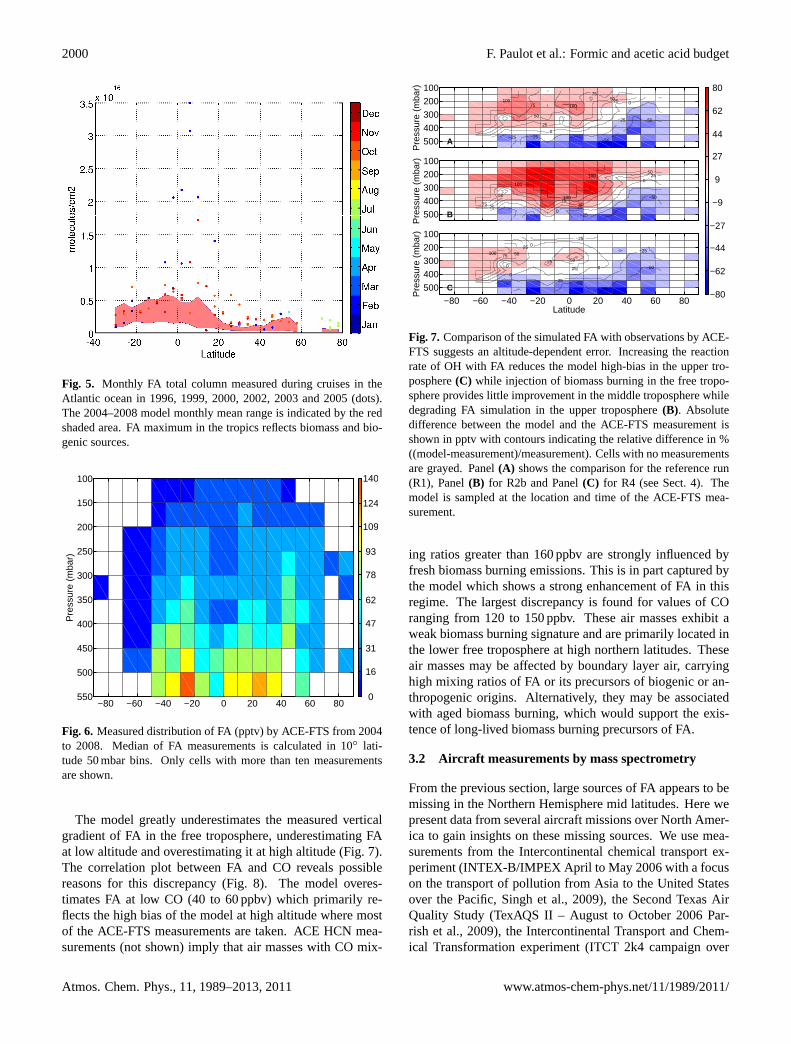
Figure6 shows the average distribution of FA measuredby ACE-FTS from 2004 to 2008. FA is highest from 10 to50◦ S, probably reflecting large biogenic sources. The North-ern hemisphere exhibits lower FA mixing ratios on average.FA mixing ratios decrease rapidly with altitude and awayfrom the source region. High mixing ratios observed at highaltitudes in the Southern Hemisphere may indicate efficienttransport of FA or, more likely, its precursors from the bound-ary layer to the free troposphere.
The model captures mid tropospheric FA in the tropics andSouthern mid latitudes relatively well. It is biased low northof 40◦ N (Fig. 7), mirroring the low modeled concentrationof FA in the planetary boundary layer (Fig.1) and consistentwith the large underestimation of FA total column over Bre-men. The model is biased high south of 50◦ S. This regionexperiences among the lowest concentrations of FA and it isunclear how significant this discrepancy is.
www.atmos-chem-phys.net/11/1989/2011/ Atmos. Chem. Phys., 11, 1989–2013, 2011
2000 F. Paulot et al.: Formic and acetic acid budget
Fig. 5. Monthly FA total column measured during cruises in theAtlantic ocean in 1996, 1999, 2000, 2002, 2003 and 2005 (dots).The 2004–2008 model monthly mean range is indicated by the redshaded area. FA maximum in the tropics reflects biomass and bio-genic sources.
−80 −60 −40 −20 0 20 40 60 80
100
150
200
250
300
350
400
450
500
550
Pre
ssur
e (m
bar)
0
16
31
47
62
78
93
109
124
140
Fig. 6. Measured distribution of FA (pptv) by ACE-FTS from 2004to 2008. Median of FA measurements is calculated in 10◦ lati-tude 50 mbar bins. Only cells with more than ten measurementsare shown.
The model greatly underestimates the measured verticalgradient of FA in the free troposphere, underestimating FAat low altitude and overestimating it at high altitude (Fig.7).The correlation plot between FA and CO reveals possiblereasons for this discrepancy (Fig.8). The model overes-timates FA at low CO (40 to 60 ppbv) which primarily re-flects the high bias of the model at high altitude where mostof the ACE-FTS measurements are taken. ACE HCN mea-surements (not shown) imply that air masses with CO mix-
100
200
300
400
500 −50
−50
−25
−25
−250
0
25
25
50
5075
75
100100
Pre
ssur
e (m
bar)
A
100200
300
400
500
−50
−250
0
25 25
25
50
50
50
7575
100
100
100
Pre
ssur
e (m
bar)
B
−80 −60 −40 −20 0 20 40 60 80
100
200
300
400
500 −50
−50
−50−25
−25
−25
0
0
0
0
25
25
25
5050
75100
Pre
ssur
e (m
bar)
Latitude
C
−80
−62
−44
−27
−9
9
27
44
62
80
Fig. 7. Comparison of the simulated FA with observations by ACE-FTS suggests an altitude-dependent error. Increasing the reactionrate of OH with FA reduces the model high-bias in the upper tro-posphere(C) while injection of biomass burning in the free tropo-sphere provides little improvement in the middle troposphere whiledegrading FA simulation in the upper troposphere(B). Absolutedifference between the model and the ACE-FTS measurement isshown in pptv with contours indicating the relative difference in %((model-measurement)/measurement). Cells with no measurementsare grayed. Panel(A) shows the comparison for the reference run(R1), Panel(B) for R2b and Panel(C) for R4 (see Sect.4). Themodel is sampled at the location and time of the ACE-FTS mea-surement.
ing ratios greater than 160 ppbv are strongly influenced byfresh biomass burning emissions. This is in part captured bythe model which shows a strong enhancement of FA in thisregime. The largest discrepancy is found for values of COranging from 120 to 150 ppbv. These air masses exhibit aweak biomass burning signature and are primarily located inthe lower free troposphere at high northern latitudes. Theseair masses may be affected by boundary layer air, carryinghigh mixing ratios of FA or its precursors of biogenic or an-thropogenic origins. Alternatively, they may be associatedwith aged biomass burning, which would support the exis-tence of long-lived biomass burning precursors of FA.
3.2 Aircraft measurements by mass spectrometry
From the previous section, large sources of FA appears to bemissing in the Northern Hemisphere mid latitudes. Here wepresent data from several aircraft missions over North Amer-ica to gain insights on these missing sources. We use mea-surements from the Intercontinental chemical transport ex-periment (INTEX-B/IMPEX April to May 2006 with a focuson the transport of pollution from Asia to the United Statesover the Pacific,Singh et al., 2009), the Second Texas AirQuality Study (TexAQS II – August to October 2006Par-rish et al., 2009), the Intercontinental Transport and Chem-ical Transformation experiment (ITCT 2k4 campaign over
Atmos. Chem. Phys., 11, 1989–2013, 2011 www.atmos-chem-phys.net/11/1989/2011/
F. Paulot et al.: Formic and acetic acid budget 2001
30 60 120 240
2
5
10
20
40
80
160
320
640
CO (ppbv)
FA
(pp
tv)
0
1000
2000
3000
#/bi
n
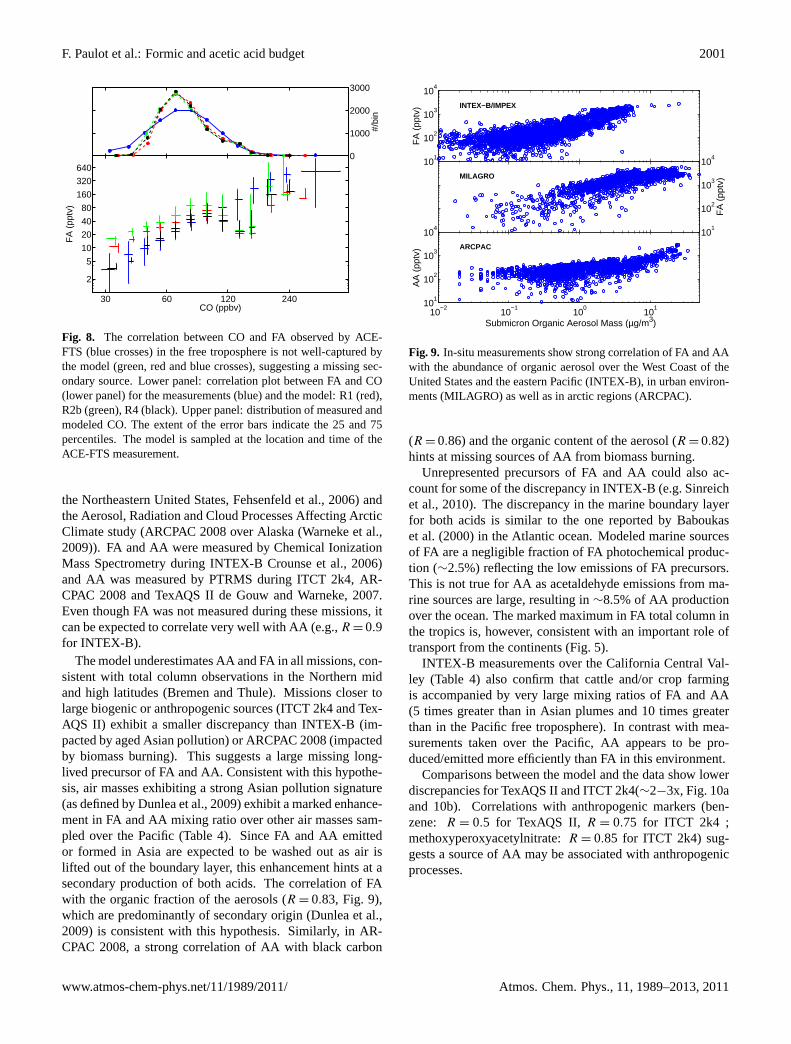
Fig. 8. The correlation between CO and FA observed by ACE-FTS (blue crosses) in the free troposphere is not well-captured bythe model (green, red and blue crosses), suggesting a missing sec-ondary source. Lower panel: correlation plot between FA and CO(lower panel) for the measurements (blue) and the model: R1 (red),R2b (green), R4 (black). Upper panel: distribution of measured andmodeled CO. The extent of the error bars indicate the 25 and 75percentiles. The model is sampled at the location and time of theACE-FTS measurement.
the Northeastern United States,Fehsenfeld et al., 2006) andthe Aerosol, Radiation and Cloud Processes Affecting ArcticClimate study (ARCPAC 2008 over Alaska (Warneke et al.,2009)). FA and AA were measured by Chemical IonizationMass Spectrometry during INTEX-BCrounse et al., 2006)and AA was measured by PTRMS during ITCT 2k4, AR-CPAC 2008 and TexAQS IIde Gouw and Warneke, 2007.Even though FA was not measured during these missions, itcan be expected to correlate very well with AA (e.g.,R = 0.9for INTEX-B).
The model underestimates AA and FA in all missions, con-sistent with total column observations in the Northern midand high latitudes (Bremen and Thule). Missions closer tolarge biogenic or anthropogenic sources (ITCT 2k4 and Tex-AQS II) exhibit a smaller discrepancy than INTEX-B (im-pacted by aged Asian pollution) or ARCPAC 2008 (impactedby biomass burning). This suggests a large missing long-lived precursor of FA and AA. Consistent with this hypothe-sis, air masses exhibiting a strong Asian pollution signature(as defined byDunlea et al., 2009) exhibit a marked enhance-ment in FA and AA mixing ratio over other air masses sam-pled over the Pacific (Table4). Since FA and AA emittedor formed in Asia are expected to be washed out as air islifted out of the boundary layer, this enhancement hints at asecondary production of both acids. The correlation of FAwith the organic fraction of the aerosols (R = 0.83, Fig.9),which are predominantly of secondary origin (Dunlea et al.,2009) is consistent with this hypothesis. Similarly, in AR-CPAC 2008, a strong correlation of AA with black carbon
101
102
103
104
FA
(pp
tv) INTEX−B/IMPEX
101
102
103
104
FA
(pp
tv)MILAGRO
10−2
10−1
100
10110
1
102
103
104
Submicron Organic Aerosol Mass (µg/m3)
AA
(pp
tv) ARCPAC
Fig. 9. In-situ measurements show strong correlation of FA and AAwith the abundance of organic aerosol over the West Coast of theUnited States and the eastern Pacific (INTEX-B), in urban environ-ments (MILAGRO) as well as in arctic regions (ARCPAC).
(R = 0.86) and the organic content of the aerosol (R = 0.82)hints at missing sources of AA from biomass burning.
Unrepresented precursors of FA and AA could also ac-count for some of the discrepancy in INTEX-B (e.g.Sinreichet al., 2010). The discrepancy in the marine boundary layerfor both acids is similar to the one reported byBaboukaset al.(2000) in the Atlantic ocean. Modeled marine sourcesof FA are a negligible fraction of FA photochemical produc-tion (∼2.5%) reflecting the low emissions of FA precursors.This is not true for AA as acetaldehyde emissions from ma-rine sources are large, resulting in∼8.5% of AA productionover the ocean. The marked maximum in FA total column inthe tropics is, however, consistent with an important role oftransport from the continents (Fig.5).
INTEX-B measurements over the California Central Val-ley (Table4) also confirm that cattle and/or crop farmingis accompanied by very large mixing ratios of FA and AA(5 times greater than in Asian plumes and 10 times greaterthan in the Pacific free troposphere). In contrast with mea-surements taken over the Pacific, AA appears to be pro-duced/emitted more efficiently than FA in this environment.
Comparisons between the model and the data show lowerdiscrepancies for TexAQS II and ITCT 2k4(∼2−3x, Fig.10aand 10b). Correlations with anthropogenic markers (ben-zene: R = 0.5 for TexAQS II, R = 0.75 for ITCT 2k4 ;methoxyperoxyacetylnitrate:R = 0.85 for ITCT 2k4) sug-gests a source of AA may be associated with anthropogenicprocesses.
www.atmos-chem-phys.net/11/1989/2011/ Atmos. Chem. Phys., 11, 1989–2013, 2011
2002 F. Paulot et al.: Formic and acetic acid budget
Table 4. The increase in the median measured (m) FA and AA in polluted air observed during INTEX-B/IMPEX reflects the importance ofsecondary sources in the budget of FA and AA. These sources are missing from the model (M).α is the slope of the linear fit: AA=αFA+β
calculated using York’s method (York et al., 2004) for the measurement (ordinary least square for the model). Characterization of the airmasses follows the approach ofDunlea et al.(2009).
FA (pptv) AA (pptv) α ± 1σ (R2)
m M m M m M
Free troposphere 296 26 193 25 0.37± 0.16 (0.53) 0.42 (0.37)(Asian pollution)Free troposphere 108 26 86 26 0.62± 0.23 (0.52) 0.54 (0.51)(pristine + dilute Asian pollution)Boundary layer 1291 81 906 62 1.59± 0.16 (0.63) 0.40 (0.91)(California Central Valley)
3.3 Summary of model-measurement comparisons
The comparisons between measurements and model resultshave revealed that:
1. the model captures FA concentration and seasonality inregions with large biogenic emissions (ACE-FTS in thetropics, Wollongong, La Reunion)
2. FA and AA concentrations are largely underestimatedwhen biomass burning (ARCPAC 2008, ACE-FTS,La Reunion) or anthropogenic influences (Bremen,INTEX-B) are strong. However, even in these instances,FA and AA seasonality (Bremen) suggests that a largefraction of FA and AA is associated with emission andphotooxidation of biogenic compounds.
3. The rapid decrease in FA with altitude in the upper tro-posphere is not captured by the model.
4. FA and AA are greatly underpredicted in polar regionsand in Northern midlatitude regions impacted by an-thropogenic activities.
These observations are consistent with major secondarysources of FA and AA missing in the model. In the follow-ing, we use a series of sensitivity runs to examine the criteriaa secondary source of FA and AA must meet to help bridgethe gap between the model and the data. The reference simu-lation described in this section is referred to as R1 hereafter.
4 Sensitivity study
4.1 Biomass burning injection height
As a default in GEOS-Chem, biomass burning emissions aresolely released in the boundary layer. However observationshave shown that major fires can inject emissions well abovethe boundary layer (e.g.de Gouw et al., 2006; Vigourouxet al., 2009). Several modeling studies have also shown that
observations of CO and aerosols downwind of fires could bebest explained when a large fraction of the fire emissionsis released above the boundary layer (e.g.Turquety et al.,2007). Injection of FA/AA or their precursors outside of theboundary layer is of great importance in their budget. In-deed a fast transport of carboxylic acids out of the bound-ary layer increases their lifetime by reducing the dry depo-sition sink and results in a large increase in their net life-time. This in turn results in enhanced transport of FA andAA on larger scales. Furthermore biomass burning has beenassociated with a reduction of low-level precipitation (e.g.Andreae et al., 2004) which may further increase carboxylicacid lifetime.
Several studies have associated enhancements of FA in thefree troposphere to biomass burning (Gonzalez Abad et al.,2009). Here we examine whether injection of biomass burn-ing emissions outside of the boundary layer can help bridgethe gap between between model and observations at highCO. We use two different scenarios. In the first one (R2a),60% of the biomass burning is emitted in the boundary layerwhile 35% is emitted in the mid troposphere (from the top ofboundary layer to 400 hPa) and 5% in the upper troposphere(400 hPa to 200 hPa). In the second scenario (R2b), we adoptone of the scenarios used byTurquety et al.(2007) to inves-tigate biomass burning over North America with 40% of thebiomass burning emissions in the boundary layer, 30% in themid troposphere and 30% in the upper troposphere. Since ourgoal is to examine the sensitivity of free tropospheric FA tobiomass burning injection height, modifications of the injec-tion height are applied globally, an important simplification(Val Martin et al., 2010, and references therein). Furthermorewe assume that EF for FA and AA are independent of the thebiomass burning injection height. This is another importantsimplification since (a) the injection of biomass burning inthe free troposphere strongly depends on the fire intensity,and (b) EF for FA and AA exhibit some correlation with themodified combustion efficiency (MCE), an indicator of thecombustion type (flaming or smoldering). Therefore, a more
Atmos. Chem. Phys., 11, 1989–2013, 2011 www.atmos-chem-phys.net/11/1989/2011/
F. Paulot et al.: Formic and acetic acid budget 2003
(a)0 200 400 600 800 1000
500
550
600
650
700
750
800
850
900
Pre
ssur
e (m
bar)
pptv
(b)0 200 400 600 800 1000
450
500
550
600
650
700
750
800
850
900
Pre
ssur
e (m
bar)
pptv
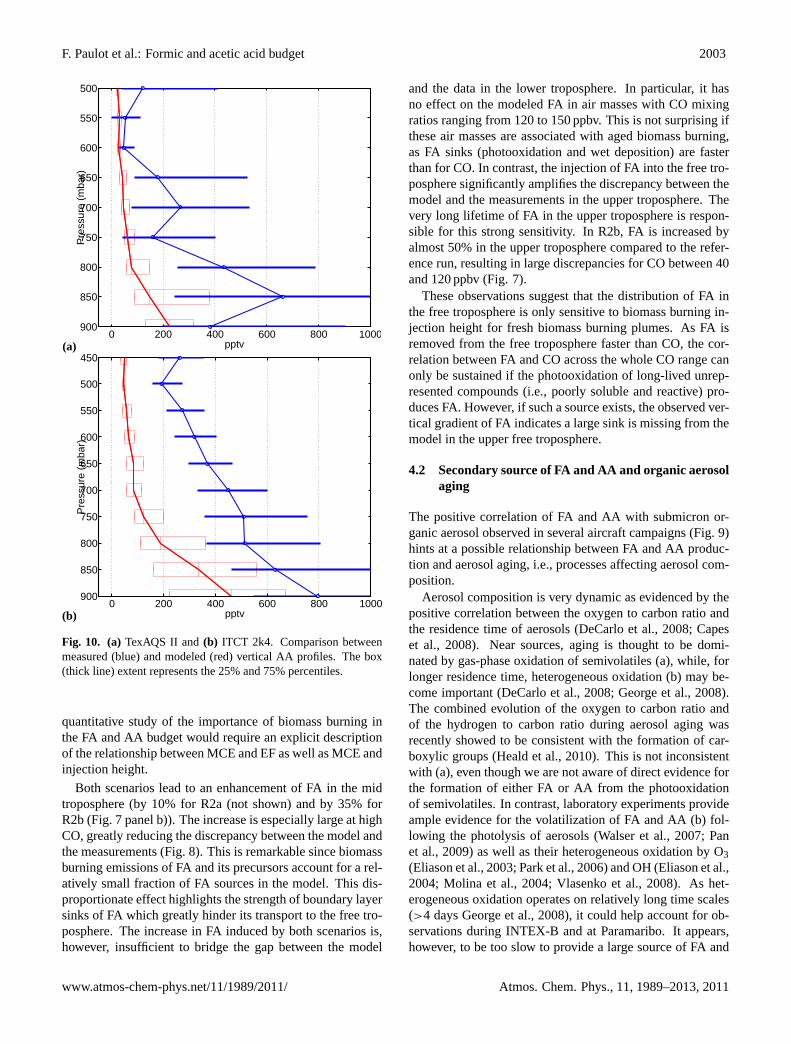
Fig. 10. (a)TexAQS II and(b) ITCT 2k4. Comparison betweenmeasured (blue) and modeled (red) vertical AA profiles. The box(thick line) extent represents the 25% and 75% percentiles.
quantitative study of the importance of biomass burning inthe FA and AA budget would require an explicit descriptionof the relationship between MCE and EF as well as MCE andinjection height.
Both scenarios lead to an enhancement of FA in the midtroposphere (by 10% for R2a (not shown) and by 35% forR2b (Fig.7 panel b)). The increase is especially large at highCO, greatly reducing the discrepancy between the model andthe measurements (Fig.8). This is remarkable since biomassburning emissions of FA and its precursors account for a rel-atively small fraction of FA sources in the model. This dis-proportionate effect highlights the strength of boundary layersinks of FA which greatly hinder its transport to the free tro-posphere. The increase in FA induced by both scenarios is,however, insufficient to bridge the gap between the model
and the data in the lower troposphere. In particular, it hasno effect on the modeled FA in air masses with CO mixingratios ranging from 120 to 150 ppbv. This is not surprising ifthese air masses are associated with aged biomass burning,as FA sinks (photooxidation and wet deposition) are fasterthan for CO. In contrast, the injection of FA into the free tro-posphere significantly amplifies the discrepancy between themodel and the measurements in the upper troposphere. Thevery long lifetime of FA in the upper troposphere is respon-sible for this strong sensitivity. In R2b, FA is increased byalmost 50% in the upper troposphere compared to the refer-ence run, resulting in large discrepancies for CO between 40and 120 ppbv (Fig.7).
These observations suggest that the distribution of FA inthe free troposphere is only sensitive to biomass burning in-jection height for fresh biomass burning plumes. As FA isremoved from the free troposphere faster than CO, the cor-relation between FA and CO across the whole CO range canonly be sustained if the photooxidation of long-lived unrep-resented compounds (i.e., poorly soluble and reactive) pro-duces FA. However, if such a source exists, the observed ver-tical gradient of FA indicates a large sink is missing from themodel in the upper free troposphere.
4.2 Secondary source of FA and AA and organic aerosolaging
The positive correlation of FA and AA with submicron or-ganic aerosol observed in several aircraft campaigns (Fig.9)hints at a possible relationship between FA and AA produc-tion and aerosol aging, i.e., processes affecting aerosol com-position.
Aerosol composition is very dynamic as evidenced by thepositive correlation between the oxygen to carbon ratio andthe residence time of aerosols (DeCarlo et al., 2008; Capeset al., 2008). Near sources, aging is thought to be domi-nated by gas-phase oxidation of semivolatiles (a), while, forlonger residence time, heterogeneous oxidation (b) may be-come important (DeCarlo et al., 2008; George et al., 2008).The combined evolution of the oxygen to carbon ratio andof the hydrogen to carbon ratio during aerosol aging wasrecently showed to be consistent with the formation of car-boxylic groups (Heald et al., 2010). This is not inconsistentwith (a), even though we are not aware of direct evidence forthe formation of either FA or AA from the photooxidationof semivolatiles. In contrast, laboratory experiments provideample evidence for the volatilization of FA and AA (b) fol-lowing the photolysis of aerosols (Walser et al., 2007; Panet al., 2009) as well as their heterogeneous oxidation by O3(Eliason et al., 2003; Park et al., 2006) and OH (Eliason et al.,2004; Molina et al., 2004; Vlasenko et al., 2008). As het-erogeneous oxidation operates on relatively long time scales(>4 daysGeorge et al., 2008), it could help account for ob-servations during INTEX-B and at Paramaribo. It appears,however, to be too slow to provide a large source of FA and
www.atmos-chem-phys.net/11/1989/2011/ Atmos. Chem. Phys., 11, 1989–2013, 2011
2004 F. Paulot et al.: Formic and acetic acid budget
AA near emission centers (DeCarlo et al., 2008). These ob-servations suggest that aerosol aging and wall reactions couldresult in a significant source of FA and AA in chamber ex-periments that was not accounted for byPaulot et al.(2009).
Comparison between the data and the model suggestsglobal sources of FA and AA may be underestimated by upto 50% for both acids, i.e., an additional∼2 TmolC yr−1. Es-timates for the global flux of carbon from the photooxidationof aerosol range from 4 to 16.5 TmolC yr−1 (Kwan et al.,2006), suggesting FA and AA volatilization would need toaccount for a very large fraction of this flux (10–50%). How-ever this estimate does not account for the probably largedynamic exchange of matter between the gas and aerosolphases driven by semivolatile volatilization and photooxida-tion (Robinson et al., 2007; Kroll et al., 2009; Jimenez et al.,2009).
Proper evaluation of the role of aerosol aging as a source ofFA and AA requires detailed modeling of aerosol evolution(e.g., following the framework presented byJimenez et al.,2009) informed by additional laboratory measurements. Thisis beyond the scope of this paper. Here, we do not explic-itly model secondary organic aerosol but use organic aerosol(OA) to generate a diffuse source of FA and AA associatedwith aerosol aging (scenario R3). In GEOS-Chem, OA rep-resents both emitted OA (primarily from biomass burningwith an important contribution of anthropogenic sources inthe Northern midlatitudes) and a small and simplified sec-ondary production from the condensation of low volatilitycompounds from biogenic and anthropogenic sources (Parket al., 2003). The largest global source of OA is biomassburning globally. We assume that the reaction of OH withOA produces FA and AA according to:
dFA
dt=
dAA
dt=
(rp
Dg+
4
vγ
)−1
A×OH
whererp is the particle radius,γ the reaction probability (as-sumed to be 1 here),Dg the gas-phase diffusion coefficient,v the mean molecular velocity of OH andA the aerosol sur-face area. This reaction does not represent a physical process(OA is not lost via this reaction) but is meant to provide adiffuse source of FA and AA correlated with OA. Includingthis process results in an increase in the source of FA and AAby 320 Gmol yr−1, about∼25% (∼0.95 TmolC yr−1).
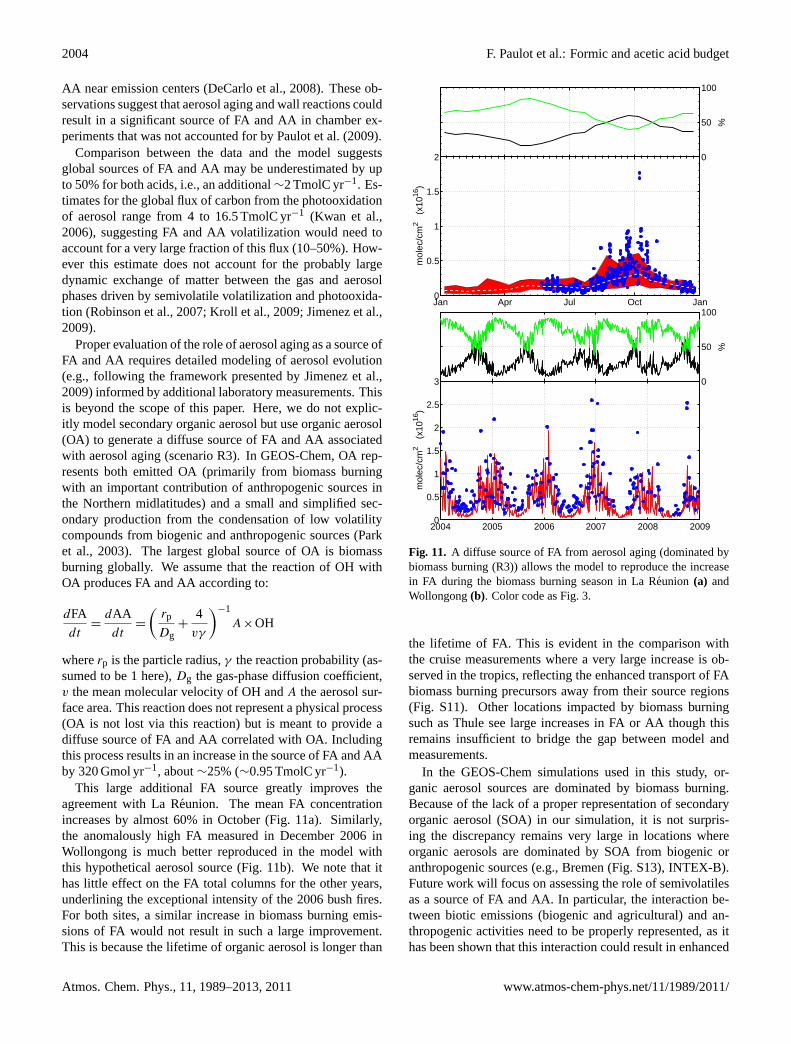
This large additional FA source greatly improves theagreement with La Reunion. The mean FA concentrationincreases by almost 60% in October (Fig.11a). Similarly,the anomalously high FA measured in December 2006 inWollongong is much better reproduced in the model withthis hypothetical aerosol source (Fig.11b). We note that ithas little effect on the FA total columns for the other years,underlining the exceptional intensity of the 2006 bush fires.For both sites, a similar increase in biomass burning emis-sions of FA would not result in such a large improvement.This is because the lifetime of organic aerosol is longer than
0
50
100
%
Jan Apr Jul Oct Jan0
0.5
1
1.5
2
mol
ec/c
m2
(x10
16)
0
50
100
%
2004 2005 2006 2007 2008 20090
0.5
1
1.5
2
2.5
3
mol
ec/c
m2
(x10
16)
Fig. 11. A diffuse source of FA from aerosol aging (dominated bybiomass burning (R3)) allows the model to reproduce the increasein FA during the biomass burning season in La Reunion (a) andWollongong(b). Color code as Fig. 3.
the lifetime of FA. This is evident in the comparison withthe cruise measurements where a very large increase is ob-served in the tropics, reflecting the enhanced transport of FAbiomass burning precursors away from their source regions(Fig. S11). Other locations impacted by biomass burningsuch as Thule see large increases in FA or AA though thisremains insufficient to bridge the gap between model andmeasurements.
In the GEOS-Chem simulations used in this study, or-ganic aerosol sources are dominated by biomass burning.Because of the lack of a proper representation of secondaryorganic aerosol (SOA) in our simulation, it is not surpris-ing the discrepancy remains very large in locations whereorganic aerosols are dominated by SOA from biogenic oranthropogenic sources (e.g., Bremen (Fig. S13), INTEX-B).Future work will focus on assessing the role of semivolatilesas a source of FA and AA. In particular, the interaction be-tween biotic emissions (biogenic and agricultural) and an-thropogenic activities need to be properly represented, as ithas been shown that this interaction could result in enhanced
Atmos. Chem. Phys., 11, 1989–2013, 2011 www.atmos-chem-phys.net/11/1989/2011/
F. Paulot et al.: Formic and acetic acid budget 2005
secondary aerosol formation (de Gouw et al., 2005; Weberet al., 2007; Goldstein et al., 2009). If SOA aging is indeeda source of FA and AA, this could help explain the biogenicsignature of FA and AA in polluted regions (seasonality andisotopic composition), as well as the similar magnitudes ofWollongong and Bremen FA total columns despite very dif-ferent isoprene sources.
4.3 Upper tropospheric budget of FA
The ACE-FTS comparison revealed a high bias of the modelin the upper troposphere. At these altitudes, wet depositionbecomes small and FA sink is dominated by the reaction ofOH with FA.
To examine the sensitivity of the FA profile to the temper-ature dependence of its reaction with OH, we use the tem-perature dependence derived theoretically byGalano et al.(2002) for the acidic (k1) and formyl channels (k2) and scaleit to match the experimental rate of FA + OH determined atroom temperature. The resulting rate constant of FA with OH(kFA+OH) is :
kFA+OH = k1+k2 = 2.94×10⁻¹⁴×exp
(786
T
)
+9.85×10⁻¹³×exp
(−
1036
T
)At 220 K, this predicts the oxidation of FA is 2.3 times fasterthan at 298 K.
In the R4 simulation, we also include FA formation fromorganic aerosol (as in R3) as well as the injection of FA inthe mid troposphere (as in R2a). The change in the reactionrate at cold temperature results in a dramatic decrease of FAin the upper troposphere (Fig.7), because photooxidation isthe dominant sink of FA in this region. This decrease is es-pecially remarkable since mid troposphere FA is increasedas a result of the injection of biomass burning in this regions.This result must be interpreted cautiously as the model mayunderestimate HOx in the upper troposphere, especially inthe tropics (Wennberg et al., 1998). The fate of FA in the up-per troposphere deserves more study since FA could providea useful proxy to investigate biomass burning injection in thefree troposphere.
The discrepancy between model and observation of FAin the upper troposphere is further amplified if the equilib-rium between HOCH2OO and HCHO+HO2 is considered(Veyret et al., 1989).
HCHO+HO2 � HOCH2OO (R3)
HOCH2O2+HO2 → HOCH2OOH (R4)
HOCH2O2+HO2 → HOCH2O+OH+O2 (R5)
HOCH2O2+HO2 → FA+H2O (R6)
0 0.05 0.1 0.15 0.2 0.25 0.3 0.35
0.15
0.2
0.25
0.3
0.35
0.4
0.45
0.5
0.55
0.6
0.65
FA (ppbv)
η
0 0.1 0.2 0.3 0.4 0.5 0.6 0.70.15
0.2
0.25
0.3
0.35
0.4
0.45
0.5
0.55
0.6
0.65
Fraction of FA source due to HCHO + HO2
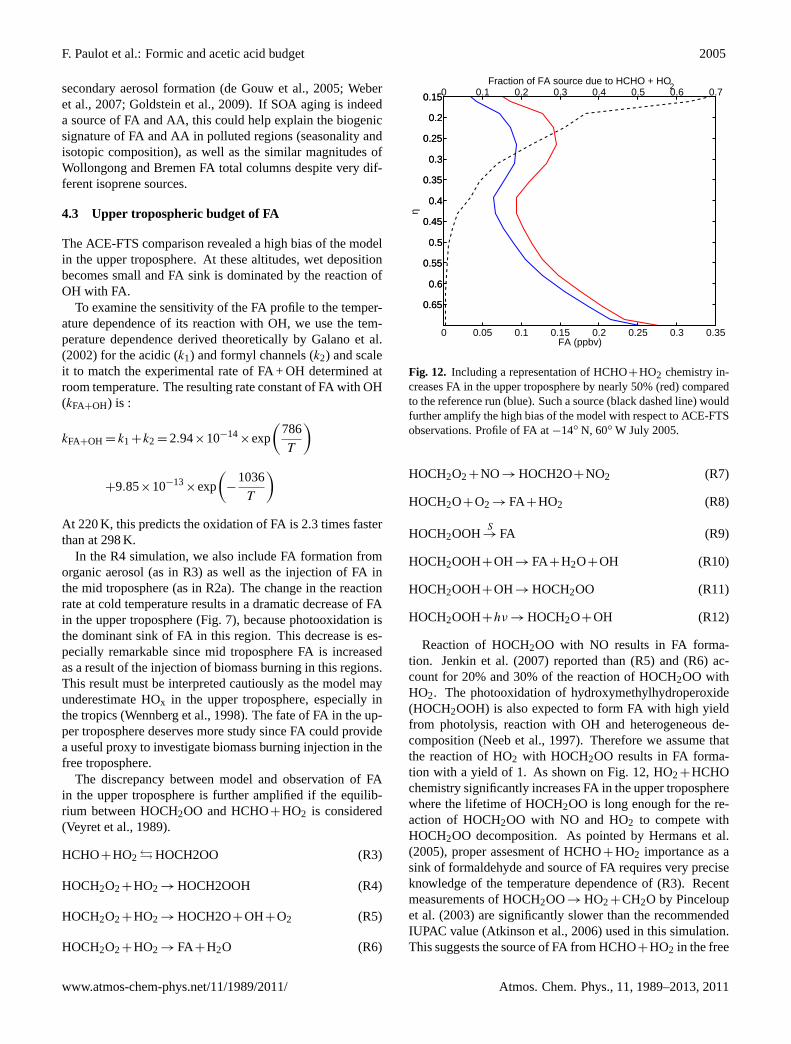
Fig. 12. Including a representation of HCHO+HO2 chemistry in-creases FA in the upper troposphere by nearly 50% (red) comparedto the reference run (blue). Such a source (black dashed line) wouldfurther amplify the high bias of the model with respect to ACE-FTSobservations. Profile of FA at−14◦ N, 60◦ W July 2005.
HOCH2O2+NO→ HOCH2O+NO2 (R7)
HOCH2O+O2 → FA+HO2 (R8)
HOCH2OOHS→ FA (R9)
HOCH2OOH+OH→ FA+H2O+OH (R10)
HOCH2OOH+OH→ HOCH2OO (R11)
HOCH2OOH+hν → HOCH2O+OH (R12)
Reaction of HOCH2OO with NO results in FA forma-tion. Jenkin et al.(2007) reported than (R5) and (R6) ac-count for 20% and 30% of the reaction of HOCH2OO withHO2. The photooxidation of hydroxymethylhydroperoxide(HOCH2OOH) is also expected to form FA with high yieldfrom photolysis, reaction with OH and heterogeneous de-composition (Neeb et al., 1997). Therefore we assume thatthe reaction of HO2 with HOCH2OO results in FA forma-tion with a yield of 1. As shown on Fig.12, HO2+HCHOchemistry significantly increases FA in the upper tropospherewhere the lifetime of HOCH2OO is long enough for the re-action of HOCH2OO with NO and HO2 to compete withHOCH2OO decomposition. As pointed byHermans et al.(2005), proper assesment of HCHO+HO2 importance as asink of formaldehyde and source of FA requires very preciseknowledge of the temperature dependence of (R3). Recentmeasurements of HOCH2OO→ HO2+CH2O by Pinceloupet al. (2003) are significantly slower than the recommendedIUPAC value (Atkinson et al., 2006) used in this simulation.This suggests the source of FA from HCHO+HO2 in the free
www.atmos-chem-phys.net/11/1989/2011/ Atmos. Chem. Phys., 11, 1989–2013, 2011
2006 F. Paulot et al.: Formic and acetic acid budget
troposphere may be even larger than shown on Fig.12. FAobservations in the upper troposphere thus provide a muchneeded test of the representation of HCHO+HO2 in models.
5 Conclusions
We have derived a detailed bottom-up inventory of FA andAA in the atmosphere. Our updated source of FA is morethan twice as large as previous estimates, reflecting the for-mation of FA from the photooxidation of isoprene and itsproducts by OH. Both carboxylic acids are predicted to orig-inate primarily from the photooxidation of biogenic com-pounds with biomass burning a significant seasonal sourcein many environments.
Despite these larger sources, the model remains biasedlow, especially in the Northern mid latitudes and in airmasses affected by biomass burning. This discrepancy can-not be solely resolved by increasing biomass burning emis-sions of FA and AA.
We propose that a long-lived secondary source of FA andAA of order ∼2 TmolC yr−1 has yet to be identified. Wehypothesize that the strong correlation of aerosol organiccontent with FA and AA hints at the possible relationshipbetween aerosol aging and carboxylic acid production. Ifthis relationship is demonstrated, FA and AA could provevery valuable to investigate aerosol aging, composition andsources. A realistic treatment of SOA (especially the missingSOA in polluted regions, including through anthropogenic-biogenic interactions), may help reduce the discrepancy inthe mid latitudes where the biomass burning source of or-ganic aerosol is limited.
The comparison between ACE-FTS mid and upper tropo-spheric measurements also reveals that strong enhancementsin FA are consistent with injection of biomass burning emis-sions outside of the boundary layer (though FA is most likelyassociated with secondary production). FA may be used asa proxy to track biomass burning injection in the free tro-posphere, a very uncertain parameter in chemical transportmodels.
Finally even though the data set presented in this study of-fers the first long-term overview of the global distribution ofFA, many regions of interest (in particular Africa and Asia),remain very poorly sampled. Ongoing efforts to retrieve FAfrom TES, IASI (Clerbaux et al., 2009; Razavi et al., 2011) orMIPAS-ENVISAT (Grutter et al., 2010) are thus particularlypromising.
Supplementary material related to thisarticle is available online at:http://www.atmos-chem-phys.net/11/1989/2011/acp-11-1989-2011-supplement.pdf.
Acknowledgement.The authors thank two anonymous referees andT. Stavrakou for their constructive comments. FP is supported bya NASA Earth and Space Science fellowship. GGA is supportedby the Wild Fund and the National Center for Earth Observation(NCEO). DBM acknowledges support from NASA under GrantNNX10AG65G. The National Center for Atmospheric Researchis supported by the National Science Foundation. The NCARFTS observation program at Thule (GR) is supported undercontract by the National Aeronautics and Space Administration(NASA). This work is also supported by the NSF Office of PolarPrograms (OPP). PFD, EJD and JLJ were supported by NASANNX08AD39G and NOAA NA08OAR4310565. The authorswish to thank the Danish Meteorological Institute for support atthe Thule site. JN acknowledges funding by the grant from theDeutsche Forschungsgemeinschaft (DFG) NO 404/14-1. NMDand DWTG acknowledge support from the Australian Departmentof Innovation, Industry, Science and Research, Internation ScienceLinkage under Grant CG130014. CV and MDM acknowledgethe PRODEX project SECPEA and the project AGACC fromthe Belgian Science Policy Office (contracts SD/AT/O1A andSD/AT/01B) for supporting the FTIR experiment at La Reunion.Part of this work was performed at the Jet Propulsion Laboratory,California Institute of Technology, under contract with NASA.The ACE mission is supported primarily by the Canadian SpaceAgency. Some support was also provided by the UK NaturalEnvironment Research Council (NERC), through the NationalCentre for Earth Observation (NCEO). Measurements of FA andAA during the INTEX-B and Milagro missions were supported byNASA under Grant NNG06GB32B. The authors are grateful toStephen Arnold and Dominick Spracklen for providing the marineisoprene fluxes, and to Sheryl Akagi and Robert Yokelson forproviding updated biomass burning and biofuel emission factors.The numerical simulations for this research were performed onCaltech’s Division of Geological and Planetary Sciences Dellcluster.
Edited by: J. P. D. Abbatt
References
Akagi, S. K., Yokelson, R. J., Wiedinmyer, C., Alvarado, M. J.,Reid, J. S., Karl, T., Crounse, J. D., and Wennberg, P. O.: Emis-sion factors for open and domestic biomass burning for use inatmospheric models, Atmos. Chem. Phys. Discuss., 10, 27523–27602,doi:10.5194/acpd-10-27523-2010, 2010.
Al-Hosney, H. A., Carlos-Cuellar, S., Baltrusaitis, J., and Gras-sian, V. H.: Heterogeneous uptake and reactivity of formicacid on calcium carbonate particles: a Knudsen cell reactor,FTIR and SEM study, Phys. Chem. Chem. Phys., 7, 3587–3595,doi:10.1039/b510112c, 2005.
Anderson, C. H., Dibb, J. E., Griffin, R. J., Hagler, G. S., andBergin, M. H.: Atmospheric water-soluble organic carbon mea-surements at Summit, Greenland, Atmos. Environ., 42, 5612–5621,doi:10.1016/j.atmosenv.2008.03.006, 2008.
Andreae, M. O. and Merlet, P.: Emission of trace gases and aerosolsfrom biomass burning, Global Biogeochem. Cy., 15, 955–966,doi:10.1029/2000GB001382, 2001.
Andreae, M. O., Rosenfeld, D., Artaxo, P., Costa, A. A., Frank,G. P., Longo, K. M., and Silva-Dias, M. A. F.: Smok-
Atmos. Chem. Phys., 11, 1989–2013, 2011 www.atmos-chem-phys.net/11/1989/2011/
F. Paulot et al.: Formic and acetic acid budget 2007
ing Rain Clouds over the Amazon, Science, 303, 1337–1342,doi:10.1126/science.1092779, 2004.
Archibald, A. T., McGillen, M. R., Taatjes, C. A., Percival,C. J., and Shallcross, D. E.: Atmospheric transformationof enols: A potential secondary source of carboxylic acidsin the urban troposphere, Geophys. Res. Lett., 34, L21 801,doi:10.1029/2007GL031032, 2007.
Arlander, D. W., Cronn, D. R., Farmer, J. C., Menzia, F. A., andWestberg, H. H.: Gaseous oxygenated hydrocarbons in the re-mote marine troposphere, J. Geophys. Res., 95, 16391–16403,doi:10.1029/JD095iD10p16391, 1990.
Arnold, S. R., Spracklen, D. V., Williams, J., Yassaa, N., Sciare,J., Bonsang, B., Gros, V., Peeken, I., Lewis, A. C., Alvain, S.,and Moulin, C.: Evaluation of the global oceanic isoprene sourceand its impacts on marine organic carbon aerosol, Atmos. Chem.Phys., 9, 1253–1262,doi:10.5194/acp-9-1253-2009, 2009.
Aschmann, S. M., Arey, J., and Atkinson, R.: OH radical for-mation from the gas-phase reactions of O3 with methacroleinand methyl vinyl ketone, Atmos. Environ., 30, 2939 – 2943,doi:10.1016/1352-2310(96)00013-1, 1996.
Atkinson, R., Baulch, D. L., Cox, R. A., Crowley, J. N., Hamp-son, R. F., Hynes, R. G., Jenkin, M. E., Rossi, M. J., Troe, J.,and IUPAC Subcommittee: Evaluated kinetic and photochemi-cal data for atmospheric chemistry: Volume II - gas phase re-actions of organic species, Atmos. Chem. Phys., 6, 3625–4055,doi:10.5194/acp-6-3625-2006, 2006.
Baboukas, E. D., Kanakidou, M., and Mihalopoulos, N.:Carboxylic acids in gas and particulate phase above theAtlantic Ocean, J. Geophys. Res., 105, 14459–14472,doi:10.1029/1999JD900977, 2000.
Bernath, P. F., McElroy, C. T., Abrams, M. C., Boone, C. D., But-ler, M., Camy-Peyret, C., Carleer, M., Clerbaux, C., Coheur,P., Colin, R., DeCola, P., DeMaziere, M., Drummond, J. R.,Dufour, D., Evans, W. F. J., Fast, H., Fussen, D., Gilbert, K.,Jennings, D. E., Llewellyn, E. J., Lowe, R. P., Mahieu, E., Mc-Connell, J. C., McHugh, M., McLeod, S. D., Michaud, R., Mid-winter, C., Nassar, R., Nichitiu, F., Nowlan, C., Rinsland, C. P.,Rochon, Y. J., Rowlands, N., Semeniuk, K., Simon, P., Skel-ton, R., Sloan, J. J., Soucy, M., Strong, K., Tremblay, P., Turn-bull, D., Walker, K. A., Walkty, I., Wardle, D. A., Wehrle, V.,Zander, R., and Zou, J.: Atmospheric Chemistry Experiment(ACE): Mission overview, Geophys. Res. Lett., 32(15), L15S01,doi:10.1029/2005GL022386, 2005.
Bey, I., Jacob, D. J., Yantosca, R. M., Logan, J. A., Field, B. D.,Fiore, A. M., Li, Q., Liu, H. Y., Mickley, L. J., Schultz, M.G.: Global modeling of tropospheric chemistry with assimilatedmeteorology- Model description and evaluation, J. Geophys.Res., 106, 23073–23095,doi:10.1029/2001JD000807, 2001.
Bouwman, A. F. and Hoek, K. W. V. D.: Scenarios of animal wasteproduction and fertilizer use and associated ammonia emissionfor the developing countries, Atmos. Environ., 31, 4095–4102,doi:10.1016/S1352-2310(97)00288-4, 1997.
Broadgate, W. J., Liss, P. S., and Penkett, S. A.: Seasonal emissionsof isoprene and other reactive hydrocarbon gases from the ocean,Geophys. Res. Lett., 24, 2675–2678,doi:10.1029/97GL02736,1997.
Butkovskaya, N. I., Kukui, A., Pouvesle, N., and Le Bras, G.:Rate constant and mechanism of the reaction of OH radicals withacetic acid in the temperature range of 229-300 K, J. Phys. Chem.
A, 108, 7021–7026,doi:10.1021/jp048444v, 2004.Butkovskaya, N. I., Pouvesle, N., Kukui, A., and Bras, G. L.: Mech-
anism of the OH-initiated oxidation of glycolaldehyde over thetemperature range 233-296 K., J. Phys. Chem. A, 110, 13492–13499,doi:10.1021/jp064993k, 2006a.
Butkovskaya, N. I., Pouvesle, N., Kukui, A., Mu, Y., and Le Bras,G.: Mechanism of the OH-initiated oxidation of hydroxyacetoneover the temperature Range 236-298 K, J. Phys. Chem. A, 110,6833–6843,doi:10.1021/jp056345r, 2006b.
Capes, G., Johnson, B., McFiggans, G., Williams, P. I., Haywood,J., and Coe, H.: Aging of biomass burning aerosols over WestAfrica: Aircraft measurements of chemical composition, micro-physical properties, and emission ratios, J. Geophys. Res. At-mos., 113, D00C15,doi:10.1029/2008JD009845, 2008.
Capouet, M., Peeters, J., Noziere, B., and Muller, J.-F.: Alpha-pinene oxidation by OH: simulations of laboratory experiments,Atmos. Chem. Phys., 4, 2285–2311,doi:10.5194/acp-4-2285-2004, 2004.
Carlos-Cuellar, S., Li, P., Christensen, A. P., Krueger, B. J., Bur-richter, C., and Grassian, V. H.: Heterogeneous uptake kineticsof volatile organic compounds on oxide surfaces using a Knud-sen cell reactor: Adsorption of acetic acid, formaldehyde, andmethanol onα-Fe2O3, α-Al2O3, and SiO2, J. Phys. Chem. A,107, 4250–4261,doi:10.1021/jp0267609, 2003.
Carrasco, N., Doussin, J.-F., Picquet-Varrault, B., and Carlier,P.: Tropospheric degradation of 2-hydroxy-2-methylpropanal,a photo-oxidation product of 2-methyl-3-buten-2-ol: Ki-netic and mechanistic study of its photolysis and its re-action with OH radicals, Atmos. Environ., 40, 2011–2019,doi:10.1016/j.atmosenv.2005.11.042, 2006.
Carrasco, N., Doussin, J., O’Connor, M., Wenger, J., Picquet-Varrault, B., Durand-Jolibois, R., and Carlier, P.: Simulationchamber studies of the atmospheric oxidation of 2-methyl-3-buten-2-ol: Reaction with hydroxyl radicals and ozone un-der a variety of conditions, J. Atmos. Chem., 56, 33–55,doi:10.1007/s10874-006-9041-y, 2007.
Chameides, W. L.: The photochemistry of a remote ma-rine stratiform cloud, J. Geophys. Res., 89, 4739–4755,doi:10.1029/JD089iD03p04739, 1984.
Chebbi, A. and Carlier, P.: Carboxylic acids in the troposphere,occurrence, sources, and sinks: A review, Atmos. Environ., 30,4233–4249,doi:10.1016/1352-2310(96)00102-1, 1996.
Christian, T. J., Kleiss, B., Yokelson, R. J., Holzinger, R., Crutzen,P. J., Hao, W. M., Saharjo, B. H., and Ward, D. E.: Comprehen-sive laboratory measurements of biomass-burning emissions: 1.Emissions from Indonesian, African, and other fuels, J. Geophys.Res., 108, 4719,doi:10.1029/2003JD003704, 2003.
Clerbaux, C., Boynard, A., Clarisse, L., George, M., Hadji-Lazaro,J., Herbin, H., Hurtmans, D., Pommier, M., Razavi, A., Turquety,S., Wespes, C., and Coheur, P.-F.: Monitoring of atmosphericcomposition using the thermal infrared IASI/MetOp sounder, At-mos. Chem. Phys., 9, 6041–6054,doi:10.5194/acp-9-6041-2009,2009.
Crounse, J. D., McKinney, K. A., Kwan, A. J., and Wennberg,P. O.: Measurement of gas-phase hydroperoxides by chemi-cal ionization mass spectrometry., Anal. Chem., 78, 6726–6732,doi:10.1021/ac0604235, 2006.
Crowley, J. N., Ammann, M., Cox, R. A., Hynes, R. G., Jenkin,M. E., Mellouki, A., Rossi, M. J., Troe, J., and Wallington, T. J.:
www.atmos-chem-phys.net/11/1989/2011/ Atmos. Chem. Phys., 11, 1989–2013, 2011
2008 F. Paulot et al.: Formic and acetic acid budget
Evaluated kinetic and photochemical data for atmospheric chem-istry: Volume V - heterogeneous reactions on solid substrates,Atmos. Chem. Phys., 10, 9059–9223,doi:10.5194/acp-10-9059-2010, 2010.
da Silva, G.: Carboxylic Acid Catalyzed Keto-Enol Tautomer-izations in the Gas Phase, Angew. Chem., 49, 7523–7525,doi:10.1002/anie.201003530, 2010.
Davidson, E.: Pulses of nitric oxide and nitrous oxide flux follow-ing wetting of dry soil: An assessment of probable sources andimportance relative to annual fluxes, Ecol. Bull., 149–155, 1992.
de Gouw, J. A. and Warneke, C.: Measurements of volatile organiccompounds in the earth’s atmosphere using proton-transfer-reaction mass spectrometry, Mass Spectrom. Rev., 26, 223–257,doi:10.1002/mas.20119, 2007.
de Gouw, J. A., Middlebrook, A. M., Warneke, C., Goldan, P. D.,Kuster, W. C., Roberts, J. M., Fehsenfeld, F. C., Worsnop,D. R., Canagaratna, M. R., Pszenny, A. A. P., Keene, W. C.,Marchewka, M., Bertman, S. B., and Bates, T. S.: Budget of or-ganic carbon in a polluted atmosphere: Results from the NewEngland Air Quality Study in 2002, J. Geophys. Res. Atmos.,110, 16305,doi:10.1029/2004JD005623, 2005.
de Gouw, J. A., Warneke, C., Stohl, A., Wollny, A. G., Brock, C. A.,Cooper, O. R., Holloway, J. S., Trainer, M., Fehsenfeld, F. C.,Atlas, E. L., Donnelly, S. G., Stroud, V., and Lueb, A.: Volatileorganic compounds composition of merged and aged forest fireplumes from Alaska and western Canada, J. Geophys. Res. At-mos., 111, 10303,doi:10.1029/2005JD006175, 2006.
DeCarlo, P. F., Dunlea, E. J., Kimmel, J. R., Aiken, A. C., Sueper,D., Crounse, J., Wennberg, P. O., Emmons, L., Shinozuka, Y.,Clarke, A., Zhou, J., Tomlinson, J., Collins, D. R., Knapp, D.,Weinheimer, A. J., Montzka, D. D., Campos, T., and Jimenez,J. L.: Fast airborne aerosol size and chemistry measurementsabove Mexico City and Central Mexico during the MILAGROcampaign, Atmos. Chem. Phys., 8, 4027–4048,doi:10.5194/acp-8-4027-2008, 2008.
Dibb, J. E. and Arsenault, M.: Shouldn’t snowpacks be sourcesof monocarboxylic acids?, Atmos. Environ., 36, 2513–2522,doi:10.1016/S1352-2310(02)00131-0, 2002.
Dillon, T. J. and Crowley, J. N.: Direct detection of OH formationin the reactions of HO2 with CH3C(O)O2 and other substitutedperoxy radicals, Atmos. Chem. Phys., 8, 4877–4889,http://www.atmos-chem-phys.net/8/4877/2008/, 2008.
Duncan, B. N., Logan, J. A., Bey, I., Megretskaia, I. A., Yan-tosca, R. M., Novelli, P. C., Jones, N. B., and Rinsland, C. P.:Global budget of CO, 1988-1997: Source estimates and valida-tion with a global model, J. Geophys. Res. Atmos., 112, 22301,doi:10.1029/2007JD008459, 2007.
Dunlea, E. J., DeCarlo, P. F., Aiken, A. C., Kimmel, J. R., Peltier,R. E., Weber, R. J., Tomlinson, J., Collins, D. R., Shinozuka,Y., McNaughton, C. S., Howell, S. G., Clarke, A. D., Emmons,L. K., Apel, E. C., Pfister, G. G., van Donkelaar, A., Martin,R. V., Millet, D. B., Heald, C. L., and Jimenez, J. L.: Evolutionof Asian aerosols during transpacific transport in INTEX-B, At-mos. Chem. Phys., 9, 7257–7287,doi:10.5194/acp-9-7257-2009,2009.
Eichler, A., Brutsch, S., Olivier, S., Papina, T., and Schwikowski,M.: A 750 year ice core record of past biogenic emissionsfrom Siberian boreal forests, Geophys. Res. Lett., 36, 18813,doi:10.1029/2009GL038807, 2009.
Eliason, T. L., Aloisio, S., Donaldson, D. J., Cziczo, D. J.,and Vaida, V.: Processing of unsaturated organic acid filmsand aerosols by ozone, Atmos. Environ., 37, 2207–2219,doi:10.1016/S1352-2310(03)00149-3, 2003.
Eliason, T. L., Gilman, J. B., and Vaida, V.: Oxidation of or-ganic films relevant to atmospheric aerosols, Atmos. Environ.,38, 1367–1378,doi:10.1016/j.atmosenv.2003.11.025, 2004.
Enders, G., Dlugi, R., Steinbrecher, R., Clement, B., Daiber,R., Eijk, J., Gab, S., Haziza, M., Helas, G., Herrmann, U.,Kessel, M., Kesselmeier, J., Kotzias, D., Kourtidis, K., Kurth,H.-H., McMillen, R., Roider, G., Schurmann, W., Teichmann,U., and Torres, L.: Biosphere/Atmosphere interactions: Inte-grated research in a European coniferous forest ecosystem, At-mospheric Environment. Part A. General Topics, 26, 171–189,doi:10.1016/0960-1686(92)90269-Q, 1992.
Fairlie, T. D., Jacob, D. J., and Park, R. J.: The impact of transpa-cific transport of mineral dust in the United States, Atmos. Envi-ron., 41, 1251–1266,doi:10.1016/j.atmosenv.2006.09.048, 2007.
Falkovich, A. H., Schkolnik, G., Ganor, E., and Rudich, Y.: Adsorp-tion of organic compounds pertinent to urban environments ontomineral dust particles, J. Geophys. Res. Atmos., 109, D02208,doi:10.1029/2003JD003919, 2004.
Fehsenfeld, F. C., Ancellet, G., Bates, T. S., Goldstein, A. H., Hard-esty, R. M., Honrath, R., Law, K. S., Lewis, A. C., Leaitch, R.,McKeen, S., Meagher, J., Parrish, D. D., Pszenny, A. A. P., Rus-sell, P. B., Schlager, H., Seinfeld, J., Talbot, R., and Zbinden, R.:International Consortium for Atmospheric Research on Trans-port and Transformation (ICARTT): North America to Europe-Overview of the 2004 summer field study, J. Geophys. Res. At-mos., 111, D23S01,doi:10.1029/2006JD007829, 2006.
Fu, T., Jacob, D. J., Wittrock, F., Burrows, J. P., Vrekoussis,M., and Henze, D. K.: Global budgets of atmospheric gly-oxal and methylglyoxal, and implications for formation of sec-ondary organic aerosols, J. Geophys. Res. Atmos., 113, 15 303,doi:10.1029/2007JD009505, 2008.
Fuhrer, K. and Legrand, M.: Continental biogenic species in theGreenland Ice Core Project ice core: Tracing back the biomasshistory of the North American continent, J. Geophys. Res., 102,26735–26746,doi:10.1029/97JC01299, 1997.
Galano, A., Alvarez-Idaboy, J., Ruiz-Santoyo, M., and Vivier-Bunge, A.: Rate coefficient and mechanism of the gas phaseOH hydrogen abstraction reaction from formic acid: A quan-tum mechanical approach, J. Phys. Chem. A, 106, 9520–9528,doi:10.1021/jp020297i, 2002.
Galloway, J. N., Likens, G. E., Keene, W. C., and Miller, J. M.:The composition of precipitation in remote areas of the world, J.Geophys. Res., 87, 8771–8786,doi:10.1029/JC087iC11p08771,1982.
Gao, S., Hegg, D., Hobbs, P., Kirchstetter, T., Magi, B., andSadilek, M.: Water-soluble organic components in aerosolsassociated with savanna fires in southern Africa: Identifica-tion, evolution, and distribution, J. Geophys. Res., 108, 8491,doi:10.1029/2002JD002324, 2003.
George, I. J., Slowik, J., and Abbatt, J. P. D.: Chemicalaging of ambient organic aerosol from heterogeneous reac-tion with hydroxyl radicals, Geophys. Res. Lett., 35, 13811,doi:10.1029/2008GL033884, 2008.
Giglio, L., Randerson, J. T., van der Werf, G. R., Kasibhatla,P. S., Collatz, G. J., Morton, D. C., and DeFries, R. S.: Assess-
Atmos. Chem. Phys., 11, 1989–2013, 2011 www.atmos-chem-phys.net/11/1989/2011/
F. Paulot et al.: Formic and acetic acid budget 2009
ing variability and long-term trends in burned area by mergingmultiple satellite fire products, Biogeosciences, 7, 1171–1186,doi:10.5194/bg-7-1171-2010, 2010.
Glasius, M., Wessel, S., Christensen, C., Jacobsen, J., Jørgensen,H., Klitgaard, K., Petersen, L., Rasmussen, J., Stroyer Hansen,T., Lohse, C., Boaretto, E., and Heinemeier, J.: Sources to formicacid studied by carbon isotopic analysis and air mass charac-terization, Atmos. Environ., 34, 2471–2479,doi:10.1016/S1352-2310(99)00416-1, 2000.
Glasius, M., Boel, C., Bruun, N., Easa, L. M., Hornung, P., Klausen,H. S., Klitgaard, K. C., Lindeskov, C., Møller, C. K., Nissen,H., Petersen, A. P. F., Kleefeld, S., Boaretto, E., Hansen, T. S.,Heinemeier, J., and Lohse, C.: Relative contribution of biogenicand anthropogenic sources to formic and acetic acids in the at-mospheric boundary layer, J. Geophys. Res., 106, 7415–7426,doi:10.1029/2000JD900676, 2001.
Goldstein, A. H., Koven, C. D., Heald, C. L., and Fung, I. Y.: Bio-genic carbon and anthropogenic pollutants combine to form acooling haze over the southeastern United States, P. Natl. Acad.Sci. USA, 106, 8835–8840,doi:10.1073/pnas.0904128106,2009.
Gonzalez Abad, G., Bernath, P. F., Boone, C. D., McLeod, S. D.,Manney, G. L., and Toon, G. C.: Global distribution of upper tro-pospheric formic acid from the ACE-FTS, Atmos. Chem. Phys.,9, 8039–8047,doi:10.5194/acp-9-8039-2009, 2009.
Goode, J. G., Yokelson, R. J., Ward, D. E., Susott, R. A., Bab-bitt, R. E., Davies, M. A., and Hao, W. M.: Measurementsof excess O3, CO2, CH4, C2H4, C2H2, HCN, NO, NH3,HCOOH, CH3COOH, HCHO, and CH3OH in 1997 Alaskanbiomass burning plumes by airborne Fourier transform infraredspectroscopy (AFTIR), J. Geophys. Res., 105, 22147–22166,doi:10.1029/2000JD900287, 2000.
Graedel, T. E. and Eisner, T.: Atmospheric formic acid fromformicine ants: a preliminary assessment, Tellus B, 40, 335–339,doi:10.1111/j.1600-0889.1988.tb00107.x, 1988.
Grosjean, D., Williams, E. L., and Grosjean, E.: Atmosphericchemistry of isoprene and of its carbonyl products, Environ. Sci.Technol., 27, 830–840,doi:10.1021/es00042a004, 1993.
Grutter, M., Glatthor, N., Stiller, G. P., Fischer, H., Grabowski, U.,Hopfner, M., Kellmann, S., Linden, A., and von Clarmann, T.:Global distribution and variability of formic acid as observedby MIPAS-ENVISAT, J. Geophys. Res. Atmos., 115, 10303,doi:10.1029/2009JD012980, 2010.
Guenther, A., Geron, C., Pierce, T., Lamb, B., Harley, P., andR., F.: Natural emissions of non-methane volatile organic com-pounds, carbon monoxide, and oxides of nitrogen from NorthAmerica, Atmos. Environ., 34, 2205–2230,doi:10.1016/S1352-2310(99)00465-3, 2000.
Guenther, A., Karl, T., Harley, P., Wiedinmyer, C., Palmer, P. I.,and Geron, C.: Estimates of global terrestrial isoprene emissionsusing MEGAN (Model of Emissions of Gases and Aerosols fromNature), Atmos. Chem. Phys., 6, 3181–3210,doi:10.5194/acpd-6-107-2006, 2006.
Harley, P., Fridd-Stroud, V., Greenberg, J., Guenther, A.,and Vasconcellos, P.: Emission of 2-methyl-3-buten-2-ol bypines- A potentially large natural source of reactive carbonto the atmosphere, J. Geophys. Res., 103(25), 25479–25486,doi:10.1029/98JD00820, 1998.
Hasson, A. S., Tyndall, G. S., and Orlando, J. J.: A product
yield study of the reaction of HO2 radicals with ethyl peroxy(C2H5O2), acetyl peroxy (CH3 C(O)O2), and acetonyl peroxy(CH3C(O)CH2O2) radicals, J. Phys. Chem. A, 108, 5979–5989,doi:10.1021/jp048873t, 2004.
Hatakeyama, S., Washida, N., and Akimoto, H.: Rate constantsand mechanisms for the reaction of hydroxyl (OD) radicals withacetylene, propyne, and 2-butyne in air at 297± 2 K, J. Phys.Chem., 90, 173–178,doi:10.1021/j100273a039, 1986.
Hatch, C. D., Gough, R. V., and Tolbert, M. A.: Heterogeneous up-take of the C1 to C4 organic acids on a swelling clay mineral, At-mos. Chem. Phys., 7, 4445–4458,http://www.atmos-chem-phys.net/7/4445/2007/, 2007.
Heald, C. L., Kroll, J. H., Jimenez, J. L., Docherty, K. S., DeCarlo,P. F., Aiken, A. C., Chen, Q., Martin, S. T., Farmer, D. K., andArtaxo, P.: A simplified description of the evolution of organicaerosol composition in the atmosphere, Geophys. Res. Lett., 37,8803,doi:10.1029/2010GL042737, 2010.
Hermans, I., Muller, J. F., Nguyen, T. L., Jacobs, P., and Peeters,J.: Kinetics of-Hydroxy-alkylperoxyl Radicals in Oxidation Pro-cesses. HO2 Initiated Oxidation of Ketones/Aldehydes near theTropopause, J. Phys. Chem. A, 109, 4303–4311, 2005.
Herndon, S. C., Zahniser, M. S., Nelson, D. D., Shorter, J., Mc-Manus, J. B., Jimenez, R., Warneke, C., and de Gouw, J. A.:Airborne measurements of HCHO and HCOOH during the NewEngland Air Quality Study 2004 using a pulsed quantum cas-cade laser spectrometer, J. Geophys. Res. Atmos., 112, D10S03,doi:10.1029/2006JD007600, 2007.
Huang, Y. W., Dransfield, T. J., Miller, J. D., Rojas, R. D.,Castillo, X. G., and Anderson, J. G.: Experimental Study ofthe Kinetics of the Reaction of Acetic Acid with HydroxylRadicals from 255 to 355 K, J. Phys. Chem. A, 113, 423–430,doi:10.1021/jp808627w, 2009.
Ito, A., Sillman, S., and Penner, J. E.: Effects of addi-tional nonmethane volatile organic compounds, organic ni-trates, and direct emissions of oxygenated organic species onglobal tropospheric chemistry, J. Geophys. Res., 112, D06309,doi:10.1029/2005JD006556, 2007.
Jacob, D. J.: Chemistry of OH in remote clouds and its role in theproduction of formic acid and peroxymonosulfate, J. Geophys.Res., 91, 9807–9826,doi:10.1029/JD091iD09p09807, 1986.
Jacob, D. J. and Wofsy, S. C.: Photochemistry of biogenic emis-sions over the Amazon forest, J. Geophys. Res., 93, 1477–1486,doi:10.1029/JD093iD02p01477, 1988.
Jenkin, M. E., Hurley, M. D., and Wallington, T. J.: Investigation ofthe radical product channel of the CH3 C (O) O2 + HO2 reactionin the gas phase, Phys. Chem. Chem. Phys., 9, 3149–3162, 2007.
Jimenez, J. L., Canagaratna, M. R., Donahue, N. M., Prevot, A.S. H., Zhang, Q., Kroll, J. H., DeCarlo, P. F., Allan, J. D., Coe,H., Ng, N. L., Aiken, A. C., Docherty, K. S., Ulbrich, I. M.,Grieshop, A. P., Robinson, A. L., Duplissy, J., Smith, J. D.,Wilson, K. R., Lanz, V. A., Hueglin, C., Sun, Y. L., Tian, J.,Laaksonen, A., Raatikainen, T., Rautiainen, J., Vaattovaara, P.,Ehn, M., Kulmala, M., Tomlinson, J. M., Collins, D. R., Cu-bison, M. J., E., Dunlea, J., Huffman, J. A., Onasch, T. B.,Alfarra, M. R., Williams, P. I., Bower, K., Kondo, Y., Schnei-der, J., Drewnick, F., Borrmann, S., Weimer, S., Demerjian, K.,Salcedo, D., Cottrell, L., Griffin, R., Takami, A., Miyoshi, T.,Hatakeyama, S., Shimono, A., Sun, J. Y., Zhang, Y. M., Dzepina,K., Kimmel, J. R., Sueper, D., Jayne, J. T., Herndon, S. C., Trim-
www.atmos-chem-phys.net/11/1989/2011/ Atmos. Chem. Phys., 11, 1989–2013, 2011
2010 F. Paulot et al.: Formic and acetic acid budget
born, A. M., Williams, L. R., Wood, E. C., Middlebrook, A. M.,Kolb, C. E., Baltensperger, U., and Worsnop, D. R.: Evolution ofOrganic Aerosols in the Atmosphere, Science, 326, 1525–1529,doi:10.1126/science.1180353, 2009.
Karl, M., Guenther, A., Koble, R., Leip, A., and Seufert, G.: A newEuropean plant-specific emission inventory of biogenic volatileorganic compounds for use in atmospheric transport models, Bio-geosciences, 6, 1059–1087,doi:10.5194/bg-6-1059-2009, 2009.
Kawamura, K., Ng, L., and Kaplan, I.: Determination of or-ganic acids (C1–C10) in the atmosphere, motor exhausts,and engine oils, Environ. Sci. Technol., 19, 1082–1086,doi:10.1021/es00141a010, 1985.
Keene, W. C. and Galloway, J. N.: The biogeochemical cy-cling of formic and acetic acids through the troposphere -An overview of current understanding, Tellus B, 40, 322–334,doi:10.1111/j.1600-0889.1988.tb00106.x, 1988.
Kesselmeier, J.: Exchange of short-chain oxygenated volatile or-ganic compounds (VOCs) between plants and the atmosphere: Acompilation of field and laboratory studies, J. Atmos. Chem., 39,219–233,doi:10.1023/A:1010632302076, 2001.
Kesselmeier, J. and Staudt, M.: Biogenic Volatile Or-ganic Compounds (VOC): An Overview on Emission,Physiology and Ecology, J. Atmos. Chem., 33, 23–88,doi:10.1023/A:1006127516791, 1999.
Kesselmeier, J., Bode, K., Gerlach, C., and Jork, E.: Exchange ofatmospheric formic and acetic acids with trees and crop plantsunder controlled chamber and purified air conditions, Atmos.Environ., 32, 1765–1775,doi:10.1016/S1352-2310(97)00465-2,1998.
Khare, P., Kumar, N., Kumari, K. M., and Srivastava, S. S.: Atmo-spheric formic and acetic acids: An overview, Rev. Geophys.,37, 227–248,doi:10.1029/1998RG900005, 1999.
Kroll, J. H., Smith, J. D., Che, D. L., Kessler, S. H., Worsnop,D. R., and Wilson, K. R.: Measurement of fragmentation andfunctionalization pathways in the heterogeneous oxidation of ox-idized organic aerosol, Phys. Chem. Chem. Phys., 11, 8005o,doi:10.1039/b905289e, 2009.
Kurylo, M. and Solomon, S.: Network for the detection of strato-spheric change: a status and implementation report, NASA andNOAA Special Report, 1990.
Kwan, A. J., Crounse, J. D., Clarke, A. D., Shinozuka, Y., An-derson, B. E., Crawford, J. H., Avery, M. A., McNaughton,C. S., Brune, W. H., Singh, H. B., and Wennberg, P. O.:On the flux of oxygenated volatile organic compounds fromorganic aerosol oxidation, Geophys. Res. Lett., 33, L15815,doi:10.1029/2006GL026144, 2006.
Larsen, B. R., Di Bella, D., Glasius, M., Winterhalter, R., Jensen,N. R., and Hjorth, J.: Gas-phase OH oxidation of monoterpenes:Gaseous and particulate products, J. Atmos. Chem., 38, 231–276,doi:10.1023/A:1006487530903, 2001.
Lathiere, J., Hauglustaine, D. A., Friend, A. D., De Noblet-Ducoudre, N., Viovy, N., and Folberth, G. A.: Impact of climatevariability and land use changes on global biogenic volatile or-ganic compound emissions, Atmos. Chem. Phys., 6, 2129–2146,doi:10.5194/acp-6-2129-2006, 2006.
Lee, A., Goldstein, A. H., Keywood, M. D., Gao, S., Varut-bangkul, V., Bahreini, R., Ng, N. L., Flagan, R. C., and Se-infeld, J. H.: Gas-phase products and secondary aerosol yieldsfrom the ozonolysis of ten different terpenes, J. Geophys. Res.,
111, D07302,doi:10.1029/2005JD006437, 2006.Lee, M., Heikes, B. G., and O’Sullivan, D. W.: Hydrogen peroxide
and organic hydroperoxide in the troposphere: a review, Atmos.Environ., 34, 3475–3494,doi:10.1016/S1352-2310(99)00432-X,2000.
Lee, S., Murphy, D. M., Thomson, D. S., and Middlebrook,A. M.: Chemical components of single particles measured withParticle Analysis by Laser Mass Spectrometry (PALMS) dur-ing the Atlanta SuperSite Project: Focus on organic/sulfate,lead, soot, and mineral particles, J. Geophys. Res., 107, 4003,doi:10.1029/2000JD000011, 2002.
Legrand, M. and De Angelis, M.: Light carboxylic acids in Green-land ice: A record of past forest fires and vegetation emis-sions from the boreal zone, J. Geophys. Res., 101, 4129–4146,doi:10.1029/95JD03296, 1996.
Lelieveld, J. and Crutzen, P.: The role of clouds in tro-pospheric photochemistry, J. Atmos. Chem., 12, 229–267,doi:10.1007/BF00048075, 1991.
Liu, H., Jacob, D. J., Bey, I., and Yantosca, R. M.: Constraintsfrom 210Pb and7Be on wet deposition and transport in a globalthree-dimensional chemical tracer model driven by assimilatedmeteorological fields, J. Geophys. Res., 106, 12109–12128,doi:10.1029/2000JD900839, 2001.
Marecal, V., Pirre, M., Riviere, E. D., Pouvesle, N., Crowley, J. N.,Freitas, S. R., and Longo, K. M.: Modelling the reversible up-take of chemical species in the gas phase by ice particles formedin a convective cloud, Atmos. Chem. Phys., 10, 4977–5000,doi:10.5194/acp-10-4977-2010, 2010.
Mari, C., Bechtold, P., and Jacob, D.: Transport and scavenging ofsoluble gases in a deep convective cloud, J. Geophys. Res., 105,22255–22268,doi:10.1029/2000JD900211, 2000.
Millet, D. B., Guenther, A., Siegel, D. A., Nelson, N. B., Singh,H. B., de Gouw, J. A., Warneke, C., Williams, J., Eerdekens,G., Sinha, V., Karl, T., Flocke, F., Apel, E., Riemer, D. D.,Palmer, P. I., and Barkley, M.: Global atmospheric budget ofacetaldehyde: 3-D model analysis and constraints from in-situand satellite observations, Atmos. Chem. Phys., 10, 3405–3425,http://www.atmos-chem-phys.net/10/3405/2010/, 2010.
Molina, M. J., Ivanov, A. V., Trakhtenberg, S., and Molina, L. T.:Atmospheric evolution of organic aerosol, Geophys. Res. Lett.,31, 22 104,doi:10.1029/2004GL020910, 2004.
Neeb, P., Sauer, F., Horie, O., and Moortgat, G. K.: Formation ofhydroxymethyl hydroperoxide and formic acid in alkene ozonol-ysis in the presence of water vapour, Atmos. Environ., 31, 1417–1423,doi:10.1016/S1352-2310(96)00322-6, 1997.
Ngwabie, N. M., Schade, G. W., Custer, T. G., Linke, S., and Hinz,T.: Abundances and flux estimates of volatile organic compoundsfrom a dairy cowshed in Germany, J. Environ. Qual., 37, 565–573,doi:10.2134/jeq2006.0417, 2008.
Orlando, J. J., Noziere, B., Tyndall, G. S., Orzechowska, G. E.,Paulson, S. E., and Rudich, Y.: Product studies of the OH- andozone-initiated oxidation of some monoterpenes, J. Geophys.Res., 105, 11 561–11 572,doi:10.1029/2000JD900005, 2000.
Otter, L. B., Guenther, A., and Greenberg, J.: Seasonal and spa-tial variations in biogenic hydrocarbon emissions from southernAfrican savannas and woodlands, Atmos. Environ., 36, 4265–4275,doi:10.1016/S1352-2310(02)00333-3, 2002.
Pan, X., Underwood, J. S., Xing, J.-H., Mang, S. A., and Nizko-rodov, S. A.: Photodegradation of secondary organic aerosol gen-
Atmos. Chem. Phys., 11, 1989–2013, 2011 www.atmos-chem-phys.net/11/1989/2011/
F. Paulot et al.: Formic and acetic acid budget 2011
erated from limonene oxidation by ozone studied with chemi-cal ionization mass spectrometry, Atmos. Chem. Phys., 9, 3851–3865,doi:10.5194/acp-9-3851-2009, 2009.
Park, R. J., Jacob, D. J., Chin, M., and Martin, R. V.: Sourcesof carbonaceous aerosols over the United States and implica-tions for natural visibility, J. Geophys. Res. Atmos., 108, 4355,doi:10.1029/2002JD003190, 2003.
Park, J., Gomez, A. L., Walser, M. L., Lin, A., and Nizkorodov,S. A.: Ozonolysis and photolysis of alkene-terminated self-assembled monolayers on quartz nanoparticles: implications forphotochemical aging of organic aerosol particles, Phys. Chem.Chem. Phys., 8, 2506,doi:10.1039/b602704k, 2006.
Parrish, D. D., Allen, D. T., Bates, T. S., Estes, M., Fehsenfeld,F. C., Feingold, G., Ferrare, R., Hardesty, R. M., Meagher, J. F.,Nielsen-Gammon, J. W., Pierce, R. B., Ryerson, T. B., Seinfeld,J. H., and Williams, E. J.: Overview of the Second Texas AirQuality Study (TexAQS II) and the Gulf of Mexico AtmosphericComposition and Climate Study (GoMACCS), J. Geophys. Res.Atmos., 114, D00F13,doi:10.1029/2009JD011842, 2009.
Paton-Walsh, C., Jones, N. B., Wilson, S. R., Haverd, V., Meier, A.,Griffith, D. W. T., and Rinsland, C. P.: Measurements of tracegas emissions from Australian forest fires and correlations withcoincident measurements of aerosol optical depth, J. Geophys.Res. Atmos., 110, 24305,doi:10.1029/2005JD006202, 2005.
Paulot, F., Crounse, J. D., Kjaergaard, H. G., Kroll, J. H., Seinfeld,J. H., and Wennberg, P. O.: Isoprene photooxidation: new in-sights into the production of acids and organic nitrates, Atmos.Chem. Phys., 9, 1479–1501,http://www.atmos-chem-phys.net/9/1479/2009/, 2009.
Peeters, J., Vereecken, L., and Fantechi, G.: The detailed mech-anism of the OH-initiated atmospheric oxidation ofα-pinene:a theoretical study, Phys. Chem. Chem. Phys., 3, 5489–5504,doi:10.1039/b106555f, 2001.
Peeters, J., Nguyen, T., and Vereecken, L.: HOx radical regenera-tion in the oxidation of isoprene, Phys. Chem. Chem. Phys., 11,5935–5939,doi:10.1039/b908511d, 2009.
Peters, W., Krol, M. C., Fortuin, J. P. F., Kelder, H. M., Thomp-son, A. M., Becker, C. R., Lelieveld, J., and Crutzen, P. J.: Tro-pospheric ozone over a tropical Atlantic station in the NorthernHemisphere: Paramaribo, Surinam (6◦ N, 55◦ W), Tellus B, 56,21–34,doi:10.1111/j.1600-0889.2004.00083.x, 2004.
Petersen, A. K., Warneke, T., Lawrence, M. G., Notholt, J., andSchrems, O.: First ground-based FTIR observations of the sea-sonal variation of carbon monoxide in the tropics, Geophys. Res.Lett., 35, 3813,doi:10.1029/2007GL031393, 2008.
Pinceloup, S., Laverdet, G., Maguin, F., Doussin, J. F., Car-lier, P., and Bras, G. L.: Laboratory investigation of the pho-tooxidation of formaldehyde combining FTIR analysis of stablespecies and HO2 detection by the chemical amplifier technique,J. Photochem. Photobiol., A, 157, 275–281,doi:10.1016/S1010-6030(03)00066-2, 2003.
Poisson, N., Kanakidou, M., and Crutzen, P. J.: Impactof Non-Methane Hydrocarbons on Tropospheric Chemistryand the Oxidizing Power of the Global Troposphere: 3-Dimensional Modelling Results, J. Atmos. Chem., 36, 157–230,doi:10.1023/A:1006300616544, 2000.
Prince, A., Kleiber, P., Grassian, V., and Young, M.: Reactiveuptake of acetic acid on calcite and nitric acid reacted cal-cite aerosol in an environmental reaction chamber, Phys. Chem.
Chem. Phys., 10, 142–152,doi:10.1039/b712915g, 2008.Randerson, J. T., van der Werf, G. R., Giglio, L., Collatz, G. J.,
and Kasibhatla, P. S.: Global Fire Emissions Database, Ver-sion 2 (GFEDv2), Tech. rep., Oak Ridge National Labora-tory Distributed Active Archive Center, Oak Ridge, TN, USA,doi:10.3334/ORNLDAAC/834, 2006.
Razavi, A., Karagulian, F., Clarisse, L., Hurtmans, D., Coheur, P. F.,Clerbaux, C., Muller, J. F., and Stavrakou, T.: Global distribu-tions of methanol and formic acid retrieved for the first time fromthe IASI/MetOp thermal infrared sounder, Atmos. Chem. Phys.,11, 857–872,doi:10.5194/acp-11-857-2011, 2011.
Rinsland, C. P., Boone, C. D., Bernath, P. F., Mahieu, E., Zander, R., Dufour, G., Clerbaux, C., Turquety, S., Chiou, L., Mc-Connell,J. C., Neary, L., and Kaminski, J. W.: Atmospheric Chem-istry Experiment austral spring 2004 and 2005 Southern Hemi-sphere tropical-mid-latitude upper tropospheric measurements,Geophys. Res. Lett, 33, L23804,doi:10.1029/2006GL027128,2006.
Rinsland, C. P., Dufour, G., Boone, C. D., Bernath, P. F., Chiou,L., Coheur, P.-F., Turquety, S., and Clerbaux, C.: Satellite bo-real measurements over Alaska and Canada during June-July2004: Simultaneous measurements of upper tropospheric CO,C2H6, HCN, CH3Cl, CH4, C2H2, CH3OH, HCOOH, OCS,and SF6 mixing ratios, Global Biogeochem. Cy., 21, B3008,doi:10.1029/2006GB002795, 2007.
Robinson, A. L., Donahue, N. M., Shrivastava, M. K., Weitkamp,E. A., Sage, A. M., Grieshop, A. P., Lane, T. E., Pierce, J. R.,and Pandis, S. N.: Rethinking Organic Aerosols: SemivolatileEmissions and Photochemical Aging, Science, 315, 1259,doi:10.1126/science.1133061, 2007.
Rothman, L. S., Gordon, I. E., Barbe, A., Benner, D. C., Bernath,P. F., Birk, M., Boudon, V., Brown, L. R., Campargue, A.,Champion, J.-P., Chance, K., Coudert, L. H., Dana, V., Devi,V. M., Fally, S., Flaud, J.-M., Gamache, R. R., Goldman,A., Jacquemart, D., Kleiner, I., Lacome, N., Lafferty, W. J.,Mandin, J.-Y., Massie, S. T., Mikhailenko, S. N., Miller, C. E.,Moazzen-Ahmadi, N., Naumenko, O. V., Nikitin, A. V., Or-phal, J., Perevalov, V. I., Perrin, A., Predoi-Cross, A., Rins-land, C. P., Rotger, M., Simeckov, M., Smith, M. A. H., Sung,K., Tashkun, S. A., Tennyson, J., Toth, R. A., Vandaele, A.C., and Auwera, J. V.: The HITRAN 2008 molecular spec-troscopic database, J. Quant. Spectrosc. Ra., 110, 533–572,doi:10.1016/j.jqsrt.2009.02.013, 2009.
Russell, L. M., Maria, S. F., and Myneni, S. C. B.: Mapping organiccoatings on atmospheric particles, Geophys. Res. Lett., 29, 1779,doi:10.1029/2002GL014874, 2002.
Sander, R.: Compilation of Henry’s Law Constants for Inorganicand Organic Species of Potential Importance in EnvironmentalChemistry (Version 3), Tech. rep., 1999.
Sanhueza, E. and Andreae, M. O.: Emission of formic and aceticacids from tropical savanna soils, Geophys. Res. Lett., 18, 1707–1710,doi:10.1029/91GL01565, 1991.
Sanhueza, E., Figueroa, L., and Santana, M.: Atmospheric formicand acetic acids in Venezuela, Atmos. Environ., 30, 1861–1873,doi:10.1016/1352-2310(95)00383-5, joint 8th CAGCP and 2ndIGAC Conference on Global Atmospheric Chemistry, 1996.
Shaw, S., Mitloehner, F., Jackson, W., DePeters, E., Fadel, J.,Robinson, P., Holzinger, R., and Goldstein, A.: Volatile organiccompound emissions from dairy cows and their waste as mea-
www.atmos-chem-phys.net/11/1989/2011/ Atmos. Chem. Phys., 11, 1989–2013, 2011
2012 F. Paulot et al.: Formic and acetic acid budget
sured by proton-transfer-reaction mass spectrometry, Environ.Sci. Technol, 41, 1310–1316,doi:10.1021/es061475e, 2007.
Singh, H. B., Brune, W. H., Crawford, J. H., Flocke, F., and Ja-cob, D. J.: Chemistry and transport of pollution over the Gulfof Mexico and the Pacific: spring 2006 INTEX-B campaignoverview and first results, Atmos. Chem. Phys., 9, 2301–2318,doi:10.5194/acp-9-2301-2009,2009.
Sinreich, R., Coburn, S., Dix, B., and Volkamer, R.: Ship-baseddetection of glyoxal over the remote tropical Pacific Ocean,Atmos. Chem. Phys., 10, 11359–11371,doi:10.5194/acp-10-11359-2010, 2010.
Sposito, G.: The Chemistry of Soils, Oxford University. Press,1989.
Sun, W. and Saeys, M.: first principles Study of the Reaction ofFormic and Acetic Acids with Hydroxyl Radicals, J. Phys. Chem.A, 112, 6918–6928,doi:10.1021/jp802017q, 2008.
Taatjes, C. A., Hansen, N., McIlroy, A., Miller, J. A., Senosiain,J. P., Klippenstein, S. J., Qi, F., Sheng, L., Zhang, Y., Cool,T. A., Wang, J., Westmoreland, P. R., Law, M. E., Kasper,T., and Kohse-Hoinghaus, K.: Enols Are Common Interme-diates in Hydrocarbon Oxidation, Science, 308, 1887–1889,doi:10.1126/science.1112532, 2005.
Talbot, R. W., Beecher, K. M., and Harriss, R. C.: Atmo-spheric geochemistry of formic and acetic acids at a mid-latitude temperate site, J. Geophys. Res., 93, 1638–1652,doi:10.1029/JD093iD02p01638, 1988.
Turquety, S., Logan, J. A., Jacob, D. J., Hudman, R. C., Leung,F. Y., Heald, C. L., Yantosca, R. M., Wu, S., Emmons, L. K.,Edwards, D. P., and Sachse, G. W.: Inventory of boreal fireemissions for North America in 2004: Importance of peat burn-ing and pyroconvective injection, J. Geophys. Res. Atmos., 112,D12S03,doi:10.1029/2006JD007281, 2007.
Usher, C. R., Michel, A. E., and Grassian, V. H.: Reactions on min-eral dust, Chem. Rev, 103, 4883–4940,doi:10.1021/cr020657y,2003.
Val Martin, M., Logan, J. A., Kahn, R. A., Leung, F.-Y., Nelson,D. L., and Diner, D. J.: Smoke injection heights from fires inNorth America: analysis of 5 years of satellite observations,Atmos. Chem. Phys., 10, 1491–1510,doi:10.5194/acp-10-1491-2010,2010.
Vander Auwera, J., Didriche, K., Perrin, A., and Keller, F.: Ab-solute line intensities for formic acid and dissociation con-stant of the dimer, J. Chem. Phys., 126, 124311–124320,doi:10.1063/1.2712439, 2007.
Velazco, V., Notholt, J., Warneke, T., Lawrence, M., Bremer, H.,Drummond, J., Schulz, A., Krieg, J., and Schrems, O.: Lat-itude and altitude variability of carbon monoxide in the At-lantic detected from ship-borne Fourier transform spectrometry,model, and satellite data, J. Geophys. Res. Atmos., 110, 9306,doi:10.1029/2004JD005351, 2005.
Veyret, B., Lesclaux, R., Rayez, M. T., Rayez, J. C., Cox, R. A., andMoortgat, G. K.: Kinetics and mechanism of the photo-oxidationof formaldehyde. 1. Flash photolysis study, J. Phys. Chem., 93,2368–2374, 1989.
Vigouroux, C., Hendrick, F., Stavrakou, T., Dils, B., De Smedt,I., Hermans, C., Merlaud, A., Scolas, F., Senten, C., Van-haelewyn, G., Fally, S., Carleer, M., Metzger, J.-M., Muller,
J.-F., Van Roozendael, M., and De Maziere, M.: Ground-based FTIR and MAX-DOAS observations of formaldehyde atReunion Island and comparisons with satellite and model data,Atmos. Chem. Phys., 9, 9523–9544,doi:10.5194/acp-9-9523-2009, 2009.
Vlasenko, A., George, I. J., and Abbatt, J. P. D.: Formation ofVolatile Organic Compounds in the Heterogeneous Oxidationof Condensed-Phase Organic Films by Gas-Phase OH, J. Phys.Chem. A, 112, 1552–1560,doi:10.1021/jp0772979, 2008.
von Kuhlmann, R., Lawrence, M., Crutzen, P., and Rasch, P.: Amodel for studies of tropospheric ozone and nonmethane hydro-carbons: Model evaluation of ozone-related species, J. Geophys.Res.-Atmos., 108, 4729,doi:10.1029/2002JD003348, 2003a.
von Kuhlmann, R., Lawrence, M. G., Crutzen, P. J., and Rasch,P. J.: A model for studies of tropospheric ozone and nonmethanehydrocarbons: Model description and ozone results, J. Geophys.Res. Atmos., 108, 4294,doi:10.1029/2002JD002893, 2003b.
Walser, M. L., Park, J., Gomez, A. L., Russell, A. R., andNizkorodov, S. A.: Photochemical Aging of Secondary OrganicAerosol Particles Generated from the Oxidation of d-Limonene,J. Phys. Chem. A, 111, 1907–1913,doi:10.1021/jp066293l,2007.
Wang, Y. and Jacob, D.: Anthropogenic forcing on troposphericozone and OH since preindustrial times, J. Geophys. Res., 103,31123–31136,doi:10.1029/1998JD100004, 1998.
Wang, Y., Jacob, D. J., and Logan, J. A.: Global simulation of tropo-spheric O3-NOx-hydrocarbon chemistry 1. Model formulation,J. Geophys. Res., 103, 10713–10726,doi:10.1029/98JD00158,1998.
Warneke, C., Bahreini, R., Brioude, J., Brock, C. A., de Gouw,J. A., Fahey, D. W., Froyd, K. D., Holloway, J. S., Middlebrook,A., Miller, L., Montzka, S., Murphy, D. M., Peischl, J., Ryerson,T. B., Schwarz, J. P., Spackman, J. R., and Veres, P.: Biomassburning in Siberia and Kazakhstan as an important source forhaze over the Alaskan Arctic in April 2008, Geophys. Res. Lett.,36, 2813,doi:10.1029/2008GL036194, 2009.
Weber, R. J., Sullivan, A. P., Peltier, R. E., Russell, A., Yan, B.,Zheng, M., de Gouw, J., Warneke, C., Brock, C., Holloway,J. S., Atlas, E. L., and Edgerton, E.: A study of secondary or-ganic aerosol formation in the anthropogenic-influenced south-eastern United States, J. Geophys. Res. Atmos., 112, 13302,doi:10.1029/2007JD008408, 2007.
Wennberg, P. O., Hanisco, T. F., Jaegle;, L., Jacob, D. J., Hintsa,E. J., Lanzendorf, E. J., Anderson, J. G., Gao, R.-S., Keim, E. R.,Donnelly, S. G., Negro, L. A., Fahey, D. W., McKeen, S. A.,Salawitch, R. J., Webster, C. R., May, R. D., Herman, R. L., Prof-fitt, M. H., Margitan, J. J., Atlas, E. L., Schauffler, S. M., Flocke,F., McElroy, C. T., and Bui, T. P.: Hydrogen Radicals, NitrogenRadicals, and the Production of O3 in the Upper Troposphere,Science, 279, 49–53,doi:10.1126/science.279.5347.49, 1998.
Wesely, M. . L.: Parameterization of surface resistances to gaseousdry deposition in regional-scale numerical models, Atmos. Envi-ron., 23, 1293–1304,doi:10.1016/j.atmosenv.2007.10.058, 1989.
Wiedinmyer, C., Guenther, A., Harley, P., Hewitt, N., Geron, C.,Artaxo, P., Steinbrecher, R., and Rasmussen, R.: Global Or-ganic Emissions from Vegetation (in Emissions of AtmosphericTrace Compounds), 18 of Advances in Global Change Research,Springer, 2004.
Yevich, R. and Logan, J. A.: An assessment of biofuel use and
Atmos. Chem. Phys., 11, 1989–2013, 2011 www.atmos-chem-phys.net/11/1989/2011/
F. Paulot et al.: Formic and acetic acid budget 2013
burning of agricultural waste in the developing world., GlobalBiogeochem. Cy., 17, 1095,doi:10.1029/2002GB001952, 2003.
Yienger, J. J. and Levy, H.: Empirical model of global soil-biogenic NOx emissions, J. Geophys. Res., 100, 11447–11464,doi:10.1029/95JD00370, 1995.
Yokelson, R. J., Bertschi, I. T., Christian, T. J., Hobbs, P. V., Ward,D. E., and Hao, W. M.: Trace gas measurements in nascent, aged,and cloud-processed smoke from African savanna fires by air-borne Fourier transform infrared spectroscopy (AFTIR), J. Geo-phys. Res., 108, 8478,doi:10.1029/2002JD002322, 2003.
Yokelson, R. J., Crounse, J. D., DeCarlo, P. F., Karl, T., Urbanski,S., Atlas, E., Campos, T., Shinozuka, Y., Kapustin, V., Clarke,A. D., Weinheimer, A., Knapp, D. J., Montzka, D. D., Holloway,J., Weibring, P., Flocke, F., Zheng, W., Toohey, D., Wennberg,P. O., Wiedinmyer, C., Mauldin, L., Fried, A., Richter, D.,Walega, J., Jimenez, J. L., Adachi, K., Buseck, P. R., Hall,S. R., and Shetter, R.: Emissions from biomass burning in theYucatan, Atmospheric Chemistry and Physics, 9, 5785–5812,doi:10.5194/acp-9-5785-2009, 2009.
York, D., Evensen, N. M., Martınez, M. L., and Delgado, J.D. B.: Unified equations for the slope, intercept, and stan-dard errors of the best straight line, Am. J. Phys., 72, 367–375,doi:10.1119/1.1632486, 2004.
Zander, R., Duchatelet, P., Mahieu, E., Demoulin, P., Roland,G., Servais, C., Auwera, J. V., Perrin, A., Rinsland, C. P.,and Crutzen, P. J.: Formic acid above the Jungfraujoch during1985–2007: observed variability, seasonality, but no long-termbackground evolution, Atmos. Chem. Phys., 10, 10047–10065,doi:10.5194/acp-10-10047-2010, 2010.
Zender, C. S., Bian, H., and Newman, D.: Mineral Dust En-trainment and Deposition (DEAD) model: Description and1990s dust climatology, J. Geophys. Res. Atmos., 108, 4416,doi:10.1029/2002JD002775, 2003.
www.atmos-chem-phys.net/11/1989/2011/ Atmos. Chem. Phys., 11, 1989–2013, 2011