Embed Size (px)
Citation preview
HAL Id: hal-01304866https://hal.archives-ouvertes.fr/hal-01304866
Submitted on 20 Apr 2016
HAL is a multi-disciplinary open accessarchive for the deposit and dissemination of sci-entific research documents, whether they are pub-lished or not. The documents may come fromteaching and research institutions in France orabroad, or from public or private research centers.
L’archive ouverte pluridisciplinaire HAL, estdestinée au dépôt et à la diffusion de documentsscientifiques de niveau recherche, publiés ou non,émanant des établissements d’enseignement et derecherche français ou étrangers, des laboratoirespublics ou privés.
Importance of the hydrogen route in up-scalingelectrosynthesis for microbial CO2 reduction
Elise Blanchet, François Duquenne, Yan Rafrafi, Luc Etcheverry, BenjaminErable, Alain Bergel
To cite this version:Elise Blanchet, François Duquenne, Yan Rafrafi, Luc Etcheverry, Benjamin Erable, et al.. Importanceof the hydrogen route in up-scaling electrosynthesis for microbial CO2 reduction. Energy & Environ-mental Science, Royal Society of Chemistry, 2015, 8 (12), pp.3731-3744. �10.1039/C5EE03088A�.�hal-01304866�
Open Archive TOULOUSE Archive Ouverte (OATAO) OATAO is an open access repository that collects the work of Toulouse researchers and makes it freely available over the web where possible.
This is an author-deposited version published in : http://oatao.univ-toulouse.fr/ Eprints ID : 15710
To link to this article : DOI : 10.1039/C5EE03088AURL : http://dx.doi.org/10.1039/C5EE03088A
To cite this version : Blanchet, Elise and Duquenne, François and Rafrafi, Yan and Etcheverry, Luc and Erable, Benjamin and Bergel, Alain Importance of the hydrogen route in up-scaling electrosynthesis for microbial CO2reduction. (2015) Energy & Environmental Science, vol. 8 (n° 12). pp. 3731-3744. ISSN 1754-5692
Any correspondence concerning this service should be sent to the repository
administrator: [email protected]
Importance of the hydrogen route in up-scalingelectrosynthesis for microbial CO2 reduction
Elise Blanchet,* François Duquenne, Yan Rafrafi, Luc Etcheverry, Benjamin Erable
and Alain Bergel
Microbial electrochemical reduction of CO2 was carried out under two different applied potentials,
ÿ0.36 V and ÿ0.66 V vs. SHE, using a biological sludge as the inoculum. Both potentials were
thermodynamically appropriate for converting CO2 to acetate but only ÿ0.66 V enabled hydrogen
evolution. No acetate production was observed at ÿ0.36 V, while up to 244 � 20 mg Lÿ1 acetate was
produced at ÿ0.66 V vs. SHE. The same microbial inoculum implemented in gas–liquid contactors with
H2 and CO2 gas supply led to acetate production of 2500 mg Lÿ1. When a salt marsh sediment was used
as the inoculum, no reduction was observed in the electrochemical reactors, while supplying H2 + CO2
gas led to formate and then acetate production. Finally, pure cultures of Sporomusa ovata grown under
H2 and CO2 gas feeding showed acetate production of up to 2904 mg Lÿ1, higher than those reported
so far in the literature for S. ovata implemented in bioelectrochemical processes. Unexpected ethanol
production of up to 1411 mg Lÿ1 was also observed. All these experimental data confirm that hydrogen
produced on the cathode by water electrolysis is an essential mediator in the microbial electrochemical
reduction of CO2. Implementing homoacetogenic microbial species in purposely designed gas–liquid
biocontactors should now be considered as a relevant strategy for developing CO2 conversion.
Broader contextIn the context of CO2 conversion to fuels and chemicals, the association of electrochemistry with microbial catalysis has opened up promising new routes to
reduce CO2 to acetate and other multi-carbon compounds. The present paper points out that some of these electro-microbial processes are based on two
consecutive steps: first the electrochemical production of hydrogen by water electrolysis and, second, the reduction of CO2 by microbial species that use the
hydrogen produced. In consequence, the implementation of homoacetogenic microorganisms with direct CO2 and hydrogen gas supply should now be
considered as a worthwhile strategy for CO2 conversion. Hydrogen can be produced under optimal conditions by conventional electrolysis, preferentially fed
with electrical energy harvested using renewable strategies, and then used to drive CO2 conversion in an H2–CO2 gas–liquid bioreactor.
1. Introduction
Bulk chemicals and liquid fuels are currently produced almost
exclusively from petrochemical feedstock. In light of emission
reduction targets, the production of chemicals from CO2 or
other renewable resources may play an important role in
decreasing our environmental impact. There are several advantages
of using CO2 as a reactant, such as unlimited availability (atmo-
sphere, waste gas, etc.), land-independence, ease of handling and
limited toxicity.1 In this framework, electrochemical processes offer
various options for converting CO2 to fuels and commodities.
Reducing CO2 by electrochemistry is a way of converting electrical
energy harvested using renewable strategies, such as solar or wind,
into chemical forms that can be stored and then distributed on
demand. Various electro-catalysts have been designed with some
success for the reduction of CO2 tomethanol or formate,2 including
enzymes.3 More specific attempts have also been reported,
including the reduction to H2 + CO syngas mixtures4 and even
reduction to carbon by molten salt electrolysis.5
Over the past decade, microbial electrosynthesis has
emerged as an additional option for the electro-reduction of
CO2 to fuels and commodities.6,7 In this case, microorganisms
act as an electro-catalyst by taking electrons from the cathode
to reduce CO2. Various multi-carbon products have thus been
synthesized from CO2,8 acetate being the most frequently
obtained (Table 1).
Pure cultures and multispecies inocula have both been
shown to be capable of catalysing the electrochemical reduction
Laboratoire de Genie Chimique (LGC), CNRS, Universite de Toulouse (INPT),
4 allee Emile Monso, BP 84234, 31432 Toulouse, France.
E-mail: [email protected]; Tel: +33 5 34323627
DOI: 10.1039/c5ee03088a
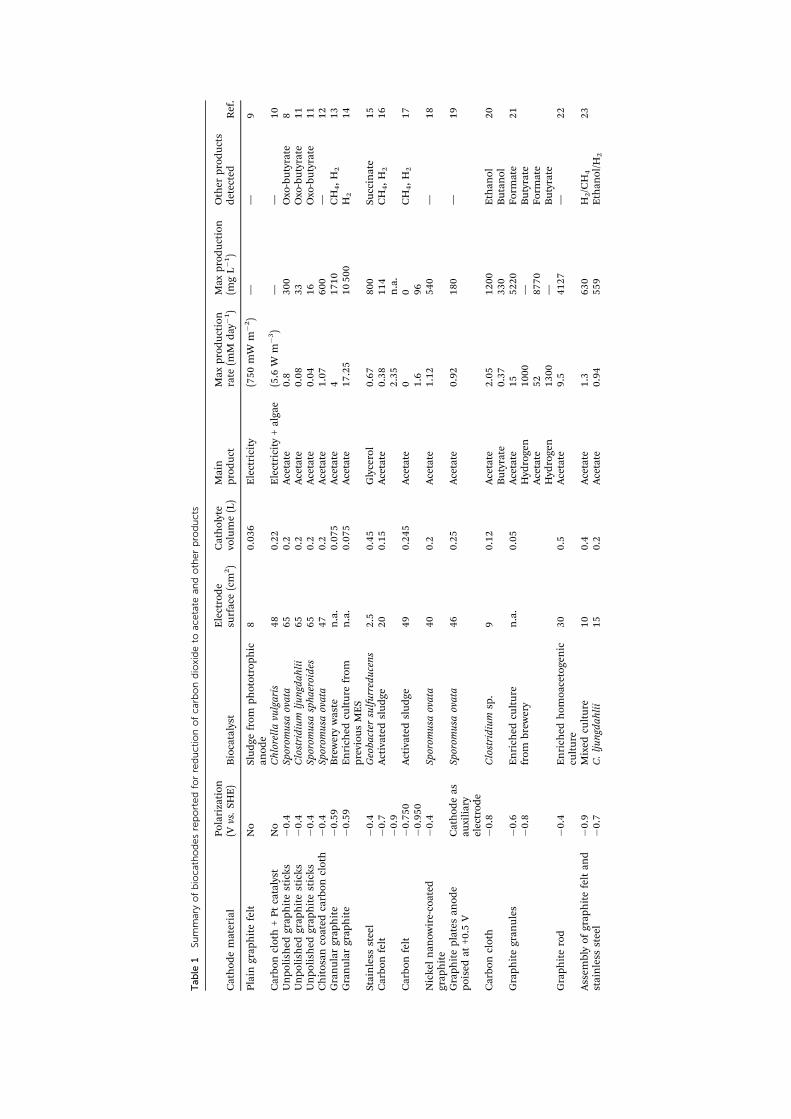
Table
1Summary
ofbiocathodesreportedforreductionofcarbondioxideto
acetate
andotherproducts
Cathodematerial
Polarization
(Vvs.SHE)
Biocatalyst
Electrode
surface(cm
2)
Catholyte
volume(L)
Main
product
Max
production
rate
(mM
day
ÿ1)
Max
production
(mgLÿ1)
Other
products
detected
Ref.
Plain
graphitefelt
No
Sludgefrom
phototrophic
anode
80.036
Electricity
(750mW
mÿ2)
——
9
Carboncloth
+Ptcatalyst
No
Chlorellavulgaris
48
0.22
Electricity
+algae
(5.6
Wm
ÿ3)
——
10
Unpolish
edgraphitesticks
ÿ0.4
Sporom
usa
ovata
65
0.2
Acetate
0.8
300
Oxo-butyrate
8Unpolish
edgraphitesticks
ÿ0.4
Clostridium
ljungdahlii
65
0.2
Acetate
0.08
33
Oxo-butyrate
11
Unpolish
edgraphitesticks
ÿ0.4
Sporom
usa
sphaeroides
65
0.2
Acetate
0.04
16
Oxo-butyrate
11
Chitosancoated
carboncloth
ÿ0.4
Sporom
usa
ovata
47
0.2
Acetate
1.07
600
—12
Granulargraphite
ÿ0.59
Brewerywaste
n.a.
0.075
Acetate
41710
CH
4,H
213
Granulargraphite
ÿ0.59
Enrich
edcu
lture
from
previousMES
n.a.
0.075
Acetate
17.25
10500
H2
14
Stainless
steel
ÿ0.4
Geobacter
sulfurreducens
2.5
0.45
Glycerol
0.67
800
Succinate
15
Carbonfelt
ÿ0.7
Activated
sludge
20
0.15
Acetate
0.38
114
CH
4,H
216
ÿ0.9
2.35
n.a.
Carbonfelt
ÿ0.750
Activated
sludge
49
0.245
Acetate
00
CH
4,H
217
ÿ0.950
1.6
96
Nickel
nanowire-coated
graphite
ÿ0.4
Sporom
usa
ovata
40
0.2
Acetate
1.12
540
—18
Graphiteplatesan
ode
poised
at+0.5
VCathodeas
auxiliary
electrode
Sporom
usa
ovata
46
0.25
Acetate
0.92
180
—19
Carboncloth
ÿ0.8
Clostridium
sp.
90.12
Acetate
2.05
1200
Ethan
ol
20
Butyrate
0.37
330
Butanol
Graphitegranules
ÿ0.6
Enrich
edcu
lture
from
brewery
n.a.
0.05
Acetate
15
5220
Form
ate
21
ÿ0.8
Hyd
rogen
1000
—Butyrate
Acetate
52
8770
Form
ate
Hyd
rogen
1300
—Butyrate
Graphiterod
ÿ0.4
Enrich
edhomoacetogen
iccu
lture
30
0.5
Acetate
9.5
4127
—22
Assem
bly
ofgraphitefeltan
dstainless
steel
ÿ0.9
Mixed
culture
10
0.4
Acetate
1.3
630
H2/CH
423
ÿ0.7
C.ljungdahlii
15
0.2
Acetate
0.94
559
Ethan
ol/H
2
of CO2. Among the pure cultures, Sporomusa ovata is the most
efficient species reported so far. Using a surface-modified carbon
cathode polarized at ÿ0.4 V vs. SHE, Zhang et al.12 obtained
600 mg Lÿ1 of acetate after 9 days and Nie et al.18 540 mg Lÿ1 of
acetate in 8 days. Multispecies inocula have given similar or
better performance but it is difficult to compare various studies
reported as they were carried out under different conditions and
at different applied potentials. The highest acetate production
rate was obtained by Marshall et al.,14 who used granular
graphite as the cathode and an enriched culture from a previously
established acetogenic biocathode as the inoculum. Their cathodes
were polarized at ÿ0.59 V vs. SHE, and rates of acetate production
reached 17.25 mM dayÿ1 with accumulation to 10500 mg Lÿ1 over
20 days. Hydrogen was also produced by the cathode, at rates
reaching 100 mM dayÿ1.
The electron transfer (ET) pathway from the cathode to the
microbial cells that achieve CO2 reduction has not been clearly
deciphered yet. It has been speculated that microbial cells
could gain electrons from the cathode by direct ET through
membrane-bound redox systems.6 Similar direct ET from solid
electron donors to microbial species has been identified in natural
processes, especially in acidic environments such as mine drainage
systems, where oxidations of solid iron(II) and sulfur are dominant
microbial activities. For example, Acidithiobacillus ferrooxidans is
commonly found in deep caves or acid mine drains and thrives
in a pH range of 1.5–2.5. It has been shown to be able to accept
electrons directly from solid Fe(II) minerals (e.g. pyrite) through
c-type cytochrome Cyc2 contained in its outer membrane.24
Electrons are thus extracted from insoluble minerals and trans-
ferred to oxygen, used as the final electron acceptor, which
results in minerals being converted to their soluble state.
On the other hand, mediation by hydrogen has also often
been suggested. The cathode produces hydrogen by water
electrolysis and the microbial species use hydrogen to reduce
carbon dioxide to acetate.7,16,17 In this case, electrosynthesis
proceeds in two consecutive steps: first, the electrochemical
production of hydrogen by water electrolysis and, second, the
microbial reduction of CO2, which uses hydrogen.
Actually, microbial reduction of CO2 to acetic acid using
hydrogen as an electron donor is a well-known reaction called
homoacetogenic fermentation.25 First reported by Fischer et al.,26
the discovery was followed by the isolation of the acetogenic strain
Clostridium aceticum,27 an obligate anaerobic species, which grows
either chemolithotrophically with H2 and CO2 or chemoorganotro-
phically with compounds such as fructose, malate or pyruvate.
Unfortunately, C. aceticum was lost soon after the third paper
concerning it was published in 1948.28 All attempts to re-isolate
a chemolithotrophic acetogen failed until the purification of
Acetobacterium woodii.29
In the context of microbial electrochemical conversion of
CO2, it is still difficult to establish whether ET is achieved by a
direct pathway or indirectly by homoacetogenic species that use
hydrogen produced at the cathode. This is obviously an important
fundamental question, the answer to which should considerably
impact the way the technology develops toward a large-sized
industrial equipment.
The purpose of the present work was to assess the possible
involvement of the hydrogen route in the microbial electro-
chemical reduction of CO2. Two multispecies inocula were used to
form microbial cathodes under two different applied potentials:
ÿ0.36 and ÿ0.66 V vs. SHE. Both potentials were thermo-
dynamically low enough to ensure CO2 transformation to acetate,
but ÿ0.36 V vs. SHE did not allow hydrogen evolution, while
ÿ0.66 V vs. SHE did. Stainless steel was used as the cathode
material because it has been shown to be more effective than
carbon in achieving fast cathodic ET with microbial cells,
particularly with Geobacter sulfurreducens.30,31 The same micro-
bial systems were then implemented in gas–liquid contactors
and were fed with hydrogen gas in order to assess their capacity
to use hydrogen in the absence of an electrode. Finally, similar
hydrogen supply tests were performed using pure cultures of
Sporomusa ovata to evaluate the capacity of this species to use
hydrogen compared to the performance reported in the litera-
ture for the electrochemical process. All these experimental
data consistently supported the involvement of the hydrogen
route in the microbial electrochemical reduction of CO2 to
acetate. Implementing acetogenic microbial species in purposely
designed gas–liquid contactors should now be considered as a
relevant way to develop and scale-up the CO2 conversion systems
that have been revealed by microbial electrosynthesis.
2. Materials and methods2.1 Medium composition
Medium 1 was prepared as already described.30 It contained
KCl (0.1 g Lÿ1), NaH2PO4 (0.6 g Lÿ1), NH4Cl (1.5 g Lÿ1), and
NaHCO3 (2.5 g Lÿ1). The solution was sterilized using an
autoclave (121 1C for 20 minutes) and a trace mineral mix
(10 mL Lÿ1, ATCC MD-TMS) and a vitamin mix (10 mL Lÿ1,
ATCC MD-VS) were then added.
Medium 2 consisted of medium 1 with the addition of NaCl
(45 g Lÿ1), MgCl2 (0.1 g Lÿ1) and CaCl2 (0.01 g Lÿ1).
2.2 Source of microorganisms
Two different environmental samples were used as the inoculum.
The biological sludge was collected from a treatment plant (Suez
Environnement, Evry, France). Prior to experiments, the inoculum
was acclimated to an H2 and N2–CO2 (80–20%) atmosphere for
5 days at 30 1C with the objective of favouring the development of
homoacetogenic bacteria. HPLC analyses detected acetic acid at
1980 mg Lÿ1 and butyric acid at 23 mg Lÿ1 in the inoculum after
5 days of acclimation. This inoculumwas always implemented with
medium 1. The microbial electrochemical reactors were inoculated
with 20 mL (3.3% v/v) added into the cathodic compartments. The
gas–liquid contactors had 7 mL inoculated into the 210 mL
medium.
The sediment collected from a salt marsh of the Mediterranean
Sea (Gruissan, France) was used as the second source of micro-
organisms. This inoculum is known to contain halotolerant
electroactive bacteria that have succeeded in forming efficient
microbial bioanodes in solutions containing large amounts of
salt, such as 45 g Lÿ1 NaCl.32 This inoculum was always
implemented with medium 2. The microbial electrochemical
reactors were inoculated with 60 mL (10% v/v) in the cathodic
compartments and 21 mL was injected into the 210 mL
medium of the gas–liquid contactors. HPLC analyses detected
lactic acid (370 mg Lÿ1), formic acid (91 mg Lÿ1) and butyric
acid (83 mg Lÿ1) in this inoculum.
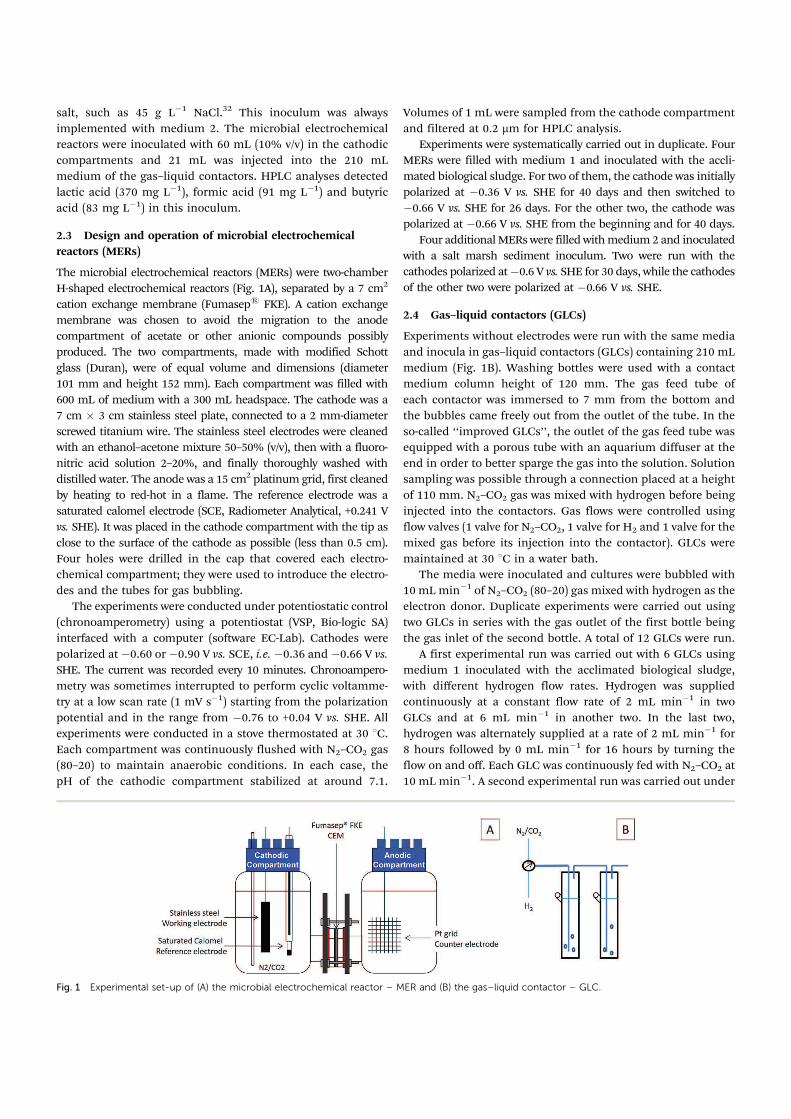
2.3 Design and operation of microbial electrochemical
reactors (MERs)
The microbial electrochemical reactors (MERs) were two-chamber
H-shaped electrochemical reactors (Fig. 1A), separated by a 7 cm2
cation exchange membrane (Fumaseps FKE). A cation exchange
membrane was chosen to avoid the migration to the anode
compartment of acetate or other anionic compounds possibly
produced. The two compartments, made with modified Schott
glass (Duran), were of equal volume and dimensions (diameter
101 mm and height 152 mm). Each compartment was filled with
600 mL of medium with a 300 mL headspace. The cathode was a
7 cm � 3 cm stainless steel plate, connected to a 2 mm-diameter
screwed titanium wire. The stainless steel electrodes were cleaned
with an ethanol–acetone mixture 50–50% (v/v), then with a fluoro-
nitric acid solution 2–20%, and finally thoroughly washed with
distilled water. The anode was a 15 cm2 platinum grid, first cleaned
by heating to red-hot in a flame. The reference electrode was a
saturated calomel electrode (SCE, Radiometer Analytical, +0.241 V
vs. SHE). It was placed in the cathode compartment with the tip as
close to the surface of the cathode as possible (less than 0.5 cm).
Four holes were drilled in the cap that covered each electro-
chemical compartment; they were used to introduce the electro-
des and the tubes for gas bubbling.
The experiments were conducted under potentiostatic control
(chronoamperometry) using a potentiostat (VSP, Bio-logic SA)
interfaced with a computer (software EC-Lab). Cathodes were
polarized at ÿ0.60 or ÿ0.90 V vs. SCE, i.e. ÿ0.36 and ÿ0.66 V vs.
SHE. The current was recorded every 10 minutes. Chronoampero-
metry was sometimes interrupted to perform cyclic voltamme-
try at a low scan rate (1 mV sÿ1) starting from the polarization
potential and in the range from ÿ0.76 to +0.04 V vs. SHE. All
experiments were conducted in a stove thermostated at 30 1C.
Each compartment was continuously flushed with N2–CO2 gas
(80–20) to maintain anaerobic conditions. In each case, the
pH of the cathodic compartment stabilized at around 7.1.
Volumes of 1 mL were sampled from the cathode compartment
and filtered at 0.2 mm for HPLC analysis.
Experiments were systematically carried out in duplicate. Four
MERs were filled with medium 1 and inoculated with the accli-
mated biological sludge. For two of them, the cathode was initially
polarized at ÿ0.36 V vs. SHE for 40 days and then switched to
ÿ0.66 V vs. SHE for 26 days. For the other two, the cathode was
polarized at ÿ0.66 V vs. SHE from the beginning and for 40 days.
Four additionalMERs were filled withmedium 2 and inoculated
with a salt marsh sediment inoculum. Two were run with the
cathodes polarized atÿ0.6 V vs. SHE for 30 days, while the cathodes
of the other two were polarized at ÿ0.66 V vs. SHE.
2.4 Gas–liquid contactors (GLCs)
Experiments without electrodes were run with the same media
and inocula in gas–liquid contactors (GLCs) containing 210 mL
medium (Fig. 1B). Washing bottles were used with a contact
medium column height of 120 mm. The gas feed tube of
each contactor was immersed to 7 mm from the bottom and
the bubbles came freely out from the outlet of the tube. In the
so-called ‘‘improved GLCs’’, the outlet of the gas feed tube was
equipped with a porous tube with an aquarium diffuser at the
end in order to better sparge the gas into the solution. Solution
sampling was possible through a connection placed at a height
of 110 mm. N2–CO2 gas was mixed with hydrogen before being
injected into the contactors. Gas flows were controlled using
flow valves (1 valve for N2–CO2, 1 valve for H2 and 1 valve for the
mixed gas before its injection into the contactor). GLCs were
maintained at 30 1C in a water bath.
The media were inoculated and cultures were bubbled with
10 mL minÿ1 of N2–CO2 (80–20) gas mixed with hydrogen as the
electron donor. Duplicate experiments were carried out using
two GLCs in series with the gas outlet of the first bottle being
the gas inlet of the second bottle. A total of 12 GLCs were run.
A first experimental run was carried out with 6 GLCs using
medium 1 inoculated with the acclimated biological sludge,
with different hydrogen flow rates. Hydrogen was supplied
continuously at a constant flow rate of 2 mL minÿ1 in two
GLCs and at 6 mL minÿ1 in another two. In the last two,
hydrogen was alternately supplied at a rate of 2 mL minÿ1 for
8 hours followed by 0 mL minÿ1 for 16 hours by turning the
flow on and off. Each GLC was continuously fed with N2–CO2 at
10 mL minÿ1. A second experimental run was carried out under
Fig. 1 Experimental set-up of (A) the microbial electrochemical reactor – MER and (B) the gas–liquid contactor – GLC.
identical conditions using 3 ‘‘improved GLCs’’ with a constant
hydrogen flow rate of 0.5 mL minÿ1.
Two GLCs were implemented with medium 2 inoculated with
the salt marsh sediment using 10 mL minÿ1 of N2–CO2 (80–20)
gas mixed with 6 mL minÿ1 of hydrogen as the electron donor.
Four GLCs were implemented with pure culture of S. ovata
(see below).
Initially the pH was stable at around 7.1 in each case but, at
the end of the experiment, pH values were measured in a range
of 5.5 to 7.3 depending on the amount of acetate produced.
2.5 Culture of Sporomusa ovata in GLCs
S. ovata was grown in the DSMZ-recommended growth medium
(DSMZ 311) with casitone and resazurin omitted. A volume of
20 mL of the growing cells was used to inoculate the GLCs in the
same medium but with the betaine omitted. In two GLCs, the
culture was continuously fed with an excess of hydrogen–N2–CO2
(50–40–10) gas mixture (40 mL minÿ1). Two control experiments
were carried out in GLCs fed only with N2–CO2 (80–20). Samples
were taken every day and filtered at 0.2 mm for HPLC analyses.
2.6 HPLC analyses
Samples were analysed for organic acids, sugar and ethanol by HPLC
(Thermo Scientific, France) using a Rezex ROA-organic acid H+ (8%),
250� 4.6 mm phase-reverse column (Phenomenex, France) thermo-
stated at 30 1C and associated with a refractive index detector
in series with a UV detector. The elution was performed at
170 mL minÿ1 with an aqueous solution of sulfuric acid 10 mM
(pH 2.2). The column was calibrated with a mixture of formate,
acetate, lactate, propionate and butyrate, in the analysis
concentration range.
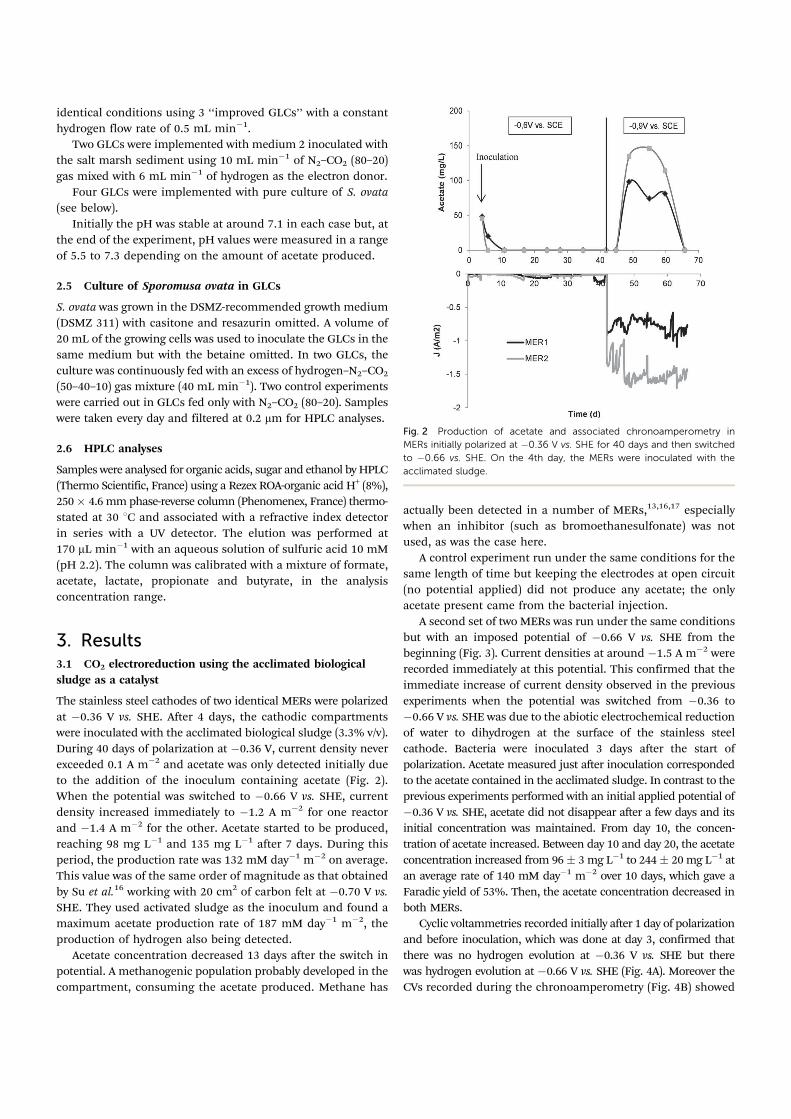
3. Results3.1 CO2 electroreduction using the acclimated biological
sludge as a catalyst
The stainless steel cathodes of two identical MERs were polarized
at ÿ0.36 V vs. SHE. After 4 days, the cathodic compartments
were inoculated with the acclimated biological sludge (3.3% v/v).
During 40 days of polarization at ÿ0.36 V, current density never
exceeded 0.1 A mÿ2 and acetate was only detected initially due
to the addition of the inoculum containing acetate (Fig. 2).
When the potential was switched to ÿ0.66 V vs. SHE, current
density increased immediately to ÿ1.2 A mÿ2 for one reactor
and ÿ1.4 A mÿ2 for the other. Acetate started to be produced,
reaching 98 mg Lÿ1 and 135 mg Lÿ1 after 7 days. During this
period, the production rate was 132 mM dayÿ1 mÿ2 on average.
This value was of the same order of magnitude as that obtained
by Su et al.16 working with 20 cm2 of carbon felt at ÿ0.70 V vs.
SHE. They used activated sludge as the inoculum and found a
maximum acetate production rate of 187 mM dayÿ1 mÿ2, the
production of hydrogen also being detected.
Acetate concentration decreased 13 days after the switch in
potential. A methanogenic population probably developed in the
compartment, consuming the acetate produced. Methane has
actually been detected in a number of MERs,13,16,17 especially
when an inhibitor (such as bromoethanesulfonate) was not
used, as was the case here.
A control experiment run under the same conditions for the
same length of time but keeping the electrodes at open circuit
(no potential applied) did not produce any acetate; the only
acetate present came from the bacterial injection.
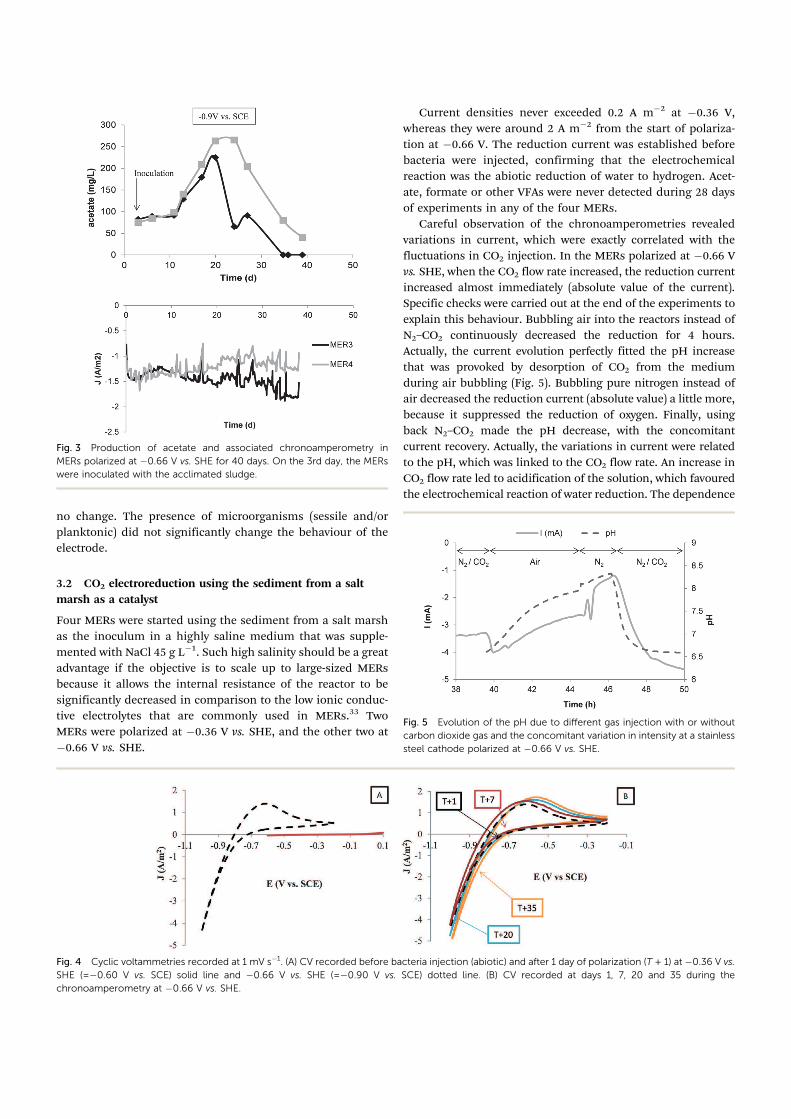
A second set of two MERs was run under the same conditions
but with an imposed potential of ÿ0.66 V vs. SHE from the
beginning (Fig. 3). Current densities at around ÿ1.5 A mÿ2 were
recorded immediately at this potential. This confirmed that the
immediate increase of current density observed in the previous
experiments when the potential was switched from ÿ0.36 to
ÿ0.66 V vs. SHE was due to the abiotic electrochemical reduction
of water to dihydrogen at the surface of the stainless steel
cathode. Bacteria were inoculated 3 days after the start of
polarization. Acetate measured just after inoculation corresponded
to the acetate contained in the acclimated sludge. In contrast to the
previous experiments performed with an initial applied potential of
ÿ0.36 V vs. SHE, acetate did not disappear after a few days and its
initial concentration was maintained. From day 10, the concen-
tration of acetate increased. Between day 10 and day 20, the acetate
concentration increased from 96� 3mg Lÿ1 to 244� 20 mg Lÿ1 at
an average rate of 140 mM dayÿ1 mÿ2 over 10 days, which gave a
Faradic yield of 53%. Then, the acetate concentration decreased in
both MERs.
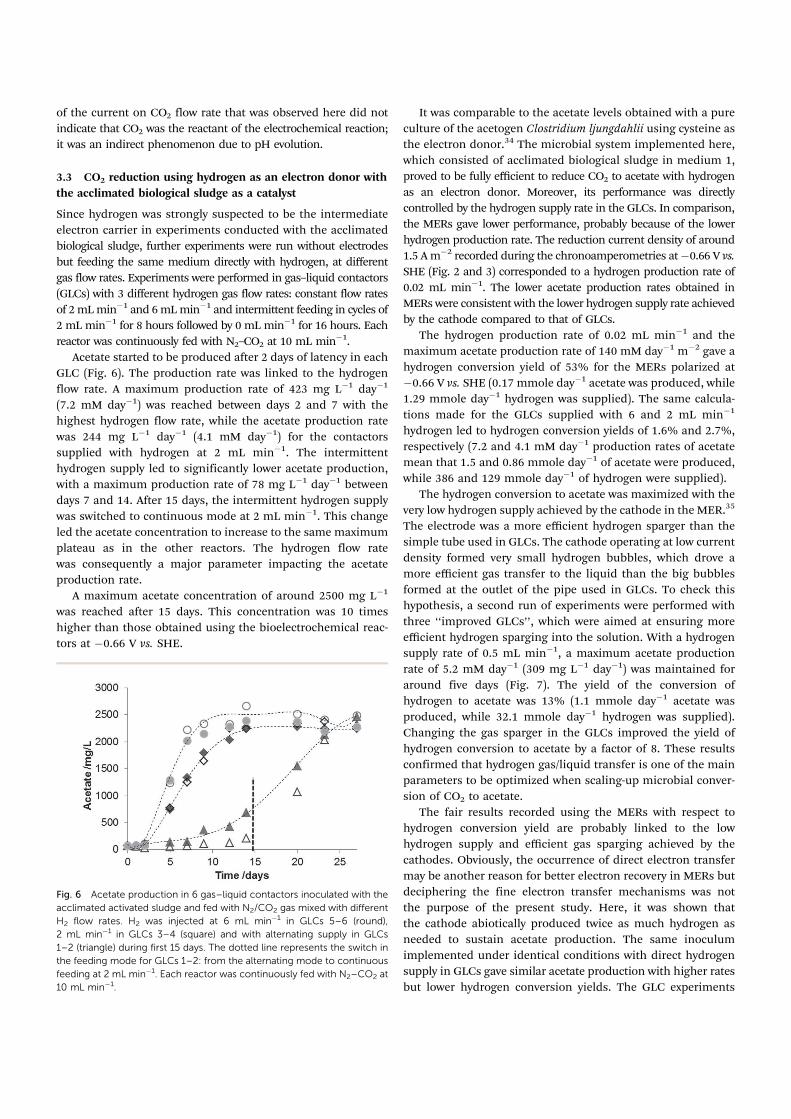
Cyclic voltammetries recorded initially after 1 day of polarization
and before inoculation, which was done at day 3, confirmed that
there was no hydrogen evolution at ÿ0.36 V vs. SHE but there
was hydrogen evolution at ÿ0.66 V vs. SHE (Fig. 4A). Moreover the
CVs recorded during the chronoamperometry (Fig. 4B) showed
Fig. 2 Production of acetate and associated chronoamperometry in
MERs initially polarized at ÿ0.36 V vs. SHE for 40 days and then switched
to ÿ0.66 vs. SHE. On the 4th day, the MERs were inoculated with the
acclimated sludge.
no change. The presence of microorganisms (sessile and/or
planktonic) did not significantly change the behaviour of the
electrode.
3.2 CO2 electroreduction using the sediment from a salt
marsh as a catalyst
Four MERs were started using the sediment from a salt marsh
as the inoculum in a highly saline medium that was supple-
mented with NaCl 45 g Lÿ1. Such high salinity should be a great
advantage if the objective is to scale up to large-sized MERs
because it allows the internal resistance of the reactor to be
significantly decreased in comparison to the low ionic conduc-
tive electrolytes that are commonly used in MERs.33 Two
MERs were polarized at ÿ0.36 V vs. SHE, and the other two at
ÿ0.66 V vs. SHE.
Current densities never exceeded 0.2 A mÿ2 at ÿ0.36 V,
whereas they were around 2 A mÿ2 from the start of polariza-
tion at ÿ0.66 V. The reduction current was established before
bacteria were injected, confirming that the electrochemical
reaction was the abiotic reduction of water to hydrogen. Acet-
ate, formate or other VFAs were never detected during 28 days
of experiments in any of the four MERs.
Careful observation of the chronoamperometries revealed
variations in current, which were exactly correlated with the
fluctuations in CO2 injection. In the MERs polarized at ÿ0.66 V
vs. SHE, when the CO2 flow rate increased, the reduction current
increased almost immediately (absolute value of the current).
Specific checks were carried out at the end of the experiments to
explain this behaviour. Bubbling air into the reactors instead of
N2–CO2 continuously decreased the reduction for 4 hours.
Actually, the current evolution perfectly fitted the pH increase
that was provoked by desorption of CO2 from the medium
during air bubbling (Fig. 5). Bubbling pure nitrogen instead of
air decreased the reduction current (absolute value) a little more,
because it suppressed the reduction of oxygen. Finally, using
back N2–CO2 made the pH decrease, with the concomitant
current recovery. Actually, the variations in current were related
to the pH, which was linked to the CO2 flow rate. An increase in
CO2 flow rate led to acidification of the solution, which favoured
the electrochemical reaction of water reduction. The dependence
Fig. 4 Cyclic voltammetries recorded at 1 mV sÿ1. (A) CV recorded before bacteria injection (abiotic) and after 1 day of polarization (T + 1) at ÿ0.36 V vs.
SHE (=ÿ0.60 V vs. SCE) solid line and ÿ0.66 V vs. SHE (=ÿ0.90 V vs. SCE) dotted line. (B) CV recorded at days 1, 7, 20 and 35 during the
chronoamperometry at ÿ0.66 V vs. SHE.
Fig. 5 Evolution of the pH due to different gas injection with or without
carbon dioxide gas and the concomitant variation in intensity at a stainless
steel cathode polarized at ÿ0.66 V vs. SHE.
Fig. 3 Production of acetate and associated chronoamperometry in
MERs polarized at ÿ0.66 V vs. SHE for 40 days. On the 3rd day, the MERs
were inoculated with the acclimated sludge.
of the current on CO2 flow rate that was observed here did not
indicate that CO2 was the reactant of the electrochemical reaction;
it was an indirect phenomenon due to pH evolution.
3.3 CO2 reduction using hydrogen as an electron donor with
the acclimated biological sludge as a catalyst
Since hydrogen was strongly suspected to be the intermediate
electron carrier in experiments conducted with the acclimated
biological sludge, further experiments were run without electrodes
but feeding the same medium directly with hydrogen, at different
gas flow rates. Experiments were performed in gas–liquid contactors
(GLCs) with 3 different hydrogen gas flow rates: constant flow rates
of 2mLminÿ1 and 6mLminÿ1 and intermittent feeding in cycles of
2 mL minÿ1 for 8 hours followed by 0 mLminÿ1 for 16 hours. Each
reactor was continuously fed with N2–CO2 at 10 mL minÿ1.
Acetate started to be produced after 2 days of latency in each
GLC (Fig. 6). The production rate was linked to the hydrogen
flow rate. A maximum production rate of 423 mg Lÿ1 dayÿ1
(7.2 mM dayÿ1) was reached between days 2 and 7 with the
highest hydrogen flow rate, while the acetate production rate
was 244 mg Lÿ1 dayÿ1 (4.1 mM dayÿ1) for the contactors
supplied with hydrogen at 2 mL minÿ1. The intermittent
hydrogen supply led to significantly lower acetate production,
with a maximum production rate of 78 mg Lÿ1 dayÿ1 between
days 7 and 14. After 15 days, the intermittent hydrogen supply
was switched to continuous mode at 2 mL minÿ1. This change
led the acetate concentration to increase to the same maximum
plateau as in the other reactors. The hydrogen flow rate
was consequently a major parameter impacting the acetate
production rate.
A maximum acetate concentration of around 2500 mg Lÿ1
was reached after 15 days. This concentration was 10 times
higher than those obtained using the bioelectrochemical reac-
tors at ÿ0.66 V vs. SHE.
It was comparable to the acetate levels obtained with a pure
culture of the acetogen Clostridium ljungdahlii using cysteine as
the electron donor.34 The microbial system implemented here,
which consisted of acclimated biological sludge in medium 1,
proved to be fully efficient to reduce CO2 to acetate with hydrogen
as an electron donor. Moreover, its performance was directly
controlled by the hydrogen supply rate in the GLCs. In comparison,
the MERs gave lower performance, probably because of the lower
hydrogen production rate. The reduction current density of around
1.5 Amÿ2 recorded during the chronoamperometries atÿ0.66 V vs.
SHE (Fig. 2 and 3) corresponded to a hydrogen production rate of
0.02 mL minÿ1. The lower acetate production rates obtained in
MERs were consistent with the lower hydrogen supply rate achieved
by the cathode compared to that of GLCs.
The hydrogen production rate of 0.02 mL minÿ1 and the
maximum acetate production rate of 140 mM dayÿ1 mÿ2 gave a
hydrogen conversion yield of 53% for the MERs polarized at
ÿ0.66 V vs. SHE (0.17 mmole dayÿ1 acetate was produced, while
1.29 mmole dayÿ1 hydrogen was supplied). The same calcula-
tions made for the GLCs supplied with 6 and 2 mL minÿ1
hydrogen led to hydrogen conversion yields of 1.6% and 2.7%,
respectively (7.2 and 4.1 mM dayÿ1 production rates of acetate
mean that 1.5 and 0.86 mmole dayÿ1 of acetate were produced,
while 386 and 129 mmole dayÿ1 of hydrogen were supplied).
The hydrogen conversion to acetate was maximized with the
very low hydrogen supply achieved by the cathode in the MER.35
The electrode was a more efficient hydrogen sparger than the
simple tube used in GLCs. The cathode operating at low current
density formed very small hydrogen bubbles, which drove a
more efficient gas transfer to the liquid than the big bubbles
formed at the outlet of the pipe used in GLCs. To check this
hypothesis, a second run of experiments were performed with
three ‘‘improved GLCs’’, which were aimed at ensuring more
efficient hydrogen sparging into the solution. With a hydrogen
supply rate of 0.5 mL minÿ1, a maximum acetate production
rate of 5.2 mM dayÿ1 (309 mg Lÿ1 dayÿ1) was maintained for
around five days (Fig. 7). The yield of the conversion of
hydrogen to acetate was 13% (1.1 mmole dayÿ1 acetate was
produced, while 32.1 mmole dayÿ1 hydrogen was supplied).
Changing the gas sparger in the GLCs improved the yield of
hydrogen conversion to acetate by a factor of 8. These results
confirmed that hydrogen gas/liquid transfer is one of the main
parameters to be optimized when scaling-up microbial conver-
sion of CO2 to acetate.
The fair results recorded using the MERs with respect to
hydrogen conversion yield are probably linked to the low
hydrogen supply and efficient gas sparging achieved by the
cathodes. Obviously, the occurrence of direct electron transfer
may be another reason for better electron recovery in MERs but
deciphering the fine electron transfer mechanisms was not
the purpose of the present study. Here, it was shown that
the cathode abiotically produced twice as much hydrogen as
needed to sustain acetate production. The same inoculum
implemented under identical conditions with direct hydrogen
supply in GLCs gave similar acetate production with higher rates
but lower hydrogen conversion yields. The GLC experiments
Fig. 6 Acetate production in 6 gas–liquid contactors inoculated with the
acclimated activated sludge and fed with N2/CO2 gas mixed with different
H2 flow rates. H2 was injected at 6 mL minÿ1 in GLCs 5–6 (round),
2 mL minÿ1 in GLCs 3–4 (square) and with alternating supply in GLCs
1–2 (triangle) during first 15 days. The dotted line represents the switch in
the feeding mode for GLCs 1–2: from the alternating mode to continuous
feeding at 2 mL minÿ1. Each reactor was continuously fed with N2–CO2 at
10 mL minÿ1.
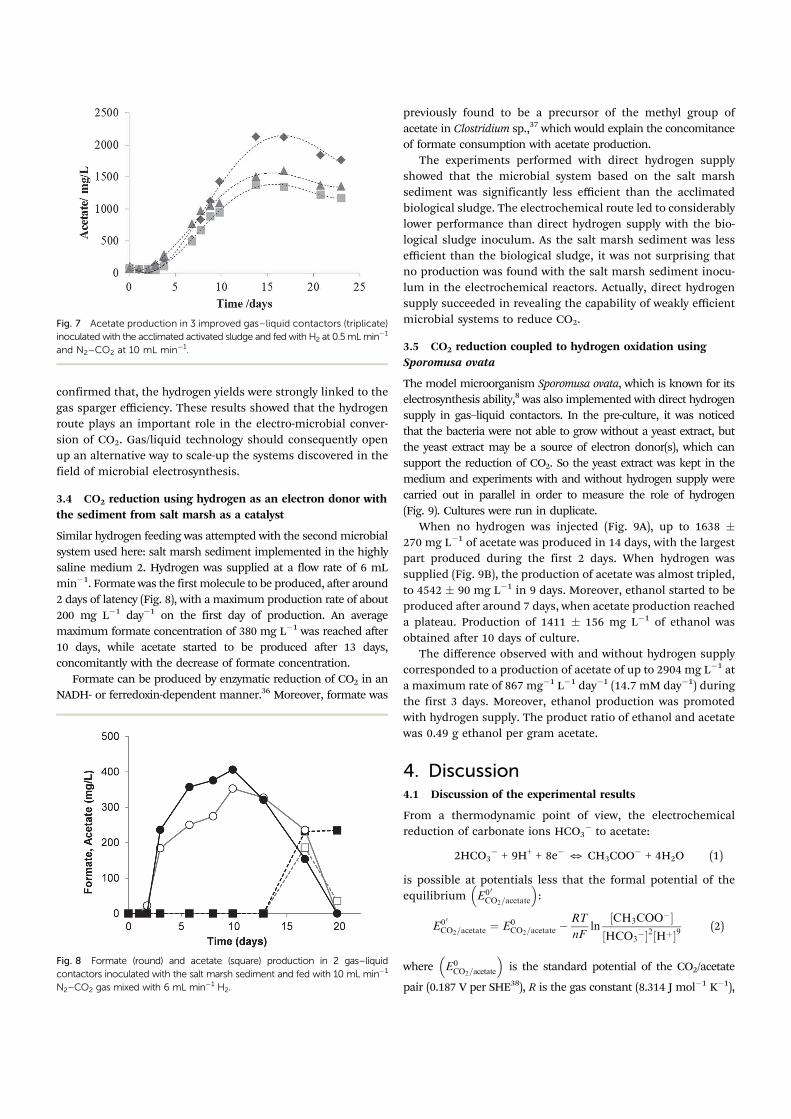
confirmed that, the hydrogen yields were strongly linked to the
gas sparger efficiency. These results showed that the hydrogen
route plays an important role in the electro-microbial conver-
sion of CO2. Gas/liquid technology should consequently open
up an alternative way to scale-up the systems discovered in the
field of microbial electrosynthesis.
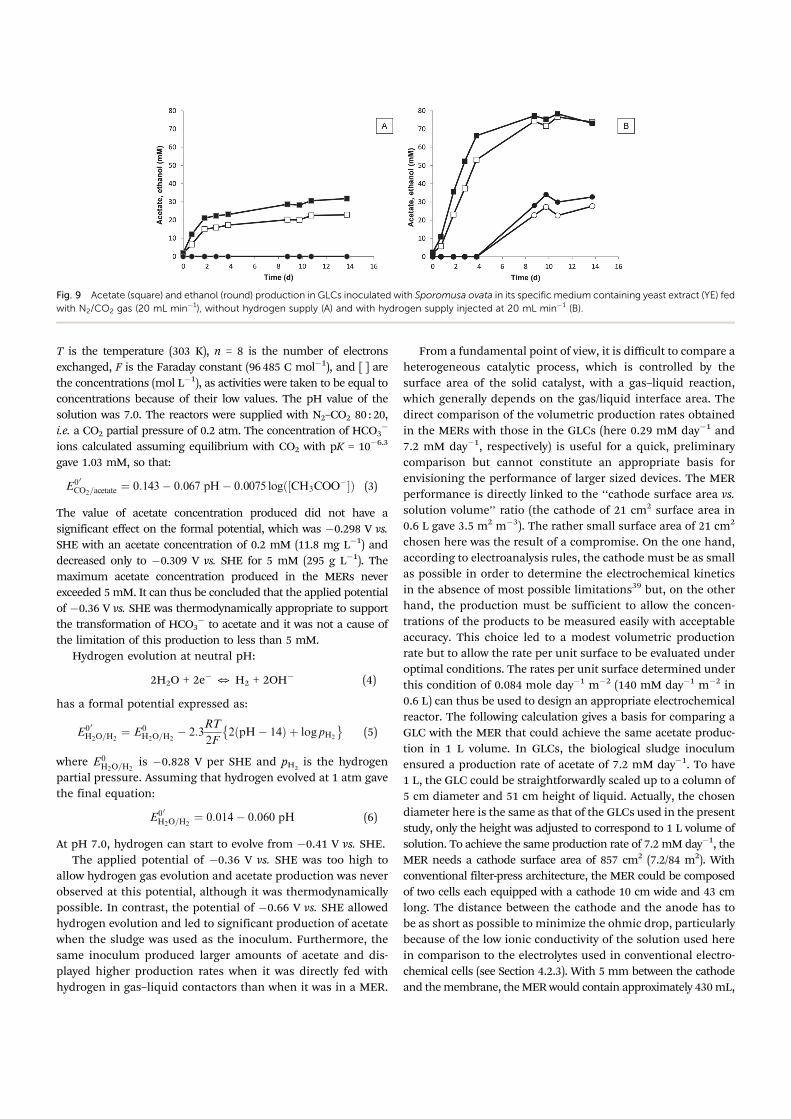
3.4 CO2 reduction using hydrogen as an electron donor with
the sediment from salt marsh as a catalyst
Similar hydrogen feeding was attempted with the second microbial
system used here: salt marsh sediment implemented in the highly
saline medium 2. Hydrogen was supplied at a flow rate of 6 mL
minÿ1. Formate was the first molecule to be produced, after around
2 days of latency (Fig. 8), with a maximum production rate of about
200 mg Lÿ1 dayÿ1 on the first day of production. An average
maximum formate concentration of 380 mg Lÿ1 was reached after
10 days, while acetate started to be produced after 13 days,
concomitantly with the decrease of formate concentration.
Formate can be produced by enzymatic reduction of CO2 in an
NADH- or ferredoxin-dependent manner.36 Moreover, formate was
previously found to be a precursor of the methyl group of
acetate in Clostridium sp.,37 which would explain the concomitance
of formate consumption with acetate production.
The experiments performed with direct hydrogen supply
showed that the microbial system based on the salt marsh
sediment was significantly less efficient than the acclimated
biological sludge. The electrochemical route led to considerably
lower performance than direct hydrogen supply with the bio-
logical sludge inoculum. As the salt marsh sediment was less
efficient than the biological sludge, it was not surprising that
no production was found with the salt marsh sediment inocu-
lum in the electrochemical reactors. Actually, direct hydrogen
supply succeeded in revealing the capability of weakly efficient
microbial systems to reduce CO2.
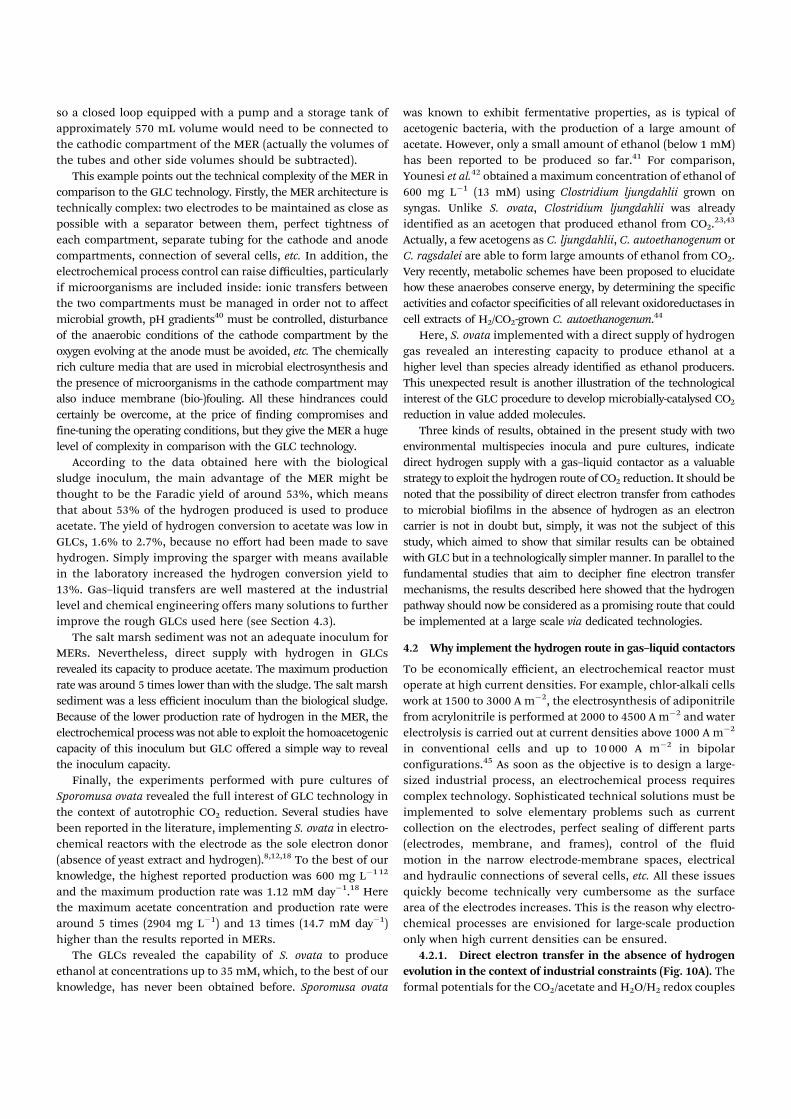
3.5 CO2 reduction coupled to hydrogen oxidation using
Sporomusa ovata
The model microorganism Sporomusa ovata, which is known for its
electrosynthesis ability,8 was also implemented with direct hydrogen
supply in gas–liquid contactors. In the pre-culture, it was noticed
that the bacteria were not able to grow without a yeast extract, but
the yeast extract may be a source of electron donor(s), which can
support the reduction of CO2. So the yeast extract was kept in the
medium and experiments with and without hydrogen supply were
carried out in parallel in order to measure the role of hydrogen
(Fig. 9). Cultures were run in duplicate.
When no hydrogen was injected (Fig. 9A), up to 1638 �
270 mg Lÿ1 of acetate was produced in 14 days, with the largest
part produced during the first 2 days. When hydrogen was
supplied (Fig. 9B), the production of acetate was almost tripled,
to 4542 � 90 mg Lÿ1 in 9 days. Moreover, ethanol started to be
produced after around 7 days, when acetate production reached
a plateau. Production of 1411 � 156 mg Lÿ1 of ethanol was
obtained after 10 days of culture.
The difference observed with and without hydrogen supply
corresponded to a production of acetate of up to 2904 mg Lÿ1 at
a maximum rate of 867 mgÿ1 Lÿ1 dayÿ1 (14.7 mM dayÿ1) during
the first 3 days. Moreover, ethanol production was promoted
with hydrogen supply. The product ratio of ethanol and acetate
was 0.49 g ethanol per gram acetate.
4. Discussion4.1 Discussion of the experimental results
From a thermodynamic point of view, the electrochemical
reduction of carbonate ions HCO3ÿ to acetate:
2HCO3ÿ + 9H+ + 8eÿ 3 CH3COO
ÿ + 4H2O (1)
is possible at potentials less that the formal potential of the
equilibrium E0 0
CO2=acetate
� �
:
E0 0
CO2=acetate¼ E0
CO2=acetateÿRT
nFln
CH3COOÿ½ �
HCO3ÿ½ �2 Hþ½ �9
(2)
where E0CO2=acetate
� �
is the standard potential of the CO2/acetate
pair (0.187 V per SHE38), R is the gas constant (8.314 J molÿ1 Kÿ1),
Fig. 8 Formate (round) and acetate (square) production in 2 gas–liquid
contactors inoculated with the salt marsh sediment and fed with 10 mL minÿ1
N2–CO2 gas mixed with 6 mL minÿ1 H2.
Fig. 7 Acetate production in 3 improved gas–liquid contactors (triplicate)
inoculated with the acclimated activated sludge and fed with H2 at 0.5 mLminÿ1
and N2–CO2 at 10 mL minÿ1.
T is the temperature (303 K), n = 8 is the number of electrons
exchanged, F is the Faraday constant (96485 C molÿ1), and [ ] are
the concentrations (mol Lÿ1), as activities were taken to be equal to
concentrations because of their low values. The pH value of the
solution was 7.0. The reactors were supplied with N2–CO2 80 : 20,
i.e. a CO2 partial pressure of 0.2 atm. The concentration of HCO3ÿ
ions calculated assuming equilibrium with CO2 with pK = 10ÿ6.3
gave 1.03 mM, so that:
E0 0
CO2=acetate¼ 0:143ÿ 0:067 pHÿ 0:0075 log CH3COO
ÿ½ �ð Þ (3)
The value of acetate concentration produced did not have a
significant effect on the formal potential, which was ÿ0.298 V vs.
SHE with an acetate concentration of 0.2 mM (11.8 mg Lÿ1) and
decreased only to ÿ0.309 V vs. SHE for 5 mM (295 g Lÿ1). The
maximum acetate concentration produced in the MERs never
exceeded 5mM. It can thus be concluded that the applied potential
of ÿ0.36 V vs. SHE was thermodynamically appropriate to support
the transformation of HCO3ÿ to acetate and it was not a cause of
the limitation of this production to less than 5 mM.
Hydrogen evolution at neutral pH:
2H2O + 2eÿ 3 H2 + 2OHÿ (4)
has a formal potential expressed as:
E0 0
H2O=H2¼ E0
H2O=H2ÿ 2:3
RT
2F2 pHÿ 14ð Þ þ log pH2
�
(5)
where E0H2O=H2
is ÿ0.828 V per SHE and pH2is the hydrogen
partial pressure. Assuming that hydrogen evolved at 1 atm gave
the final equation:
E0 0
H2O=H2¼ 0:014ÿ 0:060 pH (6)
At pH 7.0, hydrogen can start to evolve from ÿ0.41 V vs. SHE.
The applied potential of ÿ0.36 V vs. SHE was too high to
allow hydrogen gas evolution and acetate production was never
observed at this potential, although it was thermodynamically
possible. In contrast, the potential of ÿ0.66 V vs. SHE allowed
hydrogen evolution and led to significant production of acetate
when the sludge was used as the inoculum. Furthermore, the
same inoculum produced larger amounts of acetate and dis-
played higher production rates when it was directly fed with
hydrogen in gas–liquid contactors than when it was in a MER.
From a fundamental point of view, it is difficult to compare a
heterogeneous catalytic process, which is controlled by the
surface area of the solid catalyst, with a gas–liquid reaction,
which generally depends on the gas/liquid interface area. The
direct comparison of the volumetric production rates obtained
in the MERs with those in the GLCs (here 0.29 mM dayÿ1 and
7.2 mM dayÿ1, respectively) is useful for a quick, preliminary
comparison but cannot constitute an appropriate basis for
envisioning the performance of larger sized devices. The MER
performance is directly linked to the ‘‘cathode surface area vs.
solution volume’’ ratio (the cathode of 21 cm2 surface area in
0.6 L gave 3.5 m2 mÿ3). The rather small surface area of 21 cm2
chosen here was the result of a compromise. On the one hand,
according to electroanalysis rules, the cathode must be as small
as possible in order to determine the electrochemical kinetics
in the absence of most possible limitations39 but, on the other
hand, the production must be sufficient to allow the concen-
trations of the products to be measured easily with acceptable
accuracy. This choice led to a modest volumetric production
rate but to allow the rate per unit surface to be evaluated under
optimal conditions. The rates per unit surface determined under
this condition of 0.084 mole dayÿ1 mÿ2 (140 mM dayÿ1 mÿ2 in
0.6 L) can thus be used to design an appropriate electrochemical
reactor. The following calculation gives a basis for comparing a
GLC with the MER that could achieve the same acetate produc-
tion in 1 L volume. In GLCs, the biological sludge inoculum
ensured a production rate of acetate of 7.2 mM dayÿ1. To have
1 L, the GLC could be straightforwardly scaled up to a column of
5 cm diameter and 51 cm height of liquid. Actually, the chosen
diameter here is the same as that of the GLCs used in the present
study, only the height was adjusted to correspond to 1 L volume of
solution. To achieve the same production rate of 7.2 mM dayÿ1, the
MER needs a cathode surface area of 857 cm2 (7.2/84 m2). With
conventional filter-press architecture, the MER could be composed
of two cells each equipped with a cathode 10 cm wide and 43 cm
long. The distance between the cathode and the anode has to
be as short as possible to minimize the ohmic drop, particularly
because of the low ionic conductivity of the solution used here
in comparison to the electrolytes used in conventional electro-
chemical cells (see Section 4.2.3). With 5 mm between the cathode
and themembrane, theMERwould contain approximately 430mL,
Fig. 9 Acetate (square) and ethanol (round) production in GLCs inoculated with Sporomusa ovata in its specific medium containing yeast extract (YE) fed
with N2/CO2 gas (20 mL minÿ1), without hydrogen supply (A) and with hydrogen supply injected at 20 mL minÿ1 (B).
so a closed loop equipped with a pump and a storage tank of
approximately 570 mL volume would need to be connected to
the cathodic compartment of the MER (actually the volumes of
the tubes and other side volumes should be subtracted).
This example points out the technical complexity of the MER in
comparison to the GLC technology. Firstly, the MER architecture is
technically complex: two electrodes to be maintained as close as
possible with a separator between them, perfect tightness of
each compartment, separate tubing for the cathode and anode
compartments, connection of several cells, etc. In addition, the
electrochemical process control can raise difficulties, particularly
if microorganisms are included inside: ionic transfers between
the two compartments must be managed in order not to affect
microbial growth, pH gradients40 must be controlled, disturbance
of the anaerobic conditions of the cathode compartment by the
oxygen evolving at the anode must be avoided, etc. The chemically
rich culture media that are used in microbial electrosynthesis and
the presence of microorganisms in the cathode compartment may
also induce membrane (bio-)fouling. All these hindrances could
certainly be overcome, at the price of finding compromises and
fine-tuning the operating conditions, but they give the MER a huge
level of complexity in comparison with the GLC technology.
According to the data obtained here with the biological
sludge inoculum, the main advantage of the MER might be
thought to be the Faradic yield of around 53%, which means
that about 53% of the hydrogen produced is used to produce
acetate. The yield of hydrogen conversion to acetate was low in
GLCs, 1.6% to 2.7%, because no effort had been made to save
hydrogen. Simply improving the sparger with means available
in the laboratory increased the hydrogen conversion yield to
13%. Gas–liquid transfers are well mastered at the industrial
level and chemical engineering offers many solutions to further
improve the rough GLCs used here (see Section 4.3).
The salt marsh sediment was not an adequate inoculum for
MERs. Nevertheless, direct supply with hydrogen in GLCs
revealed its capacity to produce acetate. The maximum production
rate was around 5 times lower than with the sludge. The salt marsh
sediment was a less efficient inoculum than the biological sludge.
Because of the lower production rate of hydrogen in the MER, the
electrochemical process was not able to exploit the homoacetogenic
capacity of this inoculum but GLC offered a simple way to reveal
the inoculum capacity.
Finally, the experiments performed with pure cultures of
Sporomusa ovata revealed the full interest of GLC technology in
the context of autotrophic CO2 reduction. Several studies have
been reported in the literature, implementing S. ovata in electro-
chemical reactors with the electrode as the sole electron donor
(absence of yeast extract and hydrogen).8,12,18 To the best of our
knowledge, the highest reported production was 600 mg Lÿ112
and the maximum production rate was 1.12 mM dayÿ1.18 Here
the maximum acetate concentration and production rate were
around 5 times (2904 mg Lÿ1) and 13 times (14.7 mM dayÿ1)
higher than the results reported in MERs.
The GLCs revealed the capability of S. ovata to produce
ethanol at concentrations up to 35 mM, which, to the best of our
knowledge, has never been obtained before. Sporomusa ovata
was known to exhibit fermentative properties, as is typical of
acetogenic bacteria, with the production of a large amount of
acetate. However, only a small amount of ethanol (below 1 mM)
has been reported to be produced so far.41 For comparison,
Younesi et al.42 obtained a maximum concentration of ethanol of
600 mg Lÿ1 (13 mM) using Clostridium ljungdahlii grown on
syngas. Unlike S. ovata, Clostridium ljungdahlii was already
identified as an acetogen that produced ethanol from CO2.23,43
Actually, a few acetogens as C. ljungdahlii, C. autoethanogenum or
C. ragsdalei are able to form large amounts of ethanol from CO2.
Very recently, metabolic schemes have been proposed to elucidate
how these anaerobes conserve energy, by determining the specific
activities and cofactor specificities of all relevant oxidoreductases in
cell extracts of H2/CO2-grown C. autoethanogenum.44
Here, S. ovata implemented with a direct supply of hydrogen
gas revealed an interesting capacity to produce ethanol at a
higher level than species already identified as ethanol producers.
This unexpected result is another illustration of the technological
interest of the GLC procedure to develop microbially-catalysed CO2
reduction in value added molecules.
Three kinds of results, obtained in the present study with two
environmental multispecies inocula and pure cultures, indicate
direct hydrogen supply with a gas–liquid contactor as a valuable
strategy to exploit the hydrogen route of CO2 reduction. It should be
noted that the possibility of direct electron transfer from cathodes
to microbial biofilms in the absence of hydrogen as an electron
carrier is not in doubt but, simply, it was not the subject of this
study, which aimed to show that similar results can be obtained
with GLC but in a technologically simplermanner. In parallel to the
fundamental studies that aim to decipher fine electron transfer
mechanisms, the results described here showed that the hydrogen
pathway should now be considered as a promising route that could
be implemented at a large scale via dedicated technologies.
4.2 Why implement the hydrogen route in gas–liquid contactors
To be economically efficient, an electrochemical reactor must
operate at high current densities. For example, chlor-alkali cells
work at 1500 to 3000 A mÿ2, the electrosynthesis of adiponitrile
from acrylonitrile is performed at 2000 to 4500 A mÿ2 and water
electrolysis is carried out at current densities above 1000 A mÿ2
in conventional cells and up to 10 000 A mÿ2 in bipolar
configurations.45 As soon as the objective is to design a large-
sized industrial process, an electrochemical process requires
complex technology. Sophisticated technical solutions must be
implemented to solve elementary problems such as current
collection on the electrodes, perfect sealing of different parts
(electrodes, membrane, and frames), control of the fluid
motion in the narrow electrode-membrane spaces, electrical
and hydraulic connections of several cells, etc. All these issues
quickly become technically very cumbersome as the surface
area of the electrodes increases. This is the reason why electro-
chemical processes are envisioned for large-scale production
only when high current densities can be ensured.
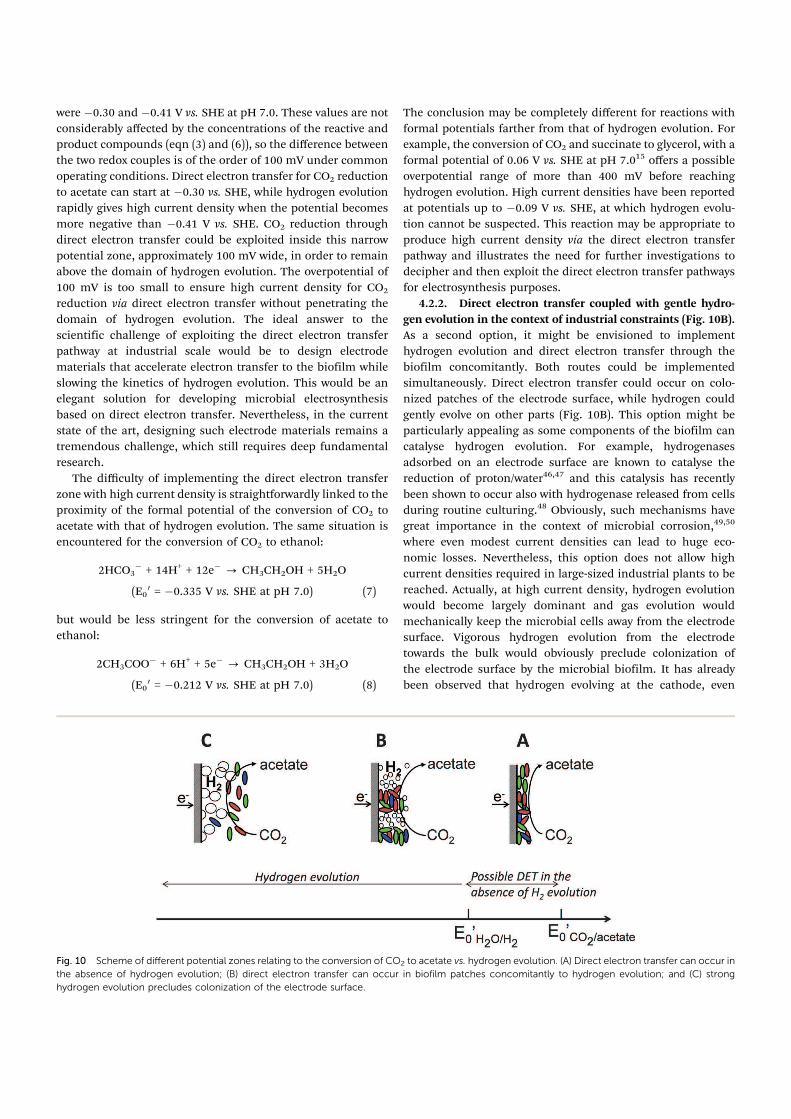
4.2.1. Direct electron transfer in the absence of hydrogen
evolution in the context of industrial constraints (Fig. 10A). The
formal potentials for the CO2/acetate and H2O/H2 redox couples
were ÿ0.30 and ÿ0.41 V vs. SHE at pH 7.0. These values are not
considerably affected by the concentrations of the reactive and
product compounds (eqn (3) and (6)), so the difference between
the two redox couples is of the order of 100 mV under common
operating conditions. Direct electron transfer for CO2 reduction
to acetate can start at ÿ0.30 vs. SHE, while hydrogen evolution
rapidly gives high current density when the potential becomes
more negative than ÿ0.41 V vs. SHE. CO2 reduction through
direct electron transfer could be exploited inside this narrow
potential zone, approximately 100 mV wide, in order to remain
above the domain of hydrogen evolution. The overpotential of
100 mV is too small to ensure high current density for CO2
reduction via direct electron transfer without penetrating the
domain of hydrogen evolution. The ideal answer to the
scientific challenge of exploiting the direct electron transfer
pathway at industrial scale would be to design electrode
materials that accelerate electron transfer to the biofilm while
slowing the kinetics of hydrogen evolution. This would be an
elegant solution for developing microbial electrosynthesis
based on direct electron transfer. Nevertheless, in the current
state of the art, designing such electrode materials remains a
tremendous challenge, which still requires deep fundamental
research.
The difficulty of implementing the direct electron transfer
zone with high current density is straightforwardly linked to the
proximity of the formal potential of the conversion of CO2 to
acetate with that of hydrogen evolution. The same situation is
encountered for the conversion of CO2 to ethanol:
2HCO3ÿ + 14H+ + 12eÿ - CH3CH2OH + 5H2O
(E00 = ÿ0.335 V vs. SHE at pH 7.0) (7)
but would be less stringent for the conversion of acetate to
ethanol:
2CH3COOÿ + 6H+ + 5eÿ - CH3CH2OH + 3H2O
(E00 = ÿ0.212 V vs. SHE at pH 7.0) (8)
The conclusion may be completely different for reactions with
formal potentials farther from that of hydrogen evolution. For
example, the conversion of CO2 and succinate to glycerol, with a
formal potential of 0.06 V vs. SHE at pH 7.015 offers a possible
overpotential range of more than 400 mV before reaching
hydrogen evolution. High current densities have been reported
at potentials up to ÿ0.09 V vs. SHE, at which hydrogen evolu-
tion cannot be suspected. This reaction may be appropriate to
produce high current density via the direct electron transfer
pathway and illustrates the need for further investigations to
decipher and then exploit the direct electron transfer pathways
for electrosynthesis purposes.
4.2.2. Direct electron transfer coupled with gentle hydro-
gen evolution in the context of industrial constraints (Fig. 10B).
As a second option, it might be envisioned to implement
hydrogen evolution and direct electron transfer through the
biofilm concomitantly. Both routes could be implemented
simultaneously. Direct electron transfer could occur on colo-
nized patches of the electrode surface, while hydrogen could
gently evolve on other parts (Fig. 10B). This option might be
particularly appealing as some components of the biofilm can
catalyse hydrogen evolution. For example, hydrogenases
adsorbed on an electrode surface are known to catalyse the
reduction of proton/water46,47 and this catalysis has recently
been shown to occur also with hydrogenase released from cells
during routine culturing.48 Obviously, such mechanisms have
great importance in the context of microbial corrosion,49,50
where even modest current densities can lead to huge eco-
nomic losses. Nevertheless, this option does not allow high
current densities required in large-sized industrial plants to be
reached. Actually, at high current density, hydrogen evolution
would become largely dominant and gas evolution would
mechanically keep the microbial cells away from the electrode
surface. Vigorous hydrogen evolution from the electrode
towards the bulk would obviously preclude colonization of
the electrode surface by the microbial biofilm. It has already
been observed that hydrogen evolving at the cathode, even
Fig. 10 Scheme of different potential zones relating to the conversion of CO2 to acetate vs. hydrogen evolution. (A) Direct electron transfer can occur in
the absence of hydrogen evolution; (B) direct electron transfer can occur in biofilm patches concomitantly to hydrogen evolution; and (C) strong
hydrogen evolution precludes colonization of the electrode surface.
under gentle current densities of around 10 A mÿ2, limits the
biofilm formation.23 Under such conditions, the benefit of the
direct electron transfer route would be annihilated and CO2
conversion would be driven by the hydrogen route only.
4.2.3. The hydrogen route in the context of industrial
constraints (Fig. 10C). Finally, as a third option, the electro-
chemical reactor might be considered as the hydrogen supplier
for the bacteria that develop in the bulk. In other words, this
third option would consist of introducing the bacteria into a
water electrolysis cell in order to perform both hydrogen
production and the homoacetogenic CO2 conversion in the
same device. High current densities could be used to support
strong hydrogen evolution. The Faradic yields would be very
low because of the short residence time of hydrogen in the
reactor. Actually, designing efficient water electrolysis cells, i.e.
cells able to ensure very high hydrogen evolution rates, but with
long hydrogen residence time presents two opposing con-
straints from an engineering point of view. Other antagonistic
requirements would also arise, such as the necessity to work at
pH around neutrality for bacterial growth while optimum water
electrolysis cells use extremely alkaline solutions (KOH more
than 20%, pH 14 and above). The chemical complexity of the
culture media can be another hindrance to the electrochemical
process, because numerous cations that are necessary to micro-
bial growth (e.g. Ca2+, Mg2+, etc.) are most likely to deposit on
the cathode surface due to local alkalinization of the interface.
Electrochemical cells also require electrolytes of very high ionic
conductivity to keep ohmic power losses to the minimum.
Concentrated potassium hydroxide solutions have ionic con-
ductivities above 20 S mÿ1. In contrast, the most common
culture media used in microbial electrochemistry have ionic
conductivities ranging from 0.5 to a maximum of 2 S mÿ1.32 For
instance, an electrochemical cell with a 5 mm inter-electrode
distance operated at 1000 A mÿ2 must overcome an ohmic drop
of less than 250 mV if a conventional electrolyte with ionic
conductivity greater than 20 S mÿ1 is used, while the ohmic drop
would be 5 V with a culture medium of 1 S mÿ1 conductivity.
In summary, implementing the acetogenic microbial reaction
inside a water electrolysis cell would raise a huge number of
cumbersome antagonistic constraints. They would have to be
solved at the price of drastic performance degradation with respect
to the current level of industrial water electrolysis devices.
In the current state of the art microbial electrosynthesis, as
far as reductions with formal potential not very different from
that of hydrogen evolution are concerned, the best strategy for
short- or mid-term scaling up is to connect a microbial gas–
liquid contactor downstream of a conventional water electrolysis
cell. This system constitutes a hybrid system, according to the
terminology proposed recently for microbial electrochemical
technologies.51 The high performance of water electrolysis is
thus preserved and the efforts to be made for scaling up the
homoacetogenic microbial synthesis are focused on the GLC. In
this way, the chemical composition of the culture medium can
be fitted to microbial requirements without any concern about
possible deposits on the electrode surface or too weak ionic
conductivity. The main problem linked to the low microbial
reaction rate can be coped with in GLC without additional
constraints due to the electrochemical process.
4.3 How to improve the GLC technology for homoacetogenic
CO2 conversion
The preliminary experiments described here have evidenced
the potential of the GLC option and illustrated the fast progress
that can be made thanks to simple technological improvements.
Here, just changing the gas sparger multiplied the hydrogen
conversion yield by a factor of 8. At the industrial level, efficient
solutions exist to improve the hydrogen/liquid transfers. Hydro-
genation is the most ubiquitous reaction in the commercial
organic chemical industry52 and is commonly implemented in
several-ton industrial plants under hydrogen pressure of several
bars with metallic catalysts.53
Here, the microbial catalysis of the conversion of CO2 to
acetate using hydrogen:
2HCO3ÿ + 4H2 + H+
3 CH3COOÿ + 4H2O (9)
does not ensure such high reaction rates as the metallic catalysts in
conventional hydrogenations. That is why the existing technologies
need to be adapted to implement the appropriate hydrogen/liquid
transfer. Work in this direction has already started with success,
using pure cultures of Acetobacter woodii for example, which have
ensured a final acetate concentration of 44.7 g Lÿ1 by working
under pressurized H2:CO2; more than 50 g Lÿ1 acetate have been
reached in less than 4 days with recombinant strains.54
Similar studies carried out in the field of carbon monoxide
fermentation are also very encouraging. Synthesis gas is a
mixture of CO and H2 (also called syngas), large amounts of
which can be obtained by the gasification of biomass (straw,
wood, etc.). Syngas fermentation by acetogenic species has
started to raise commercial interest for its capacity to produce
fuels and chemicals.55 The low solubility of CO and H2 has been
overcome by chemical engineering solutions56 so the process
has become relatively mature and commercial scaling up can
now be reasonably contemplated.57 The low solubility of CO2
should be overcome by similar technological solutions. For
example, the bubbleless technologies using membrane contac-
tors, which have been patented for syngas fermentation,56
should be a promising way to adapt to the CO2 conversion
routes coming from microbial electrosynthesis.
5. Conclusion
Chronoamperometries performed at two different potentials
showed that the hydrogen route was largely involved in the
reduction of CO2 to acetate. Using the samemedia in gas–liquid
contactors supplied with hydrogen led to higher production
rates and higher maximum concentrations than the electro-
chemical reactors. Moreover, gas–liquid contactors revealed a
higher capacity of Sporomusa ovata to reduce CO2 than observed
so far and also its unsuspected ability to produce ethanol. The
autotrophic culture of acetogens in hydrogen-supplied gas–liquid
biocontactors should now be considered as a route of great interest
for scaling up the CO2 reduction systems revealed by microbial
electrosynthesis.
Acknowledgements
This work was part of the ‘‘BIORARE’’ project (ANR-10-BTBR-02),
partly funded by the French Agence Nationale de la Recherche
(ANR) and the Comite des Investissements d’Avenir. The authors
thank Dr Laure Renvoise and Suez Environnement for supplying
the biological sludge used in the experiments. We also thank Ms
Susan Becker for her help in correcting the English version of the
manuscript.
References
1 J. Desloover, J. B. A. Arends, T. Hennebel and K. Rabaey,
Biochem. Soc. Trans., 2012, 40, 1233–1238.
2 C. D. Windle and R. N. Perutz, Coord. Chem. Rev., 2012, 256,
2562–2570.
3 S. Srikanth, M. Maesen, X. Dominguez-Benetton,
K. Vanbroekhoven and D. Pant, Bioresour. Technol., 2014,
165, 350–354.
4 P. Kang, Z. Chen, A. Nayak, S. Zhang and T. J. Meyer, Energy
Environ. Sci., 2014, 7, 4007–4012.
5 H. Yin, X. Mao, D. Tang, W. Xiao, L. Xing, H. Zhu,
D. Wang and D. R. Sadoway, Energy Environ. Sci., 2013, 6,
1538–1545.
6 D. R. Lovley, Environ. Microbiol. Rep., 2011, 3, 27–35.
7 D. R. Lovley and K. P. Nevin, Curr. Opin. Biotechnol., 2013,
24, 385–390.
8 K. P. Nevin, T. L. Woodard, A. E. Franks, Z. M. Summers and
D. R. Lovley, mBio, 2010, 1, e00103.
9 X. Cao, X. Huang, P. Liang, N. Boon, M. Fan, L. Zhang and
X. Zhang, Energy Environ. Sci., 2009, 2, 498.
10 X. Wang, Y. Feng, J. Liu, H. Lee, C. Li, N. Li and N. Ren,
Biosens. Bioelectron., 2010, 25, 2639–2643.
11 K. P. Nevin, S. A. Hensley, A. E. Franks, Z. M. Summers,
J. Ou, T. L. Woodard, O. L. Snoeyenbos-West and
D. R. Lovley, Appl. Environ. Microbiol., 2011, 77,
2882–2886.
12 T. Zhang, H. Nie, T. S. Bain, H. Lu, M. Cui, O. L. Snoeyenbos-
West, A. E. Franks, K. P. Nevin, T. P. Russell and D. R. Lovley,
Energy Environ. Sci., 2012, 6, 217–224.
13 C. W. Marshall, D. E. Ross, E. B. Fichot, R. S.
Norman and H. D. May, Appl. Environ. Microbiol., 2012, 78,
8412–8420.
14 C. W. Marshall, D. E. Ross, E. B. Fichot, R. S.
Norman and H. D. May, Environ. Sci. Technol., 2013, 47,
6023–6029.
15 L. Soussan, J. Riess, B. Erable, M.-L. Delia and A. Bergel,
Electrochem. Commun., 2013, 28, 27–30.
16 M. Su, Y. Jiang and D. Li, J. Microbiol. Biotechnol., 2013, 23,
1140–1146.
17 Y. Jiang, M. Su, Y. Zhang, G. Zhan, Y. Tao and D. Li, Int.
J. Hydrogen Energy, 2013, 38, 3497–3502.
18 H. Nie, T. Zhang, M. Cui, H. Lu, D. R. Lovley and T. P. Russell,
Phys. Chem. Chem. Phys., 2013, 15, 14290.
19 Y. Gong, A. Ebrahim, A. M. Feist, M. Embree, T. Zhang,
D. Lovley and K. Zengler, Environ. Sci. Technol., 2013, 47,
568–573.
20 R. Ganigue, S. Puig, P. Batlle-Vilanova, M. D.
Balaguer and J. Colprim, Chem. Commun., 2015, 51,
3235–3238.
21 E. V. LaBelle, C. W. Marshall, J. A. Gilbert and H. D. May,
PLoS One, 2014, 9, e109935.
22 G. Mohanakrishna, J. S. Seelam, K. Vanbroekhoven and
D. Pant, Faraday Discuss., 2015, DOI: 10.1039/c5fd00041f.
23 S. Bajracharya, A. ter Heijne, X. Dominguez Benetton,
K. Vanbroekhoven, C. J. N. Buisman, D. P. B. T. B. Strik
and D. Pant, Bioresour. Technol., 2015, 195, 14–24.
24 A. Yarzabal, G. Brasseur, J. Ratouchniak, K. Lund, D. Lemesle-
Meunier, J. A. DeMoss and V. Bonnefoy, J. Bacteriol., 2002, 184,
313–317.
25 G. Diekert and G. Wohlfarth, Antonie van Leeuwenhoek,
1994, 66, 209–221.
26 F. Fischer, R. Lieske and K. Winzer, Biochemistry, 1932, 245,
2–12.
27 K. Wieringa, Antonie van Leeuwenhoek, 1936, 3, 263–273.
28 J. L. Karlsson, B. E. Volcani and H. A. Barker, J. Bacteriol.,
1948, 56, 781–782.
29 W. E. Balch, S. Schoberth, R. S. Tanner and R. S. Wolfe, Int.
J. Syst. Bacteriol., 1977, 27, 355–361.
30 C. Dumas, R. Basseguy and A. Bergel, Electrochim. Acta,
2008, 53, 2494–2500.
31 L. Pons, M.-L. Delia and A. Bergel, Bioresour. Technol., 2011,
102, 2678–2683.
32 R. Rousseau, C. Santaella, W. Achouak, J.-J. Godon,
A. Bonnafous, A. Bergel and M.-L. Delia, ChemElectroChem,
2014, 1, 1966–1975.
33 R. Rousseau, X. Dominguez-Benetton, M.-L. Delia and
A. Bergel, Electrochem. Commun., 2013, 33, 1–4.
34 C. Leang, T. Ueki, K. P. Nevin and D. R. Lovley, Appl.
Environ. Microbiol., 2012, AEM.02891–12.
35 C. G. S. Giddings, K. P. Nevin, T. Woodward, D. R. Lovley
and C. S. Butler, Front. Microbiol., 2015, 6, DOI: 10.3389/
fmicb.2015.00468.
36 B. R. Crable, C. M. Plugge, M. J. McInerney and
A. J. M. Stams, Enzyme Res., 2011, 2011, e532536.
37 K. Lentz and H. G. Wood, J. Biol. Chem., 1955, 215,
645–654.
38 B. E. Logan, B. Hamelers, R. Rozendal, U. Schroder, J. Keller,
S. Freguia, P. Aelterman, W. Verstraete and K. Rabaey,
Environ. Sci. Technol., 2006, 40, 5181–5192.
39 M. Rimboud, D. Pocaznoi, B. Erable and A. Bergel, Phys.
Chem. Chem. Phys., 2014, 16, 16349.
40 E. Blanchet, S. Pecastaings, B. Erable, C. Roques and
A. Bergel, Bioresour. Technol., 2014, 173, 224–230.
41 B. Moller, R. Oßmer, B. H. Howard, G. Gottschalk and
H. Hippe, Arch. Microbiol., 1984, 139, 388–396.
42 H. Younesi, G. Najafpour and A. R. Mohamed, Biochem. Eng.
J., 2005, 27, 110–119.
43 B. Schiel-Bengelsdorf and P. Durre, FEBS Lett., 2012, 586,
2191–2198.
44 J. Mock, Y. Zheng, A. P. Mueller, S. Ly, L. Tran, S. Segovia,
S. Nagaraju, M. Kopke, P. Durre and R. K. Thauer, J. Bacteriol.,
2015, 197, 2965–2980.
45 H. Wendt and G. Kreysa, Electrochemical Engineering:
Science and Technology in Chemical and Other Industries,
Springer Science & Business Media, 1999.
46 J. Cantet, A. Bergel, M. Comtat and J.-L. Seris, J. Mol. Catal.,
1992, 73, 371–380.
47 K. Delecouls, P. Saint-Aguet, C. Zaborosch and A. Bergel,
J. Electroanal. Chem., 1999, 468, 139–149.
48 J. S. Deutzmann, M. Sahin and A. M. Spormann, mBio, 2015,
6, e00496.
49 M. Mehanna, R. Basseguy, M.-L. Delia and A. Bergel, Elec-
trochem. Commun., 2009, 11, 568–571.
50 S. Da Silva, R. Basseguy and A. Bergel, J. Electroanal. Chem.,
2004, 561, 93–102.
51 U. Schroder, F. Harnisch and L. T. Angenent, Energy Environ.
Sci., 2015, 8, 513–519.
52 H. F. Rase, Handbook of Commercial Catalysts: Heterogeneous
Catalysts, CRC Press, 2000, p. 105.
53 J. Hagen, Industrial Catalysis: A Practical Approach, John
Wiley & Sons, 2006.
54 M. Straub, M. Demler, D. Weuster-Botz and P. Durre,
J. Biotechnol., 2014, 178, 67–72.
55 A. M. Henstra, J. Sipma, A. Rinzema and A. J. Stams, Curr.
Opin. Biotechnol., 2007, 18, 200–206.
56 M. Kopke, C. Mihalcea, J. C. Bromley and S. D. Simpson,
Curr. Opin. Biotechnol., 2011, 22, 320–325.
57 J. Daniell, M. Kopke and S. D. Simpson, Energies, 2012, 5,
5372–5417.