Embed Size (px)
Citation preview

Science of the Total Environment 409 (2011) 4917–4922
Contents lists available at SciVerse ScienceDirect
Science of the Total Environment
j ourna l homepage: www.e lsev ie r .com/ locate /sc i totenv
Import–export balance of nitrogen and phosphorus in food, fodder and fertilizers inthe Baltic Sea drainage area
Eero Asmala a,⁎, Laura Saikku b, Sanna Vienonen c
a Finnish Environment Institute, Marine Research Centre, P.O. Box 140, FI-00251 Helsinki, Finlandb University of Helsinki, Faculty of Biological and Environmental Sciences, P.O. Box 65, FI-00014 University of Helsinki, Finlandc Finnish Environment Institute, Freshwater Centre, P.O. Box 140, FI-00251 Helsinki, Finland
⁎ Corresponding author at: Marine Research Centre,(SYKE), Erik Palménin aukio 1, P.O. Box 140, FI-00251 H
E-mail address: [email protected] (E. Asmala
0048-9697/$ – see front matter © 2011 Elsevier B.V. Alldoi:10.1016/j.scitotenv.2011.08.030
a b s t r a c t
a r t i c l e i n f oArticle history:Received 31 December 2010Received in revised form 5 August 2011Accepted 15 August 2011Available online 9 September 2011
Keywords:Baltic SeaEutrophicationPhosphorusNitrogenInternational tradeFood production
Nitrogen (N) and phosphorus (P) are essential elements for life, but in excess they contribute to aquatic eutro-phication. The Baltic Sea is a brackish semi-enclosed sea that is heavily influenced by anthropogenic loading ofnutrients, resulting in a major environmental problem, eutrophication. In this study, the nutrient balance ofthe food production and consumption system in seven countries in the Baltic Sea drainage area was quantifiedfor the period 2002–2005. The food production and consumption system accumulates nutrients in the BalticSea drainage area, due to extensive imports to the system. The average annual net surplus of nutrients was 1800 000 tons N and 320 000 tons P in 2002–2005, or annually 28 kg N and 5 kg P per capita. The average totalannual import was 2 100 000 tons N and 340 000 tons P during 2002–2005. The largest imports to the systemwere fertilizers, totaling 1 700 000 tons N and 290 000 tons P. Traded nutrients in food and fodder amountedto a net annual surplus of 180 000 tons N and 25 000 tons P. The nutrient load to the Baltic Sea due to the foodconsumption and production system was 21% N and 6% P of the respective annual net inputs to the region.This study shows that large amounts of nutrients to Baltic Sea drainage area are inputs from outside the region,eventually contributing to eutrophication. To reduce the nutrient imports, fertilizers should be used more effi-ciently, nutrients should be recycledmore efficiently inside the region, and food system should be guided towardlow-nutrient intensive diets.
Finnish Environment Instituteelsinki, Finland.).
rights reserved.
© 2011 Elsevier B.V. All rights reserved.
1. Introduction
For life on Earth, nitrogen (N) and phosphorus (P) are indispensableelements. They are essential components of e.g. macromolecules aden-osine triphosphate and deoxyribonucleic acid (ATP and DNA), whichcarry energy and genetic information in living cells. Both nitrogen andphosphorus have been used in continuously increasing amounts as fer-tilizers in agricultural production, which in turn has been increasing thenutrient runoff to aquatic environments globally (Compton et al., 2000;Galloway et al., 2004). While their biogeochemistry differs greatly, Nand P enrichment are the cause of eutrophication problems encoun-tered in many freshwater and estuarine and marine systems However,the biogeochemistry of nitrogen and phosphorus differs substantially(Vitousek et al., 2003; Filippelli, 2008).
TheBaltic Sea is a unique brackishwater environment,with a salinityranging from freshwater toward oceanic salinities (mean salinity 7 psu).The Baltic Sea is also a small water body due to its shallowness — itsmean depth is only 54 m (Leppäranta and Myrberg, 2009). These
physical properties combinedwith the influence of the about 90 millioninhabitants of 14 countries in the 1720000 km2 drainage basin result inhigh anthropogenic pressure on the environment and nonuniform eco-logical responses, e.g. to nutrient loading (Tamminen and Andersen,2007). The interplay of the two elements examined in this study, nitro-gen and phosphorus, is highly pronounced in the Baltic Sea eutrophica-tion (Conley et al., 2009a). Eutrophication, i.e. the process of ecologicalresponse to the enrichment of growth-limitingnutrients (specifically ni-trogen and phosphorus) is considered to be the single greatest threat tothe Baltic Sea environment (Elmgren, 2001; HELCOM, 2009). Nutrientenrichment leads to increased primary production, which in turn hasconsequences as alterations in species structure, biodiversity and recre-ational values (Rönnberg and Bonsdorff, 2004).
The low-saline northernmost part of the Baltic Sea, Gulf of Bothniaexhibits strong phosphorus deficiency in primary production, whilethe almost oceanic saline waters of the Danish Straits are limited bythe availability of nitrogen (HELCOM, 2009). Hence, current trends incombating eutrophication emphasize the need for reducing the loadof both nitrogen and phosphorus (Howarth and Marino, 2006; Conleyet al., 2009a; Paerl, 2009).In the Baltic Sea, there are also internal pro-cesses leading to changes in the budgets of bioavailable nutrients,such as binding of phosphorus to sediment particles and release of gas-eous nitrogen to the atmosphere via denitrification (Gunnars and

4918 E. Asmala et al. / Science of the Total Environment 409 (2011) 4917–4922
Blomqvist, 1997; Tuominen et al., 1998). Nitrogen and phosphorus lim-itation has been widely discussed by Elser et al. (2007).
The largest contributors of nutrient loading to the Baltic Sea are dif-fuse loading from agriculture and municipal wastewater treatmentplants, which account for over 90% of both nitrogen and phosphorusloading (HELCOM, 2009). Agricultural practices in the Baltic Sea regionare intensive. In the Scandinavian countries, the separation of crop andanimal production culminated in the1980s in Sweden, Finland andDen-mark (Granstedt, 2000). Also, specialized forms of agriculture based onchemical fertilizers, nonrenewable energy, and pesticide usewere intro-duced. On average in the Baltic Sea region, farms have a high density ofanimals and large surpluses of nutrients (Granstedt, 2000).
Global estimates of nutrient fluxes from agriculture have been stud-ied in general by Vitousek et al. (2009), while Kyllingsbaek and Hansen(2007) focused on the Baltic Sea region of Denmark by and Eriksson etal. (2007) the region of Poland. In addition, there are studies calculatingnutrient balances of food consumption andproduction related to theBal-tic Sea region at different levels: for the EU12 countries in 1988 (Van derVoet et al., 1996), for Finland in 1995–1999 (Antikainen et al., 2005), andfor a Swedish city until 2000 (Neset et al., 2006). However, informationon the nutrient balances of food consumption and the food productionsystem of the Baltic Sea region is scarce, and the data in previous studiesare largely outdated: roughly from the late 1990s or the early 2000s.
To date, no previous studies have examined the Baltic Sea region as awhole or determined the nutrient balances due to trade and inputs offood, fodder and fertilizers. The objective of this study is to identifyand quantify the flows of nitrogen and phosphorus in internationaltrade in the Baltic Sea drainage area as related to food production andthe consumption system. More specifically, the aim is to assess therole of food, fodder, and fertilizers in fluxes of nitrogen and phosphorusin the Baltic Sea drainage area during years 2002–2005. Our results,however, cannot be used as such to representwhat ends up to the BalticSea, as much of the nutrients may be retained in e.g. soil and organicmatter or transformed within the terrestrial system. Therefore, the netbalance results are compared with the reported land-to-sea fluxes.
2. Material and methods
2.1. System definition
In this study, the trade and external inputs related to the food pro-duction and consumption system in the Baltic Sea drainage area wereanalyzed. The time period analyzed covered the years 2002–2005.Seven countries in the Baltic Sea drainage system were included:Denmark, Estonia, Finland, Latvia, Lithuania, Poland, and Sweden. Inall, these countries have 65 million inhabitants, which is app. 70% ofthe total population in the area (Eurostat, 2010). These countriesare almost entirely within the Baltic Sea drainage area. In addition,there are seven other countries that are partially within the water-shed: Belarus, Czech Republic, Germany, Norway, Russia, Slovakia,and Ukraine. We ignored these countries in this study, due to theirsmall proportion of the drainage area, or, in the case of Russia, dueto insufficient availability of data. For instance, Russia respondedwith 14% N and 28% P of the riverine, coastal, and direct point and dif-fuse source inputs of nutrients to the Baltic Sea in the seven countriesexamined during 2002–2005 (HELCOM, 2008). The contribution tonutrient loading from Germany in the Baltic Sea was much lowerthan in Russia. Furthermore, some countries that are included arenot entirely situated in the drainage area.
2.2. Nutrient balance calculation
The nutrient balance of nitrogen and phosphorus for each studycountry was calculated with the following formula:
B ¼ Io−Eo
where B is the balance of nitrogen/phosphorus in the study country, Iothe import of nitrogen/phosphorus from countries outside the BalticSea area, and Eo the export of nitrogen/phosphorus to countries out-side the Baltic Sea area. If BN0, then there is a surplus input of nitro-gen or phosphorus in the study country from outside the Baltic Seadrainage area.
In this study, we ignored trade within Baltic Sea countries, i.e. wedid not include imports from other Baltic Sea countries in the totalbudget. Inputs as imports and outputs as exports consist of food forhuman consumption, animal fodder, and fertilizers for agriculturalproduction. The use of noncommercial, unreported nutrient sources,such as manure and wastewater, were not considered in this study.Food items can be used either as ingredients for food production orbe readily consumed. Imported animal fodder is used in animal pro-duction, mostly in production of animals used for human consump-tion. Fertilizers are used in agricultural plant production, which is inturn directed to food or fodder consumption. These categories applyto both import and export for food and fodder, but only imports aretaken into account for fertilizers. Imports of food and fodder to theseven study countries from outside the area were regarded as importsto Baltic Sea drainage area. Regardless of the origin, fertilizers werecalculated as imports to the system, since atmospheric nitrogen androck phosphorus are outside the biological realm before manufactur-ing them into fertilizers (Smil, 2000; Galloway and Cowling, 2002).
The net balance results are compared with the land-to-sea fluxeswith data from HELCOM (2008). Shares of for different sectors foryear 2000 were available at HELCOM (2004).
2.3. Data sources and quantification methods
2.3.1. Trade dataTrade statistics of fertilizers, fodder, and food were obtained from
the Food and Agricultural Organization (FAO) of the United Nationsstatistical database (FAOSTAT, 2010). Since fertilizers were regardedas imports to the system, fertilizer consumption data were used forall countries. No fish trade statistics were available for all the coun-tries studied. However, we estimated the trade in fish based on thedata available for Finland in all these studied countries (Vihervuori,2003, 2004, 2005, 2006). All items traded were included; these arelisted in Appendix A.
2.3.2. Nutrient content dataThe nitrogen contents were calculated from the protein amount,
using a factor of 0.16 (Block and Bolling, 1946). The protein and phos-phorus contents of food and fodder were mainly obtained from theFinnish Food Composition Database (Fineli, 2009) maintained by theNational Institute forHealth andWelfare and are presented in AppendixA. The nitrogen and phosphorus content in fish are an average of theseven species that comprise over 90% of the annual catch in the BalticSea (ICES, 2009) and are presented in Appendix B. For food waste, themedian of the nitrogen and phosphorus content of all foodstuffs wasused. The nitrogen and phosphorus contents of fertilizerswere calculat-ed, based on the chemical properties of the fertilizers, are presented inAppendix C. Population data for the countries studied were obtainedfrom the statistical office of the European Union (Eurostat, 2010).
3. Results
Combining the food, fodder and fertilizers together, the total annualimports of nutrients related to the food production and consumptionsystem in the Baltic Sea drainage area averaged 2 100 000 tons N and340 000 tons P during 2002–2005 (Table 1). The export from the BalticSea drainage area was 220 000 tons N and 25 000 tons P. This resultedin a net surplus of nutrients: 1 800 000 tons N and 320 000 tons P.
When separating food and fodder, and fertilizers, the internationaltrade in food and fodder resulted in a net import of 180 000 tons N

4919E. Asmala et al. / Science of the Total Environment 409 (2011) 4917–4922
and 25 000 tons P, on average during 2002–2005. Import of fertilizersinto the system totaled 1 700 000 tons N and 290 000 tons P (Table 2).
Net imports of nitrogen and phosphorus in food, fodder and fer-tilizers per capita in the region studied averaged 28 tons N and5 tons P on average (Figs. 1 and 2). Nitrogen import varied fromLithuania's 10 kg per capita to Denmark's 67 kg per capita per year,and phosphorus from Latvia's 2 kg per capita to Estonia's 15 kg percapita per year.
The nitrogen to phosphorus (N:P) ratio of fertilizer consumptionvaries widely between countries, from Denmark's 16 to Lithuania's0.7 (Table 3). The average N:P ratio of fertilizer inputs is 5.7, whilefor food and fodder, the average N:P ratio of net imports is 7.5.
Wheat is the most important imported food item, totaling 13000 tons N and 1400 tons P. Wheat is also the most importantexported food item, with 42 000 tons and 4600 tons of nitrogenand phosphorus respectively. The 10 most important import and ex-port articles are presented in Tables 4 and 5. The food items aresorted by the total amount of nitrogen coming into or going out ofthe system.
The average riverine, coastal, and direct point and diffuse sourceload of nutrients to the Baltic Sea in the seven countries studied during2002–2005was 530 000 tons N and 23 000 tons P, annually. The partic-ular nutrient load due to the food consumption and production system(including wastewater, fish farming and agriculture, and managed for-estry) were estimated as 390 000 tons N and 18 000 tons P (calculatedbased on the year 2000 percentages for different sectors). In compari-son to the net inputs of N and P in food, fodder, and fertilizers in2002–2005 in the studied region, the percentage of the reported loadversus the respective hypothetical net inputs to the Baltic Sea food con-sumption and production system, was 21% for N and 6% for P.
4. Discussion
4.1. Significance of the results
Of all the imports, fertilizers account for an average of 80% and 85%of nitrogen and phosphorus. All individual countries' total imports ofboth nutrients are dominated by fertilizers (N50%), emphasizing the in-dustrial nature of modern food production systems. The net inputs offertilizers per capita varied from 34 kg N (Denmark and Finland) to7 kg N (Lithuania) and from 15 kg P (Estonia) to 2 kg P (Denmark, Lat-via and Sweden). The net input of nitrogen fertilizers varies widely on aglobal scale, from 7 kg ha–1 yr–1 N and 8 kg ha–1 yr–1 P in Kenya to588 kg ha–1 yr–1 N and 92 kg ha–1 yr–1 P in northern China (Vitouseket al., 2009).
Regarding food and fodder, the Baltic Sea drainage area is a netimporter of nutrients. About 2.8 kg N per capita and 0.4 kg P percapita were imported annually on average during 2002–2005. Netimports of nitrogen to the Baltic Sea drainage area were similar tothose of the European Union (EU12) countries in 1988, where the im-port of nitrogen in food and fodder was approximately 4.7 kg per
Table 1Annual average of total nitrogen and phosphorus in imports to the Baltic Sea drainage area
Food, fodder and fertilizers
Import Export
Nitrogen Phosphorus Nitrogen
Denmark 360 057 32 277 99 531Estonia 32 840 20 646 5096Finland 198 270 20 232 13 068Latvia 39 931 5807 6571Lithuania 36 244 39 893 16 298Poland 1 180 444 195 883 47 395Sweden 218 896 27 534 32 885Total 2 066 683 342 272 220 842
person, and the export of 2.1 kg per person (Van der Voet et al.,1996). The net imports per capita for Finland calculated in thisstudy, 5 kg yr–1 N and 0.5 kg yr–1 P in 2002–2005, differ slightlyfrom those of another Finnish study. The annual net imports of nutri-ents in food and fodder in 1995–1999 in Finland were estimated to behigher for nitrogen (about 3 kg N per capita), and lower for phospho-rus (0.1 kg P per capita) (Antikainen et al., 2005). In another compar-ison, the net import of nitrogen in food and fodder in the Netherlandswas 23 kg per person in 1995 (Olsthoorn and Fong, 1998).
There are significant differences in countries' nitrogen and phos-phorus balances per capita, influenced by the production and con-sumption structures. There is no uniform relationship betweentrade and domestic consumption of food in the Baltic Sea countries(FAOSTAT, 2010). Resource intensive meat consumption is fairlyhigh in Denmark, 110 kg per capita in 2005, while in other countriesit varied between 50 and 80 kg per capita. Denmark, Sweden, and Fin-land consumedmore than 90 kg fruits per capita, whereas the EasternEuropean countries all consumed less than 70 kg. However, the lattercountries consumed more vegetables per person. The average annualconsumption of cereals was 127 kg/person, with Denmark, Polandand Lithuania being the most intensive consumers (FAOSTAT, 2010).
Wheat is both the most imported and the most exported food itemto and from the countries in the Baltic Sea drainage area. Other cerealsare also significant food items in the import–export balance. Six out ofthe 10 most important imported and exported food items are commonto all the seven Baltic Sea countries (FAOSTAT, 2010) highlighting theinternational nature of modern food production and consumption sys-tems. Denmark has a heavy meat industry and most of the meat isexported. The flow of food toward the Baltic Sea drainage area is mainlydirected from central and Southern Europe. The most significant coun-try importing food to the Baltic Sea drainage area is Germany, followedby the Netherlands, Spain, and Italy (FAOSTAT, 2010). The appropria-tion of nitrogen and phosphorus resources caused by e.g. food produc-tion can be quantified with footprint approach (Galloway et al., 2008;Lott et al., 2009).
In comparison to the net inputs of food, fodder, and fertilizers in2002–2005 calculated in this study, the percentage output versusthe respective hypothetical inputs to the Baltic Sea was 21% N and6% P. The percentages of nutrients in the Baltic Sea compared withthe net inputs of food, fodder, and fertilizers are consistent with pre-vious estimates for nitrogen (26%) and somewhat smaller than thosefor phosphorus (11%) for Finland (Antikainen et al., 2005). The foodproduction system and related nutrient pathways, accumulation,and leakages are described in detail by Antikainen et al. (2005). InFinland in 1995–1999, an approximately 5-fold amount of nitrogenand 7-fold of phosphorus in fertilizers were applied to the soil com-pared with the amount of nutrients in the food and fodder processingindustry after accounting for the international trade in food and fod-der. In Denmark, the nutrient use efficiency, as total nutrient outputversus total nutrient input, was 37% for nitrogen and 52% for phos-phorus in 2003/2004 (Kyllingsbaek and Hansen, 2007).
2002–2005 (tons yr–1).
Net
Phosphorus Nitrogen Phosphorus
9142 260 527 23 135720 27 745 19 926
2253 185 202 17 979662 33 360 5145
1915 19 946 37 9776538 1 133 049 189 3453978 186 011 23 556
25 209 1 845 840 317 063
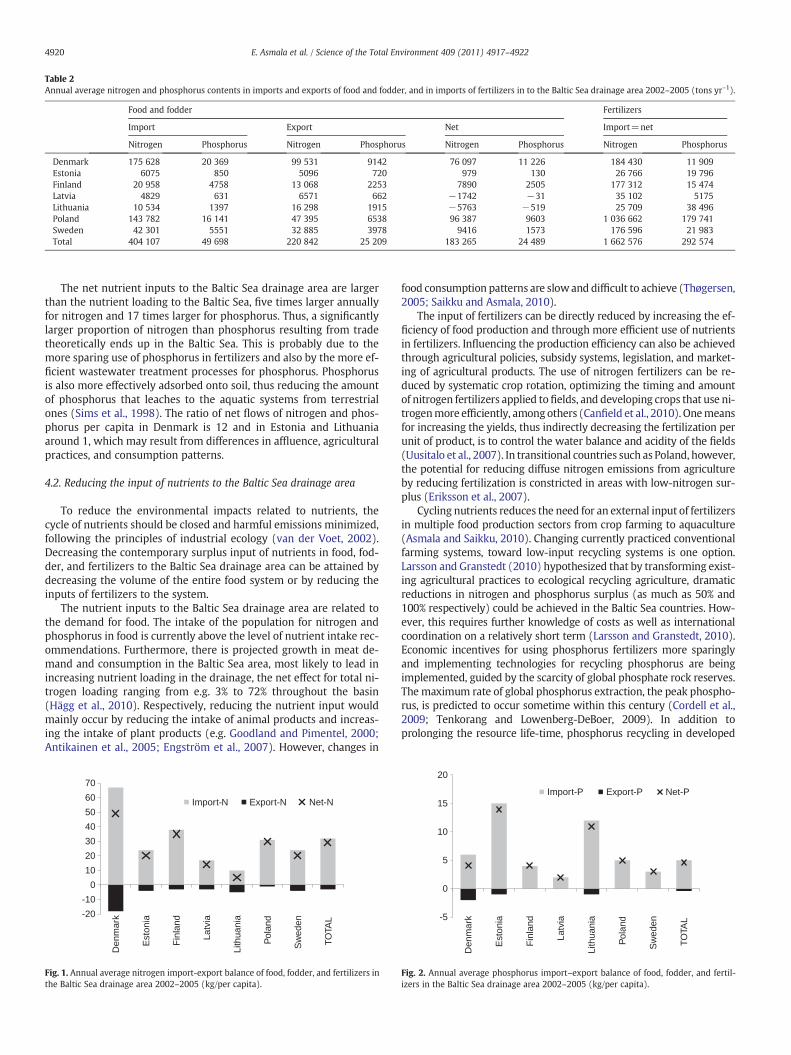
Table 2Annual average nitrogen and phosphorus contents in imports and exports of food and fodder, and in imports of fertilizers in to the Baltic Sea drainage area 2002–2005 (tons yr–1).
Food and fodder Fertilizers
Import Export Net Import=net
Nitrogen Phosphorus Nitrogen Phosphorus Nitrogen Phosphorus Nitrogen Phosphorus
Denmark 175 628 20 369 99 531 9142 76 097 11 226 184 430 11 909Estonia 6075 850 5096 720 979 130 26 766 19 796Finland 20 958 4758 13 068 2253 7890 2505 177 312 15 474Latvia 4829 631 6571 662 −1742 −31 35 102 5175Lithuania 10 534 1397 16 298 1915 −5763 −519 25 709 38 496Poland 143 782 16 141 47 395 6538 96 387 9603 1 036 662 179 741Sweden 42 301 5551 32 885 3978 9416 1573 176 596 21 983Total 404 107 49 698 220 842 25 209 183 265 24 489 1 662 576 292 574
4920 E. Asmala et al. / Science of the Total Environment 409 (2011) 4917–4922
The net nutrient inputs to the Baltic Sea drainage area are largerthan the nutrient loading to the Baltic Sea, five times larger annuallyfor nitrogen and 17 times larger for phosphorus. Thus, a significantlylarger proportion of nitrogen than phosphorus resulting from tradetheoretically ends up in the Baltic Sea. This is probably due to themore sparing use of phosphorus in fertilizers and also by the more ef-ficient wastewater treatment processes for phosphorus. Phosphorusis also more effectively adsorbed onto soil, thus reducing the amountof phosphorus that leaches to the aquatic systems from terrestrialones (Sims et al., 1998). The ratio of net flows of nitrogen and phos-phorus per capita in Denmark is 12 and in Estonia and Lithuaniaaround 1, which may result from differences in affluence, agriculturalpractices, and consumption patterns.
4.2. Reducing the input of nutrients to the Baltic Sea drainage area
To reduce the environmental impacts related to nutrients, thecycle of nutrients should be closed and harmful emissions minimized,following the principles of industrial ecology (van der Voet, 2002).Decreasing the contemporary surplus input of nutrients in food, fod-der, and fertilizers to the Baltic Sea drainage area can be attained bydecreasing the volume of the entire food system or by reducing theinputs of fertilizers to the system.
The nutrient inputs to the Baltic Sea drainage area are related tothe demand for food. The intake of the population for nitrogen andphosphorus in food is currently above the level of nutrient intake rec-ommendations. Furthermore, there is projected growth in meat de-mand and consumption in the Baltic Sea area, most likely to lead inincreasing nutrient loading in the drainage, the net effect for total ni-trogen loading ranging from e.g. 3% to 72% throughout the basin(Hägg et al., 2010). Respectively, reducing the nutrient input wouldmainly occur by reducing the intake of animal products and increas-ing the intake of plant products (e.g. Goodland and Pimentel, 2000;Antikainen et al., 2005; Engström et al., 2007). However, changes in
-20
-10
0
10
20
30
40
50
60
70
Den
mar
k
Est
onia
Fin
land
Latv
ia
Lith
uani
a
Pol
and
Sw
eden
TOTA
L
Import-N Export-N Net-N
Fig. 1. Annual average nitrogen import-export balance of food, fodder, and fertilizers inthe Baltic Sea drainage area 2002–2005 (kg/per capita).
food consumption patterns are slowand difficult to achieve (Thøgersen,2005; Saikku and Asmala, 2010).
The input of fertilizers can be directly reduced by increasing the ef-ficiency of food production and through more efficient use of nutrientsin fertilizers. Influencing the production efficiency can also be achievedthrough agricultural policies, subsidy systems, legislation, and market-ing of agricultural products. The use of nitrogen fertilizers can be re-duced by systematic crop rotation, optimizing the timing and amountof nitrogen fertilizers applied tofields, and developing crops that use ni-trogenmore efficiently, among others (Canfield et al., 2010). Onemeansfor increasing the yields, thus indirectly decreasing the fertilization perunit of product, is to control the water balance and acidity of the fields(Uusitalo et al., 2007). In transitional countries such as Poland, however,the potential for reducing diffuse nitrogen emissions from agricultureby reducing fertilization is constricted in areas with low-nitrogen sur-plus (Eriksson et al., 2007).
Cycling nutrients reduces the need for an external input of fertilizersin multiple food production sectors from crop farming to aquaculture(Asmala and Saikku, 2010). Changing currently practiced conventionalfarming systems, toward low-input recycling systems is one option.Larsson and Granstedt (2010) hypothesized that by transforming exist-ing agricultural practices to ecological recycling agriculture, dramaticreductions in nitrogen and phosphorus surplus (as much as 50% and100% respectively) could be achieved in the Baltic Sea countries. How-ever, this requires further knowledge of costs as well as internationalcoordination on a relatively short term (Larsson and Granstedt, 2010).Economic incentives for using phosphorus fertilizers more sparinglyand implementing technologies for recycling phosphorus are beingimplemented, guided by the scarcity of global phosphate rock reserves.The maximum rate of global phosphorus extraction, the peak phospho-rus, is predicted to occur sometime within this century (Cordell et al.,2009; Tenkorang and Lowenberg-DeBoer, 2009). In addition toprolonging the resource life-time, phosphorus recycling in developed
-5
0
5
10
15
20
Den
mar
k
Est
onia
Fin
land
Latv
ia
Lith
uani
a
Pol
and
Sw
eden
TOTA
L
Import-P Export-P Net-P
Fig. 2. Annual average phosphorus import–export balance of food, fodder, and fertil-izers in the Baltic Sea drainage area 2002–2005 (kg/per capita).
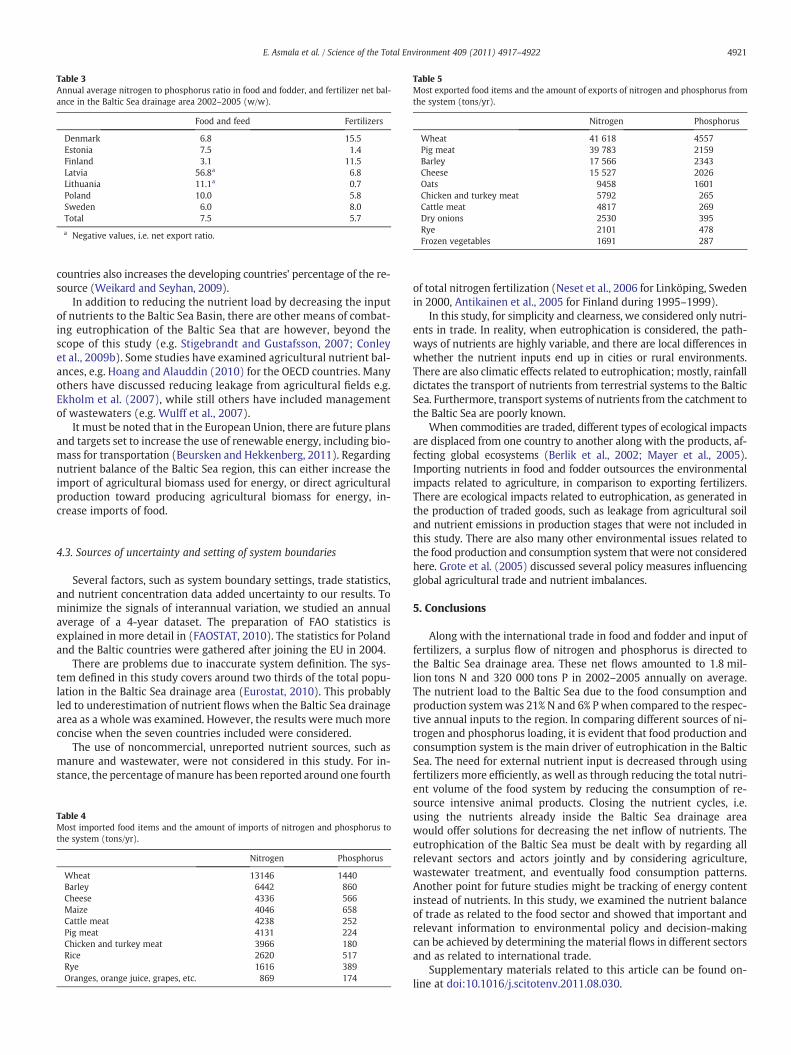
Table 3Annual average nitrogen to phosphorus ratio in food and fodder, and fertilizer net bal-ance in the Baltic Sea drainage area 2002–2005 (w/w).
Food and feed Fertilizers
Denmark 6.8 15.5Estonia 7.5 1.4Finland 3.1 11.5Latvia 56.8a 6.8Lithuania 11.1a 0.7Poland 10.0 5.8Sweden 6.0 8.0Total 7.5 5.7
a Negative values, i.e. net export ratio.
Table 5Most exported food items and the amount of exports of nitrogen and phosphorus fromthe system (tons/yr).
Nitrogen Phosphorus
Wheat 41 618 4557Pig meat 39 783 2159Barley 17 566 2343Cheese 15 527 2026Oats 9458 1601Chicken and turkey meat 5792 265Cattle meat 4817 269Dry onions 2530 395Rye 2101 478Frozen vegetables 1691 287
4921E. Asmala et al. / Science of the Total Environment 409 (2011) 4917–4922
countries also increases the developing countries' percentage of the re-source (Weikard and Seyhan, 2009).
In addition to reducing the nutrient load by decreasing the inputof nutrients to the Baltic Sea Basin, there are other means of combat-ing eutrophication of the Baltic Sea that are however, beyond thescope of this study (e.g. Stigebrandt and Gustafsson, 2007; Conleyet al., 2009b). Some studies have examined agricultural nutrient bal-ances, e.g. Hoang and Alauddin (2010) for the OECD countries. Manyothers have discussed reducing leakage from agricultural fields e.g.Ekholm et al. (2007), while still others have included managementof wastewaters (e.g. Wulff et al., 2007).
It must be noted that in the European Union, there are future plansand targets set to increase the use of renewable energy, including bio-mass for transportation (Beursken and Hekkenberg, 2011). Regardingnutrient balance of the Baltic Sea region, this can either increase theimport of agricultural biomass used for energy, or direct agriculturalproduction toward producing agricultural biomass for energy, in-crease imports of food.
4.3. Sources of uncertainty and setting of system boundaries
Several factors, such as system boundary settings, trade statistics,and nutrient concentration data added uncertainty to our results. Tominimize the signals of interannual variation, we studied an annualaverage of a 4-year dataset. The preparation of FAO statistics isexplained in more detail in (FAOSTAT, 2010). The statistics for Polandand the Baltic countries were gathered after joining the EU in 2004.
There are problems due to inaccurate system definition. The sys-tem defined in this study covers around two thirds of the total popu-lation in the Baltic Sea drainage area (Eurostat, 2010). This probablyled to underestimation of nutrient flows when the Baltic Sea drainagearea as a whole was examined. However, the results were much moreconcise when the seven countries included were considered.
The use of noncommercial, unreported nutrient sources, such asmanure and wastewater, were not considered in this study. For in-stance, the percentage ofmanure has been reported around one fourth
Table 4Most imported food items and the amount of imports of nitrogen and phosphorus tothe system (tons/yr).
Nitrogen Phosphorus
Wheat 13146 1440Barley 6442 860Cheese 4336 566Maize 4046 658Cattle meat 4238 252Pig meat 4131 224Chicken and turkey meat 3966 180Rice 2620 517Rye 1616 389Oranges, orange juice, grapes, etc. 869 174
of total nitrogen fertilization (Neset et al., 2006 for Linköping, Swedenin 2000, Antikainen et al., 2005 for Finland during 1995–1999).
In this study, for simplicity and clearness, we considered only nutri-ents in trade. In reality, when eutrophication is considered, the path-ways of nutrients are highly variable, and there are local differences inwhether the nutrient inputs end up in cities or rural environments.There are also climatic effects related to eutrophication; mostly, rainfalldictates the transport of nutrients from terrestrial systems to the BalticSea. Furthermore, transport systems of nutrients from the catchment tothe Baltic Sea are poorly known.
When commodities are traded, different types of ecological impactsare displaced from one country to another along with the products, af-fecting global ecosystems (Berlik et al., 2002; Mayer et al., 2005).Importing nutrients in food and fodder outsources the environmentalimpacts related to agriculture, in comparison to exporting fertilizers.There are ecological impacts related to eutrophication, as generated inthe production of traded goods, such as leakage from agricultural soiland nutrient emissions in production stages that were not included inthis study. There are also many other environmental issues related tothe food production and consumption system that were not consideredhere. Grote et al. (2005) discussed several policy measures influencingglobal agricultural trade and nutrient imbalances.
5. Conclusions
Along with the international trade in food and fodder and input offertilizers, a surplus flow of nitrogen and phosphorus is directed tothe Baltic Sea drainage area. These net flows amounted to 1.8 mil-lion tons N and 320 000 tons P in 2002–2005 annually on average.The nutrient load to the Baltic Sea due to the food consumption andproduction systemwas 21% N and 6% P when compared to the respec-tive annual inputs to the region. In comparing different sources of ni-trogen and phosphorus loading, it is evident that food production andconsumption system is the main driver of eutrophication in the BalticSea. The need for external nutrient input is decreased through usingfertilizers more efficiently, as well as through reducing the total nutri-ent volume of the food system by reducing the consumption of re-source intensive animal products. Closing the nutrient cycles, i.e.using the nutrients already inside the Baltic Sea drainage areawould offer solutions for decreasing the net inflow of nutrients. Theeutrophication of the Baltic Sea must be dealt with by regarding allrelevant sectors and actors jointly and by considering agriculture,wastewater treatment, and eventually food consumption patterns.Another point for future studies might be tracking of energy contentinstead of nutrients. In this study, we examined the nutrient balanceof trade as related to the food sector and showed that important andrelevant information to environmental policy and decision-makingcan be achieved by determining the material flows in different sectorsand as related to international trade.
Supplementary materials related to this article can be found on-line at doi:10.1016/j.scitotenv.2011.08.030.
4922 E. Asmala et al. / Science of the Total Environment 409 (2011) 4917–4922
Acknowledgments
This work was supported by Research Foundation of the Universi-ty of Helsinki and the Academy of Finland, grant 117822.
References
Antikainen R, Lemola R, Nousiainen J, Sokka L, Huhtanen P, Esala M, et al. Stocks andflows of nitrogen and phosphorus in the Finnish food production and consumptionsystem. Agric Ecosyst Environ 2005;107:287–305.
Asmala E, Saikku L. Closing a loop: substance flow analysis of nitrogen and phosphorusin the rainbow trout production and domestic consumption system in Finland.Ambio 2010;39:126–35.
Berlik MM, Kittridge DB, Foster DR. The illusion of preservation. A global environmentalargument for the local production of natural resources. J Biogeogr 2002;29:1557–68.
Beursken LWM, Hekkenberg M. Renewable energy projections as published in the na-tional renewable energy action plans of the European member states. Covering all27 EU member states. European Environmental Agency; 2011.
Block R, Bolling D. The amino acid composition of proteins and foods. Science 1946;103:431–2.
Canfield DE, Glazer AN, Falkowski PG. The evolution and future of earth's nitrogencycle. Science 2010;330:192–6.
Compton J, Mallinson D, Glenn CR, Filippelli GM, Follmi K, Shields G, et al. Variations inthe global phosphorus cycle. Soc Sediment Geol Spec Publ 2000;66:21–33.
Conley D, Paerl H, Howarth R, Boesch D, Seitzinger S, Havens K, et al. Controlling eutro-phication: nitrogen and phosphorus. Science 2009a;323:1014–5.
Conley DJ, Bonsdorff E, Carstensen J, Destouni G, Gustafsson BG, Hanson L-A, et al. Tack-ling hypoxia in the Baltic Sea: is engineering the solution? Environ Sci Technol2009b;43:3407–11.
Cordell D, Drangert J-O, White S. The story of phosphorus: global food security andfood for thought. Glob Environ Change 2009;19:292–305.
Ekholm P, Granlund K, Kauppila P, Mitikka S, Niemi J, Rankinen K, et al. Influence of EUpolicy on agricultural nutrient losses and the state of receiving surface waters inFinland. Agric Food Sci 2007;16:282–300.
Elmgren R. Understanding human impact on the Baltic ecosystem: changing views inrecent decades. Ambio 2001;30:222–31.
Elser JJ, Bracken MES, Cleland EE, Gruner DS, Harpole WS, Hillebrand H, et al. Globalanalysis of nitrogen and phosphorus limitation of primary producers in freshwater,marine and terrestrial ecosystems. Ecol Lett 2007;10:1135–42.
Engström R, Wadeskog A, Finnveden G. Environmental assessment of Swedish agricul-ture. Ecol Econ 2007;60:550–63.
Eriksson H, Pastuszak M, Löfgren S, Mörth CM, Humborg C. Nitrogen budgets of th thePolish agriculture 1960–2000: implications for riverine nitrogen loads to the BalticSea from transitional countries. Biogeochemistry 2007;85:153–68.
Eurostat. European commission's database. http://epp.eurostat.ec.europa.eu/portal/page/portal/statistics/search_database 2010. Accessed 10/2010.
FAO Statistics. FAO database. http://faostat.fao.org./ 2010. Accessed 10/2010.Filippelli G. The global phosphorus cycle: past, present and future. Elements 2008;4:89–95.Fineli. National Institute for Health and Welfare — Finnish food composition database.
http://www.fineli.fi/index.php?lang=en 2009. Accessed 11/2009.Galloway JN, Cowling EB. Reactive nitrogen and the world: 200 years of change. Ambio
2002;31:64–71.Galloway JN, Dentener FJ, Capone DG, Boyer EW, Howarth RW, Seitzinger SP, et al. Ni-
trogen cycles: past, present, and future. Biogeochemistry 2004;70:153–226.Galloway JN, Townsend AR, Erisman JW, Bekunda M, Cai Z, Freney JR, et al. Transforma-
tion of the nitrogen cycle: recent trends, questions and potential solutions. Science2008;320:889–92.
Goodland R, Pimentel D. Environmental sustainability and integrity in the agriculturesector. In: Pimentel D, Westra L, Reed FN, editors. Ecological integrity: integratingenvironment, conservation, and health. Washington, DC: Island Press; 2000.p. 121–37.
Granstedt A. Increasing the efficiency of plant nutrient recycling within the agriculturalsystem as a way of reducing the load to the environment — experience from Swe-den and Finland. Agric Ecosyst Environ 2000;80:1-17.
Grote U, Craswell E, Vlek P. Nutrient flows in international trade: ecology and policy is-sues. Environ Sci Policy 2005;8:439–51.
Gunnars A, Blomqvist S. Phosphate exchange across the sediment–water interfacewhen shifting from anoxic to oxic conditions — an experimental comparison offreshwater and brackish–marine systems. Biogeochemistry 1997;37:203–26.
HELCOM. The fourth Baltic Sea pollution load compilation (PLC–4) Balt. Sea environ.proc. no. 93; 2004.
HELCOM. Waterborne loads of nitrogens and phosphorus to the Baltic Sea in 2006.HELCOM indicator fact sheets 2008; 2008.
HELCOM. Eutrophication in the Baltic Sea. An integrated thematic assessment of the ef-fects of nutrient enrichment in the Baltic Sea region. Baltic Sea Environment Pub-lications; 2009.
Hoang VN, Alauddin M. Assessing the eco-environmental performance of agriculturalproduction in OECD countries: the use of nitrogen flows and balance. Nutr CyclAgroecosyst 2010;87:353–68.
Howarth R, Marino R. Nitrogen as the limiting nutrient for eutrophication in coastalmarine ecosystems: evolving views over three decades. Limnol Oceanogr2006;51:364–76.
Hägg HE, Humborg C, Mörth CM, Medina MR, Wulff F. Scenario analysis on protein con-sumption and climate change effects on Riverine N export to the Baltic Sea. Envi-ron Sci Technol 2010;44:2379–85.
ICES. ICES Advice 2009: 8.4.8 Sprat in subdivisions 22–32. http://www.ices.dk/com-mitte/acom/comwork/report/2009/2009/spr–2232.pdf 2009. Accessed 11/2009.
Larsson M, Granstedt A. Sustainable governance of the agriculture and the Baltic Sea —
agricultural reforms, food production and curbed eutrophication. Ecol Econ2010;69:1943–51.
Kyllingsbaek A, Hansen JF. Development in nutrient balances in Danish agriculture1980–2004. Nutr Cycl Agroecosyst 2007;79:267–80.
Leppäranta M, Myrberg K. Physical oceanography of the Baltic Sea. Heidelberg, Germa-ny: Springer–Verlag; 2009.
Lott JNA, Bojarski M, Kolasa J, Batten GD, Campbell L. A review of the phosphorus con-tent of dry cereal and legume crops of the world. Int J Agr Resour Govern Ecol2009;8:351–70.
Mayer AL, Kauppi PE, Angelstam PK, Zhang Y, Tikka PM. Importing timber, exportingecological impact. Science 2005;308:359–60.
Neset TSS, Bader HP, Scheidegger R. Food consumption and nutrient flows: nitrogen inSweden since the 1870s. J Ind Ecol 2006;10:61–75.
Olsthoorn CSM, Fong NPK. The anthropogenic nitrogen cycle in the Netherlands. NutrCycl Agroecosyst 1998;52:269–76.
Paerl H. Controlling eutrophication along the freshwater–marine continuum: dual nu-trient (N and P) reductions are essential. Estuar Coasts 2009;32:593–601.
Rönnberg C, Bonsdorff E. Baltic Sea eutrophication: area-specific ecological conse-quences. Hydrobiologia 2004;514:227–41.
Saikku L, Asmala E. Eutrophication in the Baltic Sea: the role of fish consumption andinternational trade. J Ind Ecol 2010;14:482–95.
Sims JT, Simard RR, Joern BC. Nonpoint pollution of surface waters with phosphorusand nitrogen. Ecol Appl 1998;8:559–68.
Smil V. Phosphorus in the environment: natural flows and human interferences. AnnuRev Energy Environ 2000;25:53–88.
Stigebrandt A, Gustafsson BG. Improvement of Baltic proper water quality using large-scale ecological engineering. Ambio 2007;36:280–6.
Tamminen T, Andersen T. Seasonal phytoplankton nutrient limitation patterns asrevealed by bioassays over Baltic Sea gradients of salinity and eutrophication.Mar Ecol Prog Ser 2007;340:121–38.
Thøgersen J. Howmay consumer policy empower consumers for sustainable lifestyles?J Cons Pol 2005;28:143–78.
Tuominen L, Heinanen A, Kuparinen J, Nielsen LP. Spatial and temporal variability ofdenitrification in the sediments of the northern Baltic Proper. Mar Ecol Prog Ser1998;172:13–24.
Uusitalo R, Ekholm P, Turtola E, Pitkänen H, Lehtonen H, Granlund K, et al. MaatalousItämeren rehevöittäjänä. Maa– ja elintarviketalous, 96. Finland: MTT Jokioinen;2007.
Van der Voet E. SFA methodology, chapter 9. In: Ayres RU, Ayres L, editors. Handbookof industrial ecology. Cheltenham: Edward Elgar Publishers; 2002.
Van der Voet E, Kleijn R, de Haes HA Udo. Nitrogen pollution in the European Union—origins and proposed solutions. Environ Conserv 1996;23:120–32.
Weikard HP, Seyhan D. Distribution of phosphorus resources between rich and poorcountries: the effect of recycling. Ecol Econ 2009;68:1749–55.
Vihervuori A. Foreign trade in fish 2002. SVT Maa–, metsä– ja kalatalous, 56. ; 2003.Vihervuori A. Foreign trade in fish 2003. SVT Maa–, metsä– ja kalatalous; 2004.Vihervuori A. Foreign trade in fish 2004. SVT Maa–, metsä– ja kalatalous, 58. ; 2005.Vihervuori A. Foreign trade in fish 2005. SVT Maa–, metsä– ja kalatalous; 2006.Vitousek PM, Aber JD, Howarth RW, Likens GE, Matson PA, Schindler DW, et al. 2003. The
Global Phosphorus Cycle In: Treatise on Geochemistry, Volume 8. Editor: William H.Schlesinger. Executive Editors: Heinrich D. Holland and Karl K. Turekian. pp. 682.ISBN 0–08–043751–6. Elsevier, 2003;585–643
Vitousek PM, Naylor R, Crews T, David MB, Drinkwater LE, Holland E, et al. Nutrient im-balances in agricultural development. Science 2009;324:1519–20.
Wulff F, Savchuk OP, Sokolov A, Humborg C, Mörth CM. Management options and ef-fects on a marine ecosystem: assessing the future of the Baltic. Ambio 2007;36:243–9.