Embed Size (px)
Citation preview

Importing our Web data and Answering Descriptive Questions about Single
Variables
Psych 437

Data
• To access the data from your group’s questionnaire, visit the following link, but replace “group1.txt” in this example with the filename you used for your survey.
– http://www.yourpersonality.net/psych437/fall2011/data/group1.txt
• Thus, if your group used the filename “group6.htm” then the link for your data will be:
– http://www.yourpersonality.net/psych437/fall2011/data/group6.txt

Things to note regarding your data
• Comma delimited text file.• Each person’s responses to your questionnaire
will be saved as a separate row

• Each distinct piece of information for a person will be separated by commas

• The first three pieces of information will always be the same:
– The filename (e.g., group3)– The date the data were submitted to the web server (e.g.,
9/10/2011)– The time the data were submitted (not necessarily CST).
• Moreover, the last piece of information will always be the same
– endline

• After those three pieces of information, all other information submitted by the user will be listed in alphanumeric order of the variable NAMEs used in your code.
• Alphanumeric is an ordering system in which each term is sorted, starting with the left-most character, in order where nothing < 0-9 < A-Z < a-z

• Example– 0 000 0001 000A 000a 001 1 10 11 2 3 4 5 6 7 8 9 V1 v0 v01
v010
• One reason why I tend to use variable NAMEs such as v01, v02, … v10 instead of v1, v2, … v10 is that the alphanumeric sorting of the first example is v01, v02, … v10 whereas the sorting of the second example would be v1, v10, v2.

pin (alias)
v02
v03v04
v05
v06
v07v08
v09
v010
v011

Downloading/saving the data to your computer
Be sure to select “Text Document” for the “Save as type” option

Importing the data into Excel
File > Open
Looking for a text file (*.txt)

Choose the delimited option

Comma delimited. Nothing else.


Different kinds of research questions
• In the next few weeks, we’ll begin to talk about some of the ways that research can be designed in order to answer both basic and applied research questions.
• Some of the key questions we’ll have to ask ourselves throughout this process are: (a) does this question involve one variable or more than one variable and (b) does the question concern the causal nature of the relationship between two or more variables?

Different kinds of research questions
Descriptive
Univariate Multivariate
CausalDescriptive

Different kinds of research questions
• Univariate: questions pertaining to a single variable– How long are people married, on average, before they
have children?– How many adults were sexually abused as children?
• Descriptive research is used to provide a systematic description of a psychological phenomenon.

Different kinds of research questions
• Multivariate: questions pertaining to the relationship between two or more variables– How does marital satisfaction vary as a function of the
length of time that a couple waits before having children?
– Are people who were sexually abused as children more likely to be anxious, depressed, or insecure as adults?

Different kinds of research questions
• Notice that in each of these cases there is no assumption that one variable necessarily causes the other.
• In contrast, causal research focuses on how variables influence one another– Does psychotherapy help to improve peoples’ well-
being?– Does drinking coffee while studying increase test
performance?

Different kinds of research questions
Descriptive
Univariate Multivariate
CausalDescriptive

Univariate Descriptive Research
• The objective of univariate descriptive research is to describe a single psychological variable.

Univariate Descriptive Research
• Before we can describe the variable, we need to know whether it is categorical or continuous.
• This will impact the way we go about describing the variable.
• If the variable is categorical, all we need to do to answer the question is see what proportion of people fall into the various categories.
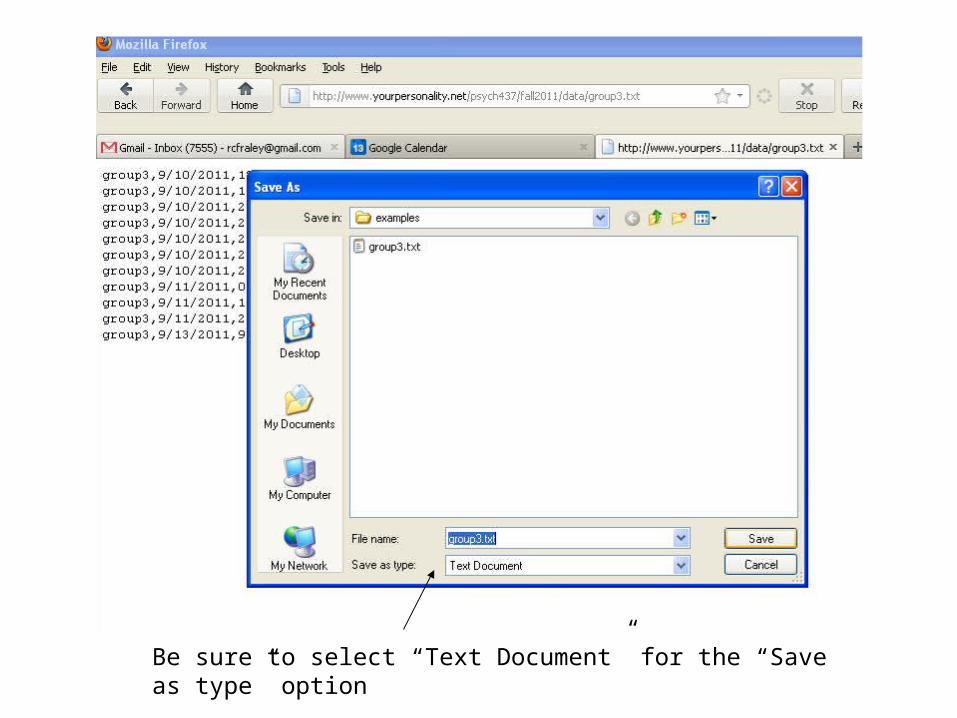
Categorical Variable
• Example research question: What is the gender of students enrolled as psychology majors at UIUC?
• We can obtain a random sample of psychology majors at UIUC.
• Measure the sex of participants (a simple self-report question should suffice)
• See what proportion of people are male vs. female.

Person Sex
1 M
2 M
3 F
4 F
5 F
6 F
7 M
8 F
9 F
Males: 3
Females: 6
Total: 9
------------------------------
Males: 33% [3/9]
Females: 66% [6/9]

Continuous Variable
• When the variable is continuous it doesn’t make sense to use “proportions” to answer the research question.
• Example: How stressed is an average psychology student at UIUC?
• To answer this question, we need to describe the distribution of scores.

Example
How stressed have you been in the last 2 ½ weeks? Scale: 0 (not at all) to 10 (as stressed as possible)
4 7 7 7 8 8 7 8 9 4 7 3 6 9 10 5 7 10 6 87 8 7 8 7 4 5 10 10 0 9 8 3 7 9 7 9 5 8 50 4 6 6 7 5 3 2 8 5 10 9 10 6 4 8 8 8 4 87 3 7 8 8 8 7 9 7 5 6 3 4 8 7 5 7 3 3 65 7 5 7 8 8 7 10 5 4 3 7 6 3 9 7 8 5 7 99 3 1 8 6 6 4 8 5 10 4 8 10 5 5 4 9 4 7 77 6 6 4 4 4 9 7 10 4 7 5 10 7 9 2 7 5 9 103 7 2 5 9 8 10 10 6 8 3
How can we summarize this information effectively?

Frequency Tables
• A frequency table shows how often each value of the variable occurs
Stress rating Frequency
10 14 9 15 8 26 7 31 6 13 5 18 4 16 3 12 2 31 10 2

Frequency Polygon
• A visual representation of information contained in a frequency table
• Align all possible values on the bottom of the graph (the x-axis)
• On the vertical line (the y-axis), place a point denoting the frequency of scores for each value
• Connect the lines• (Typically add an extra value
above and below the actual range of values—in this example, at –1 and 11—and mark that with a 0.)

Measures of Central Tendency
• Central tendency: most “typical” or common score(a) Mode(b) Median(c) Mean

Measures of Central Tendency
1. Mode: most frequently occurring score
Mode = 7
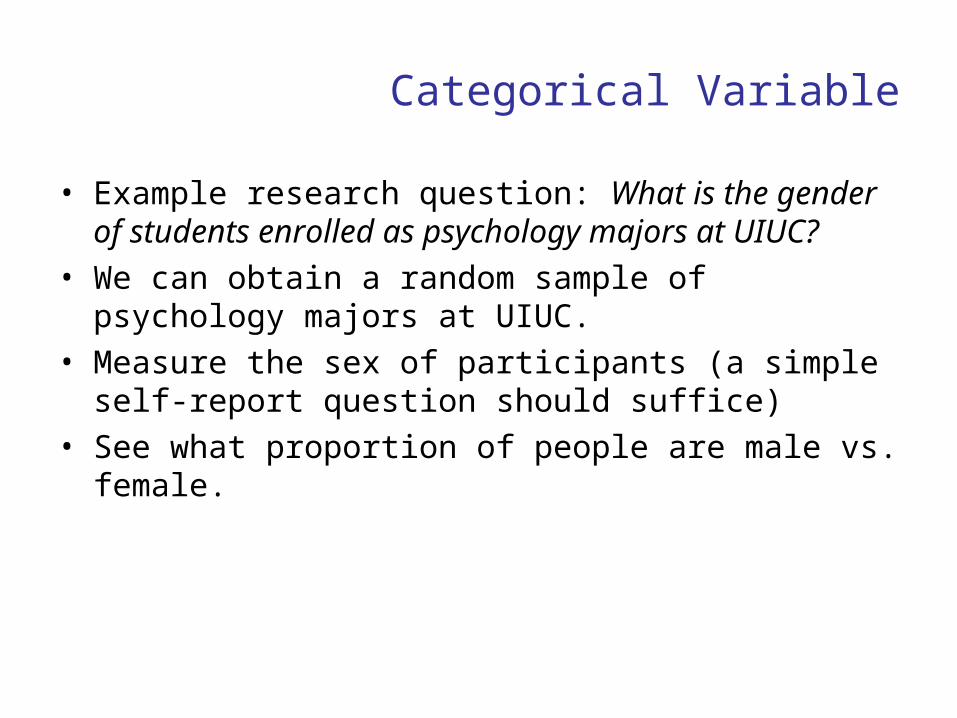
Measures of Central Tendency
2. Median: the value at which 1/2 of the ordered scores fall above and 1/2 of the scores fall below
1 2 3 4 5 1 2 3 4
Median = 3 Median = 2.5

Measures of Central Tendency
x = an individual score
N = the number of scores
Sigma or = take the sum
• Note: Equivalent to saying “sum all the scores and divide that sum by the total number of scores”
xN
MX1__
3. Mean: The “balancing point” of a set of scores; the average

Measures of Central Tendency
Mean = (1+2+2+3+3+3+3+4+4+5)/10 = 3

Mean
• In the stress example, the sum of all the scores is 975.
• 975 / 157 = 6.2• Thus, the average score is
6.2, on a 0 to 10 scale.
Spread
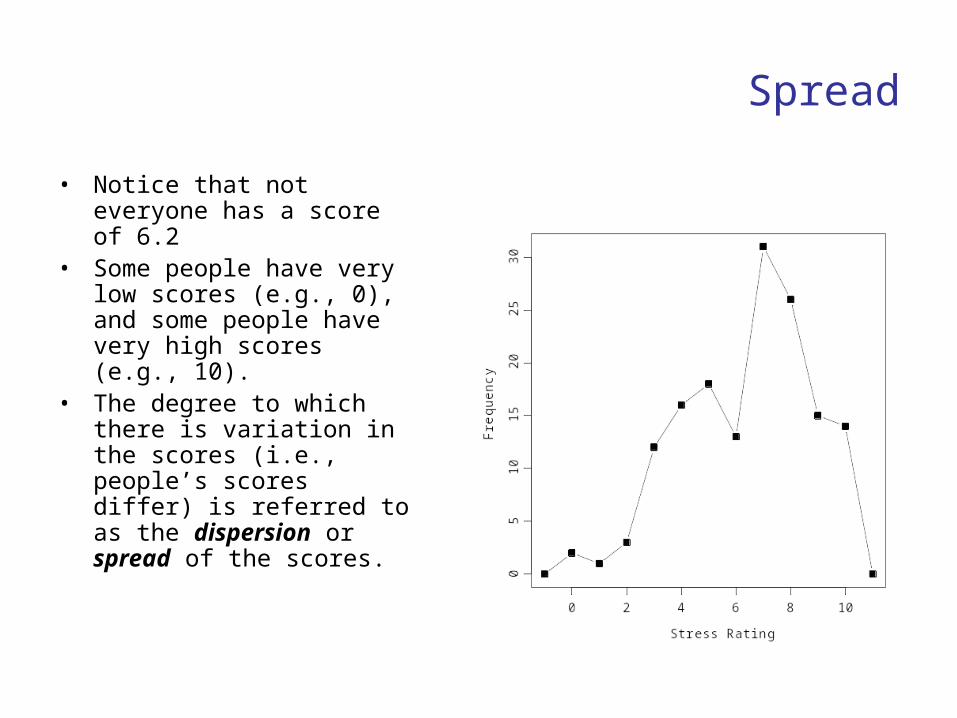
• Notice that not everyone has a score of 6.2
• Some people have very low scores (e.g., 0), and some people have very high scores (e.g., 10).
• The degree to which there is variation in the scores (i.e., people’s scores differ) is referred to as the dispersion or spread of the scores.

Measures of Spread
• To illustrate the way differences in spread may look, consider this graph.
• Two sets of scores with the same mean, but different spreads.

Standard Deviation
• The most common way of quantifying dispersion is with an index called the standard deviation.
• The SD is an average, and can be interpreted as the average amount of dispersion around the mean. Larger SD = more dispersion.
21 MxN
SD

Recipe for Computing the Standard Deviation
• First, find the mean of the scores. Let’s call this M.
• Second, subtract each score from the mean. Let’s call this a “mean deviation” score, which we compute for each person.
• Third, square each of these mean deviation scores.
• Fourth, average these squared deviations.• Fifth, take the square root of this average.

Person Score or x (x – M) (x – M)2
Homer 1 (1 – 4) = -3 -32 = 9
Maggie 2 (2 – 4) = -2 -22 = 4
Lisa 2 (2 – 4) = -2 -22 = 4
Bart 4 (4 – 4) = 0 02 = 0
Marge 8 (8 – 4) = 4 42 = 16
Santa 7 (7 – 4) = 3 32 = 9
24 x
4
N
xM
422 Mx
7
2
N
Mx
64.27 SD

How to Verbally Summarize this Information
• In this example, we see that the average stress score is 4, on a scale ranging from 1 to 8.
• Not everyone has a score of 4, however. On average, people are 2.64 units away from the mean.

Summary
• Most descriptive questions concerning one variable can be answered pretty easily.
• If the variable is categorical,– determine the proportion of people in each category or
level of the variable
• If the variable is continuous,– find the mean and standard deviation of the scores.