Embed Size (px)
Citation preview
Improving the photostability of bright monomericorange and red fluorescent proteinsNathan C Shaner1,5, Michael Z Lin1,2, Michael R McKeown1,2, Paul A Steinbach1,2, Kristin L Hazelwood4,Michael W Davidson4 & Roger Y Tsien1–3
All organic fluorophores undergo irreversible photobleachingduring prolonged illumination. Although fluorescent proteinstypically bleach at a substantially slower rate than manysmall-molecule dyes, in many cases the lack of sufficientphotostability remains an important limiting factor forexperiments requiring large numbers of images of single cells.Screening methods focusing solely on brightness or wavelengthare highly effective in optimizing both properties, but theabsence of selective pressure for photostability in such screensleads to unpredictable photobleaching behavior in the resultingfluorescent proteins. Here we describe an assay for screeninglibraries of fluorescent proteins for enhanced photostability.With this assay, we developed highly photostable variants ofmOrange (a wavelength-shifted monomeric derivative of DsRedfrom Discosoma sp.) and TagRFP (a monomeric derivative ofeqFP578 from Entacmaea quadricolor) that maintain most of thebeneficial qualities of the original proteins and perform asreliably as Aequorea victoria GFP derivatives in fusion constructs.
Substantial progress has recently been made in developing mono-meric or dimeric fluorescent proteins covering the visual spec-trum1–13, but although brightness and wavelength have beenprimary concerns, photostability has generally been an after-thought (with the notable exception of mTFP1; ref. 12). Conse-quently, many new fluorescent protein variants have relatively poorphotostability. The first-generation monomeric red fluorescentprotein, mRFP1 (ref. 1), although reasonably bright, was lessphotostable than its ancestor,Discosoma sp. DsRed14. In subsequentgenerations of mRFP1 variants (the ‘mFruits’), we observed seren-dipitous enhancement in photostability in some variants2, leadingus to believe that it would be possible to apply directed evolutionstrategies to this property as well.To extend the utility of fluorescent proteins, having optimized
them for many other properties, we developed a screening methodthat additionally assays photostability in a medium-throughputformat during directed evolution. Using a high-intensity lightsource, we photobleached entire 10-cm plates of bacteria expressingthe fluorescent proteins of interest and selected those that main-
tained the most brightness. This approach allowed us to screenlibraries containing up to 100,000 clones reliably with no observedfalse-positive hits and to select simultaneously for the mostphotostable mutants that also maintained an acceptable level offluorescence emission at the desired wavelength, minimizing thetradeoff of desirable properties that frequently results from single-parameter screens. We applied our photostability screening assay tothe directed evolution of variants derived from the bright redmonomeric red fluorescent protein TagRFP and the fast-bleachingmonomeric orange fluorescent protein mOrange. The resultingvariants, TagRFP-TandmOrange2, were ninefold and 25-foldmorephotostable than their respective ancestors, and both made excel-lent fusion partners when expressed in mammalian cells.
RESULTSPhotostability assay and rationaleTo photobleach large numbers of bacterial colonies, we used a solarsimulator, which produces a collimated beam approximately 10 cmin diameter with light intensities of 95 or 141 mW/cm2 with525–555 (540/30) or 548–588 (568/40) nm bandpass filters, respec-tively. This intensity, although approximately 100-fold lower thanthat produced by unattenuated arc lamp illumination and 105-foldlower than instantaneous intensities during confocal laser illumi-nation, was sufficient to photobleach the photolabile fluorescentprotein mOrange to 50% initial intensity after approximately10 min. This reasonably short time allowed us to quickly screenbacterial libraries of up to 100,000 clones on plates. We minimizedthe heating of plates by placing them on a custom-built water-cooled aluminum block. At wavelengths necessary to photobleachorange and red fluorescent proteins, we found no substantialdecrease in bacterial viability after 2 h of illumination.
Evolution of a brighter photostable red monomerTo create a better red monomer, we initially undertook a rationaldesign approach, drawing on analysis of mCherry’s enhancedphotostability and mOrange’s higher quantum yield relative tomRFP1. Six generations of directed evolution with constantphotostability selection yielded the variant ‘mApple’, which, though
RECEIVED 21 NOVEMBER 2007; ACCEPTED 1 APRIL 2008; PUBLISHED ONLINE 4 MAY 2008; DOI:10.1038/NMETH.1209
1Department of Pharmacology, 2Howard Hughes Medical Institute and 3Department of Chemistry and Biochemistry, University of California at San Diego, 9500 GilmanDrive, La Jolla, California 92093, USA. 4National High Magnetic Field Laboratory and Department of Biological Science, The Florida State University, 1800 East PaulDirac Drive, Tallahassee, Florida 32310, USA. 5Present address: The Salk Institute for Biological Studies, 10010 N. Torrey Pines Rd., La Jolla, California 92037, USA.Correspondence should be addressed to R.Y.T. ([email protected]).
NATURE METHODS | VOL.5 NO.6 | JUNE 2008 | 545
ARTICLES©
2008
Nat
ure
Publ
ishi
ng G
roup
http
://w
ww
.nat
ure.
com
/nat
uremethods
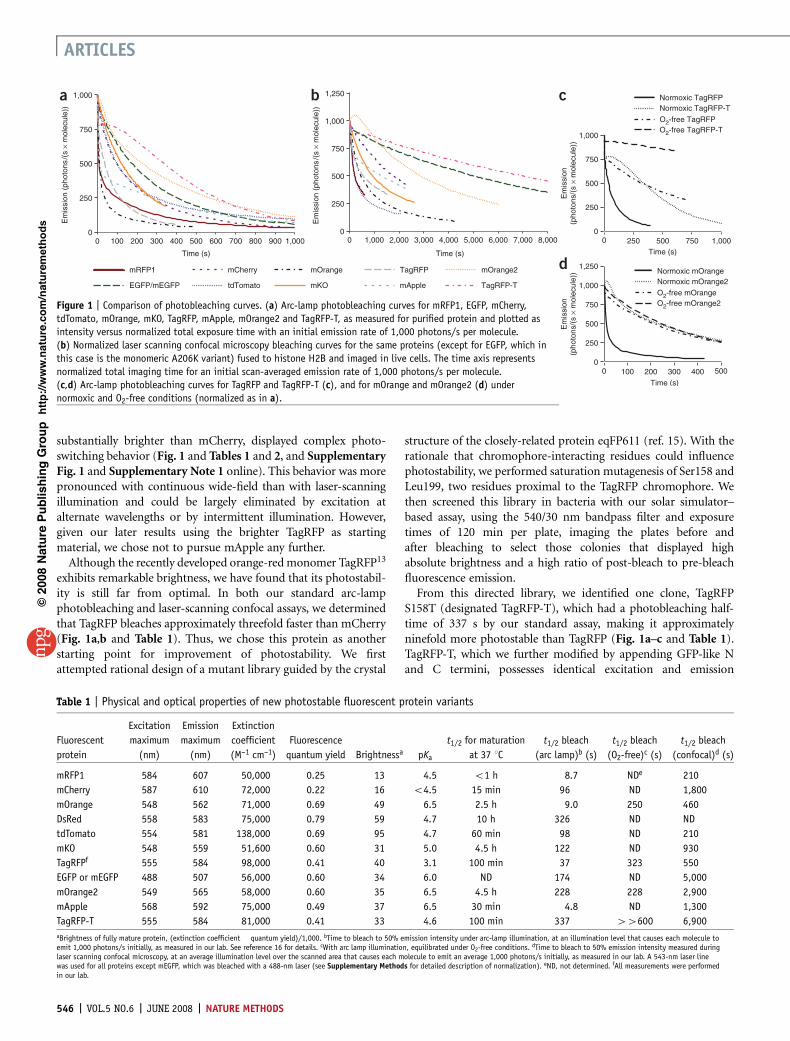
substantially brighter than mCherry, displayed complex photo-switching behavior (Fig. 1 and Tables 1 and 2, and SupplementaryFig. 1 and Supplementary Note 1 online). This behavior was morepronounced with continuous wide-field than with laser-scanningillumination and could be largely eliminated by excitation atalternate wavelengths or by intermittent illumination. However,given our later results using the brighter TagRFP as startingmaterial, we chose not to pursue mApple any further.Although the recently developed orange-redmonomer TagRFP13
exhibits remarkable brightness, we have found that its photostabil-ity is still far from optimal. In both our standard arc-lampphotobleaching and laser-scanning confocal assays, we determinedthat TagRFP bleaches approximately threefold faster than mCherry(Fig. 1a,b and Table 1). Thus, we chose this protein as anotherstarting point for improvement of photostability. We firstattempted rational design of a mutant library guided by the crystal
structure of the closely-related protein eqFP611 (ref. 15). With therationale that chromophore-interacting residues could influencephotostability, we performed saturation mutagenesis of Ser158 andLeu199, two residues proximal to the TagRFP chromophore. Wethen screened this library in bacteria with our solar simulator–based assay, using the 540/30 nm bandpass filter and exposuretimes of 120 min per plate, imaging the plates before andafter bleaching to select those colonies that displayed highabsolute brightness and a high ratio of post-bleach to pre-bleachfluorescence emission.From this directed library, we identified one clone, TagRFP
S158T (designated TagRFP-T), which had a photobleaching half-time of 337 s by our standard assay, making it approximatelyninefold more photostable than TagRFP (Fig. 1a–c and Table 1).TagRFP-T, which we further modified by appending GFP-like Nand C termini, possesses identical excitation and emission
0
250
500
750
1,000
1,250
0 100 200 300 400 500
Em
issi
on(p
hoto
ns/(
s !
mol
ecul
e))
Time (s)
0
250
500
750
1,000
0 250 500 750 1,000
Em
issi
on(p
hoto
ns/(
s !
mol
ecul
e))
Time (s)
0
250
500
750
1,000
0 100 200 300 400 500 600 700 800 900 1,000
Em
issi
on (
phot
ons/
(s !
mol
ecul
e))
Time (s)
-
mRFP1 Normoxic mOrange
EGFP/mEGFP
mCherry
tdTomato
mOrange
mKO
TagRFP
mApple
mOrange2
TagRFP-T
O2-free mOrange2
Normoxic mOrange2O2-free mOrange
Normoxic TagRFP
O2-free TagRFP-T
Normoxic TagRFP-TO2-free TagRFP
0
250
500
750
1,000
1,250
0 1,000 2,000 3,000 4,000 5,000 6,000 7,000 8,000
Em
issi
on (
phot
ons
/(s
! m
olec
ule)
)
Time (s)
a b c
d
Figure 1 | Comparison of photobleaching curves. (a) Arc-lamp photobleaching curves for mRFP1, EGFP, mCherry,tdTomato, mOrange, mKO, TagRFP, mApple, mOrange2 and TagRFP-T, as measured for purified protein and plotted asintensity versus normalized total exposure time with an initial emission rate of 1,000 photons/s per molecule.(b) Normalized laser scanning confocal microscopy bleaching curves for the same proteins (except for EGFP, which inthis case is the monomeric A206K variant) fused to histone H2B and imaged in live cells. The time axis representsnormalized total imaging time for an initial scan-averaged emission rate of 1,000 photons/s per molecule.(c,d) Arc-lamp photobleaching curves for TagRFP and TagRFP-T (c), and for mOrange and mOrange2 (d) undernormoxic and O2-free conditions (normalized as in a).
Table 1 | Physical and optical properties of new photostable fluorescent protein variants
Fluorescent
protein
Excitation
maximum
(nm)
Emission
maximum
(nm)
Extinction
coefficient
(M–1 cm–1)
Fluorescence
quantum yield Brightnessa pKa
t1/2 for maturation
at 37 1Ct1/2 bleach
(arc lamp)b (s)
t1/2 bleach
(O2-free)c (s)
t1/2 bleach
(confocal)d (s)
mRFP1 584 607 50,000 0.25 13 4.5 o1 h 8.7 NDe 210
mCherry 587 610 72,000 0.22 16 o4.5 15 min 96 ND 1,800
mOrange 548 562 71,000 0.69 49 6.5 2.5 h 9.0 250 460
DsRed 558 583 75,000 0.79 59 4.7 10 h 326 ND ND
tdTomato 554 581 138,000 0.69 95 4.7 60 min 98 ND 210
mKO 548 559 51,600 0.60 31 5.0 4.5 h 122 ND 930
TagRFPf 555 584 98,000 0.41 40 3.1 100 min 37 323 550
EGFP or mEGFP 488 507 56,000 0.60 34 6.0 ND 174 ND 5,000
mOrange2 549 565 58,000 0.60 35 6.5 4.5 h 228 228 2,900
mApple 568 592 75,000 0.49 37 6.5 30 min 4.8 ND 1,300
TagRFP-T 555 584 81,000 0.41 33 4.6 100 min 337 44600 6,900aBrightness of fully mature protein, (extinction coefficient ! quantum yield)/1,000. bTime to bleach to 50% emission intensity under arc-lamp illumination, at an illumination level that causes each molecule toemit 1,000 photons/s initially, as measured in our lab. See reference 16 for details. cWith arc lamp illumination, equilibrated under O2-free conditions.
dTime to bleach to 50% emission intensity measured duringlaser scanning confocal microscopy, at an average illumination level over the scanned area that causes each molecule to emit an average 1,000 photons/s initially, as measured in our lab. A 543-nm laser linewas used for all proteins except mEGFP, which was bleached with a 488-nm laser (see Supplementary Methods for detailed description of normalization). eND, not determined. fAll measurements were performedin our lab.
546 | VOL.5 NO.6 | JUNE 2008 | NATURE METHODS
ARTICLES©
2008
Nat
ure
Publ
ishi
ng G
roup
http
://w
ww
.nat
ure.
com
/nat
uremethods

wavelengths, quantum yield and maturation time to TagRFP, withonly a slightly lower extinction coefficient (81,000 versus98,000 M–1 cm–1) and a higher fluorescence pKa, the pH valueat which the fluorescent protein exhibits half-maximalfluorescence emission (4.6 versus 3.1). We expect that the benefitof increased photostability should offset the small decrease inbrightness and increase in acid sensitivity in most applications.Additionally, TagRFP-T matures to apparent completion andhas virtually no emission in the green region of the spectrum(Supplementary Fig. 1), making it suitable for co-imagingwith green fluorescent proteins. We verified that TagRFP-Tremainsmonomeric by gel filtration (data not shown). Because theS158T mutation is in the interior of the folded protein, weanticipated that TagRFP-T would perform nearly identically toTagRFP when used as a fusion tag. Indeed, live-cell imagingconfirmed that TagRFP-T does not interfere with localization ofany fusions tested (Fig. 2).Photobleaching of TagRFP and TagRFP-T under oxygen-free
conditions revealed that TagRFP-T’s photobleaching remainsoxygen-sensitive (Fig. 1c and Table 1). However, the oxygen-freebleaching half-time for TagRFP is similar to the ambient oxygen
bleaching half-time for TagRFP-T. We next compared TagRFP andTagRFP-Tas fusions to histone H2B expressed in living cells underconfocal illumination (Fig. 1b and Table 1). TagRFP-T had aphotobleaching half-time approximately ninefold greater thanthat of TagRFP, consistent with the results obtained for purifiedproteins under continuous wide-field illumination.
Evolution of a photostable orange monomerWe next attempted to engineer a photostable variant of mOrange,which is the brightest of the previously engineered mRFP1 variantsbut exhibits relatively fast bleaching. Because substitutions atposition 163 improved photostability during the evolution ofmCherry and mApple, we initially tested the M163Q mutant ofmOrange, but found that improved photostability was accompa-nied by undesirable decreases in quantum yield and maturationefficiency. The M163K mutant of mOrange exhibited enhancedphotostability and matured very efficiently, but suffered fromincreased acid sensitivity (pKa of B7.5). Because another orangefluorescent protein, mKO (derived from Fungia concinna)6, is bothhighly photostable16 and possesses a methionine at the positionequivalent to 163, we reasoned that other pathways must exist forincreasing photostability.To explore alternative photostability-enhancement evolution
pathways, we used iterative random and directed mutagenesisand selection using the solar simulator. Initially we screened arandomlymutagenized library ofmOrange by photobleaching with540/30 nm light for 15–20 min per plate (a time sufficient to bleachmOrange to B25% of its initial brightness) and selecting thebrightest post-bleach clones by eye. This screen identified a single
a b c d
e f g h
i j k l
m n o p
Figure 2 | Fluorescence imaging of TagRFP-Tsubcellular targeting fusions. (a–g) N-terminalfusion constructs (linker amino acid lengthindicated by the numbers): TagRFP-T–N1(a; N-terminal fusion cloning vector; expressionin nucleus and cytoplasm with no specificlocalization); TagRFP-T–7–cytochrome c oxidase(b; mitochondria human cytochrome c oxidasesubunit VIII); TagRFP-T–6–histone H2B(c; human; showing two interphase nuclei and onenucleus in early anaphase); TagRFP-T–7–b-1,4-galactosyltransferase (d; golgi; N-terminal81 amino acids of human b-1,4-galactosyltransferase); TagRFP-T–7-vimentin(e; human); TagRFP-T–7-Cx43 (f; rat a-1connexin-43); and TagRFP-T–7-zyxin (g; human).(h–p) C-terminal fusion constructs (linker aminoacid length indicated by the numbers): annexin(A4)–12–TagRFP-T (h; human; illustrated withionomycin-induced translocation to the plasmaand nuclear membranes); lamin B1–10–TagRFP-T(i; human); vinculin-23–TagRFP-T (j; human);clathrin light chain–15–TagRFP-T (k; human);b-actin–7–TagRFP-T (l; human); PTS1-2–TagRFP-T(m; peroximal targeting signal 1); RhoB-15–TagRFP-T (n; human RhoB GTPase with an N-terminal c-Myc epitope tag; endosome targeting);farnesyl-5–TagRFP-T (o; 20-amino-acidfarnesylation signal from c-Ha-Ras); andb-tubulin–6–TagRFP-T (p; human). All TagRFP-Tfusion vectors were expressed in HeLa (CCL-2)cells. Scale bars, 10 mm.
Table 2 | Mutations of new photostable fluorescent protein variants
Protein Mutations
mApple mOrange R17H,G40A,T66M,A71V,V73I,K92R,V104I,V105I,T106H,
T108N,E117V,S147E,G159S,M163K,T174A,S175A,G196D,T202V
mOrange2 mOrange Q64H,F99Y,E160K,G196D
TagRFP-T TagRFP S158T
NATURE METHODS | VOL.5 NO.6 | JUNE 2008 | 547
ARTICLES©
2008
Nat
ure
Publ
ishi
ng G
roup
http
://w
ww
.nat
ure.
com
/nat
uremethods

clone, mOrange F99Y, which had approximately twofoldimproved photostability (data not shown). Saturation mutagenesisof residue 99—and residues 97 and 163, which we imagined couldhave synergistic interactions with residue 99—did not yieldadditional improvements.We then constructed a randomly mutagenized library of mOr-
ange F99Yand screened with a longer illumination time of 40 minper plate. This round of screening identified an additional muta-tion, Q64H, which conferred about a tenfold increase in photo-stability over the mOrange F99Y single mutant. Again, saturationmutagenesis of residues 64 and 99 along with neighboring residues97 and 163 did not produce clones that were improved over theoriginal clone identified in the random screen. Additionally,we found that the Q64H mutation alone did not confer substan-tially enhanced photostability but required the presence of theF99Y mutation (data not shown). Two additional rounds ofdirected evolution with continued selection for photostability(540/30 nm filter, 40 min per plate) improved the folding efficiencywith mutations E160K and G196D, giving the final clone,mOrange2 (Table 2).The highly desirable increase in photostability achieved in
mOrange2 is balanced by a modest decrease in quantum yield(0.60 versus 0.69) and extinction coefficient (58,000 versus 72,000M–1 cm–1), together corresponding to a30% decrease in brightness compared tomOrange. It also exhibits slightly shiftedexcitation and emission peaks (549 nmand 565 nm) and an increased maturation
half-time (4.5 h versus 2.5 h; Table 1). However, its photostabilityunder arc-lamp illumination is over 25-fold greater than that ofmOrange (Fig. 1d), making it nearly twice as photostable asmKO6, the previously most photostable known orange mono-mer16, approximately sixfold more photostable than TagRFP13
and about 1.3-fold more photostable than enhanced GFP(EGFP)16 (Fig. 1 and Table 2). During laser-scanning confocalimaging, mOrange2 was approximately sixfold more photostablethan mOrange and threefold more photostable than mKO(Fig. 1b). Notably, the brightness and maturation time of mOr-ange2 are quite similar to those for mKO. mOrange2 remainsacid-sensitive with a pKa of 6.5, making it undesirable for targetingto acidic compartments, but attractive as a possible marker forexocytosis or other pH-variable processes17. Also, because itcontains a small fraction of immature (but nonfluorescent) chro-mophore (Supplementary Fig. 1), mOrange2 may not be anideal FRETacceptor. As with TagRFP-T, we verified that mOrange2remained monomeric using gel filtration (data not shown).We then investigated the role of the key photostability-enhancingmutations present in mOrange2, tested it in a wide rangeof fusion constructs, and compared its performance withthat of mKO and tdTomato (Fig. 3 and SupplementaryNote 2 online).
a b c d
e f g h
i j k l
m n o p
q r s t u
Figure 3 | Widefield fluorescence imaging ofmOrange2 subcellular targeting fusions. (a–h) N-terminal fusion constructs (linker amino acidlength indicated by the numbers): mOrange2-17-keratin (a; human cytokeratin 18); mOrange2-7-Cx26 (b; rat b-2 connexin-26); mOrange2-7–b-1,4-galactosyltransferase (c; golgi; N-terminal81 amino acids of human b-1,4-galactosyltransferase); mOrange2-7-vimentin(d; human); mOrange2-7-EB3 (e; humanmicrotubule-associated protein; RP/EB family);mOrange2-7–cytochrome c oxidase(f; mitochondria; human cytochrome c oxidasesubunit VIII); mOrange2-22-paxillin (g; chicken);and mOrange2-19–a-actinin (h; human non-muscle). (i–p) C-terminal fusion constructs (linkeramino acid length indicated by the numbers):lamin B1–10-mOrange2 (i; human); b-actin–7-mOrange2 (j; human); glycoprotein 1–20-mOrange2 (k; rat lysosomal membraneglycoprotein 1); peroxisomal targeting signal 1–2-mOrange2 (l); b-tubulin–6-mOrange2 (m; human);fibrillarin-7-mOrange2 (n; human); vinculin-23-mOrange2 (o; human); and clathrin light chain-15-mOrange2 (p; human). (q–u) Laser scanningconfocal images of HeLa cells expressing histoneH2B–6-mOrange2 (N-terminal fusion; human)progressing through interphase (q), prophase (r),prometaphase (s), metaphase (t) and earlyanaphase (u). The cell line used for expressingmOrange2 fusion vectors was Gray fox lungfibroblast cells (FoLu) in e and j, and humancervical adenocarcinoma cells (HeLa) in theremaining panels. Scale bars, 10 mm.
548 | VOL.5 NO.6 | JUNE 2008 | NATURE METHODS
ARTICLES©
2008
Nat
ure
Publ
ishi
ng G
roup
http
://w
ww
.nat
ure.
com
/nat
uremethods

Evaluation of reversible photoswitchingBecause of concerns that our screening method might select forphotoswitching behavior, we tested our selected variants as well asother commonly used fluorescent proteins using both widefieldand confocal imaging. Nearly all had some degree of reversiblephotoswitching, which we observed as a recovery of up to 100% ofpre-bleach fluorescence intensity when the fluorescent protein wasbleached to B50% of its initial intensity and then observed againafter 1–2 min without illumination. In fact, several commonly usedA. victoria GFP variants including EGFP, Cerulean and Venus,displayed reversible photoswitching18 more severe than thatobserved for the variants we identified. A summary table of theresults of these experiments along with representative traces forTagRFP, TagRFP-T, EGFP and Cerulean are available in Supple-mentary Note 3 online. These results suggest that our screen is notselecting specifically for photoswitching, which is no worse inthe new proteins (except for mApple) than in well-establishedfluorescent proteins.Although our observation of reversible photoswitching in such a
broad range of fluorescent proteins certainly raises concerns aboutthe potential for previously undetected experimental artifacts, it isbeyond the scope of this study to determine how common or severethis phenomenon may be. Of particular concern is the implicationthat fluorescence recovery after photobleaching experiments maybe prone to artifacts that would confound data interpretation. Weperformed a limited evaluation of this possibility using histoneH2B fusions to EGFP and EYFP expressed in mammalian cells andimaged on a laser-scanning confocal microscope. When webleached these proteins to near completion with full laserpower and then observed for recovery, we observed a negligibleamount of reversible photoswitching (data not shown). How-ever, an in-depth investigation is warranted to rule out such aneffect in other fluorescent proteins and under more variedexperimental conditions.
DISCUSSIONAlthough the precise kinetics of photobleaching for a givenfluorescent protein are strongly dependent on illumination inten-sity and temporal regimen, we found that improvements inphotostability at B0.1 W/cm2 usually qualitatively predictimproved performance under typical conditions for wide-fieldand laser scanning microscopy. The exceptions were mApple’sreversible photoswitching (Supplementary Note 1) and tdToma-to’s poor performance under laser scanning confocal illumination(Fig. 1b). Also, our screen used bacteria to express fluorescentprotein libraries, but all proteins produced from these studiesbehaved similarly when later tested in purified form or expressedin mammalian cells, consistent with our previous experience.Fluorescent proteins had been photobleached using an array of
LEDs during the evolution of mTFP1 to select against unacceptablephotolability or photoswitching, resulting in a protein with ableaching half-time 110 s12. We applied photostability as a primarycriterion to improve multiple fluorescent proteins, and our resultsdemonstrate that high photostability is a selectable phenotype.Moreover, a solar simulator takes advantage of the strong mercurylines at 546, 577 and 579 nm and allows greater flexibility in thechoice of excitation wavelength than would be possible with LEDs.Although it is difficult to draw strong conclusions about exact
mechanisms of photobleaching from the mutations that confer
photostability to mOrange2, specific regions proximal to thechromophore appear to influence the modes of photobleachingthe protein is able to undergo. DsRed, when illuminated by a532-nm pulsed laser, undergoes decarboxylation of Glu215, as wellas cis-to-trans isomerization of the chromophore19. Such chromo-phore isomerization has been implicated in the photoswitchingbehavior of Kindling fluorescent protein (KFP)20,21 and Dronpa5,22
as well as predecessors to mTFP1 (refs. 12 and 23). Decarboxylationof the corresponding glutamate (position 222) in A. victoria GFPalso leads to changes in optical properties24–26. However, ourobservation that oxidation is important in mOrange, TagRFP andTagRFP-T photobleaching suggests that chromophore isomeriza-tion and Glu215 decarboxylation may have only a minor role forsuch proteins under normoxic conditions. Additionally, we foundno evidence by mass spectrometry that photobleaching using thesolar simulator led to any detectable decarboxylation of Glu215 inmOrange (data not shown). Under some conditions mOrange2shows an initial photoactivation of about 5% (Fig. 1a,d) beforebleaching takes over. At present we have no molecular explanationfor this effect or the reversible photoswitching that is common tomost fluorescent proteins (Supplementary Note 3).For mRFP1 variants, we observed the importance of residue 163
in influencing photostability (Supplementary Note 1) but alsoobserved somewhat context-specific effects of residue 163 andsurrounding residues on different wavelength-shifted variants.This region, composed of residues 64, 97, 99 and 163, appears tobe important in determining photostability. However, of these, onlyresidue 163 is in direct contact with the chromophore. It may bethat the mutations Q64H and F99Y together lead to a rearrange-ment of the other side chains in the vicinity of the chromophore soas to hinder a critical oxidation that leads to loss of fluorescence.Discrepancies in tubulin and connexin localization (Supplemen-
tary Note 2) when fused to mOrange2 versus mKO or tdTomatocan probably be attributed to the three-dimensional structure of thefluorescent protein and potential steric hindrance in the fusions.mOrange2 contains extended N and C termini derived from EGFPto improve performance in fusions, whereas the much shorterprotein, mKO (218 versus 236 amino acids), may experience stericinterferences that lead to poorer performance in similar fusions.The fused dimeric character of tdTomato effectively doubles its sizecompared to the monomeric orange fluorescent proteins, so sterichindrance is the most likely culprit in preventing tubulin localiza-tion. For most fusions, however, we observed little or no differencein performance between mOrange2 and mKO, suggesting thatmany proteins are more tolerant of fusion partners than tubulinor connexins.Though it already possessed reasonably good photostability,
TagRFP was still amenable to improvements by our photostabilityselection method. From a saturation-mutagenesis library of twochromophore-proximal residues (consisting of 400 independentclones), we selected a single clone with substantially enhancedphotostability. The selectedmutant, TagRFP-T, should prove to be avery useful addition to the fluorescent protein arsenal, as it is themost photostable monomeric fluorescent protein of any color yetdescribed under both arc-lamp and confocal laser illumination.As the applications of genetically encoded fluorescent markers
continue to diversify and become more complex, the demand forgreater photostability than is now available in fluorescent proteinshas likewise continued to grow. We expect our screening method to
NATURE METHODS | VOL.5 NO.6 | JUNE 2008 | 549
ARTICLES©
2008
Nat
ure
Publ
ishi
ng G
roup
http
://w
ww
.nat
ure.
com
/nat
uremethods

be applicable to any of the existing fluorescent proteins and,with modifications, to be useful in selecting for more efficientphotoconvertible and photoswitchable fluorescent proteins aswell3,5,10,20,27–31. Possible enhancements to this selection techniquecould include time-lapse imaging of bacterial plates duringbleaching to enable direct selection for kinetics (independent ofabsolute brightness) and the use of higher-intensity illumi-nation from other light sources (such as lasers) duringscreening to select for or against nonlinear photobleachingbehavior. Ideally, a selection scheme that allows true simu-lation of microscopic imaging light intensities while maintaininga medium-to-high throughput should allow selection offluorescent proteins with the most beneficial properties forimaging applications.
METHODSMutagenesis. As the initial templates for library construction byrandom mutagenesis we used cDNA encoding mOrange2 andTagRFP (Evrogen)13, both of which had been previously humancodon–optimized. We performed error-prone PCR using theGeneMorph II kit (Stratagene) following the manufacturer’s pro-tocol, using primers containing BamHI and EcoRI sites formOrange variants or BamHI and BsrGI sites for TagRFP variants.We digested products of error-prone PCR products with appro-priate restriction enzymes and ligated the fragments into amodified pBAD vector (Invitrogen) or a constitutive bacterialexpression vector pNCS, both of which encode an N-terminal6His tag and linker identical to that found in pRSET B (Invitro-gen). We performed site-directed mutagenesis using the Quik-Change II kit (Stratagene) following the manufacturer’s protocolor by overlap-extension PCR. Sequences for all primers used inthis study are available in Supplementary Methods online.We transformed chemically competent or electrocompetentEscherichia coli strain LMG194 (Invitrogen) cells with librariesand grew them overnight at 37 1C on LB-agar supplemented with50 mg/ml ampicillin (Sigma) and 0.02% (wt/vol) L-arabinose(Fluka) (for pBAD-based libraries).
Library screening. For each round of random mutagenesis, wescreened 20,000–100,000 colonies (10–50 plates of bacteria), anumber sufficient to sample all possible single-site mutants and alimited number of double mutants. For each round of site-directedmutagenesis, we screened approximately threefold more coloniesthan the expected library diversity (for example, 1,200 colonies fora 400-member library) to ensure full coverage. We photobleachedwhole plates of bacteria for 10–120 min (determined empiricallyfor each round of directed evolution) on a Spectra-Physics92191–1000 solar simulator with a 1,600 W mercury arc lampequipped with two Spectra-Physics SP66239-3767 dichroic mir-rors to remove infrared and ultraviolet wavelengths. Remaininglight was filtered through 10-cm square bandpass filters (ChromaTechnology Corp.) appropriate to the fluorescent protein beingbleached (540/30 nm (B540/30; 525–555 nm) for mOrange- andTagRFP-based libraries or 568/40 nm (B568/40; 548–588 nm) formApple libraries). We measured final light intensities produced bythe solar simulator by a miniature integrating-sphere detector(SPD024 head and ILC1700 meter, International Light Corp.) tobe 95 mW/cm2 for the 540/30 filter and 141 mW/cm2 for the568/40 filter. We maintained the temperature of the bacterial plates
at 20 1C during solar simulator bleaching using a home-builtwater-cooled aluminum block. For mOrange mutant selection, weexamined the plates by eye as previously described32 using a150 W xenon lamp equipped with a 540/30 nm excitation filterand fiber optic light guides to illuminate the plates and 575 nmlong pass filter to visualize emission. For TagRFP mutant selection,we imaged the plates before and after bleaching on an imagingsystem (UVP) using 535/45 nm (512.5–557.5 nm) excitation and605/70 nm (570–640 nm) emission filters. In either case, we grewcolonies that maintained bright fluorescence after photobleachingand/or those with high post- to pre-bleach fluorescence ratios for8 h in 2 ml of LB medium supplemented with 100 mg/mlampicillin and then increased the culture volume to 4 ml withadditional LB supplemented with ampicillin and 0.2% (wt/vol)L-arabinose to induce fluorescent protein expression and grew thecultures overnight. We extracted protein from a fraction of eachcell pellet with B-PER II (Pierce) and obtained spectra using aSafire 96-well plate reader with monochromators (Tecan). Whenscreening for photostable variants, we obtained spectra before andafter photobleaching extracted protein on the solar simulator. Weextracted plasmid DNA from the remaining cell pellet with a mini-prep kit (Qiagen) and used it for sequencing.
Protein production and characterization. We expressed fluores-cent proteins from pBAD vectors in E. coli strain LMG194,purified them on Ni-NTA agarose (Qiagen) and characterizedthem as described2. Photobleaching measurements were per-formed on aqueous droplets of purified protein under oil asdescribed2,16. To determine whether the presence of molecularoxygen influenced bleaching, we performed our standard bleach-ing experiment before and after equilibrating the entire bleachingapparatus under humidified N2.
Additional methods. Primer list, descriptions of mass spectro-metry analysis, mammalian expression vectors, live-cell imagingand laser scanning confocal microscopy live-cell photobleachingare available in Supplementary Methods.
Accession numbers. GenBank: DQ336159 (mOrange2),DQ336160 (mApple) and EU582019 (TagRFP-T).
Note: Supplementary information is available on the Nature Methods website.
ACKNOWLEDGMENTSL.A. Gross performed mass spectroscopy. S.R. Adams performed gel filtrationexperiments. We thank R.E. Campbell and C.T. Dooley for helpful discussion.Sequencing services were provided by the University of California, San DiegoCancer Center shared sequencing resource and the Florida State UniversityBioanalytical and Molecular Cloning DNA Sequencing Laboratory. N.C.S. was aHoward Hughes Medical Institute predoctoral fellow during this work. This workwas additionally supported by the US National Institutes of Health (NS27177 andGM72033) and the Howard Hughes Medical Institute.
AUTHOR CONTRIBUTIONSN.C.S. designed the photostability selection protocol, performed all directedevolution and physical characterization of mApple and mOrange2, analyzed andorganized all data collected by other authors, and prepared the manuscript;M.Z.L. and M.R.M. performed directed evolution and physical characterizationof TagRFP-T; P.A.S. designed the home-built components of the solar simulatorapparatus and performed photobleaching measurements of purified proteins;K.L.H. and M.W.D. constructed mammalian expression vectors and performedall microscopy experiments involving live cells; R.Y.T. contributed to conceptualdevelopment, data analysis and manuscript preparation; all authors contributed toediting the manuscript.
550 | VOL.5 NO.6 | JUNE 2008 | NATURE METHODS
ARTICLES©
2008
Nat
ure
Publ
ishi
ng G
roup
http
://w
ww
.nat
ure.
com
/nat
uremethods
COMPETING INTERESTS STATEMENTThe authors declare competing financial interests: details accompany the full-textHTML version of the paper at http://www.nature.com/naturemethods/.
Published online at http://www.nature.com/naturemethods/Reprints and permissions information is available online athttp://npg.nature.com/reprintsandpermissions
1. Campbell, R.E. et al. A monomeric red fluorescent protein. Proc. Natl. Acad. Sci.USA 99, 7877–7882 (2002).
2. Shaner, N.C. et al. Improved monomeric red, orange and yellow fluorescentproteins derived from Discosoma sp. red fluorescent protein. Nat. Biotechnol. 22,1567–1572 (2004).
3. Chudakov, D.M. et al. Photoswitchable cyan fluorescent protein for proteintracking. Nat. Biotechnol. 22, 1435–1439 (2004).
4. Griesbeck, O., Baird, G.S., Campbell, R.E., Zacharias, D.A. & Tsien, R.Y. Reducingthe environmental sensitivity of yellow fluorescent protein. Mechanism andapplications. J. Biol. Chem. 276, 29188–29194 (2001).
5. Habuchi, S. et al. Reversible single-molecule photoswitching in the GFP-likefluorescent protein Dronpa. Proc. Natl. Acad. Sci. USA 102, 9511–9516 (2005).
6. Karasawa, S., Araki, T., Nagai, T., Mizuno, H. & Miyawaki, A. Cyan-emitting andorange-emitting fluorescent proteins as a donor/acceptor pair for fluorescenceresonance energy transfer. Biochem. J. 381, 307–312 (2004).
7. Nagai, T. et al. A variant of yellow fluorescent protein with fast and efficientmaturation for cell-biological applications. Nat. Biotechnol. 20, 87–90 (2002).
8. Nguyen, A.W. & Daugherty, P.S. Evolutionary optimization of fluorescent proteinsfor intracellular FRET. Nat. Biotechnol. 23, 355–360 (2005).
9. Rizzo, M.A., Springer, G.H., Granada, B. & Piston, D.W. An improved cyanfluorescent protein variant useful for FRET. Nat. Biotechnol. 22, 445–449 (2004).
10. Wiedenmann, J. et al. EosFP, a fluorescent marker protein with UV-induciblegreen-to-red fluorescence conversion. Proc. Natl. Acad. Sci. USA 101,15905–15910 (2004).
11. Zapata-Hommer, O. & Griesbeck, O. Efficiently folding and circularly permutedvariants of the Sapphire mutant of GFP. BMC Biotechnol. 3, 5 (2003).
12. Ai, H.W., Henderson, J.N., Remington, S.J. & Campbell, R.E. Directed evolution ofa monomeric, bright and photostable version of Clavularia cyan fluorescentprotein: structural characterization and applications in fluorescence imaging.Biochem. J. 400, 531–540 (2006).
13. Merzlyak, E.M. et al. Bright monomeric red fluorescent protein with an extendedfluorescence lifetime. Nat. Methods 4, 555–557 (2007).
14. Matz, M.V. et al. Fluorescent proteins from nonbioluminescent Anthozoa species.Nat. Biotechnol. 17, 969–973 (1999).
15. Petersen, J. et al. The 2.0-A crystal structure of eqFP611, a far red fluorescentprotein from the sea anemone Entacmaea quadricolor. J. Biol. Chem. 278,44626–44631 (2003).
16. Shaner, N.C., Steinbach, P.A. & Tsien, R.Y. A guide to choosing fluorescentproteins. Nat. Methods 2, 905–909 (2005).
17. Miesenbock, G., De Angelis, D.A. & Rothman, J.E. Visualizing secretion andsynaptic transmission with pH-sensitive green fluorescent proteins. Nature 394,192–195 (1998).
18. Sinnecker, D., Voigt, P., Hellwig, N. & Schaefer, M. Reversible photobleaching ofenhanced green fluorescent proteins. Biochemistry 44, 7085–7094 (2005).
19. Habuchi, S. et al. Evidence for the isomerization and decarboxylation in thephotoconversion of the red fluorescent protein DsRed. J. Am. Chem. Soc. 127,8977–8984 (2005).
20. Chudakov, D.M., Feofanov, A.V., Mudrik, N.N., Lukyanov, S. & Lukyanov, K.A.Chromophore environment provides clue to ‘‘kindling fluorescent protein’’ riddle.J. Biol. Chem. 278, 7215–7219 (2003).
21. Andresen, M. et al. Structure and mechanism of the reversible photoswitch of afluorescent protein. Proc. Natl. Acad. Sci. USA 102, 13070–13074 (2005).
22. Andresen, M. et al. Structural basis for reversible photoswitching in Dronpa. Proc.Natl. Acad. Sci. USA 104, 13005–13009 (2007).
23. Henderson, J.N., Ai, H.W., Campbell, R.E. & Remington, S.J. Structural basis forreversible photobleaching of a green fluorescent protein homologue. Proc. Natl.Acad. Sci. USA 104, 6672–6677 (2007).
24. van Thor, J.J., Gensch, T., Hellingwerf, K.J. & Johnson, L.N. Phototransformationof green fluorescent protein with UV and visible light leads to decarboxylation ofglutamate 222. Nat. Struct. Biol. 9, 37–41 (2002).
25. Bell, A.F., Stoner-Ma, D., Wachter, R.M. & Tonge, P.J. Light-driven decarboxylationof wild-type green fluorescent protein. J. Am. Chem. Soc. 125, 6919–6926(2003).
26. van Thor, J.J., Georgiev, G.Y., Towrie, M. & Sage, J.T. Ultrafast and low barriermotions in the photoreactions of the green fluorescent protein. J. Biol. Chem.280, 33652–33659 (2005).
27. Verkhusha, V.V. & Sorkin, A. Conversion of the monomeric red fluorescent proteininto a photoactivatable probe. Chem. Biol. 12, 279–285 (2005).
28. Ando, R., Hama, H., Yamamoto-Hino, M., Mizuno, H. & Miyawaki, A. An opticalmarker based on the UV-induced green-to-red photoconversion of a fluorescentprotein. Proc. Natl. Acad. Sci. USA 99, 12651–12656 (2002).
29. Lukyanov, K.A., Chudakov, D.M., Lukyanov, S. & Verkhusha, V.V. Innovation:Photoactivatable fluorescent proteins. Nat. Rev. Mol. Cell Biol. 6, 885–891(2005).
30. Patterson, G.H. & Lippincott-Schwartz, J. Selective photolabeling of proteinsusing photoactivatable GFP. Methods 32, 445–450 (2004).
31. Tsutsui, H., Karasawa, S., Shimizu, H., Nukina, N. & Miyawaki, A. Semi-rationalengineering of a coral fluorescent protein into an efficient highlighter. EMBO Rep.6, 233–238 (2005).
32. Baird, G.S., Zacharias, D.A. & Tsien, R.Y. Circular permutation and receptorinsertion within green fluorescent proteins. Proc. Natl. Acad. Sci. USA 96,11241–11246 (1999).
NATURE METHODS | VOL.5 NO.6 | JUNE 2008 | 551
ARTICLES©
2008
Nat
ure
Publ
ishi
ng G
roup
http
://w
ww
.nat
ure.
com
/nat
uremethods
Improving the photostability of bright monomeric orange and
red fluorescent proteins Nathan C Shaner, Michael Z Lin, Michael R McKeown, Paul A Steinbach,
Kristin L Hazelwood, Michael W Davidson & Roger Y Tsien
Supplementary figures and text:
Supplementary Figure 1 Excitation, emission, and absorbance spectra of novel
fluorescent protein variants.
Supplementary Note 1 Directed evolution and characterization of mApple.
Supplementary Note 2 Directed evolution and characterization of mOrange2.
Supplementary Note 3 Summary of reversible photoswitching data with representative
examples.
Supplementary Methods
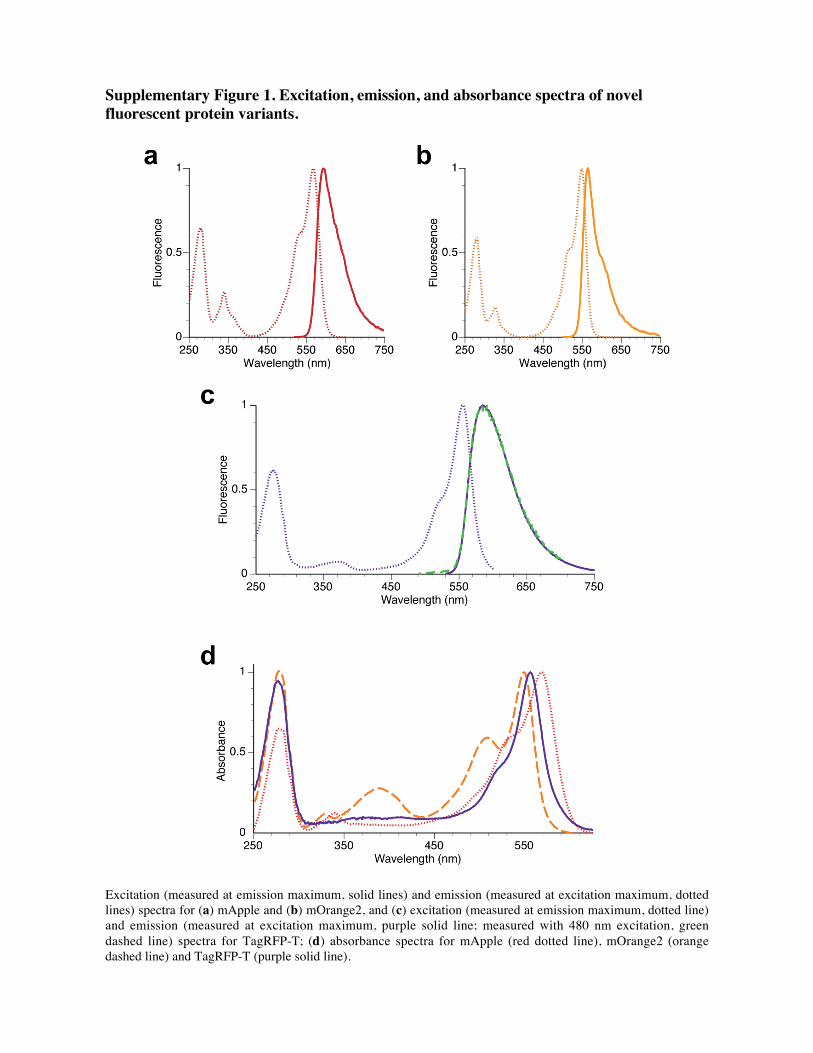
Supplementary Figure 1. Excitation, emission, and absorbance spectra of novel
fluorescent protein variants.
Excitation (measured at emission maximum, solid lines) and emission (measured at excitation maximum, dotted
lines) spectra for (a) mApple and (b) mOrange2, and (c) excitation (measured at emission maximum, dotted line)
and emission (measured at excitation maximum, purple solid line; measured with 480 nm excitation, green
dashed line) spectra for TagRFP-T; (d) absorbance spectra for mApple (red dotted line), mOrange2 (orange
dashed line) and TagRFP-T (purple solid line).
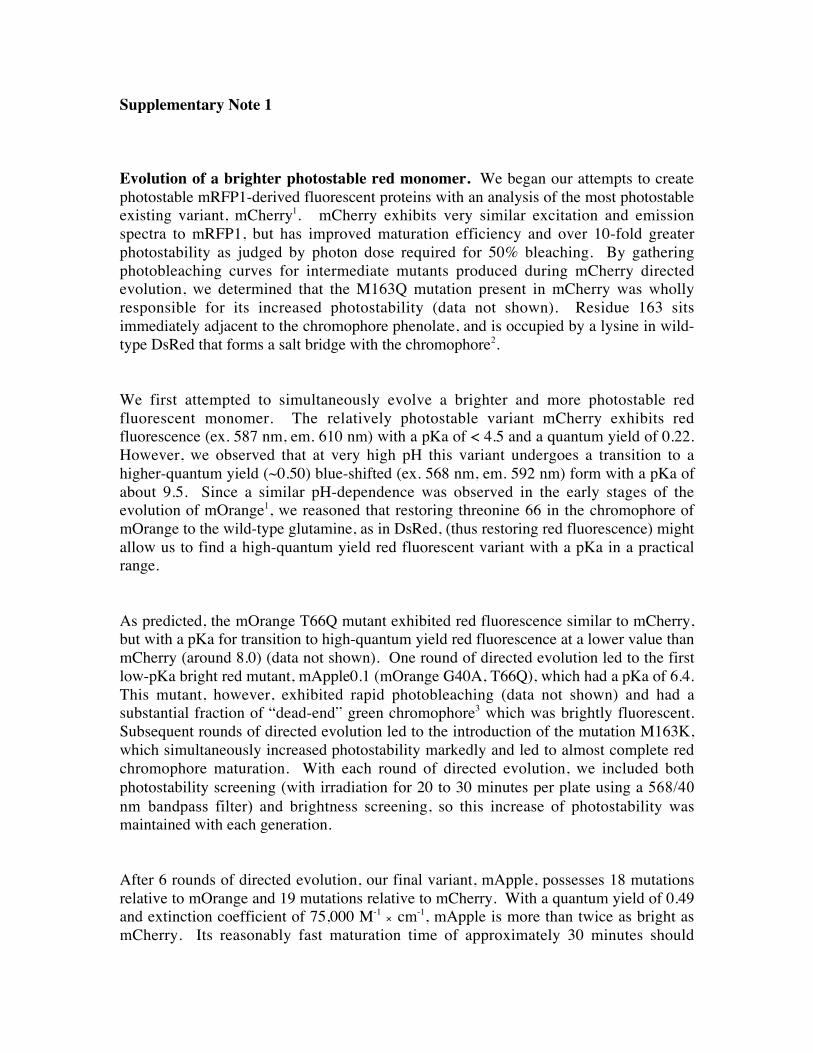
Supplementary Note 1
Evolution of a brighter photostable red monomer. We began our attempts to create
photostable mRFP1-derived fluorescent proteins with an analysis of the most photostable
existing variant, mCherry1. mCherry exhibits very similar excitation and emission
spectra to mRFP1, but has improved maturation efficiency and over 10-fold greater
photostability as judged by photon dose required for 50% bleaching. By gathering
photobleaching curves for intermediate mutants produced during mCherry directed
evolution, we determined that the M163Q mutation present in mCherry was wholly
responsible for its increased photostability (data not shown). Residue 163 sits
immediately adjacent to the chromophore phenolate, and is occupied by a lysine in wild-
type DsRed that forms a salt bridge with the chromophore2.
We first attempted to simultaneously evolve a brighter and more photostable red
fluorescent monomer. The relatively photostable variant mCherry exhibits red
fluorescence (ex. 587 nm, em. 610 nm) with a pKa of < 4.5 and a quantum yield of 0.22.
However, we observed that at very high pH this variant undergoes a transition to a
higher-quantum yield (~0.50) blue-shifted (ex. 568 nm, em. 592 nm) form with a pKa of
about 9.5. Since a similar pH-dependence was observed in the early stages of the
evolution of mOrange1, we reasoned that restoring threonine 66 in the chromophore of
mOrange to the wild-type glutamine, as in DsRed, (thus restoring red fluorescence) might
allow us to find a high-quantum yield red fluorescent variant with a pKa in a practical
range.
As predicted, the mOrange T66Q mutant exhibited red fluorescence similar to mCherry,
but with a pKa for transition to high-quantum yield red fluorescence at a lower value than
mCherry (around 8.0) (data not shown). One round of directed evolution led to the first
low-pKa bright red mutant, mApple0.1 (mOrange G40A, T66Q), which had a pKa of 6.4.
This mutant, however, exhibited rapid photobleaching (data not shown) and had a
substantial fraction of “dead-end” green chromophore3 which was brightly fluorescent.
Subsequent rounds of directed evolution led to the introduction of the mutation M163K,
which simultaneously increased photostability markedly and led to almost complete red
chromophore maturation. With each round of directed evolution, we included both
photostability screening (with irradiation for 20 to 30 minutes per plate using a 568/40
nm bandpass filter) and brightness screening, so this increase of photostability was
maintained with each generation.
After 6 rounds of directed evolution, our final variant, mApple, possesses 18 mutations
relative to mOrange and 19 mutations relative to mCherry. With a quantum yield of 0.49
and extinction coefficient of 75,000 M-1 ! cm-1, mApple is more than twice as bright as
mCherry. Its reasonably fast maturation time of approximately 30 minutes should
additionally allow rapid detection when expressed in cells (see Supplementary Fig. 1
online and Tables 1 and 2 in the main text).
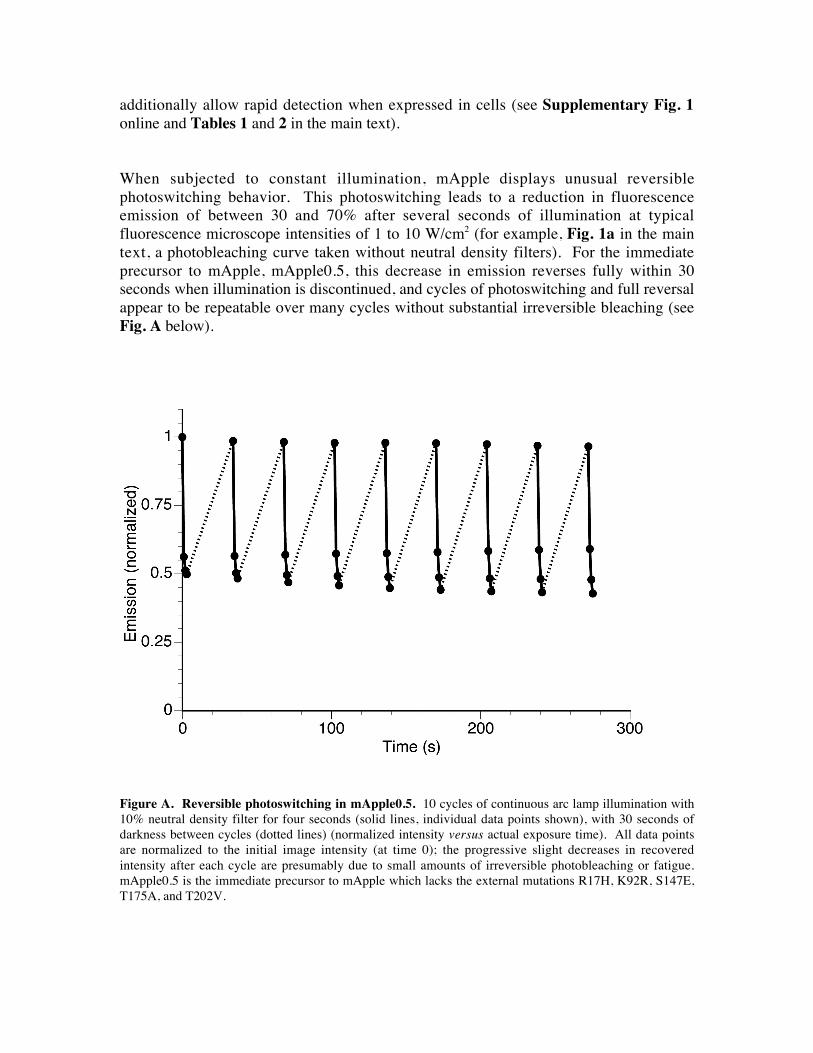
When subjected to constant illumination, mApple displays unusual reversible
photoswitching behavior. This photoswitching leads to a reduction in fluorescence
emission of between 30 and 70% after several seconds of illumination at typical
fluorescence microscope intensities of 1 to 10 W/cm2 (for example, Fig. 1a in the main
text, a photobleaching curve taken without neutral density filters). For the immediate
precursor to mApple, mApple0.5, this decrease in emission reverses fully within 30
seconds when illumination is discontinued, and cycles of photoswitching and full reversal
appear to be repeatable over many cycles without substantial irreversible bleaching (see
Fig. A below).
Figure A. Reversible photoswitching in mApple0.5. 10 cycles of continuous arc lamp illumination with
10% neutral density filter for four seconds (solid lines, individual data points shown), with 30 seconds of
darkness between cycles (dotted lines) (normalized intensity versus actual exposure time). All data points
are normalized to the initial image intensity (at time 0); the progressive slight decreases in recovered
intensity after each cycle are presumably due to small amounts of irreversible photobleaching or fatigue.
mApple0.5 is the immediate precursor to mApple which lacks the external mutations R17H, K92R, S147E,
T175A, and T202V.
Because of its photoswitching behavior, mApple displays a short photobleaching t1/2 of
4.8 seconds in our standard photobleaching assay (see Table 1 in the main text).
However, mApple appears far more photostable under laser scanning confocal
illumination, with a photobleaching t1/2 superior to mOrange and mKO, and approaching
that of mCherry (see Table 1 and Fig. 1b in the main text). The key difference between
the two illumination conditions may be that laser scanning excitation is intermittent for
any given pixel, giving time for some recovery in the dark. Also, unless extreme care is
taken not to minimize excitation before taking the first image, it is easy to miss the very
fast initial phase of decaying emission. All attempts to eliminate mApple’s
photoswitching behavior by mutagenesis of residues surrounding the chromophore
produced unwanted reductions in quantum yield and/or maturation efficiency. However,
such photoswitching may make mApple useful for revolutionary new optical techniques
for nanoscale spatial resolution (“nanoscopy”, see below).
All reversibly photoswitchable fluorescent proteins described thus far operate through
cis-to-trans isomerization of the chromophore4, 5, so this mechanism is probably
responsible for the photoswitching of mApple. The fastest-switching mutant of Dronpa,
M159T, relaxes in the dark from its temporarily dark state back to fluorescence with a
half-time of 30 sec6; mApple is almost completely recovered by 30 sec (Fig. A, above),
but its behavior is qualitatively similar to Dronpa M159T. Because mApple’s
spontaneous recovery is already so fast, we have not yet systematically explored
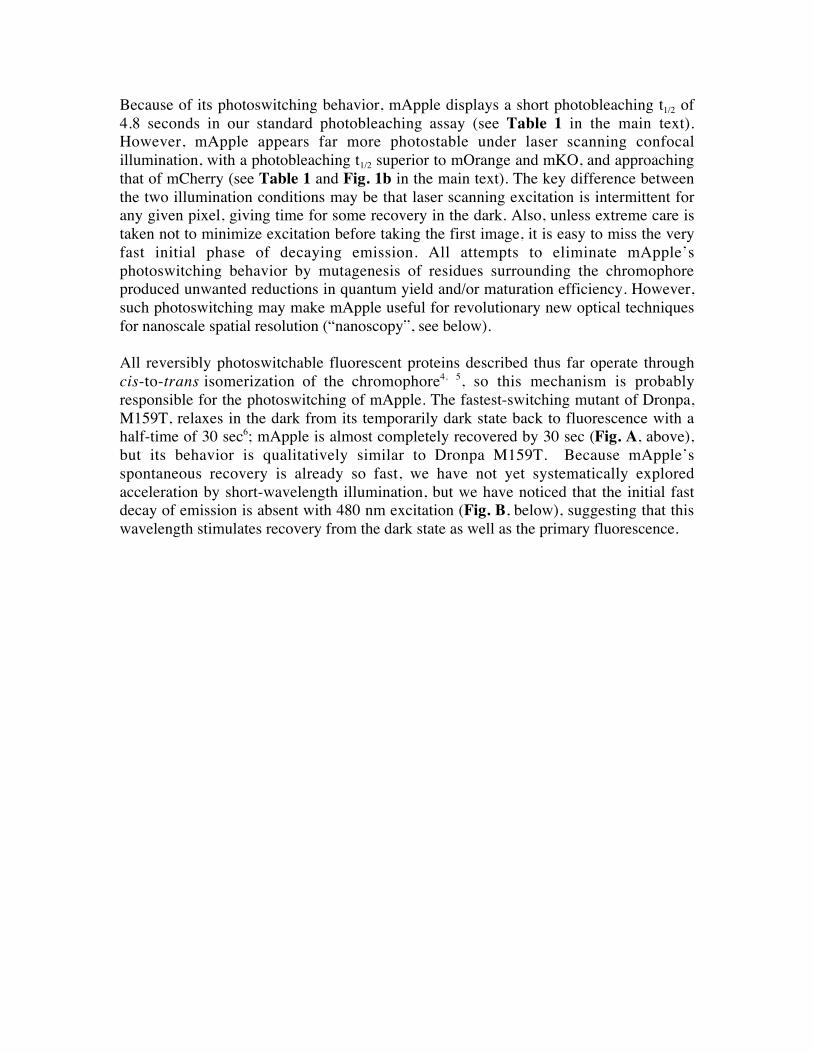
acceleration by short-wavelength illumination, but we have noticed that the initial fast
decay of emission is absent with 480 nm excitation (Fig. B, below), suggesting that this
wavelength stimulates recovery from the dark state as well as the primary fluorescence.
Figure B. mApple photobleaching at different excitation wavelengths. Widefield photobleaching curves
for mApple purified protein under oil with excitation using 568/55 nm (solid line), 540/25 nm (dashed
line), or 480/30 nm (dotted line) band pass filters, plotted as intensity versus normalized total exposure time
with an initial emission rate of 1000 photons/s per molecule.
Meanwhile, the existing properties of mApple would seem very attractive for
photoactivated localization microscopy with independently running acquisition
(PALMIRA7). In this exciting new version of super-resolution microscopy, strong
illumination (several kW/cm2) drives most of the fluorophores into a dark state.
Individual fluorophores stochastically revert to the fluorescing state, briefly emit a burst
of photons, then revert to the dark state. In any one image (whose acquisition time should
roughly match the mean duration of an emission burst), the emitters must be sparse
enough so that they represent distinct single molecules whose position can be localized to
a few nm by centroid-locating algorithms. Superposition of the centroid locations over
many images produces a super-resolution composite image. Currently the only
genetically encoded, photoreversible fluorophores are Dronpa, asFP595, and their
engineered variants. Dronpa fluoresces green and requires an excitation wavelength (488
nm) that slightly stimulates photoactivation of the dark molecules as well as fluorescence
and quenching of the bright molecules. asFP595 emits in the red but is very dim
(quantum yield <0.001) and tetrameric, whereas mApple also emits red but is quite bright
(quantum yield 0.49), very photostable apart from its fast photoswitching, and
monomeric. Although Fig. B (above) shows photoswitching only down to ~30% of initial
intensity with a few W/cm2, PALMIRA operates with up to 3 orders of magnitude higher
intensity, so that the activation density may be reducible to < 1%. The photoswitching
kinetics of the Dronpa mutant favored for PALMIRA, rsFastLime (Dronpa-V157G)6 are
somewhat different from those of mApple, but specific selection for variants with the
desired kinetics or structure-guided design of mutants with altered photoswitching
properties should be possible. While our laser scanning confocal bleach curves (Fig. 1 in
the main text) suggest that mApple is quite photostable under high intensity intermittent
illumination, it is yet to be determined if constant illumination at the higher intensities
required for PALMIRA will lead to a larger degree of irreversible photobleaching. Thus,
we believe that mApple or future variants have the potential to be genetically encoded red
FPs complementary to green Dronpa for PALMIRA.
References
1. Shaner, N.C. et al. Improved monomeric red, orange and yellow fluorescent
proteins derived from Discosoma sp. red fluorescent protein. Nat Biotechnol 22,
1567-1572 (2004).
2. Yarbrough, D., Wachter, R.M., Kallio, K., Matz, M.V. & Remington, S.J. Refined
crystal structure of DsRed, a red fluorescent protein from coral, at 2.0-A
resolution. Proc Natl Acad Sci U S A 98, 462-467 (2001).
3. Verkhusha, V.V., Chudakov, D.M., Gurskaya, N.G., Lukyanov, S. & Lukyanov,
K.A. Common Pathway for the Red Chromophore Formation in Fluorescent
Proteins and Chromoproteins. Chem Biol 11, 845-854 (2004).
4. Andresen, M. et al. Structure and mechanism of the reversible photoswitch of a
fluorescent protein. Proc Natl Acad Sci U S A 102, 13070-13074 (2005).
5. Andresen, M. et al. Structural basis for reversible photoswitching in Dronpa. Proc
Natl Acad Sci U S A (2007).
6. Stiel, A.C. et al. 1.8 A bright-state structure of the reversibly switchable
fluorescent protein Dronpa guides the generation of fast switching variants.
Biochem J 402, 35-42 (2007).
7. Egner, A. et al. Fluorescence nanoscopy in whole cells by asynchronous
localization of photoswitching emitters. Biophys J 93, 3285-3290 (2007).

Supplementary Note 2
Evolution of a photostable orange monomer. To determine whether the combination
of Q64H and F99Y mutations could confer enhanced photostability on related fluorescent
protein variants, we introduced these mutations into mRFP1 (ref. 1), the second-
generation variant mCherry2, and mApple (see main text). As with mOrange, the Q64H
mutation alone did not lead to an increase in photostability of any of these variants (data
not shown). However, the combination of Q64H and F99Y conferred an ~11-fold
increase in photostability to mRFP1, making it as photostable as its successor, mCherry
(data not shown). However, these mutations also had undesirable effects on maturation
and folding efficiency of mRFP1, making the double mutant suboptimal compared with
mCherry. Interestingly, the combination of Q64H and F99Y had no effect on the
photostability of mCherry or mApple, suggesting that this combination of mutations
specifically enhances photostability in mRFP1 variants possessing methionine at position
163. It is tempting to speculate that substitutions at 163 may inhibit photobleaching by
the same mechanism as the Q64H + F99Y double mutation.
To determine if photobleaching was occurring through an oxidative mechanism, we
measured bleaching curves for mOrange and mOrange2 before and after removing O2 by
equilibration of the bleaching chamber under N2. Anoxia led to a dramatic increase in
mOrange photobleaching half-time (approximately 25-fold, see Fig. 1a and Table 1 in
the main text), indicating that the primary mechanism for mOrange photobleaching under
normoxic conditions is oxidative. Interestingly, anoxia had almost no effect on the
photobleaching curve of mOrange2 (Fig. 1d in the main text), indicating that its primary
bleaching mechanism is fundamentally different from that of mOrange and that the
photostability-enhancing mutations almost completely suppress the oxidative bleaching
pathway. However, anoxia did prevent the small amount of photoactivation observed for
mOrange2 under normal conditions, indicating that this effect remains oxygen-
dependent.
To confirm the fusion tolerance and targeting functionality of mOrange2 in a wide range
of host protein chimeras, we have developed a series of 20 mOrange2 fusion constructs to
both the C- and N-terminus of the fluorescent protein. In all cases, the localization
patterns of the fusion proteins was similar to those that we have simultaneously or
previously confirmed with avGFP fusions (mEGFP and mEmerald; data not shown) (see
Fig. 2 in the main text). Fusions of mOrange2 to histone H2B were observed not to
hinder successful cell division as all phases of mitosis were present in cultures expressing
this construct (Fig. 2q-u in the main text). mOrange2 also performed well as a fusion to
the microtubule (+)-end binding protein, EB3 (Fig. 2e in the main text) where it could be
observed tracing the path of growing microtubules in time-lapse image sequences. Thus,
mOrange2 is expected to perform as well as highly validated fluorescent proteins such as
mEGFP in fusion constructs.
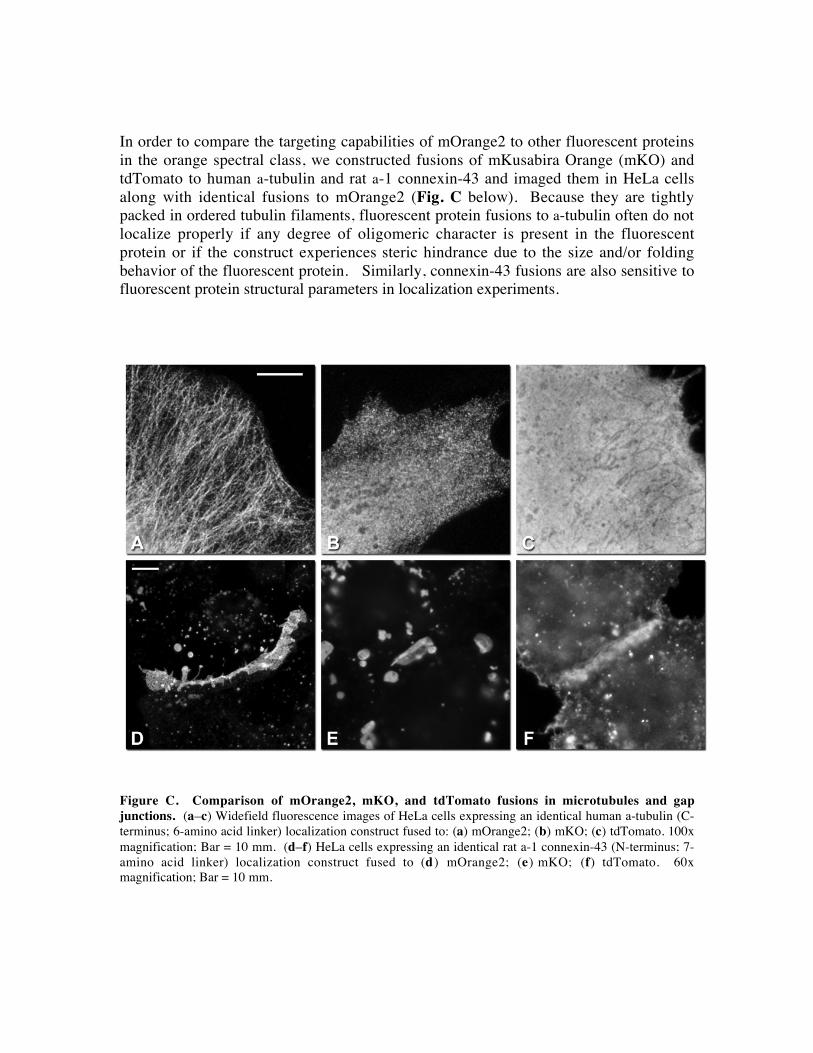
In order to compare the targeting capabilities of mOrange2 to other fluorescent proteins
in the orange spectral class, we constructed fusions of mKusabira Orange (mKO) and
tdTomato to human a-tubulin and rat a-1 connexin-43 and imaged them in HeLa cells
along with identical fusions to mOrange2 (Fig. C below). Because they are tightly
packed in ordered tubulin filaments, fluorescent protein fusions to a-tubulin often do not
localize properly if any degree of oligomeric character is present in the fluorescent
protein or if the construct experiences steric hindrance due to the size and/or folding
behavior of the fluorescent protein. Similarly, connexin-43 fusions are also sensitive to
fluorescent protein structural parameters in localization experiments.
Figure C. Comparison of mOrange2, mKO, and tdTomato fusions in microtubules and gap
junctions. (a–c) Widefield fluorescence images of HeLa cells expressing an identical human a-tubulin (C-
terminus; 6-amino acid linker) localization construct fused to: (a) mOrange2; (b) mKO; (c) tdTomato. 100x
magnification; Bar = 10 mm. (d–f) HeLa cells expressing an identical rat a-1 connexin-43 (N-terminus; 7-
amino acid linker) localization construct fused to (d ) mOrange2; (e) mKO; (f) tdTomato. 60x
magnification; Bar = 10 mm.

Fusions of mOrange2 to a-tubulin localize as expected to produce discernable
microtubule filaments (Fig. Ca above), but the same construct substituting mKO for
mOrange2 exhibits punctate behavior that obscures the identification of any tendency to
form filaments (Fig. Cb above). The tdTomato-a-tubulin fusion shows no evidence of
localization and produces patterns reminiscent of whole-cell expression by the
fluorescent protein without a fusion partner (note the dark outlines of mitochondria in the
cytoplasm: Fig. Cc above). Fusions of mOrange2 with rat a-1 connexin-43 are
assembled in the endoplasmic reticulum and traffic through the Golgi complex before
being translocated to the plasma membrane and properly assembled into functional gap
junctions (Fig. Cd above). In contrast, mKO fusions with connexin-43 produce
extraordinarily large cytoplasmic vesicles and form less clearly defined and much smaller
gap junctions (Fig. Ce above). tdTomato-connexin-43 fusions form aggregates in the
cytoplasm accompanied by widespread labeling of the membrane with no apparent
trafficking patterns through the endoplasmic reticulum and Golgi complex. In addition,
the fusion does not form morphologically distinct gap junctions, but occasionally will
produce regions of brighter fluorescence where plasma membranes of neighboring cells
overlap (Fig. Cf above). In all other fusions tested, mKO performed as well as mOrange2
(data not shown), suggesting that most proteins will tolerate fusion to either protein.
References
1. Campbell, R.E. et al. A monomeric red fluorescent protein. Proc Natl Acad Sci U
S A 99, 7877-7882 (2002).
2. Shaner, N.C. et al. Improved monomeric red, orange and yellow fluorescent
proteins derived from Discosoma sp. red fluorescent protein. Nat Biotechnol 22,
1567-1572 (2004).

Supplementary Note 3
Reversible photoswitching assays. Our observation that our newly engineered photostable
fluorescent protein variants exhibited varying degrees of reversible photoswitching led us to
explore this phenomenon in other commonly used fluorescent proteins. To qualitatively measure
this behavior, histone H2B fusions to each fluorescent protein were expressed and imaged in
HeLa-S3 cells by widefield and laser scanning confocal microscopy (LSCM) (for
instrumentation, see Live cell imaging and LSCM live cell photobleaching in Supplementary
Methods). For both widefield and LSCM imaging, cells were exposed to constant illumination
without neutral density filters (widefield) or with 25-100% laser power (LSCM) (corresponding
to excitation intensities between 32 and 151 W/cm2 for widefield and between 49 and 637 W/cm2
(scan-averaged) for LSCM) until they had dimmed to between 75% and 50% initial fluorescence
intensity. The cells were then allowed to recover in darkness for 1 to 2 minutes, after which time
they were re-imaged. Any recovery of fluorescence could not be due to diffusion from non-
illuminated regions, because the histone H2B fusions were confined within nuclei that were
entirely within the bleached area. The percent recovery (%REC) of the peak initial fluorescence
was calculated as:
!
%REC =f r " fbl
f0" fbl
where f0 is the peak initial fluorescence, fbl is the post-bleach fluorescence, and fr is the post-dark
recovery fluorescence. See Fig. D below for an example of the behavior of EGFP under
widefield and confocal illumination. Results for a wide variety of FPs are reported in Table A
below. While these data strongly suggest that reversible photoswitching is a common feature
among fluorescent proteins, these data are not intended to be quantitative; further in-depth
investigation of this phenomenon under a wider variety of experimental conditions will be
necessary to fully characterize this effect and its possible implications in any given experiment.
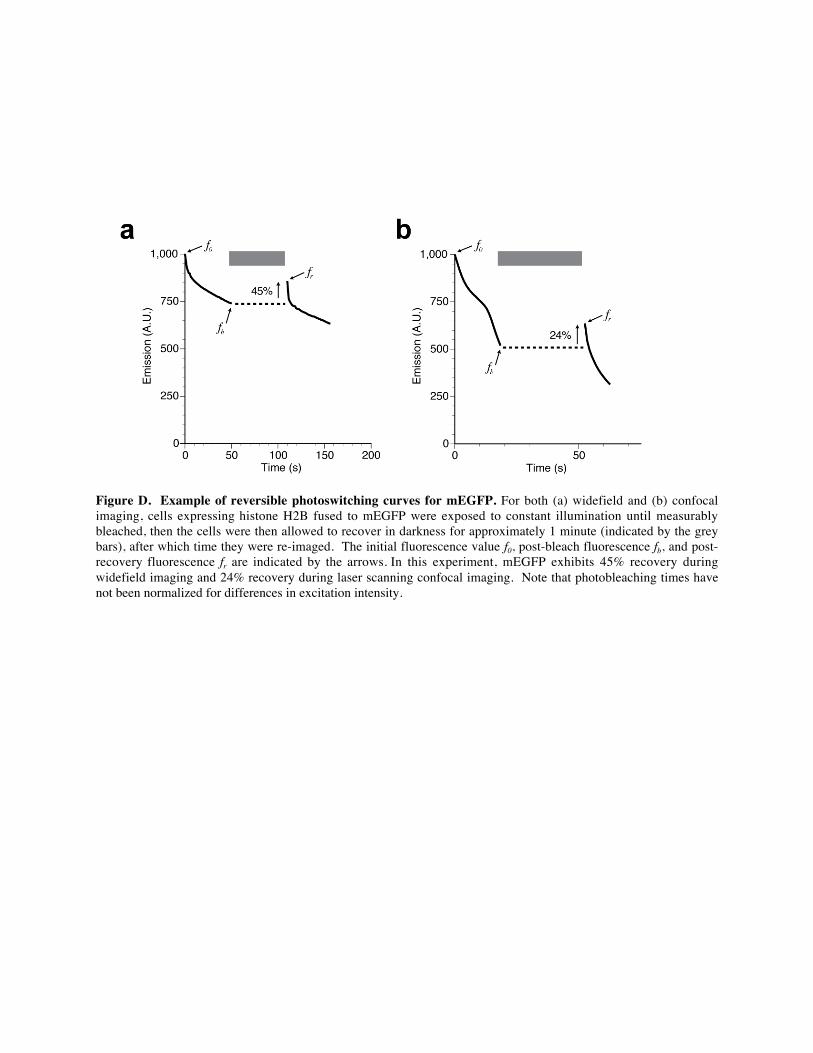
Figure D. Example of reversible photoswitching curves for mEGFP. For both (a) widefield and (b) confocal
imaging, cells expressing histone H2B fused to mEGFP were exposed to constant illumination until measurably
bleached, then the cells were then allowed to recover in darkness for approximately 1 minute (indicated by the grey
bars), after which time they were re-imaged. The initial fluorescence value f0, post-bleach fluorescence fb, and post-
recovery fluorescence fr are indicated by the arrows. In this experiment, mEGFP exhibits 45% recovery during
widefield imaging and 24% recovery during laser scanning confocal imaging. Note that photobleaching times have
not been normalized for differences in excitation intensity.
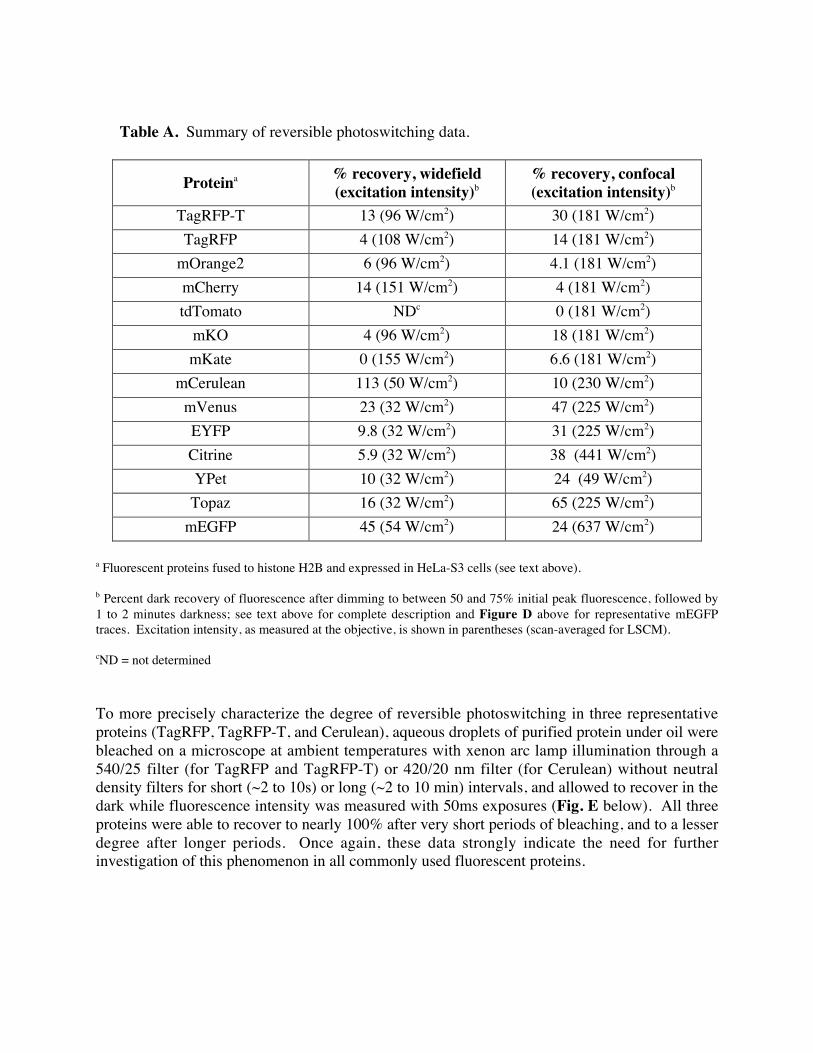
Table A. Summary of reversible photoswitching data.
Proteina % recovery, widefield
(excitation intensity)b
% recovery, confocal
(excitation intensity)b
TagRFP-T 13 (96 W/cm2) 30 (181 W/cm2)
TagRFP 4 (108 W/cm2) 14 (181 W/cm2)
mOrange2 6 (96 W/cm2) 4.1 (181 W/cm2)
mCherry 14 (151 W/cm2) 4 (181 W/cm2)
tdTomato NDc 0 (181 W/cm2)
mKO 4 (96 W/cm2) 18 (181 W/cm2)
mKate 0 (155 W/cm2) 6.6 (181 W/cm2)
mCerulean 113 (50 W/cm2) 10 (230 W/cm2)
mVenus 23 (32 W/cm2) 47 (225 W/cm2)
EYFP 9.8 (32 W/cm2) 31 (225 W/cm2)
Citrine 5.9 (32 W/cm2) 38 (441 W/cm2)
YPet 10 (32 W/cm2) 24 (49 W/cm2)
Topaz 16 (32 W/cm2) 65 (225 W/cm2)
mEGFP 45 (54 W/cm2) 24 (637 W/cm2)
a Fluorescent proteins fused to histone H2B and expressed in HeLa-S3 cells (see text above).
b Percent dark recovery of fluorescence after dimming to between 50 and 75% initial peak fluorescence, followed by
1 to 2 minutes darkness; see text above for complete description and Figure D above for representative mEGFP
traces. Excitation intensity, as measured at the objective, is shown in parentheses (scan-averaged for LSCM).
cND = not determined
To more precisely characterize the degree of reversible photoswitching in three representative
proteins (TagRFP, TagRFP-T, and Cerulean), aqueous droplets of purified protein under oil were
bleached on a microscope at ambient temperatures with xenon arc lamp illumination through a
540/25 filter (for TagRFP and TagRFP-T) or 420/20 nm filter (for Cerulean) without neutral
density filters for short (~2 to 10s) or long (~2 to 10 min) intervals, and allowed to recover in the
dark while fluorescence intensity was measured with 50ms exposures (Fig. E below). All three
proteins were able to recover to nearly 100% after very short periods of bleaching, and to a lesser
degree after longer periods. Once again, these data strongly indicate the need for further
investigation of this phenomenon in all commonly used fluorescent proteins.

Figure E. Reversible photoswitching of TagRFP, TagRFP-T, and Cerulean during widefield microscopy. (a)
A fraction of TagRFP fluorescence recovers after both short and sustained photobleaching. Purified TagRFP was
bleached on a microscope at ambient temperatures with xenon arc lamp illumination through a 540/25 nm filter for
short (~2s) or long intervals as indicated by the bars, and allowed to recover in the dark while fluorescence intensity
was measured with 50ms exposures. (b) A fraction of TagRFP-T fluorescence recovers after short photobleaching,
but not after sustained photobleaching. (c) Cerulean demonstrates fluorescence recovery after short (~10s) and
sustained photobleaching through a 420/20 nm filter. Exposure intervals are indicated by bars. Note that
photobleaching times are raw, and have not been adjusted for different illumination powers and the different
extinction coefficients and quantum yields as is done to derive normalized photostability measurements.
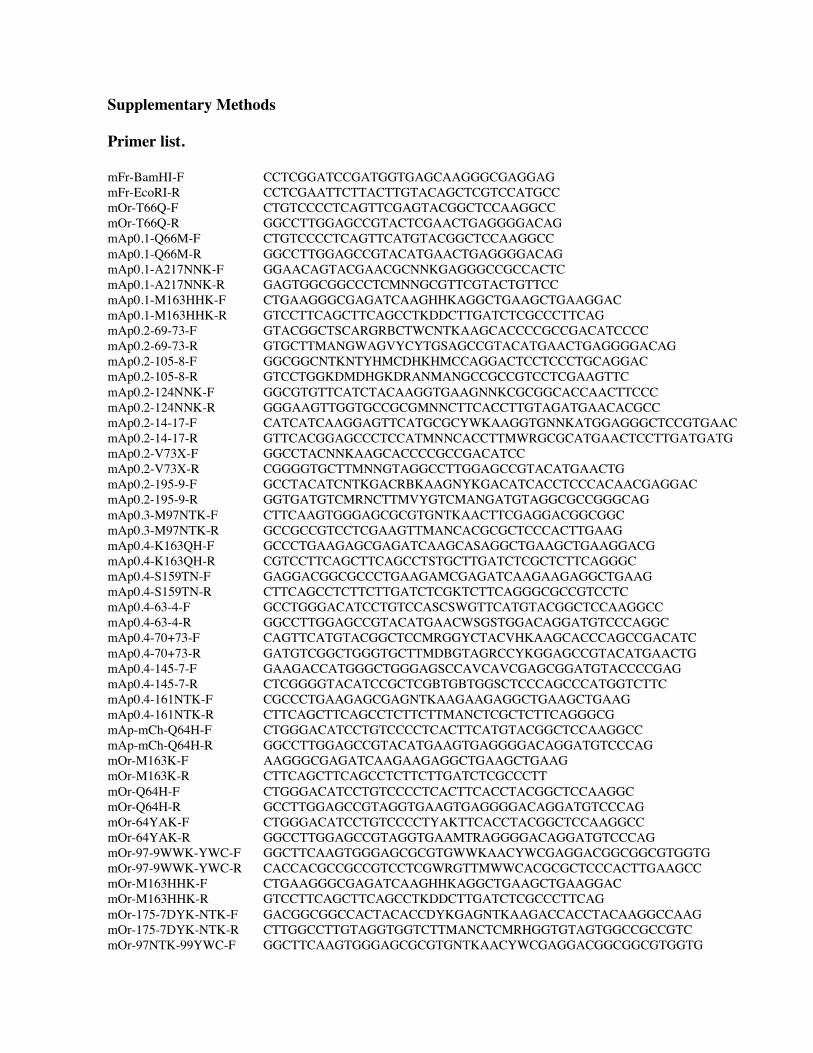
Supplementary Methods
Primer list.
mFr-BamHI-F CCTCGGATCCGATGGTGAGCAAGGGCGAGGAG
mFr-EcoRI-R CCTCGAATTCTTACTTGTACAGCTCGTCCATGCC
mOr-T66Q-F CTGTCCCCTCAGTTCGAGTACGGCTCCAAGGCC
mOr-T66Q-R GGCCTTGGAGCCGTACTCGAACTGAGGGGACAG
mAp0.1-Q66M-F CTGTCCCCTCAGTTCATGTACGGCTCCAAGGCC
mAp0.1-Q66M-R GGCCTTGGAGCCGTACATGAACTGAGGGGACAG
mAp0.1-A217NNK-F GGAACAGTACGAACGCNNKGAGGGCCGCCACTC
mAp0.1-A217NNK-R GAGTGGCGGCCCTCMNNGCGTTCGTACTGTTCC
mAp0.1-M163HHK-F CTGAAGGGCGAGATCAAGHHKAGGCTGAAGCTGAAGGAC
mAp0.1-M163HHK-R GTCCTTCAGCTTCAGCCTKDDCTTGATCTCGCCCTTCAG
mAp0.2-69-73-F GTACGGCTSCARGRBCTWCNTKAAGCACCCCGCCGACATCCCC
mAp0.2-69-73-R GTGCTTMANGWAGVYCYTGSAGCCGTACATGAACTGAGGGGACAG
mAp0.2-105-8-F GGCGGCNTKNTYHMCDHKHMCCAGGACTCCTCCCTGCAGGAC
mAp0.2-105-8-R GTCCTGGKDMDHGKDRANMANGCCGCCGTCCTCGAAGTTC
mAp0.2-124NNK-F GGCGTGTTCATCTACAAGGTGAAGNNKCGCGGCACCAACTTCCC
mAp0.2-124NNK-R GGGAAGTTGGTGCCGCGMNNCTTCACCTTGTAGATGAACACGCC
mAp0.2-14-17-F CATCATCAAGGAGTTCATGCGCYWKAAGGTGNNKATGGAGGGCTCCGTGAAC
mAp0.2-14-17-R GTTCACGGAGCCCTCCATMNNCACCTTMWRGCGCATGAACTCCTTGATGATG
mAp0.2-V73X-F GGCCTACNNKAAGCACCCCGCCGACATCC
mAp0.2-V73X-R CGGGGTGCTTMNNGTAGGCCTTGGAGCCGTACATGAACTG
mAp0.2-195-9-F GCCTACATCNTKGACRBKAAGNYKGACATCACCTCCCACAACGAGGAC
mAp0.2-195-9-R GGTGATGTCMRNCTTMVYGTCMANGATGTAGGCGCCGGGCAG
mAp0.3-M97NTK-F CTTCAAGTGGGAGCGCGTGNTKAACTTCGAGGACGGCGGC
mAp0.3-M97NTK-R GCCGCCGTCCTCGAAGTTMANCACGCGCTCCCACTTGAAG
mAp0.4-K163QH-F GCCCTGAAGAGCGAGATCAAGCASAGGCTGAAGCTGAAGGACG
mAp0.4-K163QH-R CGTCCTTCAGCTTCAGCCTSTGCTTGATCTCGCTCTTCAGGGC
mAp0.4-S159TN-F GAGGACGGCGCCCTGAAGAMCGAGATCAAGAAGAGGCTGAAG
mAp0.4-S159TN-R CTTCAGCCTCTTCTTGATCTCGKTCTTCAGGGCGCCGTCCTC
mAp0.4-63-4-F GCCTGGGACATCCTGTCCASCSWGTTCATGTACGGCTCCAAGGCC
mAp0.4-63-4-R GGCCTTGGAGCCGTACATGAACWSGSTGGACAGGATGTCCCAGGC
mAp0.4-70+73-F CAGTTCATGTACGGCTCCMRGGYCTACVHKAAGCACCCAGCCGACATC
mAp0.4-70+73-R GATGTCGGCTGGGTGCTTMDBGTAGRCCYKGGAGCCGTACATGAACTG
mAp0.4-145-7-F GAAGACCATGGGCTGGGAGSCCAVCAVCGAGCGGATGTACCCCGAG
mAp0.4-145-7-R CTCGGGGTACATCCGCTCGBTGBTGGSCTCCCAGCCCATGGTCTTC
mAp0.4-161NTK-F CGCCCTGAAGAGCGAGNTKAAGAAGAGGCTGAAGCTGAAG
mAp0.4-161NTK-R CTTCAGCTTCAGCCTCTTCTTMANCTCGCTCTTCAGGGCG
mAp-mCh-Q64H-F CTGGGACATCCTGTCCCCTCACTTCATGTACGGCTCCAAGGCC
mAp-mCh-Q64H-R GGCCTTGGAGCCGTACATGAAGTGAGGGGACAGGATGTCCCAG
mOr-M163K-F AAGGGCGAGATCAAGAAGAGGCTGAAGCTGAAG
mOr-M163K-R CTTCAGCTTCAGCCTCTTCTTGATCTCGCCCTT
mOr-Q64H-F CTGGGACATCCTGTCCCCTCACTTCACCTACGGCTCCAAGGC
mOr-Q64H-R GCCTTGGAGCCGTAGGTGAAGTGAGGGGACAGGATGTCCCAG
mOr-64YAK-F CTGGGACATCCTGTCCCCTYAKTTCACCTACGGCTCCAAGGCC
mOr-64YAK-R GGCCTTGGAGCCGTAGGTGAAMTRAGGGGACAGGATGTCCCAG
mOr-97-9WWK-YWC-F GGCTTCAAGTGGGAGCGCGTGWWKAACYWCGAGGACGGCGGCGTGGTG
mOr-97-9WWK-YWC-R CACCACGCCGCCGTCCTCGWRGTTMWWCACGCGCTCCCACTTGAAGCC
mOr-M163HHK-F CTGAAGGGCGAGATCAAGHHKAGGCTGAAGCTGAAGGAC
mOr-M163HHK-R GTCCTTCAGCTTCAGCCTKDDCTTGATCTCGCCCTTCAG
mOr-175-7DYK-NTK-F GACGGCGGCCACTACACCDYKGAGNTKAAGACCACCTACAAGGCCAAG
mOr-175-7DYK-NTK-R CTTGGCCTTGTAGGTGGTCTTMANCTCMRHGGTGTAGTGGCCGCCGTC
mOr-97NTK-99YWC-F GGCTTCAAGTGGGAGCGCGTGNTKAACYWCGAGGACGGCGGCGTGGTG
mOr-97NTK-99YWC-R CACCACGCCGCCGTCCTCGWRGTTMANCACGCGCTCCCACTTGAAGCC
TagRFP-BamHI-F AAGGATCCGATGGTGTCTAAGGGCGAAGAGC
TagRFP-BsrGI-R CCTGTACAGCTCGTCCATGCCATTAAGTTTGTGCCCCAGTTTGCTAGG
TagRFP-158-F GGCCTGGAAGGCAGANNSGACATGGCCCTGAA
TagRFP-158-R TTCAGGGCCATGTCSNNTCTGCCTTCCAGGCC
TagRFP-199-F TATGTGGACCACAGANNSGAAAGAATCAAGGAG
TagRFP-199-R CTCCTTGATTCTTTCSNNTCTGTGGTCCACATA
mOr2-TagRFP-T-AgeI-F CCTCACCGGTCGCCACCATGGTGAGCAAGGGCGAGGAG
mOr2-TagRFP-T-BspEI-R CCTCTCCGGACTTGTACAGCTCGTCCATGCC
mOr2-TagRFP-T-NotI-R CCTCGCGGCCGCTTTACTTGTACAGCTCGTCCATGCC
Mass spectrometry analysis. Parallel samples of purified mOrange were prepared
without bleaching and with 60 minutes bleaching on the solar simulator, and dialyzed into
200 mM ammonium bicarbonate pH 8.5. Samples were then digested with LysC (Wako
Biochemicals) which cuts at the C-terminal side of lysine, or AspN (Roche Diagnostics)
which cuts at the N-terminal side of aspartic acid. For the LysC digests, protein was
denatured in 6 M guanidinium HCl with incubation in a 72° C water bath for 2 minutes,
followed by addition of LysC enzyme at a 30:1 protein to enzyme ratio, and incubation for
18 hours at 36° C. For the AspN digests, protein was denatured in 8 M urea with
incubation in a 90° C water bath for 2 minutes, followed by addition of AspN enzyme at a
50:1 protein to enzyme ratio, an incubation for 18 hours at 36° C. Digested peptides were
desalted with a C18 ZipTip (Millipore) to prepare the sample for matrix-assisted laser
desorption/ionization (MALDI) mass spectrometry. The MALDI matrix used was !-
cyanohydroxycinnamic acid (Fluka). Mass spectra were collected on an Voyager-DE STR
MALDI-TOF (Applied Biosystems) using default tuning parameters.
Mammalian expression vectors. All mOrange2 and TagRFP-T expression vectors were
constructed using C1 and N1 (Clontech-style) cloning vectors. The fluorescent protein was
amplified with a 5’ primer encoding an AgeI site and a 3’ primer encoding either a BspEI
(C1) or NotI (N1) site (see Primer list, above). The purified and digested PCR products
were ligated into similarly digested pEGFP-C1 and pEGFP-N1 (Clontech) cloning vector
backbones. To generate fusion vectors, the appropriate cloning vector and an EGFP fusion
vector were digested, either sequentially or doubly, with the appropriate enzymes and
ligated together after gel purification. Thus, to prepare N-terminal fusions, the following
digests were performed: human non-muscle !-actinin, EcoRI and NotI (vector source, Tom
Keller, FSU); human cytochrome C oxidase subunit VIII, BamHI and NotI (mitochondria,
Clontech); rat !-1 connexin-43 and "-2 connexin-26, EcoRI and BamHI (Matthias Falk,
Lehigh University); human histone H2B, BamHI and NotI (George Patterson, NIH); N-
terminal 81 amino acids of human "-1,4-galactosyltransferase, BamHI and NotI (Golgi,
Clontech); human microtubule-associated protein EB3, BamHI and NotI (Lynne
Cassimeris, Lehigh University); human vimentin, BamHI and NotI (Robert Goldman,
Northwestern University); human keratin 18, EcoRI and NotI (Open Biosystems); chicken
paxillin, EcoRI and NotI (Alan Horwitz, University of Virginia); rat lysosomal membrane
glycoprotein 1, AgeI and NheI (George Patterson, NIH). To prepare C-terminal fusions, the
following digests were performed: human "-actin, NheI and BglII (Clontech); human !-
tubulin, NheI and BglII (Clontech); human light chain clathrin, NheI and BglII (George
Patterson, NIH); human lamin B1, NheI and BglII (George Patterson, NIH); human
fibrillarin, AgeI and BglII (Evrogen); human vinculin, NheI and EcoRI (Open Biosystems);
peroximal targeting signal 1 (PTS1 - peroxisomes), AgeI and BspEI (Clontech); human
RhoB GTPase with an N-terminal c-Myc epitope tag (endosomes), AgeI and BspEI
(Clontech). DNA for mammalian transfection was prepared using the Plasmid Maxi kit
(Qiagen).
Live cell imaging. HeLa epithelial (CCL-2, ATCC) and Grey fox lung fibroblast (CCL-
168, ATCC) cells were grown in a 50:50 mixture of DMEM and Ham’s F12 with 12.5%
Cosmic calf serum (HyClone) and transfected with Effectene (Qiagen). Imaging was
performed in Delta-T culture chambers (Bioptechs) under a humidified atmosphere of 5%
CO2 in air. Fluorescence images in widefield mode were gathered using a TE-2000
inverted microscope (Nikon) equipped with QuantaMaxTM filters (Omega) and a Cascade II
camera (Photometrics) or an IX71 microscope (Olympus) equipped with BrightLineTM
filters (Semrock) and a ImagEMTM camera (Hamamatsu). Laser scanning confocal
microscopy was performed on C1Si (Nikon) and FV1000 (Olympus), both equipped with
helium-neon and diode lasers and proprietary filter sets to match fluorophore emission
spectral profiles. Spinning disk confocal microscopy was performed on a DSU-IX81
microscope (Olympus) equipped with a Lumen 200 illuminator (Prior), Semrock filters, 10-
position filter wheels driven by a Lambda 10-3 controller (Sutter), and a 9100-12 EMCCD
camera (Hamamatsu). Cell cultures expressing fluorescent protein fusions were fixed after
imaging in 2% paraformaldehyde (EMS) and washed several times in PBS containing 0.05
M glycine before mounting with a polyvinyl alcohol-based medium. Morphological
features in all fusion constructs were confirmed by imaging fixed cell preparations on
coverslips using an 80i upright microscope (Nikon) and ET-DsRed filter set (#4900;
Chroma) coupled to an Orca ER (Hamamatsu) or a CoolSNAPTM HQ2 (Photometrics)
camera.
Laser scanning confocal microscopy live cell photobleaching. Laser scanning confocal
microscopy (LSCM) photobleaching experiments were conducted with N-terminal fusions
of the appropriate fluorescent protein to human histone H2B (6-residue linker) to confine
fluorescence to the nucleus in order to closely approximate the dimensions of aqueous
droplets of purified FPs used in widefield measurements. HeLa-S3 cells (average nucleus
diameter = 17µm) were transfected with the H2B construct using Effectene (Qiagen) and
maintained in a 5% CO2 in Delta-T imaging chambers (Bioptechs) for at least 36 hours
prior to imaging. The chambers were transferred to a stage adapter (Bioptechs), imaged at
low magnification to ensure cell viability, and then photobleaching using a 40x oil
immersion objective (Olympus UPlan Apo, NA = 1.00). Laser lines (543 nm, He-Ne and
488 nm, argon-ion) were adjusted to an output power of 50 µW, measured with a
FieldMaxII-TO (Coherent) power meter equipped with a high-sensitivity
silicon/germanium optical sensor (OP-2Vis, Coherent). The instrument (FV300, Olympus)
was set to a zoom of 4X, a region of interest of 341.2 µm2 (108 x 108 pixels), a
photomultiplier voltage of 650 V, and an offset of 9% with a scan time of 0.181 seconds
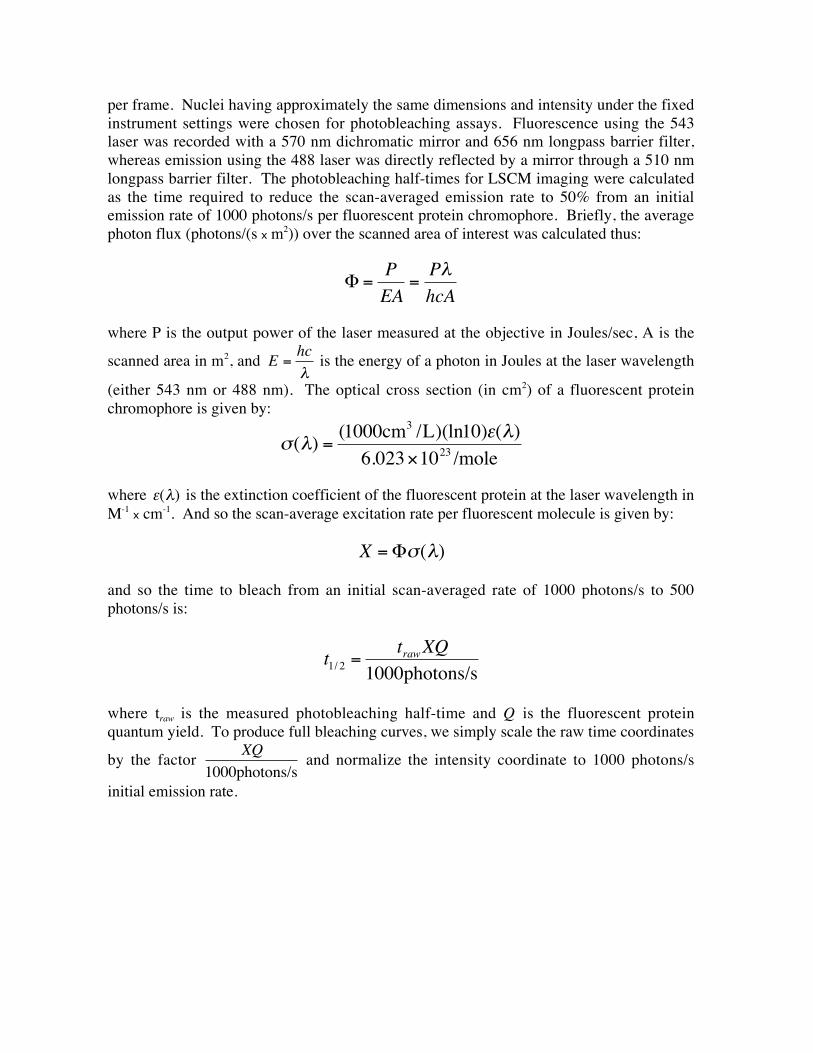
per frame. Nuclei having approximately the same dimensions and intensity under the fixed
instrument settings were chosen for photobleaching assays. Fluorescence using the 543
laser was recorded with a 570 nm dichromatic mirror and 656 nm longpass barrier filter,
whereas emission using the 488 laser was directly reflected by a mirror through a 510 nm
longpass barrier filter. The photobleaching half-times for LSCM imaging were calculated
as the time required to reduce the scan-averaged emission rate to 50% from an initial
emission rate of 1000 photons/s per fluorescent protein chromophore. Briefly, the average
photon flux (photons/(s x m2)) over the scanned area of interest was calculated thus:
!
" =P
EA=P#
hcA
where P is the output power of the laser measured at the objective in Joules/sec, A is the
scanned area in m2, and
!
E =hc
" is the energy of a photon in Joules at the laser wavelength
(either 543 nm or 488 nm). The optical cross section (in cm2) of a fluorescent protein
chromophore is given by:
!
"(#) =(1000cm
3/L)(ln10)$(#)
6.023%1023/mole
where
!
"(#) is the extinction coefficient of the fluorescent protein at the laser wavelength in
M-1 x cm-1. And so the scan-average excitation rate per fluorescent molecule is given by:
!
X ="#($)
and so the time to bleach from an initial scan-averaged rate of 1000 photons/s to 500
photons/s is:
!
t1/ 2 =trawXQ
1000photons/s
where traw is the measured photobleaching half-time and Q is the fluorescent protein
quantum yield. To produce full bleaching curves, we simply scale the raw time coordinates
by the factor
!
XQ
1000photons/s and normalize the intensity coordinate to 1000 photons/s
initial emission rate.