Embed Size (px)
Citation preview
Improve Customer Complaint Resolution Process Using Six Sigma
Sanjit RaySQC and OR Division
Indian Statistical Institute8th Mile, Mysore Road,
Bangalore 560 059, Karnataka, India.Email: [email protected]
Prasun DasSQC and OR Division
Indian Statistical Institute203 B.T. Road, Kolkata 700 108, India
Email: [email protected]
Bidyut Kr. Bhattacharya*Department of Mechanical Engineering
Bengal Engineering and Science UniversityShibpur, Howrah 711103, IndiaE-mail: [email protected]
*Corresponding author
Abstract: Six-Sigma is a strategy for improving customer satisfaction by reducing variation and thus producing products and services better, faster and cheaper. Usually, an organization uses the DMAIC methodology to improve current process performance. Initially, Six-Sigma methodologies were implemented to improve manufacturing processes and now its use is rapidly expanded to other functional areas. Customer complaint investigation and analysis are critical for customer satisfaction as complaints produce customer dissatisfaction and probable business loss. The structured methodology of DMAIC was applied to reduce the cycle time for customer complaint resolution process. This project has substantially benefitted the organization by reducing the follow-up time for customer complaint resolution, lowering the closure time and decreasing the ratio of pending complaints. This paper will be of interest to academic researchers and practical managers. It describes the justification and selection of the project, how the tools and techniques of DMAIC methodology were employed in the different phases and how the improvement actions were implemented. This project methodology can be used generally to reduce cycle time for any other transactional processes as well, which will help in reduce response time to customer issue, improve customer-supplier relation and finally improve customer satisfaction.
Keywords: Six Sigma; DMAIC (Define – Measure – Analyse – Improve – Control),
SIPOC; Critical to Quality (CTQ); Causes; Classification Analysis, Regression Tree;
Sigma Rating.
945
1. Introduction
Six-Sigma is considered as a business strategy that focuses on improving the understanding of customer requirements, business systems, productivity and financial performance (Kwak and Anbari, 2006). It focuses on improving quality by reducing variation and thus helping an organization to produce products and services better, faster and cheaper (Mahanti and Antony, 2005). Normally, an organization uses the Six Sigma methods to achieve bottom line benefits or customer satisfaction. Six-Sigma is a well structured methodology that can help a company achieve expected goal through a continuous improvement methodology (Chun-Chin Wei et al., 2010; Chao-Ton Su et al., 2008), which is project-by-project. It is a project-driven scheme that employs a well-structured methodology, called DMAIC, comprising of the five phases: Define, Measure, Analyze, Improve and Control. This approach reduces process variation, waste and cycle time, thus enhances profitability and customer satisfaction via effective application of statistical techniques (Coronado and Antony, 2002; Douglas et al., 2008). Six-Sigma is a scientific and statistical quality assessment for all processes in the organization through measurement of quality level, which provides the opportunity and discipline to eliminate mistakes, improve moral and thus reduce cost (Park, 2002). Six Sigma methodologies were typically implemented first to improve manufacturing processes; however, organizations realised the benefits of Six Sigma, and its use is rapidly expanded to different functional areas such as marketing, engineering, purchasing, servicing, and administrative support (Henderson and Evans, 2000; Rajagopalan, Francis and Suarez, 2004; Roberts, 2004; Das 2005; Das et al., 2006, 2007; Ray and Das, 2009). Thus the fundamental goal of Six-Sigma methodology is process improvement for better performance (Antony et al., 2010).
Overall operational excellence is the key requirement of any business to have competitive advantage over others and sustained growth (Desai et al., 2009). In a large manufacturing industry, high cycle time for customer complaints resolution is critical element of business management as it produces customer dissatisfaction due to reduced product efficiency and loss to customer, and possible loss of business. This paper integrates Six-Sigma objectives and concepts (Bunce et al., 2008) and industrial processes by using theDMAIC roadmap, to be followed for the purpose of reducing cycle time for customer complaint resolution. The main objective of this analysis is to learn about the causes ofhigh cycle time so that the process can be improved. The reasons, causes, variables of customer complaint resolution process are very generic in nature and may be found available in most of the industries. The only thing that varies from industry to industry is the list of significant variables or root causes. The details of the five phases of Six Sigma DMAIC methodology, as used for this study, are discussed in the subsequent sections. This particular application offers practical insight for improving transactional processes for cycle time reduction and creates new knowledge among managers and seeks to advance theoretical understanding of process improvement (Anand et al., 2010).
946
2. Define Phase
This phase defines the goals and boundaries of an improvement study in terms of customer requirements or business requirements and the process delivering these requirements (Porter 2001). The main activities of define phase are to
a) Define the project boundary by SIPOC (Supplier, Input, Process, Output, Customer) analysis
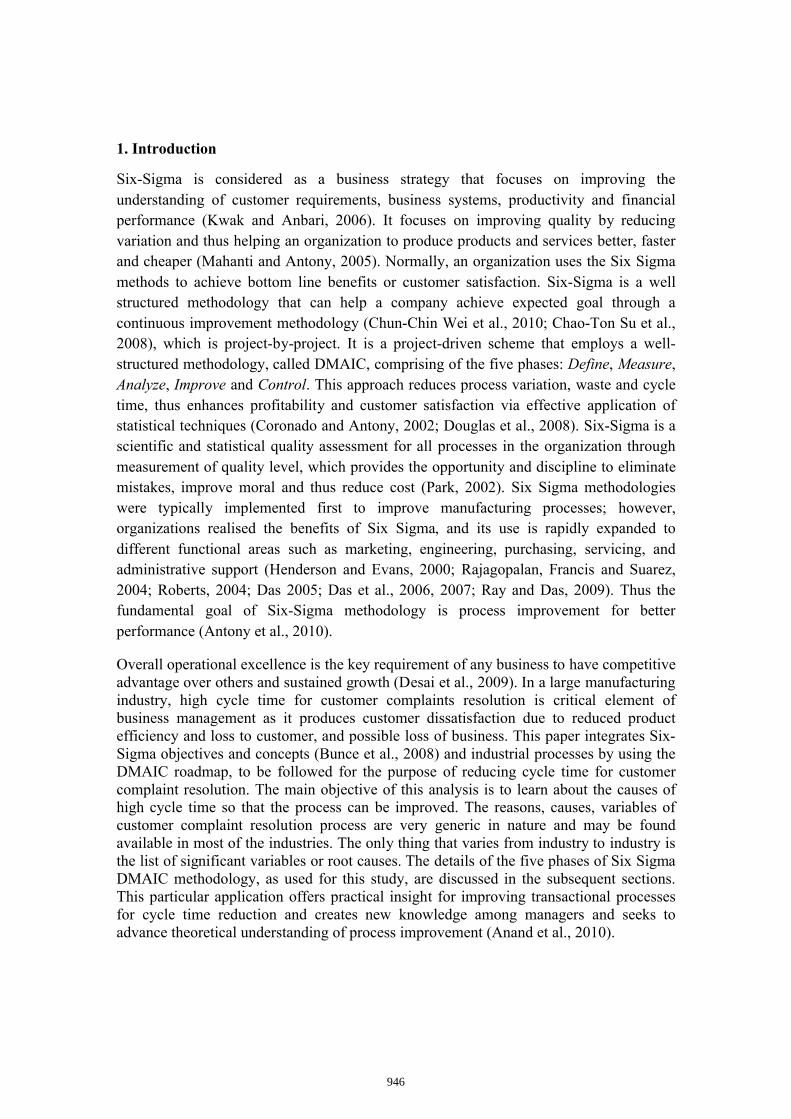
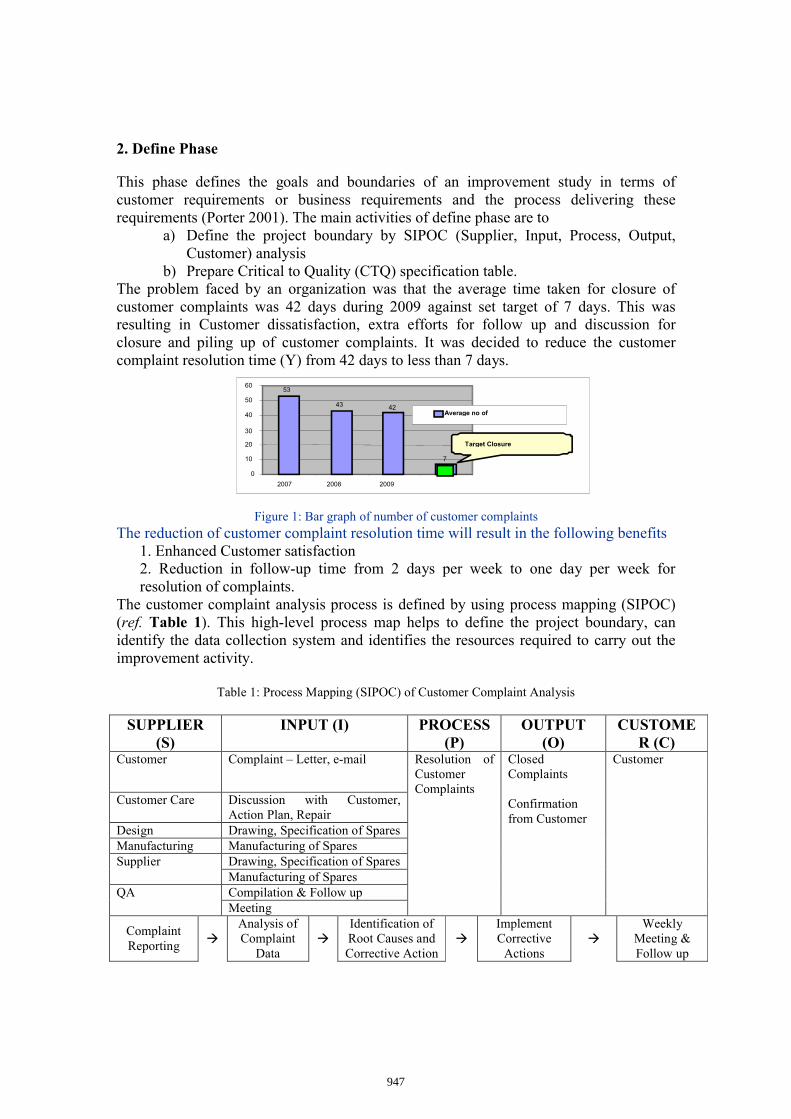
b) Prepare Critical to Quality (CTQ) specification table.The problem faced by an organization was that the average time taken for closure of customer complaints was 42 days during 2009 against set target of 7 days. This was resulting in Customer dissatisfaction, extra efforts for follow up and discussion for closure and piling up of customer complaints. It was decided to reduce the customer complaint resolution time (Y) from 42 days to less than 7 days.
Figure 1: Bar graph of number of customer complaints
The reduction of customer complaint resolution time will result in the following benefits1. Enhanced Customer satisfaction 2. Reduction in follow-up time from 2 days per week to one day per week for resolution of complaints.
The customer complaint analysis process is defined by using process mapping (SIPOC) (ref. Table 1). This high-level process map helps to define the project boundary, can identify the data collection system and identifies the resources required to carry out the improvement activity.
Table 1: Process Mapping (SIPOC) of Customer Complaint Analysis
SUPPLIER (S)
INPUT (I) PROCESS (P)
OUTPUT (O)
CUSTOMER (C)
Customer Complaint – Letter, e-mail Resolution of Customer Complaints
Closed Complaints
Confirmation from Customer
Customer
Customer Care Discussion with Customer, Action Plan, Repair
Design Drawing, Specification of SparesManufacturing Manufacturing of SparesSupplier Drawing, Specification of Spares
Manufacturing of SparesQA Compilation & Follow up
Meeting
Complaint Reporting
Analysis of Complaint
Data
Identification of Root Causes and Corrective Action
Implement Corrective
Actions
Weekly Meeting & Follow up
53
43 42
7
0
10
20
30
40
50
60
2007 2008 2009
Average no of Days
Target Closure Days
947
Based on the objective of the study and definition of the process, the critical measures of the process output CTQ is defined next along with their specifications, by measuring and monitoring of which, the process quality and level of control can easily be found out (ref.Table 2). With these definitions and interpretation of CTQ, the study moves to the Measure phase.
Table 2: CTQ Specification Table
NEED CTQ OPERATIONAL DEFINITION OF
MEASURE
DEFECT DEFINITION
KANO STATUS
Reduce time taken for closure of B type complaint
Closure time (days)
Number of days = closure date-complaint date
>7 days Must be
3. Measure Phase
The Measure phase of a Six Sigma study deals with the following Data collection plan and identification of stratification factors. Collection of information on cycle time. Analysis of cycle time data for Sigma level estimation. Initial Process analysis based on the stratification factors.
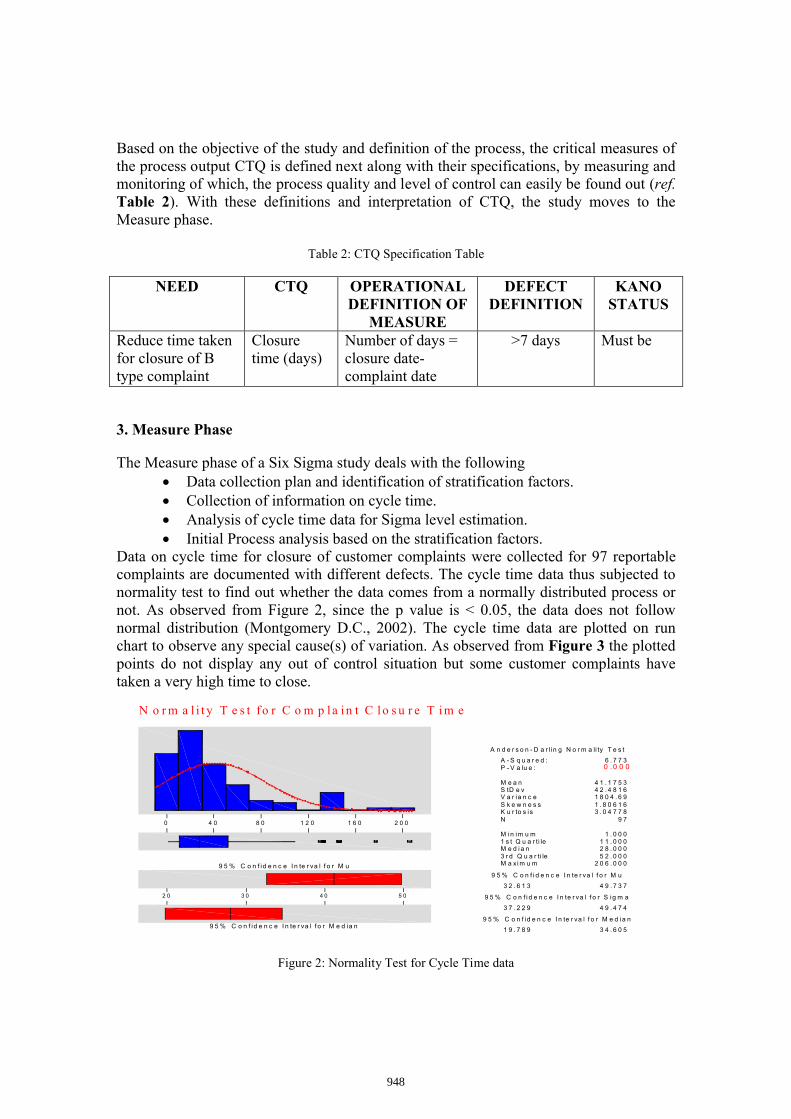
Data on cycle time for closure of customer complaints were collected for 97 reportable complaints are documented with different defects. The cycle time data thus subjected to normality test to find out whether the data comes from a normally distributed process or not. As observed from Figure 2, since the p value is < 0.05, the data does not follow normal distribution (Montgomery D.C., 2002). The cycle time data are plotted on run chart to observe any special cause(s) of variation. As observed from Figure 3 the plotted points do not display any out of control situation but some customer complaints have taken a very high time to close.
: Normality Test for Cycle Time data
Figure 2: Normality Test for Cycle Time data
2 0 01 6 01 2 08 04 00
9 5 % C o n f id e n c e I n te r va l f o r M u
5 04 03 02 0
9 5 % C o n f id e n c e I n te r va l f o r M e d ia n1 9 . 7 8 9
3 7 . 2 2 9
3 2 . 6 1 3
M a x i m u m3 r d Q u a r ti leM e d i a n1 s t Q u a r ti leM in im u m
NK u r to s isS k e w n e s sV a r ia n c eS tD e vM e a n
P - V a lu e :A - S q u a r e d :
3 4 . 6 0 5
4 9 . 4 7 4
4 9 . 7 3 7
2 0 6 . 0 0 05 2 . 0 0 02 8 . 0 0 01 1 . 0 0 0
1 . 0 0 0
9 73 . 0 4 7 7 81 . 8 0 6 1 61 8 0 4 . 6 94 2 . 4 8 1 64 1 . 1 7 5 3
0 .0 0 06 . 7 7 3
9 5 % C o n f id e n c e I n te r va l f o r M e d ia n
9 5 % C o n f i d e n c e I n te r va l f o r S ig m a
9 5 % C o n f i d e n c e I n te r va l f o r M u
A n d e r s o n - D a r lin g N o r m a li ty T e s t
N o r m a l i t y T e s t fo r C o m p l a i n t C l o s u r e T i m e
948
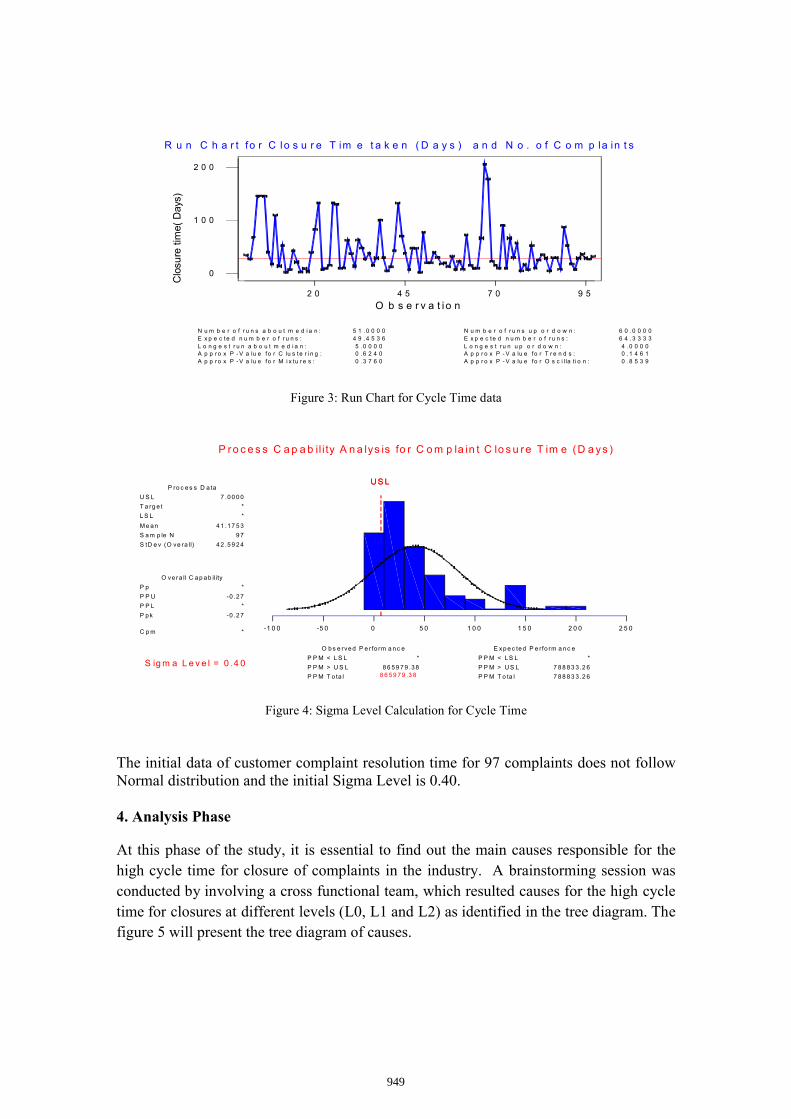
Figure 3: Run Chart for Cycle Time data
Figure 4: Sigma Level Calculation for Cycle Time
The initial data of customer complaint resolution time for 97 complaints does not follow Normal distribution and the initial Sigma Level is 0.40.
4. Analysis Phase
At this phase of the study, it is essential to find out the main causes responsible for the high cycle time for closure of complaints in the industry. A brainstorming session was conducted by involving a cross functional team, which resulted causes for the high cycle time for closures at different levels (L0, L1 and L2) as identified in the tree diagram. The figure 5 will present the tree diagram of causes.
2 5 02 0 01 5 01 0 05 00-5 0-1 0 0
U S LU S L
P ro c e s s C a p a b il i ty A n a lys is fo r C o m p la in t C lo s u re T im e (D a ys )
P P M T o ta l
P P M > U S L
P P M < L S L
P P M T o ta l
P P M > U S L
P P M < L S L
C p m
P p k
P P L
P P U
P p
S tD e v (O ve ra ll)
S a m p le N
M e a n
L S L
T a rg e t
U S L
7 8 8 8 3 3 .2 6
7 8 8 8 3 3 .2 6
*
8 6 5 9 7 9 .3 88 6 5 9 7 9 .3 8
*
*
-0 .2 7
*
-0 .2 7
*
4 2 .5 9 2 4
9 7
4 1 .1 7 5 3
*
*
7 .0 0 0 0
E x p e c te d P e rfo rm a n c eO b s e rve d P e rfo rm a n c e
O ve ra ll C a p a b ility
P ro c e s s D a ta
S ig m a L e v e l = 0 .4 0
9 57 04 52 0
2 0 0
1 0 0
0
O b s e r v a t i o n
Clo
sure
time(
Day
s)
0 . 8 5 3 90 .1 4 6 14 .0 0 0 0
6 4 .3 3 3 36 0 .0 0 0 0
0 .3 7 6 00 .6 2 4 05 .0 0 0 0
4 9 .4 5 3 65 1 .0 0 0 0
A p p r o x P - V a lu e fo r O s c i lla t i o n :A p p r o x P - V a lu e fo r T r e n d s :L o n g e s t r u n u p o r d o w n :E x p e c te d n u m b e r o f r u n s :N u m b e r o f r u n s u p o r d o w n :
A p p r o x P - V a lu e fo r M i x tu r e s :A p p r o x P - V a lu e fo r C lu s te r i n g :L o n g e s t r u n a b o u t m e d i a n :E x p e c te d n u m b e r o f r u n s :N u m b e r o f r u n s a b o u t m e d i a n :
R u n C h a r t fo r C lo s u r e T im e t a k e n ( D a y s ) a n d N o . o f C o m p la in t s
949
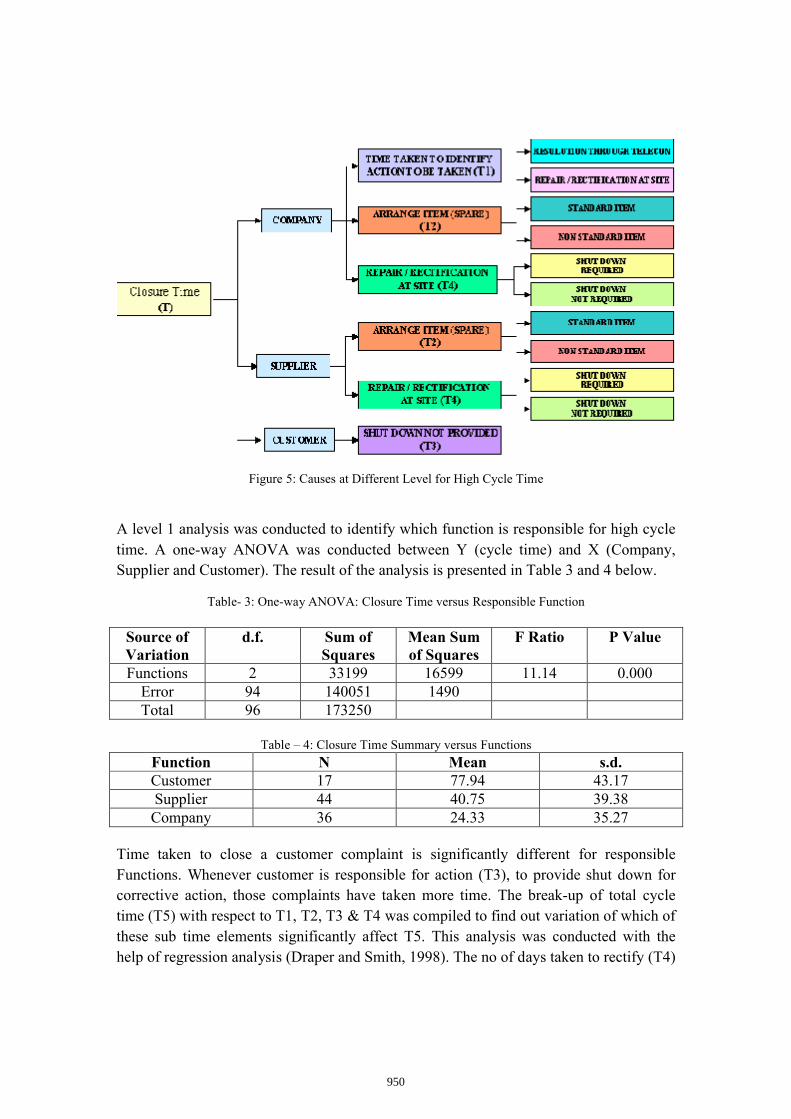
Figure 5: Causes at Different Level for High Cycle Time
A level 1 analysis was conducted to identify which function is responsible for high cycle time. A one-way ANOVA was conducted between Y (cycle time) and X (Company, Supplier and Customer). The result of the analysis is presented in Table 3 and 4 below.
Table- 3: One-way ANOVA: Closure Time versus Responsible Function
Source of Variation
d.f. Sum of Squares
Mean Sum of Squares
F Ratio P Value
Functions 2 33199 16599 11.14 0.000Error 94 140051 1490Total 96 173250
Table – 4: Closure Time Summary versus Functions
Function N Mean s.d.Customer 17 77.94 43.17Supplier 44 40.75 39.38Company 36 24.33 35.27
Time taken to close a customer complaint is significantly different for responsible Functions. Whenever customer is responsible for action (T3), to provide shut down for corrective action, those complaints have taken more time. The break-up of total cycle time (T5) with respect to T1, T2, T3 & T4 was compiled to find out variation of which of these sub time elements significantly affect T5. This analysis was conducted with the help of regression analysis (Draper and Smith, 1998). The no of days taken to rectify (T4)
950
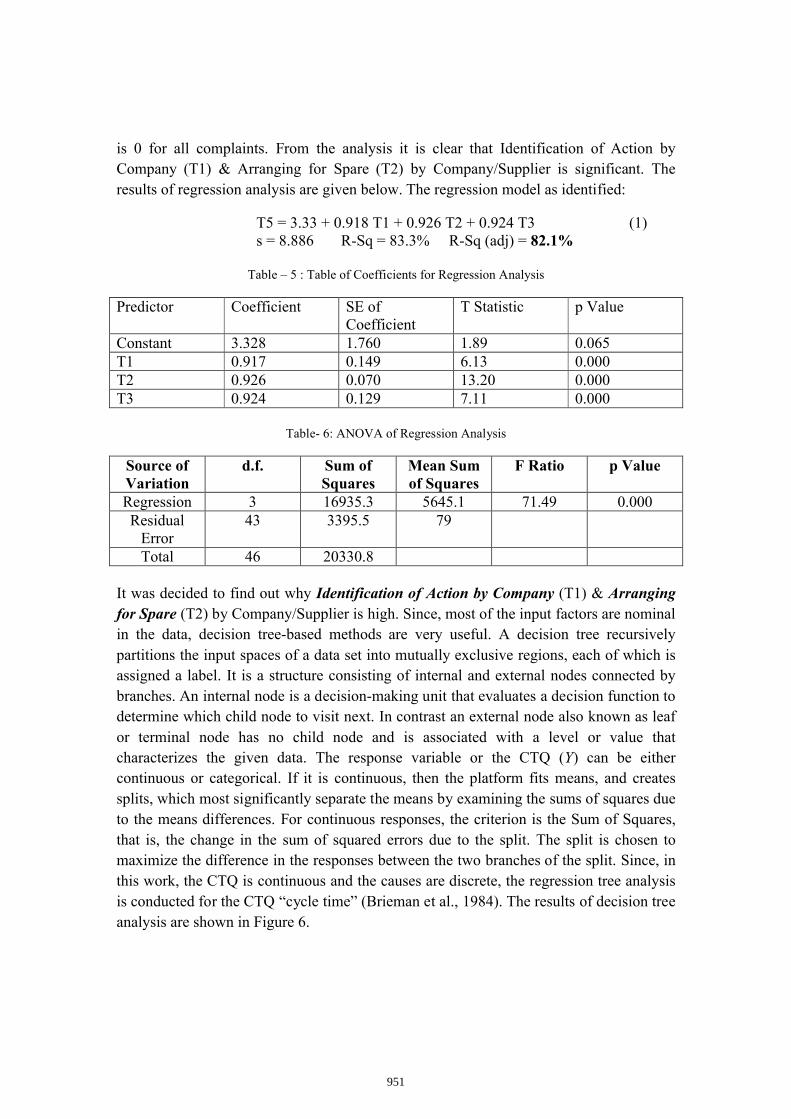
is 0 for all complaints. From the analysis it is clear that Identification of Action by Company (T1) & Arranging for Spare (T2) by Company/Supplier is significant. The results of regression analysis are given below. The regression model as identified:
T5 = 3.33 + 0.918 T1 + 0.926 T2 + 0.924 T3 (1)s = 8.886 R-Sq = 83.3% R-Sq (adj) = 82.1%
Table – 5 : Table of Coefficients for Regression Analysis
Predictor Coefficient SE of Coefficient
T Statistic p Value
Constant 3.328 1.760 1.89 0.065T1 0.917 0.149 6.13 0.000T2 0.926 0.070 13.20 0.000T3 0.924 0.129 7.11 0.000
Table- 6: ANOVA of Regression Analysis
Source of Variation
d.f. Sum of Squares
Mean Sum of Squares
F Ratio p Value
Regression 3 16935.3 5645.1 71.49 0.000Residual
Error43 3395.5 79
Total 46 20330.8
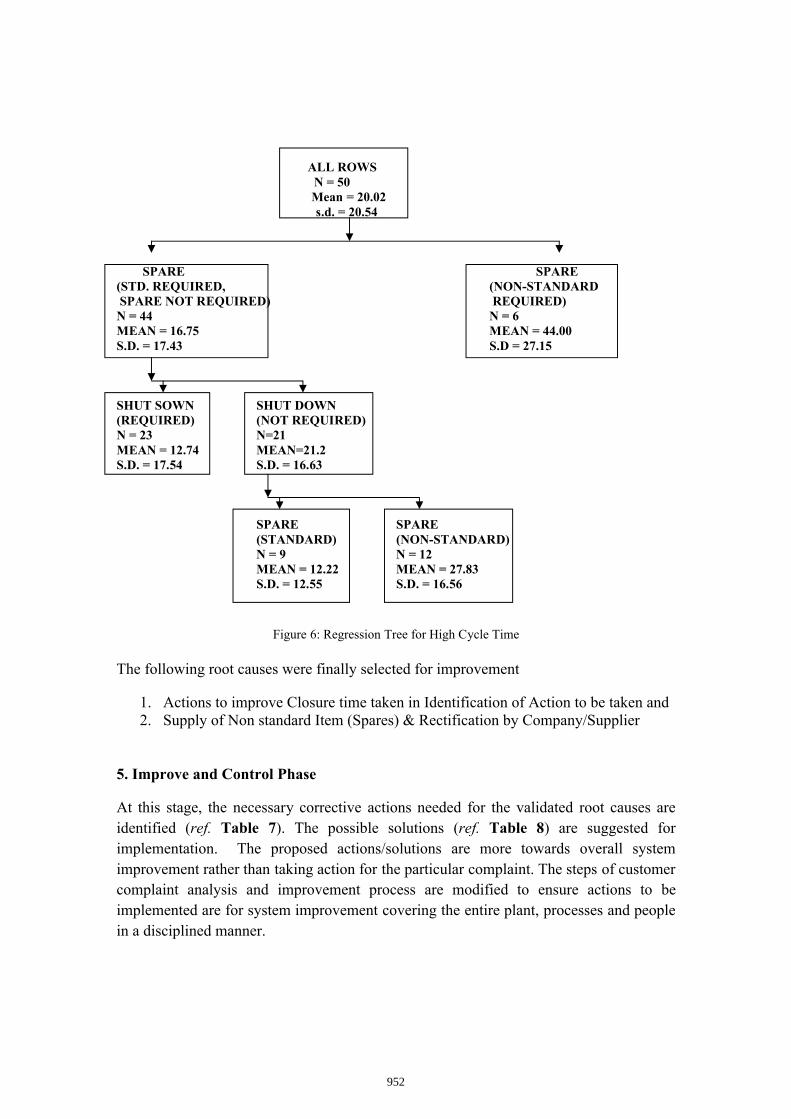
It was decided to find out why Identification of Action by Company (T1) & Arranging for Spare (T2) by Company/Supplier is high. Since, most of the input factors are nominal in the data, decision tree-based methods are very useful. A decision tree recursivelypartitions the input spaces of a data set into mutually exclusive regions, each of which is assigned a label. It is a structure consisting of internal and external nodes connected by branches. An internal node is a decision-making unit that evaluates a decision function to determine which child node to visit next. In contrast an external node also known as leaf or terminal node has no child node and is associated with a level or value that characterizes the given data. The response variable or the CTQ (Y) can be either continuous or categorical. If it is continuous, then the platform fits means, and creates splits, which most significantly separate the means by examining the sums of squares due to the means differences. For continuous responses, the criterion is the Sum of Squares, that is, the change in the sum of squared errors due to the split. The split is chosen to maximize the difference in the responses between the two branches of the split. Since, in this work, the CTQ is continuous and the causes are discrete, the regression tree analysis is conducted for the CTQ “cycle time” (Brieman et al., 1984). The results of decision tree analysis are shown in Figure 6.
951
ALL ROWS N = 50 Mean = 20.02
s.d. = 20.54
SPARE SPARE(STD. REQUIRED, (NON-STANDARDSPARE NOT REQUIRED) REQUIRED)N = 44 N = 6MEAN = 16.75 MEAN = 44.00S.D. = 17.43 S.D = 27.15
SHUT SOWN SHUT DOWN(REQUIRED) (NOT REQUIRED)N = 23 N=21MEAN = 12.74 MEAN=21.2S.D. = 17.54 S.D. = 16.63
SPARE SPARE(STANDARD) (NON-STANDARD)N = 9 N = 12MEAN = 12.22 MEAN = 27.83S.D. = 12.55 S.D. = 16.56
Figure 6: Regression Tree for High Cycle Time
The following root causes were finally selected for improvement
1. Actions to improve Closure time taken in Identification of Action to be taken and2. Supply of Non standard Item (Spares) & Rectification by Company/Supplier
5. Improve and Control Phase
At this stage, the necessary corrective actions needed for the validated root causes are identified (ref. Table 7). The possible solutions (ref. Table 8) are suggested for implementation. The proposed actions/solutions are more towards overall system improvement rather than taking action for the particular complaint. The steps of customer complaint analysis and improvement process are modified to ensure actions to be implemented are for system improvement covering the entire plant, processes and people in a disciplined manner.
952
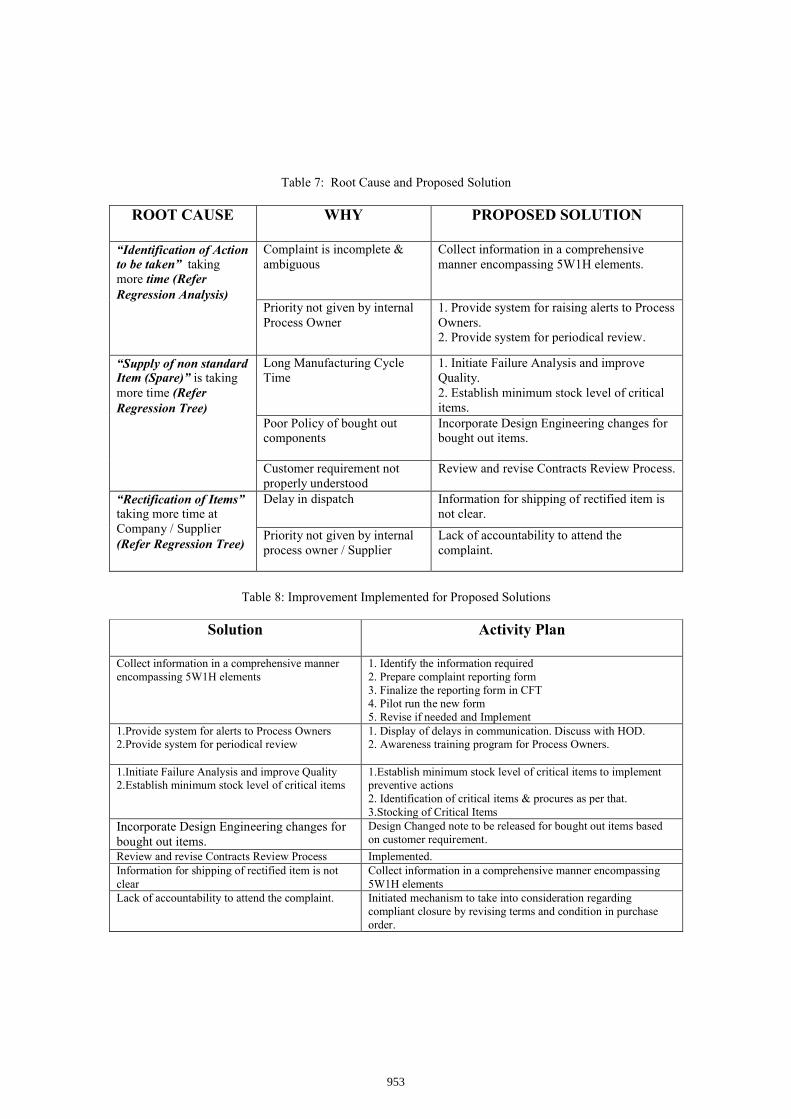
Table 7: Root Cause and Proposed Solution
ROOT CAUSE WHY PROPOSED SOLUTION
“Identification of Action to be taken” taking more time (Refer Regression Analysis)
Complaint is incomplete & ambiguous
Collect information in a comprehensive manner encompassing 5W1H elements.
Priority not given by internal Process Owner
1. Provide system for raising alerts to Process Owners.2. Provide system for periodical review.
“Supply of non standard Item (Spare)” is taking more time (Refer Regression Tree)
Long Manufacturing Cycle Time
1. Initiate Failure Analysis and improve Quality.2. Establish minimum stock level of critical items.
Poor Policy of bought out components
Incorporate Design Engineering changes for bought out items.
Customer requirement not properly understood
Review and revise Contracts Review Process.
“Rectification of Items”taking more time at Company / Supplier (Refer Regression Tree)
Delay in dispatch Information for shipping of rectified item is not clear.
Priority not given by internal process owner / Supplier
Lack of accountability to attend the complaint.
Table 8: Improvement Implemented for Proposed Solutions
Solution Activity Plan
Collect information in a comprehensive manner encompassing 5W1H elements
1. Identify the information required2. Prepare complaint reporting form3. Finalize the reporting form in CFT4. Pilot run the new form5. Revise if needed and Implement
1.Provide system for alerts to Process Owners2.Provide system for periodical review
1. Display of delays in communication. Discuss with HOD.2. Awareness training program for Process Owners.
1.Initiate Failure Analysis and improve Quality2.Establish minimum stock level of critical items
1.Establish minimum stock level of critical items to implement preventive actions2. Identification of critical items & procures as per that.3.Stocking of Critical Items
Incorporate Design Engineering changes for bought out items.
Design Changed note to be released for bought out items based on customer requirement.
Review and revise Contracts Review Process Implemented.Information for shipping of rectified item is not clear
Collect information in a comprehensive manner encompassing 5W1H elements
Lack of accountability to attend the complaint. Initiated mechanism to take into consideration regarding compliant closure by revising terms and condition in purchase order.
953
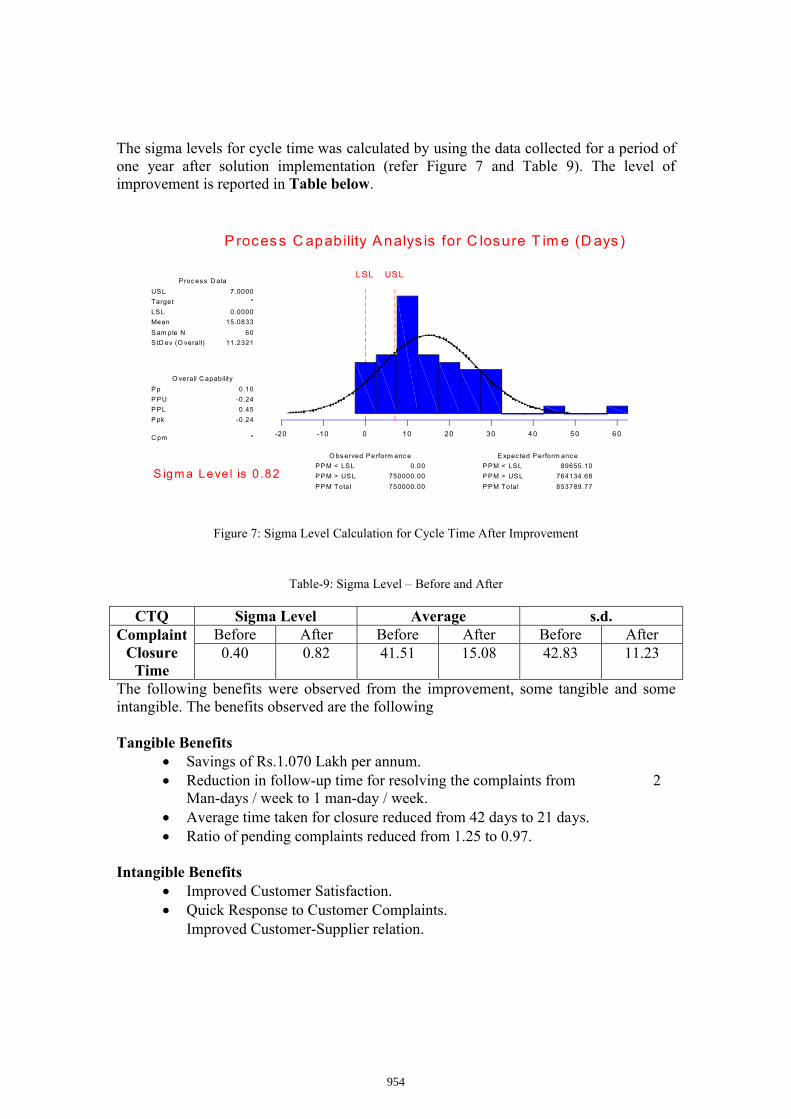
The sigma levels for cycle time was calculated by using the data collected for a period of one year after solution implementation (refer Figure 7 and Table 9). The level of improvement is reported in Table below.
Figure 7: Sigma Level Calculation for Cycle Time After Improvement
Table-9: Sigma Level – Before and After
CTQ Sigma Level Average s.d.Complaint
Closure Time
Before After Before After Before After0.40 0.82 41.51 15.08 42.83 11.23
The following benefits were observed from the improvement, some tangible and some intangible. The benefits observed are the following
Tangible Benefits Savings of Rs.1.070 Lakh per annum. Reduction in follow-up time for resolving the complaints from 2
Man-days / week to 1 man-day / week. Average time taken for closure reduced from 42 days to 21 days. Ratio of pending complaints reduced from 1.25 to 0.97.
Intangible Benefits Improved Customer Satisfaction. Quick Response to Customer Complaints. Improved Customer-Supplier relation.
-20 -10 0 10 20 30 4 0 5 0 6 0
LSL USL
P rocess C apability A nalys is for C losure T im e (D ays )
USL
Target
LSL
Mean
S am ple N
S tD ev (O verall)
P p
P PU
P PL
P pk
C pm
PP M < LS L
PP M > US L
PP M Total
P PM < LSL
P PM > US L
P PM Total
7.0000
*
0.0000
15.0833
60
11.2321
0.10
-0.24
0.45
-0.24
*
0.00
750000.00
750000.00
89655.10
764134.68
853789.77
Proc es s D ata
O verall C apability
O bs erved Perform anc e E xpec ted P erform anc e
S igm a Leve l is 0 .82
954
6. Discussions
This project has substantially benefitted the organization by reducing the follow-up time for customer complaint resolution, lowering the closure time and decreasing the ratio of pending complaints. The DMAIC approach of Six Sigma is a systematic methodology utilizing training, measurement and data analysis tools to identify the root causes of high cycle time and also eliminate these causes for improving the current process and thus achieving better results. The qualitative and quantitative tools helped to identify, prioritise and validate the possible root causes and their interrelationship to the CTQ’s (y). Specifically, Six Sigma DMAIC methodology allows effective problem definition, allows for use of data rather than trials and conjecture during critical decision making, helps study team to think about the process, and provides an approach for managing real improvements. This study demonstrates a project in which Six-Sigma is adopted to improve the customer complaint resolution process of an organization. It describes how the project was specified, how the tools were employed in the different phases to identify, improve and control the correct sources of variation resulting into excessive cycle time. Successful selection and implementation of corrective actions reduced the occurrence and severity of the root causes and thus improved the process performance. This proves that the DMAIC methodology of Six Sigma can be applied to any process, to improve the process performance, where the root causes of process problems are not known. This paper will be of interest to academic researchers and practical managers. It describes the justification and selection of the project, how the tools and techniques of DMAIC methodology were employed in the different phases and how the improvement actions were implemented. This project methodology can be used generally to reduce cycle time for any other transactional processes as well, which will help in reduce response time to customer issue, improve customer-supplier relation and finally improve customer satisfaction. However, they can modify the detailed contents and tools according to the organizational condition, selection of variables for analysis & availability of data.
Additional benefits were observed in this work, including the employee participation in Six Sigma project. The management was impressed with the analysis generated by the Six Sigma project. To make the Six Sigma principle a culture of the organization, a guideline was developed to ensure that problem solving of similar nature should be tackled in the similar fashion.
955
7. References
1. Kwak, Y. H., & Anbari, F. T., 2006, “Benefits, obstacles and future of six sigma approach,” Technovation, 26, 708-715.
2. Mahanti, R., & Antony, J., 2005, “Confluence of six sigma, simulation and software development,” Managerial Auditing Journal, 20, 739-762.
3. Chun-Chin, Wei, Gwo-Ji, Sheen, Cheng-Ting, Tai, & Kuo-Liang Lee, 2010, "Using Six Sigma to improve replenishment process in a direct selling company," Supply Chain Management: An International Journal, 15(1), 3 – 9.
4. Chao-Ton, Su, Chia-Jen, & Chou, 2008, “A systematic methodology for the creation of Six Sigma projects: A case study of semiconductor foundry,” 34(4), 2693-2703.
5. Coronado, R. B., & Antony, J., 2002, “Critical success factors for the successful implementation of six sigma projects in organizations,” The TQM Magazine, 14(2), 92-99.
6. Xingxing, Zu, Lawrence, D., Fredendall, & Thomas, J., Douglas, 2008, “The evolving theory of quality management: The role of Six Sigma,” Journal of Operations Management, 26(5), 630 – 650.
7. Park, S. H., 2002, “Six sigma for productivity improvement: Korean business corporations,” Productivity Journal, 43(2), 173-183.
8. Henderson, K. M., & Evans, J. R., 2000, “Successful implementation of six sigma: Benchmarking general electric company,” Benchmarking an International Journal, 7(4), 260-281.
9. Rajagopalan, R., Francis, M., & Suarez, W., 2004, “Developing novel catalysts with six sigma,” Research Technology Management, 48 (6), 377-391.
10. Roberts, C. M., 2004, “Six sigma signals,” Credit Union Magazine, 70(1), 40-43.
11. Das, P., 2005, “Reduction in delay in procurement of materials using six sigma philosophy,” Total Quality Management and Business Excellence, 16(5), 645-656.
12. Das, N., Gauri, S., & Das, P., 2006, “Six Sigma Principles in Marketing – An Application,” International Journal of Six Sigma and Competitive Advantage, 2(3), 243-262.
13. Das, P., Roy, S., & Antony, J., 2007, “An Application of Six Sigma Methodology to reduce lot-to-lot Shade Variation of Linen Fabrics,” Journal of Industrial Textiles,36(3), 227-251.
14. Ray, S., & Das, P., 2009, “Improving efficiency and effectiveness of APQP process by using DFSS tools,” International Journal of Six Sigma and Competitive Advantage, 5(3), 222–236.
15. Feng, Q., & J., Antony, 2010, “Integrating DEA into Six Sigma methodology for measuring health service efficiency,” Journal of the Operational Research Society, 61, 1112–1121.
16. Darshak, A., Desai, & Mulchand, B. Patel, 2009, “Impact of Six Sigma in a developing economy: analysis on benefits drawn by Indian industries,” Journal of Industrial Engineering and Management, 2(3).
956
17. Bunce, M. M., Wang, L., & Bidanda, B., 2008, “Leveraging Six Sigma with industrial engineering tools in crate less retort production,” International Journal of Production Research, 46(23), 6701 – 6719.
18. Gopesh, A., Peter, T., Ward, & Mohan, V., Tatikonda, 2010, “Role of explicit and tacit knowledge in Six Sigma projects: An empirical examination of differential project success,” Journal of Operations Management, 28(4), 303 – 315.
19. Porter, L., 2001, The Six Sigma handbook, London: McGraw-Hill.20. Montgomery, D. C., 2002, Introduction to Statistical Quality Control, 4th Edition,
Wiley India (P) Ltd., New Delhi, India.21. Brieman, L., Friedman, J. H., Olshen R. A., & Stone, C. J., 1984, Classification and
Regression trees, Chapman and Hall, NY.22. Draper, N. R., & Smith, H., 1998, Applied Regression Analysis, Wiley Series in
Probability and Statistics.
957