Embed Size (px)
Citation preview

IMPROVED CARRIER BLOCKING PROPERTIES OF INTERFACE IN
CRYOGENIC PARTICLE DETECTORS
A Thesis
by
ABHIRAM DINAVAHI
Submitted to the Office of Graduate and Professional Studies of
Texas A&M University
in partial fulfillment of the requirements for the degree of
MASTER OF SCIENCE
Chair of Committee, H. Rusty Harris
Committee Members, Nader Mirabolfathi
Philip Hemmer
Steven M. Wright
Head of Department, Miroslav M. Begovic
August 2019
Major Subject: Electrical Engineering
Copyright 2019 Abhiram Dinavahi

ii
ABSTRACT
Sensitivity of cryogenic particle detectors suffers from various loss and leakage
mechanisms which influence carrier transport in the bulk and interface layers of the
detectors. Suppressing- and wherever possible, eliminating- such loss mechanisms is
imperative to lowering the noise floor of detectors to enable detection of characteristically
weak energy signatures of exotic particle interactions. This work investigates one such
loss mechanism– tunneling driven carrier leakage through the interface stack in particle
detectors– and focuses on remodeling the stack composition and associated fabrication
processes to mitigate such leakage. Measures to improve carrier blocking properties in the
interface are explored with an aim to lower the steady state leakage and thereby improve
detector sensitivity.
This study aims at identifying and implementing measures to combat carrier
tunneling through the interface. As part of such efforts, novel distributions of 40nm
interface-thickness budget of SiO2 and poly-crystalline Silicon have been tested for their
capabilities of suppressing tunneling mechanisms. This comes as a modification to the
previously proposed 20nm+20nm configuration of SiO2+pc-Si which, while being a
significant improvement over the traditionally used amorphous-Si interface, has still been
shown to be inadequate in blocking carriers. Interface processing modifications aimed at
suppressing trap-mediated tunneling mechanisms by way of annealing the devices
following SiO2 deposition have been explored. Rapid thermal processing at 600oC has

iii
been found to decrease the leakage by over an order of magnitude at 22K, which while
being promising, still leaves room for improvement.
CO2 laser annealing has been identified as an option for selectively annealing only
the SiO2 film at high temperatures (~1500oC) thereby leaving the substrate purity
uncompromised. Laser annealing has been performed at different power levels and scan
speeds to identify the highest usable temperature that does not result in pinhole defects in
the film. Room temperature and cryogenic characterization has been performed on these
devices to evaluate their carrier blocking properties. At 20K, laser annealed devices have
been found to exhibit leakage three orders of magnitude lower than as deposited samples
and two orders lower than rapid thermal processed devices.

iv
DEDICATION
To my family…
v
ACKNOWLEDGEMENTS
I would like to thank my advisor Dr. Harris for trusting my enthusiasm and giving
me the opportunity to work on cryogenic particle detectors, despite minimal academic
background in Physics. I would also like to thank him for his constant help and guidance
throughout the duration of this work, research-related and otherwise.
I would also like to thank my committee members, Dr. Mirabolfathi, Dr. Hemmer
and Dr. Wright for agreeing to be on my committee and for their timely responses to my
requests.
Nearly two and a half years after joining Dr. Harris’ team, I am confident my work
in this duration will make for a meaningful contribution to cryogenic detector design and
for that I would like to thank Michael, Alex, William and everyone else in the team for
sharing their knowledge and training me patiently on numerous equipment. I would also
like to thank Larry, Sam, Greg, Ethan and the entire AggieFab staff, without whom I would
not have been able to complete this work.
I would like to thank Prof. Pat Wallace of IDIS department for employing me as
his TA and for the numerous occasions in which he went way beyond the ordinary to help
me out.
Finally, I would like to thank my parents and my brother for their constant support
in all my endeavors. Their support cannot be overstated.

vi
CONTRIBUTORS AND FUNDING SOURCES
Contributors
This work was supervised by a thesis committee consisting of Dr. H. Rusty Harris
[advisor], Dr. Philip Hemmer and Dr. Steven M. Wright of the Department of Electrical
and Computer Engineering and Dr. Nader Mirabolfathi of the Department of Physics and
Astronomy.
All the work conducted for the thesis was completed by the student independently.
Funding sources
Graduate study was supported by one-time scholarship from the Department of
Electrical and Computer Engineering and Graduate Teaching Assistantship from Texas
A&M University.
This work was also made possible in part by the Department of Energy under Grant
Number DE-AC02-76SR00512. Its contents are solely the responsibility of the authors
and do not necessarily represent the official views of the Department of Energy.

vii
NOMENCLATURE
WIMP Weakly Interacting Massive Particle
CDMS Cryogenic Dark Matter Search
MOS Metal-Oxide-Semiconductor
F-N Fowler-Nordheim
F-P Frenkel-Poole
TAT Trap Assisted Tunneling
pc-Si Poly-crystalline silicon
RTP Rapid Thermal Processing
viii
TABLE OF CONTENTS
Page
ABSTRACT .......................................................................................................................ii
DEDICATION .................................................................................................................. iv
ACKNOWLEDGEMENTS ............................................................................................... v
CONTRIBUTORS AND FUNDING SOURCES ............................................................. vi
NOMENCLATURE .........................................................................................................vii
TABLE OF CONTENTS ............................................................................................... viii
LIST OF FIGURES ............................................................................................................ x
LIST OF TABLES ......................................................................................................... xiii
CHAPTER I INTRODUCTION ........................................................................................ 1
1.1 Introduction to Dark Matter and WIMPs ....................................................... 1 1.2 Detection Approaches .................................................................................... 3 1.3 Phonon Signal Generation and Measurement ................................................ 6
1.4 Ionization Signal Generation and Measurement ............................................ 9 1.5 Outline of this thesis ..................................................................................... 15
CHAPTER II INTERFACE LEAKAGE MECHANISMS ............................................. 17
2.1 Electric Field Calculation in MOS devices .................................................. 18 2.2 Thermionic Emission ................................................................................... 22 2.3 Direct Tunneling ........................................................................................... 23 2.4 Fowler-Nordheim Tunneling ........................................................................ 26
2.5 Trap Assisted Tunneling .............................................................................. 28 2.6 Frenkel Poole emission ................................................................................ 30
CHAPTER III INTERFACE DESIGN: COMPOSITION AND PROCESSING ........... 34
3.1 Interface leakage measurements ................................................................... 34 3.2 Modifications to the interface: possibilities and restrictions ........................ 42 3.3 Proposed interface modifications and results ............................................... 46

ix
CHAPTER IV CO2 LASER ANNEALING .................................................................... 56
4.1 Temperature calculations for laser irradiation .............................................. 58
4.2 Laser scan parameters .................................................................................. 59 4.3 Room temperature I-V measurements .......................................................... 62 4.4 C-V measurements ....................................................................................... 64 4.5 Cryogenic Measurements ............................................................................. 67
CHAPTER V CONCLUSIONS ....................................................................................... 70
REFERENCES ................................................................................................................. 72

x
LIST OF FIGURES
Page
Figure 1: Direct Detection Landscape: Collaborations, signals measured, and
materials used ..................................................................................................... 5
Figure 2: Transition Edge in tungsten (adapted from Scott Hertel’s dissertation):
Biasing the tungsten TES in the transition region results in a sharp transition
between zero and non-zero resistance states for very small addition/removal
of heat ................................................................................................................. 8
Figure 3: a. Generation and collection of the ionization signal in silicon/germanium
detectors; b. Image charge generation and leakage at the interface; c. Signal
collection through charge amplifier; d. Equivalent circuit model for c. ............. 9
Figure 4: Collection efficiency of ionization signal: (a) Known radiation () is used to
calibrate the detector for ionization signal collection. Signal from holes is
collected for positive bias voltages and from electrons for negative bias; b.
“Absolute Seagull plot”: Absolute calibration of the ionization signal
efficiency compared to scaled 60keV recoil data of 241Am (adapted from
Arran Phipps’ dissertation) ............................................................................... 12
Figure 5: Charge Noise Power Spectrum for nominally identical charge channels in
T1Z1 detector; Intrinsic low frequency noise can be augmented by several
noise sources including shot noise, flicker noise and microphonics (adapted
from Arran Phipps’ dissertation) ...................................................................... 14
Figure 6: Energy band diagram showing the voltage drops across an MOS structure;
energy levels simulated for 20nm W/20nm SiO2/ p-type Si stack with NA =
1E16 cm-3 and VG = 2V at 300K using Band Diagram Program [13]. ............. 18
Figure 7: Surface Charge, Qs; Surface Potential, s; oxide voltage, Vox and electric
field across the interface, Eox as functions of gate voltage, VG. ....................... 21
Figure 8: Schottky/Thermionic emission over an energy barrier ..................................... 22
Figure 9: Schottky emission of a. electrons and b. holes at Si/SiO2 barrier; a. and b.
show n-type and p-type Si substrates respectively ........................................... 23
Figure 10: Quantum Mechanical Tunneling through an energy barrier. 1 and 3
correspond to traveling wave functions in regions 1 and 3, whereas 2
represents an evanescent wave function, giving electrons an exponentially
decaying probability along x. ............................................................................ 24

xi
Figure 11: Direct tunneling of electrons and holes in MOS structure ............................. 25
Figure 12: Theoretical Direct tunneling current density calculated using eq (2.8)
through Si/SiO2 interface for oxide thicknesses of: a. 1nm, b. 2nm and c.
5nm ................................................................................................................... 26
Figure 13: Direct tunneling (left) transforming into Fowler-Nordheim tunneling
current (right) in an MOS device as the bias voltage is increased (device
pushed further into accumulation) .................................................................... 27
Figure 14: Trap Assisted Tunneling through a barrier ..................................................... 29
Figure 15: Frenkel-Poole emission: Electrostatic potential energy of an ionized atom
(left) superimposed onto the energy band of a dielectric in an external
electric field (center) resulting in a lowered barrier for trapped carriers
(right); PF indicates the reduction in the barrier height (energy) because
of the trap state being charged .......................................................................... 31
Figure 16: Cross-sectional view of detectors developed .................................................. 34
Figure 17: a. Room Temperature Current-Voltage characteristics with the device
configuration: p-Si/SiO2(20nm)/pc-Si(20nm)/W(40nm); also shown in b., c.
and d. are the J-E relationships to analyze Fowler-Nordheim, Trap-assisted
and Frenkel-Poole tunneling mechanisms. Orange overlay shows a straight
line fit with the equation and R2 value for the fit. ............................................ 36
Figure 18: Leakage in practical MOS devices: a. ideal MOS capacitor model; b.
Equivalent circuit model of a practical MOS-C with the DC steady state
tunneling path highlighted in red; ..................................................................... 38
Figure 19: C-V (left) and Gp-V (right) data from measurement (C and Gp normalized
with respect to the top contact area) ................................................................. 39
Figure 20: Gp/ -V curves a. as measured and b. corrected for Rs using data from Fig
3.4 (C and Gp normalized with respect to the top contact area) ....................... 40
Figure 21: Gp/ - curves: Gp/ plotted as a function of frequency to determine the
trap state concentration at different frequencies: Obtained by corrected data
from Fig 3.4 for Rs ............................................................................................ 41
Figure 22: Current-Voltage characteristics of four samples illustrating impact of:
change of SiO2 thickness to 33nm, RTP of 20nm SiO2 at 600oC and RTP of
33nm SiO2 at 600oC. ......................................................................................... 49

xii
Figure 23: Suppression of F-P and TAT upon changing SiO2 layer thickness from
20nm to 33nm: analysis performed on data shown in Fig 22 ........................... 50
Figure 24: Suppression of F-P and TAT through Rapid Thermal Annealing: F-P has
been nearly eliminated, while TAT has been suppressed. ................................ 51
Figure 25: Cryogenic characterization (22K) of the fabricated devices .......................... 52
Figure 26: MOS device viewed as two series capacitors at cryogenic temperatures ....... 53
Figure 27: Frenkel-Poole analysis at 22K. RTP annealed samples show suppression of
F-P through the elimination of regions with slope ~0.2 ................................... 54
Figure 28: Absorption coefficient of SiO2 at 25oC [adapted from [30]] .......................... 56
Figure 29: Densifying impact of laser annealing on 45nm SiO2 film .............................. 60
Figure 30: Wet etch rates of SiO2 for different power levels. Scan speed has been
fixed at 1.5cm/s during all laser anneals ........................................................... 61
Figure 31: Microscope images of SiO2 film: Pinhole formation as a function of laser
power. Scan speed has been kept constant at 15mm/s ...................................... 62
Figure 32: Room Temperature J-V measurements on Ge/SiO2/W devices ..................... 63
Figure 33: Room temperature I-V characterization: Si/SiO2/W devices ......................... 64
Figure 34: C-V measurements: impact of laser annealing: Ge/SiO2/W devices .............. 65
Figure 35: Gp-V measurements: impact of laser annealing: Ge/SiO2/W devices ............ 66
Figure 36: Comparison of Gp/ vs curves for as-deposited and laser annealed
devices: Laser annealing demonstrates a decrease in interface trap density .... 66
Figure 37: Cryogenic I-V Measurements – leakage hits noise floor for T<15K ............. 68
Figure 38: Leakage comparison in as-deposited, RTP annealed and laser annealed
devices at 20K ................................................................................................... 69
Figure 39: Leakage comparison in devices annealed at 10W power at 10mm/s scan
speed and 8W-10mm/s scan; increased leakage in the former can be
attributed to pinhole formation ......................................................................... 69

xiii
LIST OF TABLES
Page
Table 1: Mathematical formulations of F-N, TAT and F-P tunneling mechanisms ........ 35

1
CHAPTER I
INTRODUCTION
Numerous collaborations are actively involved in cryogenic detector development
today searching for exotic particles and particle interactions: dark matter candidates,
neutrino-less double beta decay and coherent neutrino-nucleus scattering to name a few
[1]. Since the work presented in this thesis has been carried out primarily based on efforts
directed towards detection of dark matter candidates called Weakly Interacting Massive
Particles (WIMPs), they are used as the generic example throughout this thesis to describe
detection principles wherever necessary. This choice helps preserve simplicity,
considering that the outcomes of this research do not necessarily depend on the exact
particle interaction being sought; the focus is on factors influencing collection of the signal
generated during an interaction event rather than the physics of the event itself.
1.1 Introduction to Dark Matter and WIMPs
Astronomers began picking evidence of dark matter nearly 80 years ago when they
noticed that the observed masses of galaxies were too low to justify the measured radial
speeds of stars in those galaxies [2] [3]. This observation formed the basis for a “missing
mass” in the Universe which evaded telescopic detection. Although initially argued to be
an artefact of limited resolution of telescopes, gravitational lensing studies and galactic
rotation curves have helped established that the missing mass does correspond to matter
unknown to mankind. Further, Vera Ruben, in 1980 observed that the radial speeds of
stars remained fairly independent of the distance from the center of the galaxy, thus

2
indicating that the extra mass had a concentric distribution about the galactic center and
contributed to significantly more mass than regular matter, while extending farther out
from the center [4]. Several other studies also have postulated the existence of dark matter
and it is now reliably estimated that dark matter constitutes about 83% of the total mass
of the Universe.
Particles through which dark matter manifests are required to explain the local
mass densities while being (at least primarily) non-baryonic and not interacting noticeably
with baryonic matter. Dark matter particles are expected to have very low interaction
cross-sections, such that annihilation with anti-particles in the early Universe was
extremely rare. Supersymmetric models predict dark matter candidates to have huge
masses between 10-1000 GeV/c2 scale and absence of co-annihilation of particles of such
energies requires collision cross-sections of the order of 10-40 cm2. This cross-section
corresponds to the weak nuclear force, which makes a Weakly Interacting Massive
Particle (WIMP) a prospective candidate for dark matter. An extensive review of the
candidates for dark matter and motivation for WIMPs can be found in S. Golwala’s
dissertation [5]. However, masses well below the 10GeV/c2 limit, lighter than 1GeV/c2
are being actively pursued based on new theoretical models.
Although not much is known on dark matter yet, a summary of the properties
understood is as follows (from Scott Hertel’s dissertation [6]): Dark Matter is at least
primarily non-baryonic and cold (non-relativistic), cannot dissipate energy easily (as
baryons do through radiation or by falling into potential wells), is nearly collisionless with
both itself and surrounding baryonic matter and is stable over cosmological timescales.

3
1.2 Detection Approaches
Available knowledge on dark matter helps develop models for dark matter
candidates but narrowing down the plausible candidates and developing a comprehensive
understanding of the nature and properties of dark matter requires experimental data.
Hence, design and development of dark matter detectors has been a very important area
of research for over three decades now. Dark matter detection (or the detection of any
particle, for that matter) involves the search for energy or momentum signatures of particle
interactions. The philosophy behind design of detectors primarily comprises three
approaches based on the signal pursued: Collider experiments employing particle
accelerators, Indirect detection and Direct detection. It needs to be emphasized that these
detection approaches are often complementary to each other, in that collider-based
experiments have good sensitivity for WIMPs at low mass scale, while direct detection
studies have better sensitivity for larger mass WIMP models, hence keeping all approaches
prospective.
Particle accelerators like the Large Hadron Collider search for WIMPs in the
form of missing momentum during event reconstruction. Collision-based detection is
complicated by the fact that it searches for a missing signal, which requires extensive
collection of all processes in the collider and then isolating non-WIMP processes. Also,
not all WIMP models developed can be probed using colliders, not to mention the models
yet to be conceived.
Indirect detection experiments look for co-annihilation signatures and hence,
naturally, are focused at probing regions with large expected dark matter density.

4
However, before an energy signature can be attributed to a WIMP interaction, every other
baryonic process must be ruled out thus demanding extensive knowledge of the baryonic
portion of the region being probed. Also, regions of large dark matter density also happen
to have large baryonic matter density which can result in WIMP signatures being swamped
by radiative processes involving ordinary matter.
Direct Detection techniques are based on the premise that the search for energy
signatures of dark matter candidates need not necessarily be carried out through
observation of far-away galaxies; it can be done on the Earth (or anywhere else in the
Universe, for that matter) just as convincingly since WIMPs, if exist, are expected to be
everywhere. WIMPs of ~100GeV mass have an expected flux of ~5x10⁴ particles per cm2
per second on the Earth which makes it reasonable to assume that the interaction of a
WIMP with a detector placed on the Earth eventually occurs, however low the collision
cross-sections of WIMPs may be. However, the primary issue remains the sensitivity of
the detectors- or rather the lack of it- to detect this interaction. The detector is exposed to
multiple sources of radiation on the surface of the Earth which can interact with the
detector more often and more energetically, thus potentially swamping the WIMP signal
(if any). This requires that the detector be shielded effectively from sources of radioactivity
and radiation, making underground mines (e.g. Soudan mine and Jinping underground
laboratory in China) suitable locations to place the detectors. Even after eliminating
interaction events from undesirable sources through effective shielding, the detectors
themselves house several carrier trapping and leakage mechanisms, which sets the noise
floor of the detector and thereby its sensitivity.

5
WIMPs passing through the detector can interact with electrons or nuclei. Elastic
electron recoils of WIMPs are extremely weak and only deposit energies of ~10eV, while
elastic nuclear recoils can result in energies as high as 10keV, provided the mass of the
WIMP matches the atomic mass of the detector (more on this in Section 3.2) [7]. Direct
detection experiments collect the signal from such recoils and distinguish electron recoils
from nuclear recoils to determine the energy of the interacting particle.
Figure 1: Direct Detection Landscape: Collaborations, signals measured, and
materials used
Energy deposited in a detector by any interaction event results in one or more of
the following signals: 1. Phonons released from the vibration of lattice (wiggling of the
nucleus and Joule heating of the detector as carriers drift trough the detector) 2.
Scintillation from photons released upon de-excitation of electrons excited by the
interaction event and 3. Ionization signal generated from the primary electrons (and holes)
liberated during the interaction and subsequent secondary electrons released as the
primary electrons are accelerated across the detector. Direct detection experiments can

6
choose to detect one or more of these signals and the choice of the detector material and
design methodology accordingly depend on the signals being pursued. Figure 1 illustrates
different collaborations involved in direct detection experiments, the signals pursued by
each and the popular material choice(s) for the detector (adapted from Ben Shank’s
dissertation [8]).
1.3 Phonon Signal Generation and Measurement
Collection of phonon signal constitutes a very important role in several large
collaborations involved in direct detection efforts. Phonon signal collection at room
temperature is not feasible due to thermal vibrations and thermodynamic limitation on
energy resolution (∆𝐸 = √𝑘𝐵𝑇2𝐶; C is the specific heat of the detector, kB, the Boltzmann
constant and T, the temperature). In the early 1990’s, cryogenic particle detectors have
emerged as the solution to overcome both these problems: thermal lattice vibrations are
lower at low temperatures resulting in a lower phonon noise floor and specific heat of
Debye materials scales as C ∝ MT3 (M being the mass) at low temperatures, which results
in an appreciably larger temperature change for a given heat deposition. However, it needs
to be acknowledged that the motivation for cryogenic detectors comes from several factors
not limited to the phonon signal collection; lower electrical noise at low temperatures also
forms a very important factor in operating detectors at sub-milli-kelvin temperatures.
Phonons generated by the particle interaction event form only a (small) portion of
the total phonon signal; the usually-more-significant contribution comes from secondary
phonons, also called Luke phonons for being borne out of the Luke-Neganov amplification

7
technique [9]. Primary electrons released from the event are accelerated across the detector
using high bias voltages, which result in large electric fields. These electrons gain kinetic
energy as they are accelerated by external fields and the energy lost to lattice collisions
results in vibration of the lattice thereby generating Luke phonons. Luke phonons, along
with primary phonons, constitute the phonon signal. It needs to be emphasized that
primary phonons result from the energy deposition characteristics of the interaction event,
while Luke phonons depend on the external bias voltage. Hence, strengthening the phonon
signal can be realized only through Luke phonons. Recombination of electrons and holes
created in the indirect band-gap substrate of the detector forms another important source
of phonons in detectors.
Sensing the phonon signal in the form of a temperature change has serious
limitations, primarily because a large volume, while being desirable to achieve a large
detector mass, results in a lowered temperature change for a given phonon signal, thereby
increasing the energy threshold. Also, as phonons scatter, they decay into phonons of
lower energies and the process continues uninhibited as phonons can relax all the way to
zero energy. Hence, the phonon signal can be lost to “thermalization” in the substrate as a
consequence of phonons decaying into a large number of child phonons each carrying an
infinitesimal energy, too small to be resolved and detected. Upon thermalization in the
substrate, phonons lose critical information like the location, type and timing of the event.
Hence, it is desirable to sense the phonon signal “athermally” before the large heat
capacity of the detector (with a very large volume) ends up consuming the phonon signal
to increase the temperature [6].

8
Sensing of the phonon signal is achieved through Bogoliubov quasiparticles,
which are long lived excited states that can be excited from phonons and can eventually
transfer their energy into appropriate sensors. A brief discussion of phonon sensing has
been provided in Section 3.2. Description and discussion of Bogoliubov quasiparticles can
be found in extensive detail in several dissertations on CDMS experiments.
Transition Edge Sensors (TES) are used for “Quasiparticle trapping”. TES are
superconductors and hence, their electrical resistance is highly sensitive to temperature
when biased near their superconducting transition temperature. The TES, which is voltage
biased, responds to addition (removal) of heat by a marked increase (decrease) of
resistance, which in turn translates into a significant decrease (increase) in current drawn
from the voltage source. Thus, the change in the current flowing through the TES serves
as a measurement that allows accurate calculation of energy deposited in the form of heat,
i.e. phonon signal.
Figure 2: Transition Edge in tungsten (adapted from [6]): Biasing the tungsten TES
in the transition region results in a sharp transition between zero and non-zero
resistance states for very small addition/removal of heat

9
1.4 Ionization Signal Generation and Measurement
This thesis primarily focuses on direct detection experiments involving ionization
signal measurement. The energy deposited by an interaction event in the bulk of a detector
liberates valence electrons from the nucleus involved in the interaction thereby
contributing to primary electrons. However, this signal is typically weak and needs to be
amplified to be measurable. Luke-Neganov amplification is once again the technique used,
similar to the amplification of phonon signal.
Figure 3: a. Generation and collection of the ionization signal in silicon/germanium
detectors; b. Image charge generation and leakage at the interface; c. Signal
collection through charge amplifier; d. Equivalent circuit model for c.

10
As described in section 1.3, primary electrons are accelerated by a large external
field and these electrons drift across the detector. As these electrons drift, lattice collisions
lead to Joule heating of the detector generating Luke phonons, while electron interactions
result in more valence electrons being excited and influenced by the electric field. As more
electrons are pulled out of the valence band and accelerated, electron collisions become
more frequent, thereby amplifying the electrical signals. Electrons released through
transfer of energy from accelerated primary electrons are called secondary electrons. Both
the primary and secondary electrons (and holes) constitute the ionization signal.
The substrate is electrically frozen at extremely low temperatures thus keeping the
thermal electrical noise to a minimum. The detector is voltage biased such that ideally, no
current flows in steady state and any interaction event that generates electrons and holes
results in the carriers being accelerated towards the electrical contacts while generating
secondary carriers in the process. The carriers drift until they reach the interface layer
where they accumulate and force an image charge to appear on the other face of the
interface to maintain charge balance. In a p-type substrate, this scenario can be visualized
as holes accumulating on one face of the interface, thus creating an image positive charge
accumulation on the other face. This accumulation of positive charge draws electrons from
the power source to counter the charge imbalance arising from the positive image charge
thus causing a current flow in the biasing circuit. Hence, ideally, a current flow is only
observed when an interaction event occurs, and the electrons and holes generated during
that event cause a change in the steady state charge stored on the interface. However, in
practice, several loss and leakage mechanisms exist in the detector, some preventing the

11
carriers from reaching the interface and others, contributing to steady state leakage,
effectively affecting the ionization signal collection. The next section introduces few
mechanisms contributing to ionization signal loss in the detector and interface leakage.
1.4.1 Ionization signal loss mechanisms
Carriers generated in the bulk of the detector need to travel through the substrate
until they reach the interface and then accumulate thereby inducing an image charge and
subsequent current flow. However, in practical detectors, trap states exist throughout the
detector, acting as localized regions of low potential energy. Hence, a carrier drifting
through the detector towards an electrical contact can fall into a potential well and not be
able to readily climb out of it until it gains the energy required to surmount the well. In
such cases, an interaction event will not be registered correctly since the current flow
measured in the external bias circuit does not adequately account for the total ionization
signal generated in the detector. Several factors can contribute to trap states in the substrate
the most common being semiconductor defects such as vacancies, interstitials and point
defects.
Ultra-pure crystals with impurity concentrations the same order of magnitude as
the intrinsic carrier concentration of the semiconductor are being developed for modern
detector experiments. The primary motivation behind this is to minimize carrier scattering
off impurity sites which act as trap states for the primary and secondary electrons and
holes. However, whether the individual donor and acceptor concentrations are on the same
order as the intrinsic carrier concentration (i.e. NA ~ ND ~ ni) or if the difference of the

12
donor and impurity concentrations gives a net impurity concentration comparable to ni
(i.e. |NA – ND| ~ ni) is still under debate.
Figure 4 shows the absolute calibration of the ionization signal efficiency
[10]. This plot is called the “seagull plot” indicating a saturation in the signal collection
efficiency at higher voltages and considerable loss at lower voltages. The Absolute Seagull
plot reveals that the efficiency of holes saturates close to 90%, while that of electrons
remains lower. Several factors contribute to the missing efficiency, important examples
being traps in the substrate and steady state leakage current from the bulk of the detector
not being an ideal dielectric. An important side note is that a larger efficiency for holes is
one of the reasons for using p-type material as the substrate for PPC (p-type Point Contact)
detectors.
Figure 4: Collection efficiency of ionization signal: (a) Known radiation () is used
to calibrate the detector for ionization signal collection. Signal from holes is
collected for positive bias voltages and from electrons for negative bias; b.
“Absolute Seagull plot”: Absolute calibration of the ionization signal efficiency
compared to scaled 60keV recoil data of 241Am (adapted from Arran Phipps’
dissertation)

13
Although substrate losses are usually the result of trap states borne out of lattice
defects, several exotic mechanisms also have considerable contribution to the overall noise
observed in cryogenic detectors. An example for an exotic trap is the overcharged trap
states, D− and A+, where a donor atom, instead of donating an electron, accepts an electron
or an acceptor ends up donating an electron (i.e. accepting a hole) thereby assuming an
overcharged state [11]. Impurity sites get converted from shallow traps to deep traps due
to being overcharged and the carriers which fall these into potential wells (almost as deep
as the semiconductor band gap) cannot climb out easily. Also, several noise sources exist
that contribute to spurious responses in the detector. These noise sources range from
cosmogenic particles to impurity traces within the detector to radioactive particle
generation (e.g. beta decay of Tritium releases electrons with end point energy of 18.6keV,
thus mimicking/swamping recoil signal from low mass WIMPs).
1.4.2 Ionization signal interface leakage
As described earlier, ionization signal collection is mediated through image
charges generated on the surface of the interface in response to carriers accumulating at
the semiconductor/insulator interface. Hence, in the steady state, current should ideally be
drawn only when an interaction event creates carriers which drift across the detector under
an electric field set up by external bias. However, in practice, the interface in detectors
cannot perfectly block all carriers; some carriers “leak” through the electrically insulating
interface to reach the metal contacts thereby registering a current reading. Replacing the
amorphous-Si interface currently being used in CDMS with an MOS structure has been
shown to improve the carrier blocking significantly [12]. However, as described later in

14
Section 3.1, we show that significant leakage still exists, necessitating process
modifications. Identifying processing steps to further decrease the leakage in MOS
interface forms the motivation for this thesis. The dominant mechanism for carrier leakage
through the interface is quantum mechanical tunneling and is described in Chapter-2.
Figure 5 (adapted from Arran Phipps’ dissertation) shows the charge noise power
spectrum for T1Z1 detector. Noise in electrical measurements in detectors comes from
several sources: Johnson thermal noise in the bias and feedback resistors in the charge
amplifier, shot noise due to DC currents set up between electrodes at different voltages,
microphonics due to parasitic capacitance between signal carrying cables, open loop
amplifier voltage and current noise being some of the most notable noise sources [10].
Figure 5: Charge Noise Power Spectrum for nominally identical charge channels in
T1Z1 detector; Intrinsic low frequency noise can be augmented by several noise
sources including shot noise, flicker noise and microphonics (adapted from Arran
Phipps’ dissertation)
Considering that the measurements are not considerably plagued by environmental
(extrinsic) noise, (which is a reasonable argument as explained in Matt Pyle’s dissertation
[7]), the intrinsic low frequency noise floor of the semiconductor/interface boundary can

15
be seen to be have serious contribution to the overall noise and rises steeply for frequencies
below 1kHz. Hence, for DC measurements, the noise floor is significantly large, which
impedes signal collection.
1.5 Outline of this thesis
The aim of this thesis is to find ways to combat carrier leakage through the
interface and improve its carrier blocking properties thus helping lower noise floor, one
of the biggest challenges in present detector design. Improvement in interface entails
suppressing conduction under steady state conditions of the detector such that a reading
corresponds to an interaction event. On that note, how low of a leakage level is low
enough? Ideally, it is desirable to have no carrier leakage through the interface for any
bias voltage. However, in practical terms, smothering the steady state current flow until
interactions hitherto undetected because of being swamped by the leakage component of
current start showing up forms the motivation for this thesis.
Chapter-2 discusses various mechanisms of leakage resulting from carrier
tunneling through an energy barrier. Analysis of current density and electric field (J-E)
relationships to identify localized regions (in voltage) where any given tunneling
mechanism dominates conduction is presented. Ways to combat different tunneling
mechanisms are discussed and fabrication processes that help simultaneously suppress
multiple mechanisms are identified in Chapter-3. The results from I-V and C-V
characterization of devices fabricated using these processing steps are also presented.
Chapter-4 deals with CO2 laser annealing to improve carrier blocking parameters
of the interface. The influence of laser scan parameters on the interface film quality is

16
discussed and the results from I-V and C-V characterization of laser annealed devices is
presented and compared to devices with as-deposited films. Finally, Chapter-5 presents
the conclusions of this work and future applications in detector design.

17
CHAPTER II
INTERFACE LEAKAGE MECHANISMS
The primary purpose of the interface stack in an MOS structure is to act as an
electrical insulator to develop and sustain an electric field across the device while drawing
negligibly small current. In electronic devices like MOSFETs, this property is exploited
for achieving a very high input impedance and for controlling current flow in the
transistors through a third terminal, the Gate, which ideally does not itself draw current
(and hence, does not consume power in idle state). The purpose of dielectric interface in
detectors is to enable the collection of image charges rather than the carriers generated
from the event themselves, while being significantly better at blocking carriers than
amorphous-Si layer being presently used by CDMS.
Analysis of different tunneling mechanisms dominating conduction at different
voltage ranges requires extraction of relationship between current density and electric
field. Calculation of electric field in MOS devices is discussed in Section 2.1. It needs to
be kept in mind that this analysis of E-field fails at cryogenic temperatures where the
substrate behaves as an insulator due to being electrically frozen, resulting in the gate
voltage being shared between the oxide and semiconductor regions in the inverse ratio of
their capacitances. However, this section is still necessary, since analysis of room
temperature I-V measurements, being quick, inexpensive and sufficiently representative
of cryogenic measurements, help easily verify the effectiveness of modifications being
implemented. As will be discussed in this chapter, trap-mediated leakage mechanisms

18
scale with temperature, which means that demonstrating a suppression of leakage current
at room temperature also indicates a decreased leakage at cryogenic temperatures. Devices
which show interesting characteristics at room temperature can then be characterized at
cryogenic temperatures.
2.1 Electric Field Calculation in MOS devices
Calculating the electric field profile in an MOS device is complicated by the
relationship between surface charge (charge at the semiconductor-dielectric interface) and
gate voltage applied between the metal contacts sandwiching the semiconductor and
insulator. The gate voltage can hence be understood to be expended in four major
components: 1. To overcome the built-in potential, VFB 2. Voltage dropped across the
dielectric, Vox 3. Surface potential, s and 4. Voltage dropped across the substrate, Vsub.
Hence,
𝑉𝐺 = 𝑉𝐹𝐵 + 𝑉𝑜𝑥 + ∅𝑠 + 𝑉𝑠𝑢𝑏 (2.1)
Figure 6: Energy band diagram showing the voltage drops across an MOS
structure; energy levels simulated for 20nm W/20nm SiO2/ p-type Si stack with NA
= 1E16 cm-3 and VG = 2V at 300K using Band Diagram Program [13].

19
The flat band voltage is the voltage needed to overcome the work function
difference between metal contacts and the semiconductor, m-s and the fixed charge Qo at
the semiconductor/insulator interface. Hence eq (2.1) becomes
𝑉𝐺 = (Φ𝑚−𝑠
𝑞−
𝑄𝑜
𝐶𝑜𝑥) + 𝑉𝑜𝑥 + ∅𝑠 + 𝑉𝑠𝑢𝑏 (2.2)
where Cox is the capacitance of the dielectric (i.e. measured capacitance of the
MOS device biased in accumulation).
For an ideal dielectric with no surface charge trap states, Qo becomes zero and flat
band voltage hence becomes m-s/q. Also, the Si substrates used in this research were
measured to have a doping concentration of ~1E16 cm-3 Boron atoms, which results in a
resistivity of ~1 -cm. For a 400µm thick Si substrate with 1mm circular metal contacts
on the top, the resistance comes out to be less than 10 at room temperature. Hence, the
voltage dropped across the substrate is negligible in comparison to the other components
in eq (2.2). Also,
𝑉𝑜𝑥 = −𝑄𝑠
𝐶𝑜𝑥 (2.3)
Hence, a simplified version of (2.2) would be
𝑉𝐺 = −Φ𝑚−𝑠
𝑞−
𝑄𝑠
𝐶𝑜𝑥+ ∅𝑠 (2.4)
Calculation of the work function difference is straight forward. However, a
relationship between the surface charge Qs and the surface potential s which needs to be
established to proceed with calculations based on eq (2.4) can be obtained as follows [14]:

20
Here, Si and ox refer to the dielectric constants of the substrate and the dielectric
respectively, 𝑝𝑝𝑜 and 𝑛𝑝𝑜
are the carrier concentrations contributing to surface charge in
the regions specified in eq (2.5) and F is the Fermi potential of the semiconductor. The
term 𝑝𝑝𝑜 can be approximated as the acceptor impurity concentration, NA, assuming
complete ionization of the acceptor atoms. Similarly, 𝑛𝑝𝑜 is the concentration of majority
carriers in the inversion region in deep inversion. Recalling that inversion condition is met
when the initially p-type (n-type) substrate develops at the interface, an electron (hole)
concentration at least equal to the hole (electron) concentration in the bulk of the substrate,
𝑛𝑝𝑜 refers to the electron concentration when it is numerically equal to the hole
concentration in the bulk. Hence, 𝑛𝑝𝑜 can also be approximated as the ionized donor
impurity concentration, NA.
Using eq (2.5), surface charge, Qs can be calculated for every value of surface
potential. Once Qs is known, voltage drop across the dielectric (and thereby, E-field) can
be determined through eq (2.3). The results for a p-type Si with NA = 1016 cm-3 with a
device configuration of Si/SiO2(33nm)/tungsten(100nm) at room temperature have been
shown in Figure 7.

21
Figure 7: Surface Charge, Qs; Surface Potential, s; oxide voltage, Vox and electric
field across the interface, Eox as functions of gate voltage, VG.
Once the Fermi level gets pinned to the valence band or the conduction band, the
surface potential only varies negligibly, since the Fermi level cannot go beyond the band
edges in Si or Ge MOS structures unless degenerately doped. Hence, the surface potential
and the flat band voltage remain almost constant, while the voltage drop in the bulk of the
substrate is negligible, meaning that any increase in gate voltage almost entirely reflects
as an increase in the oxide voltage. Hence, the electric field in the oxide scales linearly
with the gate voltage both in accumulation and inversion.

22
2.2 Thermionic Emission
Carriers accumulate at a barrier for the simple reason that they do not have enough
energy to surmount the barrier and continue traveling in an applied electric field. However,
if the carriers are provided with enough energy, they can climb over the barrier and then
drift in the electric field until they find a suitable energy state. This phenomenon is called
Thermionic or Schottky emission and is shown in Figure 8.
Figure 8: Schottky/Thermionic emission over an energy barrier
Thermionic emission is more pronounced at higher temperatures since carriers
have greater thermal energy which results in heightened probability for carriers to have
enough energy to surmount the energy barrier. The mathematical formulation of
thermionic emission can be obtained as [15]
𝐽 = 𝐴∗𝑇2𝑒[−𝑞[∅𝐵−√
𝑞𝐸4𝜋𝜖𝑟𝜖𝑜
]
𝑘𝑇] (2.6)
where J is the current density from thermionic emission, T is the temperature, B
is the barrier potential (in V, B = B /q, where B is the barrier energy in J), E is the
electric field across the barrier, r is the relative dielectric constant of the barrier, k is the
Boltzmann’s constant and A* is the effective Richardson constant given by

23
𝐴∗ = 4𝜋𝑞𝑘2𝑚∗
ℎ3=
120 𝑚∗
𝑚𝑜 (2.7)
where m* is the effective mass of the carrier (electron or hole, depending on the
electric field and doping) in the dielectric, mo is the free electron mass and h is the Planck’s
constant. Hence, dielectrics with large energy gap (hence typically large barriers) and low
temperatures are favorable conditions to combat thermionic emission.
Figure 9: Schottky emission of a. electrons and b. holes at Si/SiO2 barrier; a. and b.
show n-type and p-type Si substrates respectively
For an Si/SiO2 interface, the energy band diagrams favorable for thermionic
emission of holes and electrons are shown in Figure 9. The barrier height for electrons is
lower than for holes which means thermionic emission of electrons occurs for lower
voltages (and/or temperatures) than for holes. However, the barrier (for both holes and
electrons) is large enough to prevent thermionic emission of carriers through the Si/SiO2
interface in detectors at cryogenic temperatures.
2.3 Direct Tunneling
An MOS device with p-type (n-type) substrate biased in accumulation results in
accumulation of holes (electrons) at the semiconductor/insulator interface thus

24
contributing to surface charge. Classically, none of the accumulated charges should be
able to make their way through the insulator into the metal. However, carriers have a finite
probability of crossing an energy barrier, which results in a leakage path that gives rise to
non-zero current in steady state when an MOS device is biased at a constant voltage in
accumulation. In MOSFETs, this manifests in the form of a non-zero gate current where
ideally, the gate current should be zero resulting in an infinite input impedance.
Figure 10: Quantum Mechanical Tunneling through an energy barrier. 1 and 3
correspond to traveling wave functions in regions 1 and 3, whereas 2 represents
an evanescent wave function, giving electrons an exponentially decaying probability
along x.
Tunneling of carriers across a barrier is a quantum mechanical phenomenon.
Electrons have a sinusoidal wave function for their energy state but as they enter a barrier,
the wave function decays exponentially due to the lack of available energy states, giving
an evanescent profile. However, an available energy state on the far side of the barrier can
result in a traveling wave function, which corresponds to a non-zero probability for being
occupied by electrons. Since the decay is exponential, quantum tunneling is strongly
dependent on the thickness of the barrier; as the barrier thickness increases, tunneling
probability decreases [16].

25
Direct tunneling in MOS devices refers to the phenomenon in which carriers can
tunnel from the semiconductor directly into the metal through the dielectric as shown in
Figure 11.
Figure 11: Direct tunneling of electrons and holes in MOS structure
The current density, J resulting from direct tunneling of carriers across the barrier
in an MOS device can be calculated as [17]:
𝐽𝐷𝑇 = 𝐴 (2∅𝐵
𝑉𝑜𝑥− 1) (𝐸𝑜𝑥)2 . 𝑒𝑥𝑝 {(
−𝐵
𝐸𝑜𝑥)(1 − [1 −
𝑉𝑜𝑥
∅𝐵]
3
2)} (2.8)
𝐴 = 𝑞3
8𝜋ℎ∅𝐵; 𝐵 =
8𝜋√2𝑚∗
3ℎ𝑞∅𝐵
3/2 (2.9)
where B is the barrier potential (in V), Vox is the voltage drop across the oxide, Eox is the
electric field across the oxide and m* is the conductivity effective mass of the carriers in
the dielectric.
Solving eq (2.8) for different gate voltages allows the identification of the
dielectric thicknesses, ‘tox’, where direct tunneling plays a dominant role in electrical
conduction. The results shown in Figure 12 indicate that direct tunneling is negligible for
tox >5nm, while at 2nm and lower, it is extremely dominant, with even bias voltages as

26
small as 1V resulting in tunneling large enough to breakdown the dielectric. The SiO2 film
used in this research has thickness upward of 20nm which makes direct tunneling
irrelevant.
Figure 12: Theoretical Direct tunneling current density calculated using eq (2.8)
through Si/SiO2 interface for oxide thicknesses of: a. 1nm, b. 2nm and c. 5nm
2.4 Fowler-Nordheim Tunneling
The current density curves from direct tunneling shown in Figure 12 indicate the
current peaking at a certain voltage and then reducing for further increase in voltage. This
should not be misinterpreted as a decrease in tunneling current at high voltages, it only
indicates a decrease in current from direct tunneling. What it actually represents is a
transformation of the tunneling current from direct tunneling into a closely related
phenomenon called Fowler-Nordheim (FN) tunneling. As the bias voltage is increased,
the energy band of the dielectric bends and eventually, one edge of the energy gap of the
barrier becomes lower in energy than the Fermi level of the carrier rich region on the other
edge as shown in Figure 13. At this point, carriers only have a triangulated barrier to cross,
compared to the trapezoidal barrier involved in direct tunneling. The tunneling of carriers
through a triangular barrier (whose thickness is lower than the total dielectric thickness)
due to high electric field is called Fowler-Nordheim tunneling. Unlike direct tunneling,

27
Fowler Nordheim tunneling can contribute significantly to leakage even for thicknesses
up to 20nm for large bias voltages. This is because carriers have a much smaller effective
barrier thickness to tunnel through, because of the bent bands.
Figure 13: Direct tunneling (left) transforming into Fowler-Nordheim tunneling
current (right) in an MOS device as the bias voltage is increased (device pushed
further into accumulation)
From Figure 12, direct tunneling current has been found to be dominant for
tox<2nm for VG as low as 0.5V (i.e. electric field intensity of 0.5V/2nm = 0.25GV/cm,
neglecting VFB). Hence, if carriers have an effective barrier of thickness less than 2nm with
a voltage drop of 0.5V across that effective thickness, significant tunneling occurs. This
is where Fowler-Nordheim tunneling becomes dangerous: voltage drop across the
dielectric is uniform, meaning a 5V potential across 10nm oxide layer results in voltages
as high as 1V across a 2nm section of the dielectric. Hence, highly energetic carriers on
the metal side can see a barrier as thin as 2nm with an electric field sufficient to result in
significant tunneling.
Fowler-Nordheim tunneling current density can be calculated as [18]:

28
𝐽𝐹𝑁 =𝑞2
8𝜋ℎ∅𝐵𝐸2𝑒
−(8𝜋√2𝑚∗
3ℎ𝑞𝐸∅𝐵
32 )
(2.10)
which can be rewritten as
𝑙𝑛 (𝐽𝐹𝑁
𝐸2 ) = −8𝜋√2𝑚∗
3ℎ𝑞𝐸∅𝐵
3
2 + 𝑙𝑛 (𝑞3
8𝜋ℎ∅𝐵) (2.11)
Eq (2.11) represents a straight-line relation between ln(J/E2) and 1/E with a slope
of −8𝜋√2𝑚∗
3ℎ𝑞∅𝐵
3
2 and intercept of 𝑙𝑛 (𝑞3
8𝜋ℎ∅𝐵). Hence, regions in I-V curve dominated by
Fowler-Nordheim tunneling can be determined by plotting ln (J/E2) vs 1/E and searching
for linear regions with the expected slope. Similar to direct tunneling, Fowler-Nordheim
tunneling exponentially decreases as the barrier thickness increases. Hence, F-N tunneling
can be combated with barriers of large height and thickness.
2.5 Trap Assisted Tunneling
Direct tunneling and Fowler-Nordheim tunneling discussed in sections 2.3 and 2.4
are one-step tunneling processes− carriers tunnel all the way across the barrier in one
process. However, an energy state in the dielectric can act as an intermediate state, which
facilitates a two-step (or multiple-step) tunneling process. Such energy states are called
trap states since they trap carriers drifting in their vicinity. Depending on whether the trap
state is inherently neutral or charged, two tunneling mechanisms can occur: Frenkel-Poole
(F-P) emission in charged trap states and trap assisted tunneling (TAT) in both neutral and
charged trap states.
Trap-assisted tunneling, as the name suggests involves carriers tunneling into a
trap state in the barrier first and then across the barrier in a second step. There can be more

29
than two intermediate trap states involved: such conduction is called Hopping conduction
wherein a carrier gets trapped multiple times at different trap states in the barrier as it
eventually makes its way through the barrier. The energy band condition facilitating TAT
is shown in Figure 14.
Figure 14: Trap Assisted Tunneling through a barrier
In TAT, charge carriers tunnel through the barrier until they make their way into
the vicinity of the trap state and then lose some of their energy (usually in the form of
phonons) and get trapped temporarily. A subsequent tunneling process (multiple processes
in hopping conduction) takes the trapped carrier across the barrier into the region with
available energy states. The individual tunneling steps are in accordance with the process
described in Section 2.3. Tunneling can result when two conditions are satisfied: 1. Two
regions, one with a large number of carriers and the other with a large number of available
energy states 2. The two regions being separated by a barrier of finite height and thickness
[16]. With these two conditions met, a sufficiently large electric field can impart enough
energy to the carriers to penetrate the barrier and occupy the available energy states on the
farther end of the barrier. Hence, during each tunneling step, the trap state is perceived by
the carrier as an available energy state, made difficult to be accessed by the barrier. Once

30
the carrier occupies a trap state, it again has a finite, non-zero probability of tunneling into
a more favorable energy state across the barrier; this energy state can be another trap state
within the barrier or an available energy state in the material beyond the barrier.
Mathematically, Trap assisted tunneling can be written as
𝑙𝑛(𝐽𝑇𝐴𝑇) 𝛼 1
𝐸[
−8𝜋√2𝑞𝑚∗
3ℎ𝛷𝑡
1.5] (2.12)
where t is the energy level of the trap state participating in trap assisted tunneling
and m* is the effective mass of the tunneling carrier in the barrier. Linear regions with a
slope of [−8𝜋√2𝑞𝑚∗
3ℎ𝛷𝑡
1.5] in the plot of ln(J) vs 1/E indicate the gate voltages for which
TAT is the dominant conduction mechanism. However, it needs to be emphasized that this
equation takes into account only one active trap state. Hence, if multiple trap states exist
in the dielectric and allow an intermediate step for carriers drifting across the barrier, this
equation does not hold, since each trap state results in a linear ln (JTAT) vs 1/E relation with
its own unique slope [19].
2.6 Frenkel Poole emission
Trap-assisted tunneling discusses the tunneling process when the trap state is
electrically neutral and hence, only acts as an intermediate resting point for the tunneling
carriers. However, if the trap state is inherently charged, the tunneling carrier− in the
vicinity of the trap− is under the influence of both the electric field from external bias and
the localized electrostatic potential of the polarized trap [20]. This can reduce the barrier

31
height the carrier has to climb to thermionically escape the trap state as shown in Figure
15.
Figure 15: Frenkel-Poole emission: Electrostatic potential energy of an ionized
atom (left) superimposed onto the energy band of a dielectric in an external electric
field (center) resulting in a lowered barrier for trapped carriers (right); PF
indicates the reduction in the barrier height (energy) because of the trap state being
charged
Tunneling carriers originating from a carrier-rich material get trapped in a charged
trap state. However, the barrier height the carriers need to surmount to thermionically
escape the trap is lowered as shown in Fig 2.10. This lowered barrier height leads to
increased probability of carriers escaping the trap state resulting in Frenkel-Poole
emission. This mechanism is only observed under high electric fields, since the field must
be strong enough to polarize an atom in the barrier (which is a dielectric in most cases, as
the one considered in this thesis). The polarized atom acts as a charged trap state and the
potential energy of the trap typically has a sphere of influence of roughly 30𝐴𝑜 (i.e. length
of about 10 atoms) [21].

32
It needs to be emphasized that a charged trap state does not preclude trap-assisted
tunneling; a carrier which may not be able to surmount a lowered barrier, while being able
to tunnel through to another energy state (which can either be across the remainder of the
barrier or another trap state within the barrier) can result in TAT current even in charged
trap states. Hence, Frenkel-Poole emission requires that the trap states be charged, while
TAT can result for both charged and neutral trap states.
Frenkel-Poole emission can be formulated as [15]:
𝒍𝒏 (𝑱
𝑬) = √𝑬 [
𝑞
𝑘𝑇√
𝑞
𝜋𝜖𝑜𝜖𝑜𝑥] + [
−𝑞𝛷𝑡
𝑘𝑇+ ln(𝑞𝜇𝑁𝑐)] (2.13)
where t indicates the trap state energy and Nc, are the conductivity density of
states and the mobility of the tunneling carrier in the barrier respectively. Hence, a linear
region in the plot of ln(J/E) vs √E with a slope of 𝑞
𝑘𝑇√
𝑞
𝜋𝜖𝑜𝜖𝑜𝑥 indicates the range of gate
voltages dominated by Frenkel-Poole emission. The slope is a function of temperature,
unlike trap-assisted tunneling.
Not all the tunneling mechanisms described in this chapter play a significant role
in conduction in the devices studied in this work. Thermionic emission is negligible at
cryogenic temperatures due to carriers not having enough thermal energy to cross the
barrier, not to mention the large barrier at the Si/SiO2 interface which inhibits thermionic
emission even at room temperature. Fowler-Nordheim and direct tunneling are minimized
by the fact that the dielectric thickness is over 20nm, which (as explained in Sections 2.3

33
and 2.4) results in negligible current from these mechanisms. Hence, conduction in our
devices primarily results out of trap-mediated tunneling (as shown using I-V
characterization in Chapter-3), which provides the motivation to search for measures that
minimize the density of trap states at the Si/SiO2 interface and bulk of SiO2.

34
CHAPTER III
INTERFACE DESIGN: COMPOSITION AND PROCESSING
The interface proposed to be used in cryogenic particle detectors to replace
amorphous-Si comprises of 20nm layer each of SiO2 and poly-crystalline Silicon (pc-Si)
deposited between the substrate and metal contacts. Although this interface is a huge
improvement over the previously used amorphous-Si interface, we show the limitations
of this interface in carrier blocking in this chapter. Then, we explore new interface
composition and microfabrication processes to mitigate the trap state density in the
interface to inhibit tunneling. Lowering of leakage through effective carrier blocking is
studied through Current-Voltage (I-V) characterization while suppression of trap density
is analyzed through Capacitance-Voltage (C-V) characterization.
3.1 Interface leakage measurements
A cross-sectional view of a detector (from ionization collection perspective) has
been shown in Figure 4 and presented again in Figure 16. I-V and C-V characterizations
of these devices is discussed in Sections 3.1.1 and 3.1.2.
Figure 16: Cross-sectional view of detectors developed

35
3.1.1 I-V characterization
J-V characterization (J is the current density obtained by normalizing the measured
current by the top-contact area) of fabricated devices followed by J-E analysis helps
identify dominant tunneling mechanisms responsible for electrical conduction in different
voltage ranges. As explained in Chapter-2, direct tunneling and thermionic emission can
be ignored as they do not have considerable contribution to conduction in the devices
developed. Table-1 summarizes mathematical formulations of tunneling mechanisms (as
described in Chapter-2) and helps determine dominant regimes for Fowler-Nordheim,
Frenkel-Poole and Trap-Assisted Tunneling mechanisms.
Table 1: Mathematical formulations of F-N, TAT and F-P tunneling mechanisms Tunneling
mechanism
Equation Plot Slope
Fowler-
Nordheim
(F-N)
𝐥𝐧 (𝑱
𝑬𝟐) =
𝟏
𝑬[−8𝜋√2𝑚∗
3ℎ𝑞𝛷𝐵
1.5]
+ ln (𝑞3
8𝜋ℎ𝛷𝐵
)
ln (𝐽
𝐸2) 𝑣𝑠
1
𝐸
for e- : -1.941x10⁸ V/cm
for h+: -5.126x10⁸V/cm
Trap-
Assisted
(TAT)
𝐥𝐧(𝑱) 𝛼 𝟏
𝑬[−8𝜋√2𝑞𝑚∗
3ℎ𝛷𝑡
1.5] ln(𝐽) 𝑣𝑠1
𝐸
for e- : -3.75x10⁷𝛷𝑡1.5V/cm
for h+: -5.2 x10⁷𝛷𝑡1.5V/cm
Frenkel-
Poole
(F-P)
𝐥𝐧 (𝑱
𝑬) = √𝑬 [
𝑞
𝑘𝑇√
𝑞
𝜋𝜖𝑜𝜖𝑜𝑥
]
+ [−𝑞𝛷𝑡
𝑘𝑇+ ln(𝑞𝜇𝑁𝑐)]
ln (𝐽
𝐸) 𝑣𝑠 √𝐸
T=300K: 0.0147 [cm/V]1/2
T=22K: 0.201 [cm/V]1/2
Room temperature I-V characterization has been performed on an HP4155B
Semiconductor parameter analyzer by sweeping voltage at the top contact while grounding
the bottom contact. A 400µm thick p-type Si substrate with a doping density of ~1-2x10¹⁶
cm-3 (resistivity of 1-5 -cm) has been used and SiO2 and poly-crystalline Silicon (pc-Si)
have been sputter-deposited. The top and bottom metal contacts have been deposited either

36
through sputtering or e-beam evaporation depending on the metal. The thickness and
refractive index of the deposited oxide film have been measured using OceanOptics
Nanocalc DUV spectroscopic measurement and the thickness of the metal has been
measured using stylus profilometry on Bruker DektakXT surface profiler.
Figure 17: a. Room Temperature Current-Voltage characteristics with the device
configuration: p-Si/SiO2(20nm)/pc-Si(20nm)/W(40nm); also shown in b., c. and d.
are the J-E relationships to analyze Fowler-Nordheim, Trap-assisted and Frenkel-
Poole tunneling mechanisms. Orange overlay shows a straight line fit with the
equation and R2 value for the fit.
The results from I-V testing of p-type Si/20nm SiO2/20nm pc-Si/40nm W devices
have been shown in Figure 17 (a). Figure 17(b)-(d) show the analysis of Fowler-
Nordheim, Trap-assisted tunneling and Frenkel-Poole emission respectively. Blue lines
37
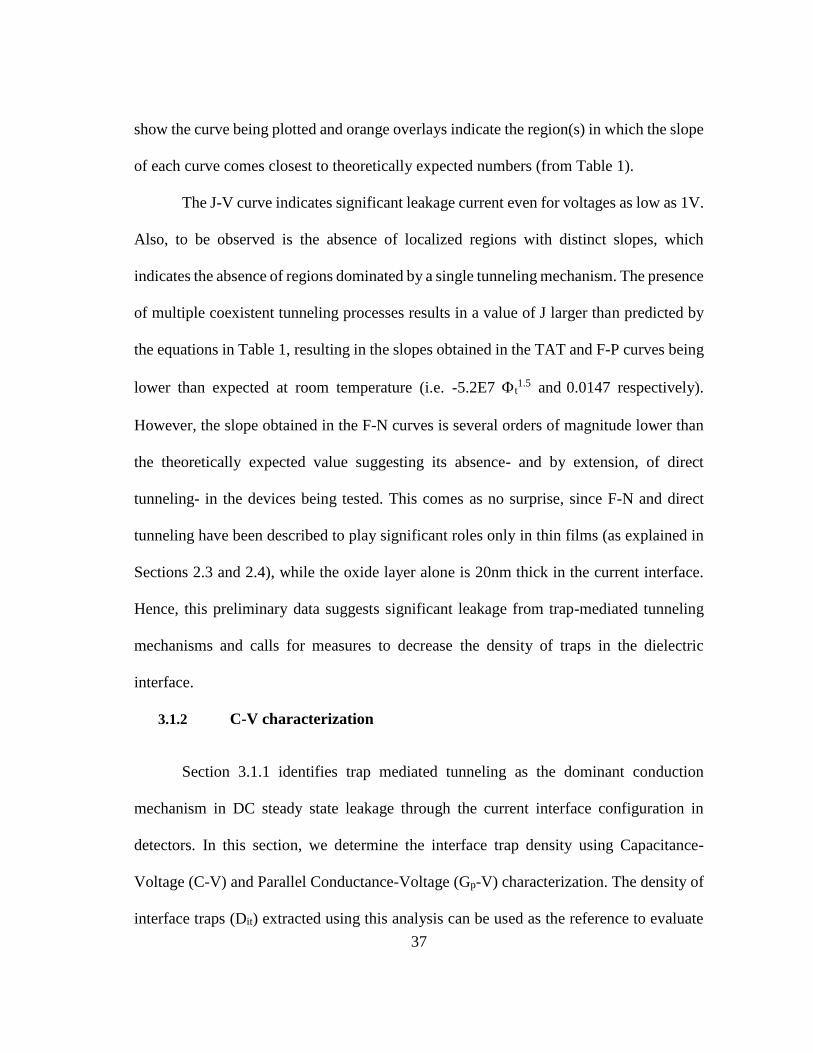
show the curve being plotted and orange overlays indicate the region(s) in which the slope
of each curve comes closest to theoretically expected numbers (from Table 1).
The J-V curve indicates significant leakage current even for voltages as low as 1V.
Also, to be observed is the absence of localized regions with distinct slopes, which
indicates the absence of regions dominated by a single tunneling mechanism. The presence
of multiple coexistent tunneling processes results in a value of J larger than predicted by
the equations in Table 1, resulting in the slopes obtained in the TAT and F-P curves being
lower than expected at room temperature (i.e. -5.2E7 t1.5 and 0.0147 respectively).
However, the slope obtained in the F-N curves is several orders of magnitude lower than
the theoretically expected value suggesting its absence- and by extension, of direct
tunneling- in the devices being tested. This comes as no surprise, since F-N and direct
tunneling have been described to play significant roles only in thin films (as explained in
Sections 2.3 and 2.4), while the oxide layer alone is 20nm thick in the current interface.
Hence, this preliminary data suggests significant leakage from trap-mediated tunneling
mechanisms and calls for measures to decrease the density of traps in the dielectric
interface.
3.1.2 C-V characterization
Section 3.1.1 identifies trap mediated tunneling as the dominant conduction
mechanism in DC steady state leakage through the current interface configuration in
detectors. In this section, we determine the interface trap density using Capacitance-
Voltage (C-V) and Parallel Conductance-Voltage (Gp-V) characterization. The density of
interface traps (Dit) extracted using this analysis can be used as the reference to evaluate

38
the impact of processing modifications introduced in Section 3.2. However, it needs to be
emphasized that it is the high frequency interface trap density that can be extracted using
this technique; it does not precisely represent the density of trap states under DC bias
conditions. Also, it is not just the interface trap states that result in trap-mediated
tunneling; trap states in the bulk of the dielectric play crucial roles in both F-P and TAT
mechanisms. However, we make the case that demonstrating an alleviation of high
frequency interface trap states upon annealing indicates an overall decrease in trap state
density, which would mean lowered trap-mediated tunneling even for DC bias conditions.
An MOS device biased in accumulation behaves as a capacitor and is hence called
the MOS-Capacitor. The ideality of this capacitor depends on the ideality of the dielectric
used in the MOS structure. A high-quality dielectric layer results in a very small
conductance, Gtunnel in parallel with the capacitance, whereas a defect-filled dielectric
results in significant leakage, as equivalently described by large Gtunnel. The equivalent
circuit models of ideal and practical MOS capacitors is shown in Figure 18 [22].
Figure 18: Leakage in practical MOS devices: a. ideal MOS capacitor model; b.
Equivalent circuit model of a practical MOS-C with the DC steady state tunneling
path highlighted in red;

39
C-V and Gp-V measurements performed on p-type Si/30nm SiO2/W devices have
been shown in Figure 19. Poly-crystalline silicon layer has been omitted in these
measurements to enable the study of interface trap density at the Si/SiO2 interface alone.
C-V and Gp-V measurements presented later in this thesis also omit the pc-Si layer for the
same reason thereby facilitating a conclusive analysis regarding the improvement in oxide
quality and mitigation of trap states at the Si/SiO2 interface upon annealing.
Figure 19: C-V (left) and Gp-V (right) data from measurement (C and Gp
normalized with respect to the top contact area)
The C-V curves shown in Fig 19 show a frequency dependence of the capacitance
measurements in accumulation. This frequency dispersion results from the substrate
resistance, Rs, which acts as a series component in the C-V measurement. Hence, the
measured data needs to be corrected for Rs before additional (more meaningful) data can
be extracted.
Nicollian-Brews technique is widely used for series resistance correction to C-V
and Gp-V measurements [23][24]. According to this technique, the series resistance and
oxide capacitance can be extracted as

40
𝑅𝑠 = 𝐺𝑚,𝑎
𝐺𝑚,𝑎2 +𝜔2𝐶𝑚,𝑎
2 (3.1)
𝐶𝑜𝑥 = 𝐶𝑚,𝑎 [1 + (𝐺𝑚,𝑎
𝜔𝐶𝑚,𝑎)
2
]
(3.2)
where 𝐶𝑚,𝑎 and 𝐺𝑚,𝑎 are the capacitance and conductance respectively in
accumulation regime and is the angular frequency of measurement.
Once Rs and Cox have been extracted, parallel conductance can be corrected as
𝐺𝑝
𝜔=
−𝜔𝐶𝑜𝑥2 (𝑅𝑠𝐶𝑚
2 𝜔2+𝑅𝑠𝐺𝑚2 −𝐺𝑚)
𝜔4𝐶𝑚2 𝐶𝑜𝑥
2 𝑅𝑠2+ 𝜔2(𝐶𝑜𝑥
2 𝑅𝑠2𝐺𝑚
2 +𝐶𝑜𝑥2 +𝐶𝑚
2 −2𝐶𝑜𝑥2 𝑅𝑠𝐺𝑚−2𝐶𝑚𝐶𝑜𝑥)+𝐺𝑚
2 (3.3)
The conductance corrected for Rs using this technique is shown in Figure 20. The
corrected Gp-V curves show distinct peaks at each frequency.
Figure 20: Gp/ -V curves a. as measured and b. corrected for Rs using data from
Fig 3.4 (C and Gp normalized with respect to the top contact area)

41
Figure 21: Gp/ - curves: Gp/ plotted as a function of frequency to determine
the trap state concentration at different frequencies: Obtained by corrected data
from Fig 3.4 for Rs
The interface trap density can be calculated by fitting the Gp/ vs curves to the
relation
𝐺𝑝
𝜔=
𝑞𝐷𝑖𝑡𝜔𝜏
1+(𝜔𝜏)2 (3.4)
From this relation, Dit (in #/eV-cm2) can be approximated as [25]:
𝐷𝑖𝑡~2.5
𝑞(
𝐺𝑝
𝜔𝐴)
𝑚𝑎𝑥 (3.5)
Hence, the interface trap density can be calculated using Fig 3.6 and eq (3.5) to be
7.3437x10¹³ per cm2-eV. This number can be used as the reference to evaluate the trap
density in devices employing interface modifications suggested in Section 3.2 and
thereafter.

42
3.2 Modifications to the interface: possibilities and restrictions
In Section 3.1.1, the ineffectiveness of the 20nm SiO2/20nm pc-Si interface in
blocking carriers has been emphasized using the leakage measurements on devices
employing this stack. The reason behind leakage has been identified to be trap-mediated
tunneling mechanisms, as corroborated by interface trap density calculations from C-V
characterization described in Section 3.1.2. In this section, possible modifications to the
materials and fabrication processes that result in an interface less vulnerable to leakage
are explored.
Substrate
The substrate in the devices forms the bulk of the designed detector, where the
interaction events are expected to happen. Hence, the choice of a substrate is made so as
to maximize the probability of occurrence of an interaction event. The recoil energy of an
elastic scattering event is given by
𝐸𝑟𝑒𝑐𝑜𝑖𝑙 = 𝜇2𝑣2
𝑚𝑁(1 − 𝑐𝑜𝑠 𝜃𝑐) (3.6)
where mN is the target nucleus mass, v is the velocity of the interacting particle and is
the reduced mass of the particle-nucleus pair [6]. Hence, depending on the expected energy
(mass) of a particle, only select few materials are suitable for detector design. For detection
of WIMPs, Ge, with an atomic mass of 72.6, is an ideal candidate. Also, in comparison
with Si, the biggest advantage of Ge is its larger atomic mass density: Ge has a density of
5.323g/cc, more than twice that of Si (2.329g/cc). A larger mass density means a larger
collision cross-section for particles passing through the bulk of the detector, which

43
translates into higher probability of occurrence of an event. Besides these advantages, Ge-
73 has a non-zero nuclear-spin of 9/2, which makes it a better candidate than Si, since
some WIMP models predict a nuclear-spin dependent collision cross-section [8]. Also,
since optical phonon generation in Ge (and Si) is relatively small, most of the recoil energy
eventually translates into electron-hole pair generation allowing maximum energy
collection in phonon-mediated detection [7].
The substrate used in detectors is extremely pure; the impurity level in these
crystals is on the order of intrinsic carrier concentration. Hence, any modifications made
to interface design and processing must ensure that the substrate properties are not
degraded. This imposes restrictions on using processes requiring high temperatures, since
such conditions can result in trap state generation in the bulk of the detector. Also, Ge has
a relatively low melting point (938oC), which rules out processes involving temperatures
higher than 700oC.
SiO2
SiO2 plays a crucial role in the interface, not just for its carrier blocking properties,
but also for its lattice match with the materials below and above it: Si or Ge and pc-Si
respectively. However, sputtered SiO2 film has inferior quality due to defects which result
in significant leakage as evidenced in Section 3.1. The choice of dielectric need not be
confined to SiO2; studies using vacuum as the interface have motivated the use of SiO2
[26]. However, the dielectric must ensure no lattice mismatch of the dielectric with the
substrate and pc-Si to prevent defects and trap states at the interface. This thesis focuses

44
on improving the quality of the sputtered SiO2 film for superior carrier blocking properties
rather than looking for a replacement for SiO2.
We propose two measures for combating the leakage through SiO2 in this thesis:
increasing the film thickness from 20nm to 33nm and subjecting the devices to annealing
post SiO2 deposition to enable densification and relaxation of the film. Rapid Thermal
Processing (RTP) and CO2 laser scanning have been used as the annealing options. A
larger thickness of SiO2 improves carrier blocking properties but affects phonon collection
adversely. Hence, the total interface thickness (SiO2 + pc-Si) is kept below 40nm
throughout this thesis.
Poly-crystalline Si
Poly-crystalline silicon plays a crucial role in phonon collection. To understand its
role better, a brief description of phonon sensing is necessary: Phonon signal collection in
CDMS detectors is achieved by converting the phonons into a neutral excited state called
Bogoliubov quasiparticles, a coherent superposition of an electron state and a hole state
[6]. Since these quasiparticles are neutral, electric fields cannot be used to create a
potential energy gradient to channel their flow. Hence, the gradient in potential energy is
instead achieved by a gradual change in the superconducting transition temperature, TC of
the detector. A change in TC is accompanied by a corresponding change in the
superconducting energy gap, (where 2 = 3.528kBTC). Once a quasiparticle enters a
region of lower gap, it cannot climb back into the region with a larger gap, thus enabling
the creation a potential energy gradient to channel the motion of these particles. Finally,
the quasiparticles thermalize in the sensor allowing collection of the phonon signal. This

45
allows the concentration of phonon signal generated over the entire volume of the detector
into a sensor, about 10 billion times smaller in volume. A detailed description of
concentrating phonon energy through quasiparticles can be found in Scott Hertel’s
dissertation.
Pc-Si has been found to ensure a smooth transition in the superconducting
transition temperature to allow the concentration of phonon signal. Besides facilitating
phonon collection, pc-Si also acts as a diffusion barrier for oxygen between SiO2 and the
metal. Hence, despite inferior carrier blocking properties, pc-Si is indispensable in
detector design.
As explained earlier, the total interface thickness is desired to be kept under 40nm.
Hence, since we proposed increasing the SiO2 thickness to 33nm from 20nm, a
compensation in the form of decreasing the pc-Si layer thickness from 20nm to 7nm is
proposed. By doing this, the benefits of pc-Si are retained while improving the overall
carrier blocking properties of the interface.
Metal contacts
The choice of metal contacts in CDMS detectors is primarily influenced by the TC
of the metals to enable phonon signal concentration as described in the previous section.
Hence, aluminum and tungsten are used in these detectors to develop a gradual change in
TC, which results in a gradual potential energy gradient. Also, the W layer is achieved as
a careful balance between and phases of W with TC of 15mK and 600mK respectively,
to give a resultant TC of ~80mK.

46
This thesis focuses only on leakage and its impact on ionization signal collection
and hence, allows flexibility in the choice of metal for depositing contacts. The work
reported in this thesis has been carried out using tungsten, tantalum or nickel as the metal
contacts, so that the backside contact to the p-type substrate is ohmic.
The quality of the sputtered SiO2 film can be improved significantly until the
carrier blocking properties of the film become comparable to a thermally grown SiO2
layer. This forms the goal of this thesis: identifying and implementing measures that
alleviate defects in the sputter-deposited SiO2 film and demonstrate a resultant decrease
in carrier leakage. The options explored include Rapid Thermal Processing, discussed in
the next section and CO2 laser annealing discussed in Chapter-4.
3.3 Proposed interface modifications and results
This section discusses two modifications to the current interface design to improve
its carrier blocking properties: replacing the 20nm layer of SiO2 with a 33nm layer and to
perform a rapid thermal anneal at 600oC for 30 seconds after SiO2 deposition. Lowered
leakage is a direct consequence of a larger dielectric thickness and subsequent annealing
ensures relaxation and densification of the sputtered film to decrease the density of trap
states both at the interface and in the bulk of the dielectric film. The refractive index of
the sputtered SiO2 films has been measured using optical profilometry to be ~ 1.358, which
indicates that the deposited film is oxygen deficient and can be better described as SiOx,
where x<2. No significant improvement has been seen upon increasing the partial pressure
of O2 in the sputtering chamber, which is not surprising, given the documentation
regarding poor quality of sputtered thin films resulting from an inherently amorphous film

47
deposition [27]. The goal of annealing is to achieve a film comparable in quality to a
thermally deposited oxide film, characterized by a refractive index of ~1.4614. Annealing
post deposition is necessary considering that thermal oxidation is not an option in this
work, since the actual detectors employ germanium and SiO2 cannot be obtained from
thermal oxidation of Ge.
Before describing the results from these modifications, a brief note about the
impact of annealing: SiO2 thin films (any solid for that matter) are at their lowest energy
state when the crystalline lattice is perfectly ordered, i.e. without any lattice defects
(vacancies, interstitials etc.). However, sputtering results in metastable amorphous
structures rather than crystalline lattice structures. Such amorphous structures lack long
range order and consist of defects which can act as trap states for drifting carriers. These
defect states can be understood as particles occupying local minima in the energy levels
of the solid. Although these particles prefer to occupy a lower energy state, they lack
enough energy to surmount the localized energy pit they are stuck in. Hence, a small
perturbation in energy in the form of an increase in temperature can result in small
displacement of these particles which allows them to wiggle out of the local minima and
search for a lower energy state. From the perspective of the entire solid, heating results in
particles being provided enough energy to randomly arrange themselves which when
followed by slow cooling, results in particles occupying low energy states, thereby
lowering the overall energy of the solid, thus alleviating defects.
According to statistical mechanics, the probability for an energy level, EA to be
occupied at a temperature T is given by the Boltzmann distribution as

48
𝑃𝐴 = 1
𝑍𝑒
−𝐸𝐴𝑘𝐵
𝑇 (3.7)
where kB is the Boltzmann’s constant and Z is the partition function given by
𝑍 = ⅀ 𝑒−
𝐸𝛽
𝑘𝐵 𝑇
𝛽 (3.8)
Hence, at high temperatures, all energy states have nearly equal probability of
occupancy which means it is easy for particles to find a preferential energy state. However,
as T → 0K, only those energy states with extremely low energy have a non-zero
probability of occupancy. Hence, when a solid is heated and cooled down slowly, particles
arrange themselves randomly at the higher temperatures and then gradually fall down into
progressively lower energy states as the solid cools down resulting in crystallinity in
structure [28].
It is important to cool down sufficiently slowly and allow the solid to reach
thermal equilibrium at every temperature so that defect states are not frozen into the lattice
due to a sudden cool down. As a side note, this concept of particles being provided with
sufficient energy and then allowed to find preferential states as the energy is removed
motivates a popular optimization algorithm called “Simulated Annealing” [29].
Each of the suggested modifications, namely changing the dielectric thickness and
annealing the devices post SiO2 deposition, has individually shown to minimize tunneling
current and as an extension, an interface design employing both these modifications has
shown superior carrier blocking properties as illustrated in Figure 22. Sections 3.3.1 and
3.3.2 further explore the individual impact of each of the processing modifications
described.

49
Figure 22: Current-Voltage characteristics of four samples illustrating impact of:
change of SiO2 thickness to 33nm, RTP of 20nm SiO2 at 600oC and RTP of 33nm
SiO2 at 600oC.
3.3.1 Impact of reconfigured interface
Figure 23 shows the impact of replacing 20nm SiO2 layer with a 33nm layer. It can
be clearly seen that a region dominated by Frenkel-Poole emission appears in the J-E
analysis of the 33nm SiO2 sample in the form of a region with slope of 0.0145, which is
in agreement with the theoretically expected value of 0.0147 (Table 1). This indicates that
voltages which result in both TAT and F-P in 20nm SiO2 samples (as indicated by absence
of expected slope in Figure 17) only result in F-P in the 33nm SiO2 sample, thus showing
suppression of tunneling. Also, the region dominated by F-P in the 33nm SiO2 samples
spreads over a narrow range of voltages thus indicating its suppression at other voltages.
The slope in TAT curves in 33nm samples is greater than the 20nm samples, thus implying
a lower TAT current in the 33nm device. However, as described in Section 2.5, the slope
obtained from ln(J) vs 1/E analysis of I-V data only considers the presence of a single trap
state participating in trap-assisted tunneling. The presence of multiple trap states prevents
1E-09
1E-08
1E-07
1E-06
1E-05
1E-04
1E-03
1E-02
-6 -4 -2 0 2 4 6
J (A
/cm
2)
VG (V)
J-V @ 300K
20nm SiO2 + 20nm p-Si,No Anneal
20nm SiO2 + 20nm p-Si,600C
33nm SiO2, No Anneal
33nm SiO2, 600C anneal

50
the extraction of regions dominated by TAT using the slope of ln(J) vs 1/E curve.
However, the magnitude of ln(J) can be found to be significantly decreased in samples
with 33nm SiO2 samples which signifies a decrease in leakage current from TAT.
Figure 23: Suppression of F-P and TAT upon changing SiO2 layer thickness from
20nm to 33nm: analysis performed on data shown in Fig 22
3.3.2 Impact of Rapid Thermal Processing
Figure 24 explains the impact of an RTP on the carrier blocking properties of the
interface stack. Samples were annealed at 200oC, 400oC and 600oC and the results
improved with temperature. However, annealing beyond 600oC will be impractical in view
of the final application of this study, since Ge has a melting point of 938oC and processing
conditions approaching this temperature create additional trap states in the substrate. An
analysis similar to the one described for Figure 23 shows that the annealed samples exhibit
suppressed F-P and TAT mechanisms.
As described in Section 3.3.1 (and can be seen in Fig 23 (left)), a clear region
dominated by Frenkel-Poole emission shows up in devices with 33nm SiO2 when no
y = 0.0021x - 22.552R² = 0.9853
y = 0.0145x - 38.718R² = 0.9475
-30
-28
-26
-24
-22
-20
-18
200 700 1200
ln (
J/E)
sqrt (E) [V1/2cm-1/2]
Frenkel-Poole curves in 20nm SiO2 vs 33nm SiO2
20nm SiO2 33nm SiO2
y = -1.58E+06x - 5.02E+00R² = 9.64E-01
y = -2.23E+06x - 1.04E+01R² = 9.24E-01
-19
-17
-15
-13
-11
-9
-7
-5
0E+00 5E-06 1E-05ln
(J)
1/E (V-1cm)
Trap Assisted Tunneling curves in 20nm SiO2 vs 33nm SiO2
20nm SiO2 33nm SiO2

51
annealing has been performed. From Fig 24, this can be seen to have been eliminated, as
suggested by the lack of a region in the ln (J/E) vs √E curve with a slope ~0.0145. Hence,
RTP results in suppression of F-P tunneling. In the TAT curves, the ln(J) magnitude can
be observed to decrease upon RTP, thereby indicating a suppression of TAT as well.
Figure 24: Suppression of F-P and TAT through Rapid Thermal Annealing: F-P
has been nearly eliminated, while TAT has been suppressed.
3.3.3 Cryogenic measurements
Although room temperature measurements provide preliminary validation of the
impact of remodeling the gate stack composition and processing parameters on the leakage
in detectors, cryogenic characterization is necessary to project the value associated with
these ideas. Figure 25 shows the current-voltage characteristics of the fabricated devices
at 22K. Measurements attempted at 300mK were limited by the system noise floor of the
characterization equipment associated with the cryogenic refrigeration system: the cross-
talk between manganin wires (that connect the electrical contact pads on devices to
external tri-ax cables) sets the noise level in the measurement (close to 0.5pA current at
y = 0.0145x - 38.718R² = 0.9475
y = 0.003x - 32.656R² = 0.7048
-30
-29
-28
-27
-26
550 750 950 1150
ln(J
/E)
sqrt(E) [V1/2cm-1/2]
Frenkel-Poole suppression through 30s RTP at 600oC
33nm SiO2/No Anneal 33nm SiO2/600C anneal
y = -4.11E+06x - 7.29E+00R² = 0.954
y = -2.94E+06x - 1.28E+01R² = 0.878
-18
-17
-16
-15
-14
-13
-12
5.0E-07 1.5E-06 2.5E-06 3.5E-06
ln (
J)
1/E [(V/cm)-1]
Trap Assisted Tunneling mitigation through 30s RTP at 600oC
33nm SiO2/No Anneal 33nm SiO2/600C Anneal

52
0.5V with steady increase with bias voltage). Hence, I-V characterization shown in Figure
25 has been performed at 22K, the lowest temperature at which the leakage current was
found to appear above the noise floor.
Figure 25: Cryogenic characterization (22K) of the fabricated devices
Comparison of curves (a) and (c) in Figure 25 shows very similar leakage
mechanisms in both samples indicating that leakage in samples with 20nm SiO2 cannot be
effectively suppressed even through a 600oC anneal, thus highlighting the necessity to
remodel the configuration of the gate stack. It can be observed that a reconfigured interface
stack with rapid thermal annealing added to the process flow helps reduce the leakage by
about 15 times at a gate voltage of -10V at 22K. The displacement of the curves along the
voltage axis can be explained as a difference in fixed charge densities at Si/SiO2 interface
in different samples.
Tunneling analysis at cryogenic temperatures is slightly different from that at room
temperature, since the substrate, because of being cooled beyond (or very close to) freeze-
out, behaves as an insulator rather than a semiconductor. Hence, the SiO2 layer on top of
1E-09
1E-08
1E-07
1E-06
1E-05
1E-04
-12 -7 -2 3
J [A
/cm
2]
VG [V]
Current-Voltage characteristics: Cryogenic measurements @ T = 22Kp-Si /SiO2/(pc-Si)/W
(a) 20nm SiO2/20nm poly-Si/No Anneal
(b) 33nm SiO2/No Anneal
(c) 20nm SiO2/20nm poly-Si/600C Anneal
(d) 33nm SiO2/600C Anneal

53
Si substrate effectively functions as two capacitors in series. Although the thickness of the
substrate (400um) is about 4 orders of magnitude higher than that of the SiO2 film
(~40nm), the capacitance of the Si substrate cannot be ignored, since the bottom contact
of the substrate (~1cm2) is over three orders of magnitude greater than the top contact area
(~3.5x10⁻³ cm2). Hence, considerable voltage drop occurs across the substrate, which
needs to be accounted for in the E-field calculations. The voltage dropped across the SiO2
layer can be calculated using Fig 26 as
𝑉𝑆𝑖𝑂2
𝑉𝐺−𝑉𝐹𝐵=
𝐶𝑆𝑖
𝐶𝑆𝑖+𝐶𝑆𝑖𝑂2
(3.9)
Figure 26: MOS device viewed as two series capacitors at cryogenic temperatures
Simplifying eq (3.9) gives
𝑉𝑆𝑖𝑂2
𝑉𝐺−𝑉𝐹𝐵=
𝑘𝑆𝑖𝑑𝑆𝑖
𝑟𝑏𝑜𝑡𝑡𝑜𝑚
𝑘𝑆𝑖𝑑𝑆𝑖
𝑟𝑏𝑜𝑡𝑡𝑜𝑚+𝑘𝑆𝑖𝑂2𝑑𝑆𝑖𝑂2
𝑟𝑡𝑜𝑝
(3.9)
where VFB is the flat-band voltage, 𝑘𝑆𝑖 and 𝑘𝑆𝑖𝑂2are the relative dielectric constants
of silicon and SiO2 respectively and rtop and rbottom are the radii of the top and bottom
contacts respectively. Once 𝑉𝑆𝑖𝑂2is extracted, the electric field across the oxide layer can
be determined as |𝐸𝑆𝑖𝑂2| = 𝑉𝑆𝑖𝑂2
/𝑑𝑆𝑖𝑂2

54
Frenkel-Poole tunneling analysis carried out using these electric field calculations
has been shown in Figure 27. The expected slope for F-P emission at 22K is ~0.2014
(Table 1). From Fig 27, regions with this slope can be identified in both samples using
20nm SiO2/20nm pc-Si configurations. The slight deviation of the calculated slope from
expected slope can be explained as a combination of multiple factors including inaccurate
estimation of flat band voltage and bottom contact area. Identification of regions
dominated by TAT is once again hindered by the possible existence of multiple trap states.
Figure 27: Frenkel-Poole analysis at 22K. RTP annealed samples show suppression
of F-P through the elimination of regions with slope ~0.2
Hence, although RTP at 600oC suppresses tunneling mechanisms, considerable
leakage exists even in the annealed samples. This is not completely surprising given that
thermal oxidation− which gives the best quality SiO2 − is usually carried out at

55
temperatures exceeding 1000oC and the annealing temperature during RTP is limited to
600oC. Hence, we look at Laser annealing as described in Chapter-4 as a better annealing
option to heat the SiO2 film to temperatures as high as 1400oC, while keeping the substrate
relatively cold.

56
CHAPTER IV
CO2 LASER ANNEALING
Chapter-3 discusses the impact of annealing on the carrier blocking properties of
SiO2 thin films. Although an RTP at 600oC for 30s is a step in the right direction, there is
still room for improvement, as discussed in Section 3.3.3. To recap, the annealing
temperature has been limited to 600oC since Ge has a relatively low melting point (938oC)
thereby ruling out any processing approaching and exceeding 700oC. However, 600oC is
too low a temperature to achieve desirable properties in the SiO2 layer; the film needs to
be annealed at temperatures over 1200oC. Hence, a way of selectively heating the SiO2
layer while not affecting the Si substrate is needed. This forms the motivation for CO2
laser annealing.
Figure 28: Absorption coefficient of SiO2 at 25oC [adapted from [30]]
The absorption of radiation in a material depends on the absorption coefficient,
of the material at that wavelength, where 𝛼 =4𝜋𝑘
𝜆 determines the depth to which the

57
radiation is absorbed. Shown in Figure 28 (adapted from [30]) is the absorption coefficient
of SiO2 for wavelengths up to 12um, which indicates that SiO2 has a strong absorption for
radiation in the 8um-10.6µm wavelength range. Hence, irradiating a thin film of SiO2 with
a laser beam in this frequency range results in absorption of the laser energy which
increases the temperature of the film. This increase in temperature, followed by a cool
down resulting from withdrawal of the laser beam can be used for annealing the SiO2 film.
The temperatures reached can be controlled using the laser power and scan parameters and
temperatures as high as 1400oC can be achieved with laser powers as low as 8W (more on
this in Section 4.1). Added to this is the fact that both Si and Ge have very weak absorption
in this wavelength range, which means the irradiation of devices causes a selective heating
of the SiO2 film, while not heating the substrate. Si and Ge also act as heat sinks owing to
their relatively high thermal conductivity.
CO2 lasers which can generate laser beams at 9.3µm or 10.6µm are commercially
available, either of which can be used for annealing, since SiO2 has a strong absorption at
both these wavelengths. In this study, a continuous wave (CW) 10.6µm CO2 laser has been
used for scanning the devices post SiO2 deposition. The backside metal contact on the
devices was deposited (sputter-deposited or e-beam evaporated) prior to laser anneal for
two reasons: 1. Metals reflect CO2 laser beam incident on them thus preventing
contamination of the devices due to melting of the platform on which the samples are
placed and 2. The metal film also adds advantage as a heat sink, to quickly dissipate the
large amounts of heat generated during the anneal process thereby supplementing the
substrate. Besides these, a thin (~150nm) metal coating on the bottom of the device helps
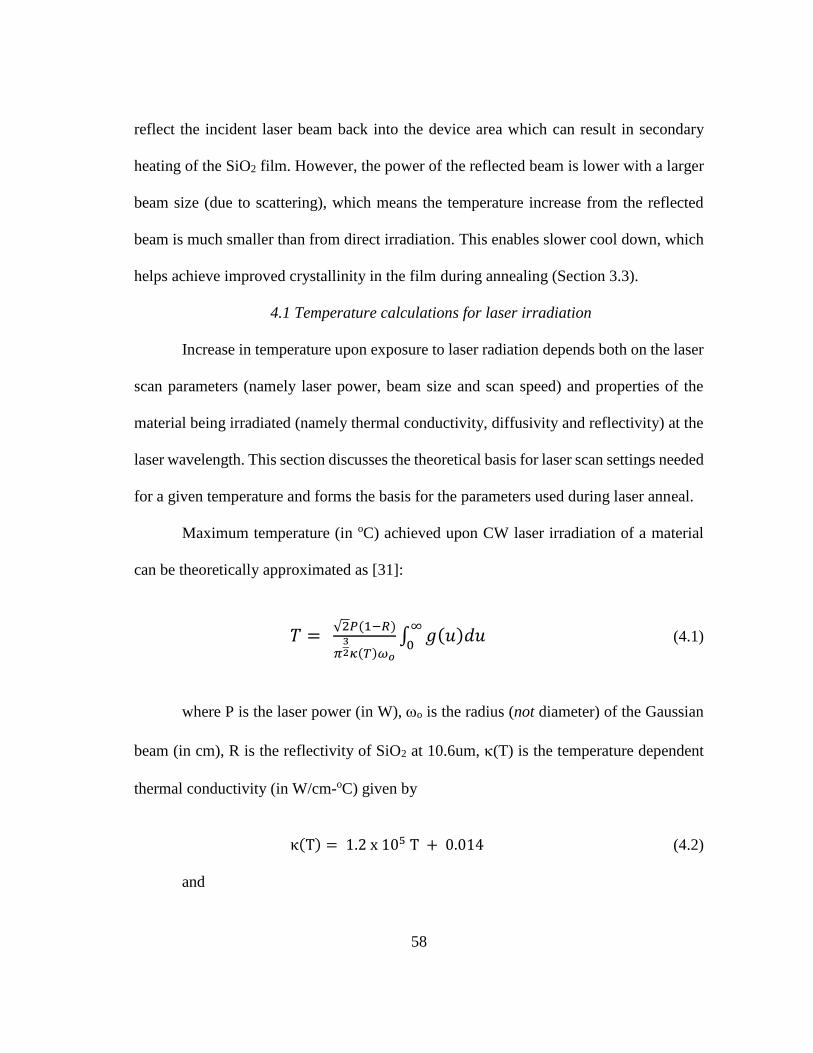
58
reflect the incident laser beam back into the device area which can result in secondary
heating of the SiO2 film. However, the power of the reflected beam is lower with a larger
beam size (due to scattering), which means the temperature increase from the reflected
beam is much smaller than from direct irradiation. This enables slower cool down, which
helps achieve improved crystallinity in the film during annealing (Section 3.3).
4.1 Temperature calculations for laser irradiation
Increase in temperature upon exposure to laser radiation depends both on the laser
scan parameters (namely laser power, beam size and scan speed) and properties of the
material being irradiated (namely thermal conductivity, diffusivity and reflectivity) at the
laser wavelength. This section discusses the theoretical basis for laser scan settings needed
for a given temperature and forms the basis for the parameters used during laser anneal.
Maximum temperature (in oC) achieved upon CW laser irradiation of a material
can be theoretically approximated as [31]:
𝑇 = √2𝑃(1−𝑅)
𝜋32𝜅(𝑇)𝜔𝑜
∫ 𝑔(𝑢)𝑑𝑢∞
0 (4.1)
where P is the laser power (in W), o is the radius (not diameter) of the Gaussian
beam (in cm), R is the reflectivity of SiO2 at 10.6um, (T) is the temperature dependent
thermal conductivity (in W/cm-oC) given by
κ(T) = 1.2 x 10⁵ T + 0.014 (4.2)
and

59
𝑔(𝑢) = 1
1+𝑢2𝑒
−𝛽𝑢4
1+𝑢2 (4.3)
where
𝛽 = 2 (𝑣𝜔𝑜
8√2𝐷𝑡)
2 (4.4)
and Dt is the thermal diffusivity of SiO2.
4.2 Laser scan parameters
Scanning an SiO2 film using a laser beam of power 6W at a scan speed of 2cm/s
can theoretically result in temperatures as high as 1300oC. The step size between
successive scans in the raster pattern does not factor in the maximum temperature
calculations from Section 4.1. However, it needs to be remembered that the laser beam is
Gaussian, which means the power density exponentially decreases radially from the center
of the beam (𝑃(𝑟) ∝ 𝑒−
𝑟2
2𝜎2). Continuous irradiation in the direction of the scan (say, x-)
ensures uniform heating along this direction. However, to achieve uniform heating
throughout the device, it is important to keep the step-size (in the y-direction) small
enough such that the power received is nearly uniform at all points on the device. Hence,
the y-step size has been determined to be at most 1/4th of the beam diameter, thereby
ensuring that the power received by any point on the SiO2 layer during the scan is greater
than 97% of the peak power (𝑃𝑚𝑖𝑛 = 𝑃𝑜𝑒−
(𝜎4
)2
2𝜎2 ). Also, assuming the power density in the
device to decay with depth according to the Beer-Lambert’s law (𝐼(𝑧) = 𝐼𝑜𝑒−𝛼𝑧), the
power is practically constant throughout the depth of the 40nm SiO2 film.

60
4.2.1 Film densification through laser anneal
An increase in refractive index of the SiO2 layer upon annealing is accompanied
by a corresponding decrease in the film thickness due to condensation of the film. The
impact of laser annealing on film densification has been studied using the refractive index
and oxide thickness measurements as a function of the laser scan parameters. A refractive
index of ~1.4614, which corresponds to thermally deposited oxide is targeted while
designing the specifications for laser annealing. The results of normalized thickness (ratio
of thickness measured after laser anneal to thickness measured as deposited) and refractive
index as a function of laser power at a scan speed of 15mm/s are shown in Figure 29.
Figure 29: Densifying impact of laser annealing on 45nm SiO2 film
Figure 29 shows a clear increase in density of the deposited SiO2 film through a
gradual decrease in the film thickness. An increase in refractive index demonstrates the
1.35
1.37
1.39
1.41
1.43
1.45
1.47
1.49
0
0.2
0.4
0.6
0.8
1
1.2
AsDeposited
1.8W 2.4W 3W 4.8W 6W
Re
frac
tive
ind
ex,
'n'
No
rmal
ize
d t
hic
kne
ss
Laser Power
Film densification through Laser annealingScan speed = 15mm/s
Normlized thickness Refractive index

61
lowered density of oxygen vacancies in the SiO2 layer or conversely, increased oxygen
content. Hence, the film quality can be understood to improve upon laser annealing.
To further test the improvement in quality of the SiO2 film upon annealing, the wet
etch rate test described by Ya’nan Wang et al. has been adapted [32]. The wet etch rates
of the laser annealed SiO2 in diluted HF (10 parts H2O:1-part 49% HF) have been
compared for different laser powers against a thermally oxidized layer of the same
thickness and the results are shown in Fig 4.3.
Figure 30: Wet etch rates of SiO2 for different power levels. Scan speed has been
fixed at 1.5cm/s during all laser anneals
4.2.2 Pinhole formation
The SiO2 film properties can be seen to improve upon increasing the laser power
from 2W to 6W as described in Section 4.2.1. However, this trend has been found to
terminate at power levels of ~10W (for a scan speed of 15mm/s). Beyond this, increasing
the power used during the laser anneal process results in pinhole formation resulting in
serious leakage, as discussed in Section 4.3.
60
70
80
90
100
110
120
2W 4W 6W Thermaloxide
wet
etc
h t
ime
[s]
Laser power
Wet etch rate test: 42nm oxide

62
Fig 31 shows the microscope images of the devices annealed at different laser
powers. The formation and worsening of pinholes can be clearly observed to be correlated
with the laser power for a given scan speed. It needs to be emphasized that the laser power,
scan speed and beam size all play a role in determining the scan parameters where the
SiO2 film characteristics start to deteriorate. For a lower scan speed or a smaller beam size,
pinhole formation starts to occur for lower power levels, since ablating temperatures are
reached for lower powers according to eq (4.1).
Figure 31: Microscope images of SiO2 film: Pinhole formation as a function of laser
power. Scan speed has been kept constant at 15mm/s
4.3 Room temperature I-V measurements
Room temperature I-V measurements performed on Ge/SiO2/W devices have been
shown in Figure 32 and leakage in devices with as-deposited SiO2 has been compared to
that in devices annealed at 8W power and 15mm/s scan speed. Measurements on Ge
devices are central to this work, since the final aim is to improve the carrier blocking
properties in Ge based devices and improvement shown in Si devices is desired to be also

63
seen in Ge devices. The laser annealed devices show a leakage 30 times lower than the as-
deposited devices.
Figure 32: Room Temperature J-V measurements on Ge/SiO2/W devices
Room temperature measurements shown in Figure 33 help understand the impact
of pinholes shown in Figure 31 on leakage. It can be noticed that the leakage current
gradually decreases with an increase in the maximum temperature reached (as a
combination of laser power and scan speed) but then results in serious leakage in the
devices once pinholes start to show up. This measurement emphasizes that the pinholes
are in fact defects in the SiO2 film formed during annealing and result in low resistance
conduction paths.
In view of the leakage in devices annealed at 8W power at 10mm/s being lower
than in devices annealed at 8W power at 15mm/s, measurements shown in Figure 32 are
planned to be extended to characterize devices annealed at more temperatures (i.e.

64
different laser scan parameters). Also, cryogenic measurements on these devices are
planned to be performed to better understand the impact of annealing in arresting leakage
at extremely low temperatures.
Figure 33: Room temperature I-V characterization: Si/SiO2/W devices
Decreased leakage can be seen to be accompanied by absence of high-slope
regions localized in voltage. This shows that the lowered current is a consequence of
suppressed tunneling. Also, it can be seen that in devices annealed at 10W@10mm/s and
at 12W@15mm/s, tunneling sets in at voltages as low as 0.3V, emphasizing the deleterious
impact of indiscriminately high temperature processing.
4.4 C-V measurements
The analysis of interface trap density using C-V measurements has been discussed
in Section 3.1.2. In this section, we use the C-V and Gp-V analysis to demonstrate a
decrease in the interface trap density upon 8W laser annealing. The measurements have
been performed on Ge substrate rather than Si, to demonstrate that annealing results in no

65
significant formation of interface trap states due to oxidation of the Ge substrate and
resultant dangling bonds at the Ge/SiO2 interface.
Figure 34 shows the C-V measurements performed on devices with as-deposited
SiO2 and 8W laser annealed devices.
Figure 34: C-V measurements: impact of laser annealing: Ge/SiO2/W devices
Interface trap states result in an early onset of accumulation (i.e. for lower
magnitude of gate voltage) and delayed inversion, thereby stretching out the C-V curves
in the depletion region [22]. Hence, C-V curves on devices with higher Dit (density of
interface states) effectively look like stretched-out versions of those with lower Dit (with
possible differences in the magnitude also). Comparison of C-V measurements on the as-
deposited devices and laser annealed samples reveals that laser annealing compresses the
curves, thereby suggesting a decrease in Dit. The C-V curves on the laser annealed samples
also show lower frequency dispersion in the depletion region than the as-deposited
samples.
Figure 35 shows the Gp-V measurements made along with the C-V measurements
in Figure 34. These measurements have been corrected for series resistance as described
in Section 3.1.2 and the results are as shown in Figure 36.

66
Figure 35: Gp-V measurements: impact of laser annealing: Ge/SiO2/W devices
Figure 36: Comparison of Gp/ vs curves for as-deposited and laser annealed
devices: Laser annealing demonstrates a decrease in interface trap density

67
Comparison of Gp/ vs curves on the as-deposited samples and laser annealed
devices shows a better fit to eq. (3.4). This indicates that the density of trap states has been
improved to the extent where the corrected Gp/ vs information can be fit using a
superimposition of fewer trap states. This, however, indicates a suppression of trap state
density at high frequencies but it can be used to holistically demonstrate an alleviation of
density of traps throughout the device, which translates into lowered carrier leakage
through the interface and by extension, lower noise floor, even for DC bias conditions.
4.5 Cryogenic Measurements
Results from cryogenic characterization have been shown in Figure 37. A gradual
decrease in leakage in all samples can be noticed as the devices are cooled down below
30K. For temperatures below 15K, the leakage signal from the devices has been found to
be submerged underneath the system noise floor.
Leakage characteristics of the RTP annealed devices and CO2 laser annealed
devices in comparison with the as-deposited samples at 20K has been shown in Figure 38.
It can be seen that leakage in the laser annealed devices is about three orders of magnitude
lower than the as-deposited samples and two orders of magnitude lower than the RTP
devices. Leakage in RTP devices has been measured to be an order of magnitude lower
than as-deposited devices, in agreement in the measurements presented in Section 3.3.3.
This decrease in leakage corresponds to a significant improvement in the minimum
detectable signal level, which is a very important step in the direction of detecting events
previously shielded by system noise floor.

68
Figure 37: Cryogenic I-V Measurements – leakage hits noise floor for T<15K

69
Figure 38: Leakage comparison in as-deposited, RTP annealed and laser annealed
devices at 20K
Section 4.2.2 described the formation of pinholes at high temperatures and the
room temperature I-V measurements from Section 4.3 showed that devices with pinholes
exhibited increased leakage. Cryogenic characterization of these devices has shown that
this trend of increased leakage holds even at extremely low temperature, thereby limiting
the temperatures that can be used during laser annealing.
Figure 39: Leakage comparison in devices annealed at 10W power at 10mm/s scan
speed and 8W-10mm/s scan; increased leakage in the former can be attributed to
pinhole formation
70
CHAPTER V
CONCLUSIONS
The C-V and Gp/− results presented in Chapters 3 and 4 show a clear decrease
in the high frequency interface trap density upon annealing which can be interpreted as a
decrease in the overall trap density. This reduced trap density in turn results in lowered
leakage driven by trap-mediated tunneling mechanisms, namely Frenkel-Poole emission
and Trap-assisted tunneling. I-V characterization revealed that rapid thermal annealing at
600oC for 30 seconds lowered leakage by over an order of magnitude, while laser
annealing at 8W power and 10mm/s scan speed decreased carrier leakage by three orders
of magnitude at 20K thereby confirming that the proposed processing modifications result
in drastic improvement in carrier blocking at cryogenic temperatures. This lowered
leakage translates into lowered noise floor in cryogenic detectors and thus helps
significantly in the pursuit of exotic particle interactions.
Relatively low melting point of Ge substrate determines the upper limit of usable
temperatures in RTP, while the maximum processing temperature in laser annealing is
limited by the formation of pinholes which have been found to significantly contribute to
leakage. Pinhole formation in the SiO2 film suggests ablation of the film, which puts an
upper limit on temperatures usable for annealing in interfaces using SiO2, thereby giving
completeness to the study.
The lowest temperatures which yield useful data in this study has been restricted
by the cryogenic system noise floor to ~16K. The next step is to characterize the devices

71
at temperatures as low as 300mK by using a charge amplifier to amplify the signal. These
measurements can provide significant insight into understanding the impact of the
processing conditions on event detection. These measurements, called the “Source
measurements” can be used to detect actual events caused by cosmogenic radiation in the
devices developed and the noise floor improvement at sub milli-kelvin temperatures can
be used to evaluate the impact of this study.
The process modifications identified in this thesis are planned to be implemented
on Ge- PPC (P-type Point Contact) detectors, to test the improvement in leakage. The
results from these measurements are expected to motivate subtle tweaks to the process
parameters and ultimately, more widespread applications of this research.

72
REFERENCES
[1] PIRE-GEMADARC: http://pire.gemadarc.org/
[2] Oort, J., “The force exerted by the stellar system in the direction perpendicular
to the galactic plane and some related problems”, Astronomical Institute of the
Netherlands, 1932.
[3] Zwicky, F., “On the Masses of Nebulae and of Clusters of Nebulae”, The
Astrophysical Journal, 1937.
[4] Ruben et al., “Rotational Properties of 21 Sc Galaxies with a Large Range of
Luminosities and Radii, from NGC4605 (R=4kpc) to UGC2885 (R=122kpc)”,
The Astrophysical Journal, 1980.
[5] Sunil Golwala, “Exclusion Limits on the WIMP-Nucleon Elastic-Scattering
Cross Section from the Cryogenic Dark Matter Search”, Dissertation,
University of California, Berkeley, 1995.
[6] Scott Hertel, “Advancing the search for Dark Matter: from CDMS II to
SuperCDMS”, Dissertation, MIT, 2012.
[7] Matt Pyle, “Optimizing the design and analysis of cryogenic semiconductor
Dark Matter Detectors for Maximum sensitivity”, Dissertation, Stanford
University, 2012.
[8] Ben Shank, “Testing and Characterization of SuperCDMS Dark Matter
Detectors”, Dissertation, Stanford University, 2014.

73
[9] P. N. Luke, “Voltage-assisted calorimetric ionization detector”, Journal of
Applied Physics, 1988.
[10] Nader Mirabolfathi et al., “Toward Single Electron Resolution Phonon
Mediated Ionization Detectors”, Nuclear Instrumentation Methods A 855,
2017.
[11] Arran Phipps, “Ionization Collection in Detectors of the Cryogenic Dark
Matter Search”, Dissertation, University of California, Berkeley, 2016.
[12] Kyle Sundqvist, “Carrier Transport and Related Effects in detectors of the
Cryogenic Dark Matter Search”, Dissertation, University of California,
Berkeley, 2012.
[13] Band Diagram Program, Link: http://nano.boisestate.edu/research-areas/multi-
dielectric-energy-band-diagram-program/
[14] Yan Qiang Cao et al., “The effect of thermal treatment induced inter diffusion
at the interfaces on the charge trapping performance of HfO2/Al2O3
nanolaminate based memory devices”, Journal of Applied Physics, 2013.
[15] Fu-Chien Chiu, “A review on conduction mechanisms in dielectric films”,
Advances in Materials Science and Engineering, Volume 2014, Article ID
578168, 2014.
[16] Ben G. Streetman and Sanjay K. Banerjee, “Solid State Electronic Devices”,
7th Edition, Pearson Publications.

74
[17] Wen-Chin Lee, “Modeling CMOS tunneling currents through ultrathin gate
oxide due to conduction- and valence-vand electron and hole tunneling”, IEEE
Transactions on Electron. devices, Vol. 48, No. 7, 2001.
[18] M. Lenzlinger and E.H. Snow, “Fowler-Nordheim tunneling into thermally
grown SiO2”, Journal of Applied Physics, Vol. 40, No. 1, 1969.
[19] Iman Gatabi, “Tunnel MOS Heterostructure Field Effect Transistor for RF
switching applications”, Dissertation, Texas A&M University, 2013.
[20] Oleg Mitrofanov and Michael Manfra, “Poole-Frenkel electron emission from
the traps in AlGaN/GaN transistors”, Journal of Applied Physics, Vol. 95, No.
11, 2004.
[21] J. Frenkel, “On pre-breakdown phenomena in insulators and electronic
semiconductors”, Phys. Rev. 54, 647, 1938.
[22] Dieter K. Schroder, “Semiconductor Material and Device Characterization”,
3rd Edition, Chapter-6, IEEE Press, John-Wiley Publication, 2006.
[23] J.R. Brews and E.H. Nicollian, “Improved MOS Capacitor measurements
using the QC method”, Solid State Electron., 27, 1984.
[24] E.H. Nicollian and J.R. Brews, “MOS Physics and Technology”, Wiley, 1982.
[25] Derek Johnson, “Si-CMOS-Like integration of AlGaN/GaN dielectric-gated
high electron mobility transistors”, Dissertation, Texas A&M University,
2014.

75
[26] N. Mast et al., “Performance of the first 150mm diameter Cryogenic silicon
ionization detectors with contact-free electrodes”, Nuclear Instrumentation and
Methods in Physics Research, A, 2018.
[27] D.K. Venkatachalam et al., “Nanomechanical properties of sputter-deposited
HfO2 and HfxSi1-xO2 thin films”, Journal of Applied Physics, 110, 043527,
2011.
[28] K.L. Du and M.N.S. Swamy, “Simulated annealing. In: Search and
optimization by metaheuristics”, Springer International Publication,
Switzerland, 2016.
[29] Van Laarhoven P.J.M., Aarts E.H.L., “Simulated annealing. In: Simulated
Annealing: Theory and Applications. Mathematics and Its Applications”, vol
37. Springer, Dordrecht, 1987.
[30] Steven T. Yang et al., “Comparing the use of mid-infrared vs far-infrared lasers
for mitigating damage growth on fused silica”, Applied Optics, DOI: 10.1364,
2010.
[31] D.J. Taylor, D.P. Birnie III, and B.D. Fabes, “Temperature Calculation for
Laser Irradiation of sol-gel films on oxide substrates”, J. Mater. Res. 10, 1429,
1995.
[32] Ya’nan Wang et. al., “Laser Annealing of SiO2 film deposited by ICPECVD
for fabrication of silicon based low loss waveguide”, Frontiers of
Optoelectronics, 9(2): 323–329, 2016.