Embed Size (px)
Citation preview

Improved Control of Ion Populations for Orbitrap Mass AnalysisPhilip Remeš, Jesse Canterbury, Mike Senko, Romain Huguet, Vlad Zabrouskov, Nina Soltero, Shannon Eliuk Thermo Fisher Scientific, San Jose, CA
2 Improved Control of Ion Populations for Orbitrap Mass Analysis
0 5 10 15 20 25 30 35 40 45 50 55 60-1.12
-0.84
-0.56
-0.28
-1.14
-0.76
-0.38
0.00
Freq
uenc
y Sh
ift (p
pm)
Time (s)
MRFA2+
b)Angiotensin2+
Observed Estimated
a)
0 1 2 3 4 5
-0.12
-0.10
-0.08
-0.06
-0.04
-0.02
0.00
Slop
e (p
pm /
ion
* mas
s)
Adjacent Isotope Spacing (kHz)
Deflector Measure (V) 400 V 453 V 500 V 550 V 600 V 650 V
Improved Control of Ion Populations for Orbitrap Mass Analysis Philip Remeš, Jesse Canterbury, Mike Senko, Romain Huguet, Vlad Zabrouskov, Nina Soltero, Shannon Eliuk Thermo Fisher Scientific, San Jose, CA
Conclusion The ion trap prescan for the Orbitrap full scan is an untapped source of intensity
information that can be used in several ways.
The accuracy of Predictive Automatic Gain Control for dependent scans is improved, from a median of 3x overfilling in the control case, to an ideal 1x of the requested target in the improved case.
Adjacent ion coupling in the Orbitrap can be characterized, and corrected for, such that we observe reduced mass shifts of intense precursor ions at the top of their elution profiles.
References 1. Grinfeld, D; Makarov, A.; Denisov, E. “Crowd Control” of Ions in Orbitrap Mass
Spectrometry. ASMS 2012.
Overview Purpose: Provide fine grained control of automatic gain control procedures, for increased mass accuracy and duty cycle
Methods: Electron multiplier measurement of ion flux coupled with study of ion coalescence effects allows to reduce over filling in both master scans and dependent scans
Results: Accuracy of dependent scan populations is improved by 3x, while adjacent ion coupling shifts in full scans are decreased by ~1.6x.
Introduction Trapping instruments such as a Thermo Scientific™ Orbitrap™ detector based mass spectrometer achieve highest performance when the number of ions analyzed is within certain limits, which depend on the parameters of the physical device and the detection system. Overfilling of the analyzer with a single analyte is particularly unfavorable, as it leads to a deviation of the observed mass-to-charge from the theoretical value, which is not accounted for by a global space-charge calibration. Using knowledge of how a given analyte ion is affected by adjacent ions, situations that will lead to erroneous mass measurements can be recognized, and the target for the Orbitrap master scan can be reduced to an acceptable level in those scans. On a hybrid instrument such as the Thermo Scientific™ Orbitrap Fusion™ Tribrid™ mass spectrometer, measurements can be made with the ion trap prescan spectrum, which can also be interrogated for predictive automatic gain control (PAGC) of the dependent scans. This eliminates underestimation of low level signals that occurs in Orbitrap master scans, resulting in accurate estimation of injection times and improved duty cycles.
Methods Mass Spectrometry
All experimental data were generated using an Orbitrap Fusion Tribrid Mass Spectrometer. Thermo Scientific™ Pierce™ LTQ ESI Positive Ion Calibration Solution was used for calibration of adjacent ion interactions. Nano-LC/MS experiments were performed by injecting 1 µg of tryptic HeLa digest or 100 fmol BSA digest onto a Thermo Scientific™ Acclaim™ PepMap™ C18 column (75µm x 25 cm), with 140 min gradient separation, performed using a Thermo Scientific™ EASY-nLC 1000 ultra-high pressure LC.
Sensitivity of Electron Multiplier Detection
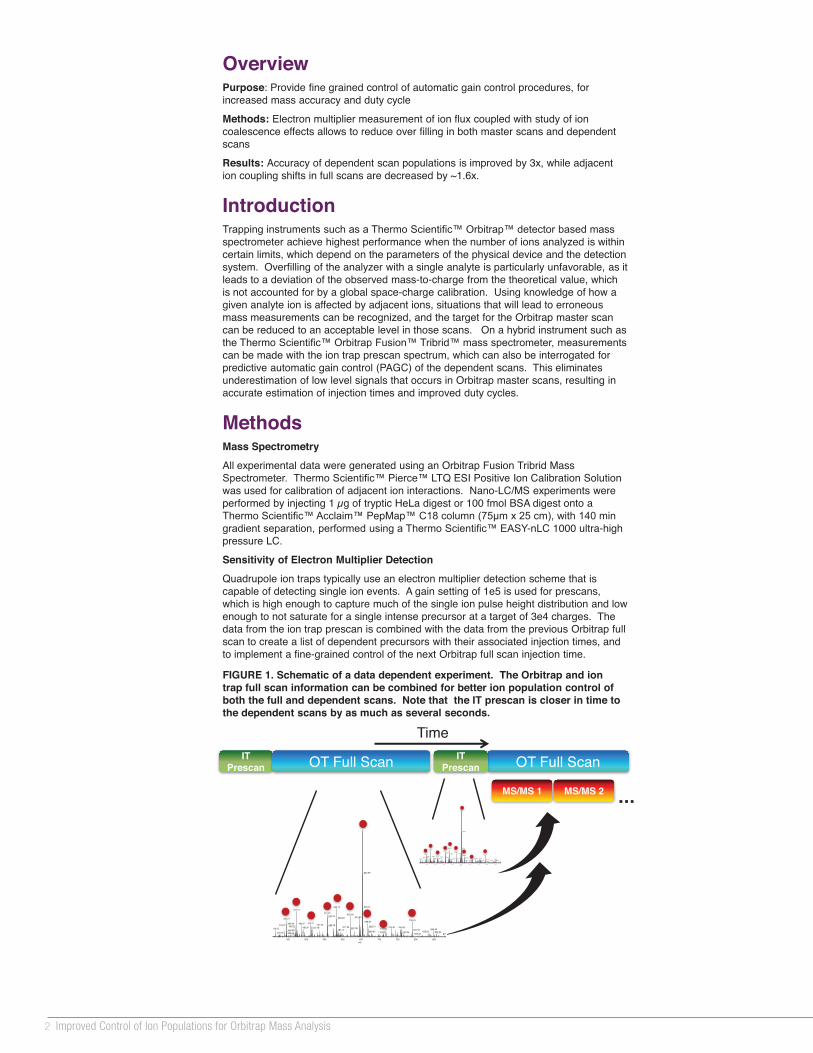
Quadrupole ion traps typically use an electron multiplier detection scheme that is capable of detecting single ion events. A gain setting of 1e5 is used for prescans, which is high enough to capture much of the single ion pulse height distribution and low enough to not saturate for a single intense precursor at a target of 3e4 charges. The data from the ion trap prescan is combined with the data from the previous Orbitrap full scan to create a list of dependent precursors with their associated injection times, and to implement a fine-grained control of the next Orbitrap full scan injection time.
FIGURE 1. Schematic of a data dependent experiment. The Orbitrap and ion trap full scan information can be combined for better ion population control of both the full and dependent scans. Note that the IT prescan is closer in time to the dependent scans by as much as several seconds.
Characterization of Adjacent Ion Interactions
The interaction of ions with similar oscillation frequencies has been studied in a variety of related instruments, including ion cyclotron resonance, multi-reflectron devices (TOF and other), and Orbitrap mass analyzers.1 Under appropriate trapping conditions, the interaction of two adjacent ions results in a shift of both of their oscillation frequencies towards the others, as illustrated in Figure 4.
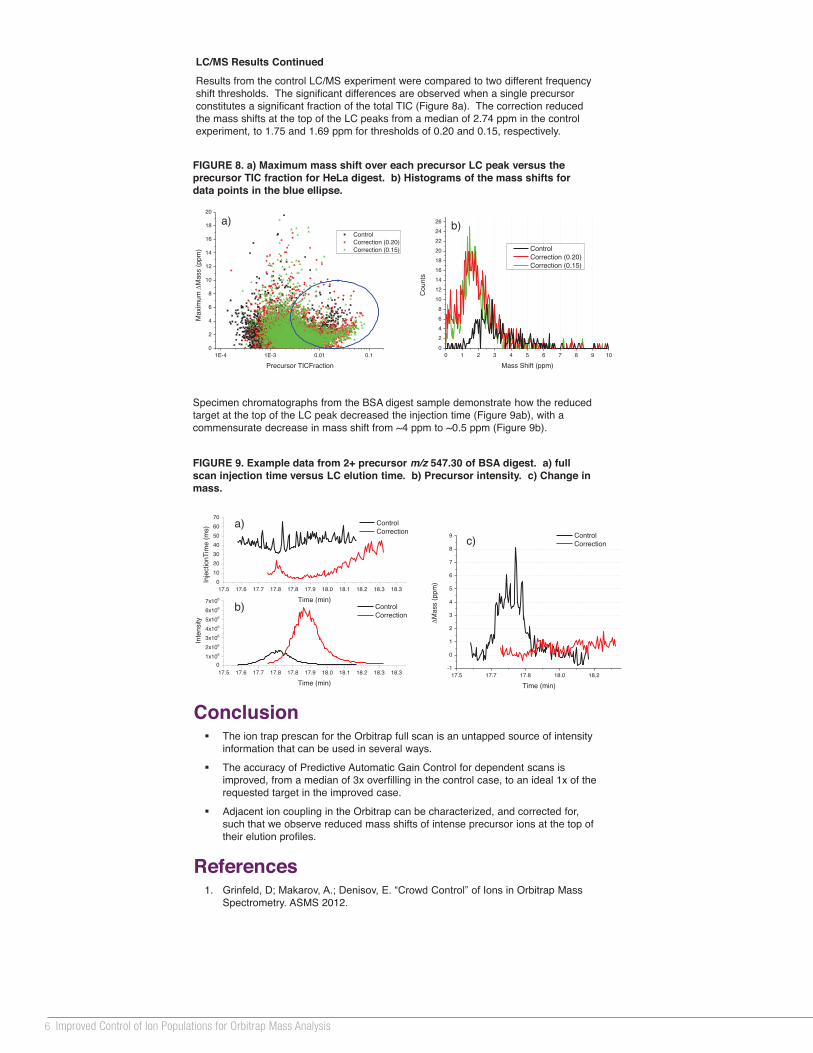
LC/MS Results Continued
Results from the control LC/MS experiment were compared to two different frequency shift thresholds. The significant differences are observed when a single precursor constitutes a significant fraction of the total TIC (Figure 8a). The correction reduced the mass shifts at the top of the LC peaks from a median of 2.74 ppm in the control experiment, to 1.75 and 1.69 ppm for thresholds of 0.20 and 0.15, respectively.
All trademarks are the property of Thermo Fisher Scientific and its subsidiaries.
This information is not intended to encourage use of these products in any manners that might infringe the intellectual property rights of others.
PO64117-EN 0614S
FIGURE 5. Slope of monoisotope oscillation frequency shift versus spacing between adjacent isotopes. The data are fit to Equation 2. Various experimental parameters can influence the magnitude of frequency shift.
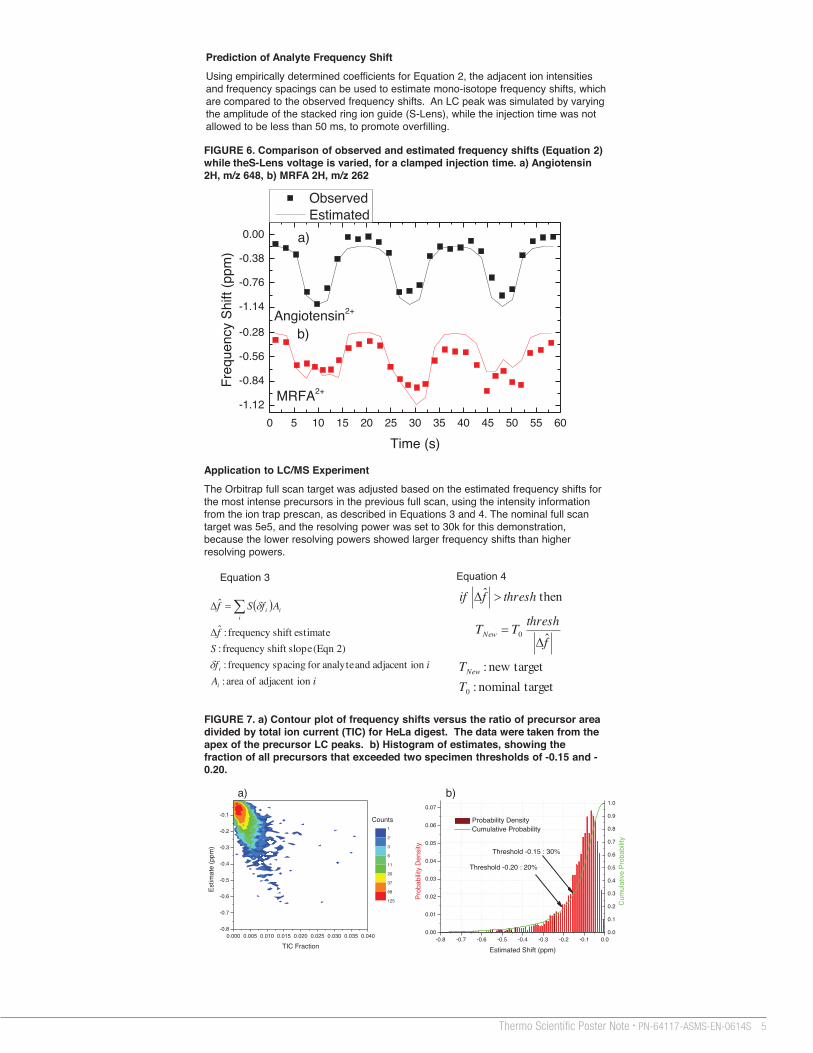
FIGURE 7. a) Contour plot of frequency shifts versus the ratio of precursor area divided by total ion current (TIC) for HeLa digest. The data were taken from the apex of the precursor LC peaks. b) Histogram of estimates, showing the fraction of all precursors that exceeded two specimen thresholds of -0.15 and -0.20.
FIGURE 6. Comparison of observed and estimated frequency shifts (Equation 2) while theS-Lens voltage is varied, for a clamped injection time. a) Angiotensin 2H, m/z 648, b) MRFA 2H, m/z 262
Adjacent ion interactions are characterized by analyzing two closely spaced species at increasing abundances. When one species is kept at a constant abundance and the other species’ abundance is varied, the shift in oscillation frequency is linear (Figure 4). These slopes are measured for a series of different adjacent ions pairs in LTQ Calmix (Figure 5) and multiplied by the mass-to-charge to account for the conversion between frequency shift (proportional to acceleration) to force.
Prediction of Analyte Frequency Shift
Using empirically determined coefficients for Equation 2, the adjacent ion intensities and frequency spacings can be used to estimate mono-isotope frequency shifts, which are compared to the observed frequency shifts. An LC peak was simulated by varying the amplitude of the stacked ring ion guide (S-Lens), while the injection time was not allowed to be less than 50 ms, to promote overfilling.
d
t
fcba
fffft
tdttftfF
1
...sin
coscos1
21
21
1
0
221
221
21
rqqk
F e
2 and 1ion between distance :
iion of charge :
constant charge :
force :
21rqkF
i
e
Equation 1
spacingfrequency :
parameters fitting : ,,,
iion offrequency :
time:
fdcba
ft
i
Equation 2
1000000 1E7 1E8
1
2
3
4
5
6M
S/M
S Ar
ea /
Targ
et
1
2
3
5
9
15
27
46
80
Scans
Improved pAGC
1000000 1E7 1E8
1
2
3
4
5
6 Normal pAGC
Full Scan Area
MS/
MS
Area
/ Ta
rget
0 1 2 3 4 5 6 70.00
0.01
0.02
0.03
0.04
Prob
abilit
y D
ensi
ty
MS/MS Area / Target
Traditional 0% CE Traditional 35% CE Improved, 0% CE Improved, 35% CE
Improved PAGC Accuracy
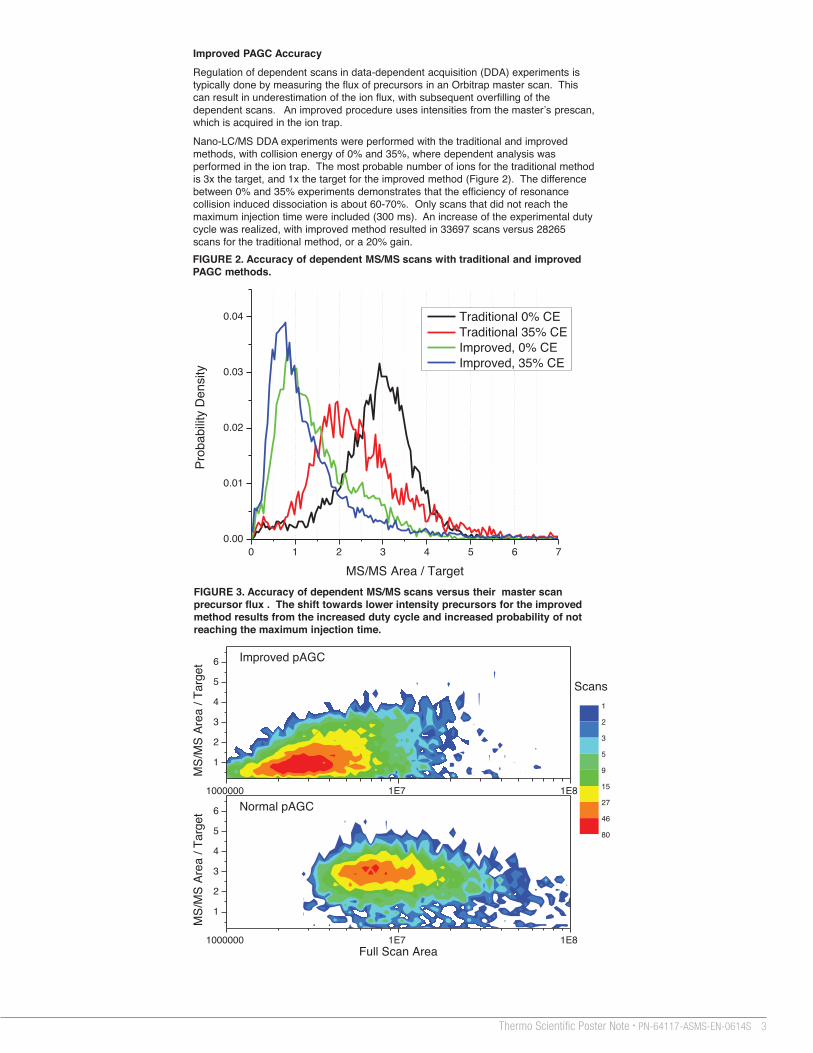
Regulation of dependent scans in data-dependent acquisition (DDA) experiments is typically done by measuring the flux of precursors in an Orbitrap master scan. This can result in underestimation of the ion flux, with subsequent overfilling of the dependent scans. An improved procedure uses intensities from the master’s prescan, which is acquired in the ion trap.
Nano-LC/MS DDA experiments were performed with the traditional and improved methods, with collision energy of 0% and 35%, where dependent analysis was performed in the ion trap. The most probable number of ions for the traditional method is 3x the target, and 1x the target for the improved method (Figure 2). The difference between 0% and 35% experiments demonstrates that the efficiency of resonance collision induced dissociation is about 60-70%. Only scans that did not reach the maximum injection time were included (300 ms). An increase of the experimental duty cycle was realized, with improved method resulted in 33697 scans versus 28265 scans for the traditional method, or a 20% gain. FIGURE 2. Accuracy of dependent MS/MS scans with traditional and improved PAGC methods.
FIGURE 3. Accuracy of dependent MS/MS scans versus their master scan precursor flux . The shift towards lower intensity precursors for the improved method results from the increased duty cycle and increased probability of not reaching the maximum injection time.
The amount of frequency shift of adjacent ions with frequencies f1 and f2 depends on their frequency spacing δf, which determines the time averaged distance and thus force applied between them, through Coulomb’s law (Equation 1).
Application to LC/MS Experiment
The Orbitrap full scan target was adjusted based on the estimated frequency shifts for the most intense precursors in the previous full scan, using the intensity information from the ion trap prescan, as described in Equations 3 and 4. The nominal full scan target was 5e5, and the resolving power was set to 30k for this demonstration, because the lower resolving powers showed larger frequency shifts than higher resolving powers.
FIGURE 4. Shift of MRFA isotopes at constant 3e4 ions as adjacent isotope abundance is varied
0 20000 40000 60000 80000 100000-1.5
-1.0
-0.5
0.0
0.5
1.0
1.10 ppm/ion
C13 C12
Freq
uenc
y Sh
ift (p
pm)
Adjacent Ions
-1.62e-5 ppm/ion
hela_140_1_2 #17512 RT: 47.65 AV: 1 NL: 2.45E7T: FTMS + p NSI Full ms [400.00-2000.00]
400 450 500 550 600 650 700 750 800 850m/z
0
5
10
15
20
25
30
35
40
45
50
55
60
65
70
75
80
85
90
95
100
Rel
ativ
e Ab
unda
nce
654.31
654.98
583.73 655.31473.31
557.61 620.38557.94 644.84584.23446.21 790.43668.81512.77446.54 488.27558.28 669.31469.75 733.46 760.88517.28493.31 621.38416.25 717.84 849.40791.43
537.30
584.74
440.22
446.88 669.82 835.91710.83 856.34761.89416.75 468.26
611.64
809.44 877.40
hela_140_1_2 #17512 RT: 47.65 AV: 1 NL: 2.45E7T: FTMS + p NSI Full ms [400.00-2000.00]
400 450 500 550 600 650 700 750 800 850m/z
0
5
10
15
20
25
30
35
40
45
50
55
60
65
70
75
80
85
90
95
100
Rel
ativ
e A
bund
ance
654.31
654.98
583.73 655.31473.31
557.61 620.38557.94 644.84584.23446.21 790.43668.81512.77446.54 488.27558.28 669.31469.75 733.46 760.88517.28493.31 621.38416.25 717.84 849.40791.43
537.30
584.74
440.22
446.88 669.82 835.91710.83 856.34761.89416.75 468.26
611.64
809.44 877.40
OT Full Scan
MS/MS 1
IT Prescan
IT Prescan OT Full Scan
MS/MS 2
Time
0.000 0.005 0.010 0.015 0.020 0.025 0.030 0.035 0.040-0.8
-0.7
-0.6
-0.5
-0.4
-0.3
-0.2
-0.1
a)
TIC Fraction
Estim
ate
(ppm
)
1
2
3
6
11
20
37
68
125
Counts
-0.8 -0.7 -0.6 -0.5 -0.4 -0.3 -0.2 -0.1 0.00.00
0.01
0.02
0.03
0.04
0.05
0.06
0.07
b)
Threshold -0.15 : 30%
Prob
abilit
y D
ensi
ty
Estimated Shift (ppm)
Probability Density
Threshold -0.20 : 20%
0.0
0.1
0.2
0.3
0.4
0.5
0.6
0.7
0.8
0.9
1.0
Cumulative Probability
Cum
ulat
ive
Prob
abilit
y
0 1 2 3 4 5 6 7 8 9 1002468
101214161820222426 b)
Cou
nts
Mass Shift (ppm)
Control Correction (0.20) Correction (0.15)
1E-4 1E-3 0.01 0.10
2
4
6
8
10
12
14
16
18
20
a) Control Correction (0.20) Correction (0.15)
Max
imum
M
ass
(ppm
)
Precursor TICFraction
iAif
Sf
AfSf
i
i
iii
ion adjacent of area :
ion adjacent and analytefor spacingfrequency :
2)(Eqn slopeshift frequency :
estimateshift frequency : ˆ
ˆ
Equation 3 Equation 4
targetnominal :
targetnew :
ˆ
then ˆ
0
0
TT
fthreshTT
threshf if
New
New
FIGURE 8. a) Maximum mass shift over each precursor LC peak versus the precursor TIC fraction for HeLa digest. b) Histograms of the mass shifts for data points in the blue ellipse.
Specimen chromatographs from the BSA digest sample demonstrate how the reduced target at the top of the LC peak decreased the injection time (Figure 9ab), with a commensurate decrease in mass shift from ~4 ppm to ~0.5 ppm (Figure 9b).
FIGURE 9. Example data from 2+ precursor m/z 547.30 of BSA digest. a) full scan injection time versus LC elution time. b) Precursor intensity. c) Change in mass.
17.5 17.6 17.7 17.8 17.8 17.9 18.0 18.1 18.2 18.3 18.30
1x10⁶
2x10⁶
3x10⁶
4x10⁶
5x10⁶
6x10⁶
7x10⁶
b) Control Correction
Inte
nsity
Time (min)
17.5 17.6 17.7 17.8 17.8 17.9 18.0 18.1 18.2 18.3 18.30
10203040506070
a) Control Correction
Inje
ctio
nTim
e (m
s)
Time (min)
17.5 17.7 17.8 18.0 18.2-1
0
1
2
3
4
5
6
7
8
9 c)
Mas
s (p
pm)
Time (min)
Control Correction
3Thermo Scientific Poster Note • PN-64117-ASMS-EN-0614S
0 5 10 15 20 25 30 35 40 45 50 55 60-1.12
-0.84
-0.56
-0.28
-1.14
-0.76
-0.38
0.00
Freq
uenc
y Sh
ift (p
pm)
Time (s)
MRFA2+
b)Angiotensin2+
Observed Estimated
a)
0 1 2 3 4 5
-0.12
-0.10
-0.08
-0.06
-0.04
-0.02
0.00
Slop
e (p
pm /
ion
* mas
s)
Adjacent Isotope Spacing (kHz)
Deflector Measure (V) 400 V 453 V 500 V 550 V 600 V 650 V
Improved Control of Ion Populations for Orbitrap Mass Analysis Philip Remeš, Jesse Canterbury, Mike Senko, Romain Huguet, Vlad Zabrouskov, Nina Soltero, Shannon Eliuk Thermo Fisher Scientific, San Jose, CA
Conclusion The ion trap prescan for the Orbitrap full scan is an untapped source of intensity
information that can be used in several ways.
The accuracy of Predictive Automatic Gain Control for dependent scans is improved, from a median of 3x overfilling in the control case, to an ideal 1x of the requested target in the improved case.
Adjacent ion coupling in the Orbitrap can be characterized, and corrected for, such that we observe reduced mass shifts of intense precursor ions at the top of their elution profiles.
References 1. Grinfeld, D; Makarov, A.; Denisov, E. “Crowd Control” of Ions in Orbitrap Mass
Spectrometry. ASMS 2012.
Overview Purpose: Provide fine grained control of automatic gain control procedures, for increased mass accuracy and duty cycle
Methods: Electron multiplier measurement of ion flux coupled with study of ion coalescence effects allows to reduce over filling in both master scans and dependent scans
Results: Accuracy of dependent scan populations is improved by 3x, while adjacent ion coupling shifts in full scans are decreased by ~1.6x.
Introduction Trapping instruments such as a Thermo Scientific™ Orbitrap™ detector based mass spectrometer achieve highest performance when the number of ions analyzed is within certain limits, which depend on the parameters of the physical device and the detection system. Overfilling of the analyzer with a single analyte is particularly unfavorable, as it leads to a deviation of the observed mass-to-charge from the theoretical value, which is not accounted for by a global space-charge calibration. Using knowledge of how a given analyte ion is affected by adjacent ions, situations that will lead to erroneous mass measurements can be recognized, and the target for the Orbitrap master scan can be reduced to an acceptable level in those scans. On a hybrid instrument such as the Thermo Scientific™ Orbitrap Fusion™ Tribrid™ mass spectrometer, measurements can be made with the ion trap prescan spectrum, which can also be interrogated for predictive automatic gain control (PAGC) of the dependent scans. This eliminates underestimation of low level signals that occurs in Orbitrap master scans, resulting in accurate estimation of injection times and improved duty cycles.
Methods Mass Spectrometry
All experimental data were generated using an Orbitrap Fusion Tribrid Mass Spectrometer. Thermo Scientific™ Pierce™ LTQ ESI Positive Ion Calibration Solution was used for calibration of adjacent ion interactions. Nano-LC/MS experiments were performed by injecting 1 µg of tryptic HeLa digest or 100 fmol BSA digest onto a Thermo Scientific™ Acclaim™ PepMap™ C18 column (75µm x 25 cm), with 140 min gradient separation, performed using a Thermo Scientific™ EASY-nLC 1000 ultra-high pressure LC.
Sensitivity of Electron Multiplier Detection
Quadrupole ion traps typically use an electron multiplier detection scheme that is capable of detecting single ion events. A gain setting of 1e5 is used for prescans, which is high enough to capture much of the single ion pulse height distribution and low enough to not saturate for a single intense precursor at a target of 3e4 charges. The data from the ion trap prescan is combined with the data from the previous Orbitrap full scan to create a list of dependent precursors with their associated injection times, and to implement a fine-grained control of the next Orbitrap full scan injection time.
FIGURE 1. Schematic of a data dependent experiment. The Orbitrap and ion trap full scan information can be combined for better ion population control of both the full and dependent scans. Note that the IT prescan is closer in time to the dependent scans by as much as several seconds.
Characterization of Adjacent Ion Interactions
The interaction of ions with similar oscillation frequencies has been studied in a variety of related instruments, including ion cyclotron resonance, multi-reflectron devices (TOF and other), and Orbitrap mass analyzers.1 Under appropriate trapping conditions, the interaction of two adjacent ions results in a shift of both of their oscillation frequencies towards the others, as illustrated in Figure 4.
LC/MS Results Continued
Results from the control LC/MS experiment were compared to two different frequency shift thresholds. The significant differences are observed when a single precursor constitutes a significant fraction of the total TIC (Figure 8a). The correction reduced the mass shifts at the top of the LC peaks from a median of 2.74 ppm in the control experiment, to 1.75 and 1.69 ppm for thresholds of 0.20 and 0.15, respectively.
All trademarks are the property of Thermo Fisher Scientific and its subsidiaries.
This information is not intended to encourage use of these products in any manners that might infringe the intellectual property rights of others.
PO64117-EN 0614S
FIGURE 5. Slope of monoisotope oscillation frequency shift versus spacing between adjacent isotopes. The data are fit to Equation 2. Various experimental parameters can influence the magnitude of frequency shift.
FIGURE 7. a) Contour plot of frequency shifts versus the ratio of precursor area divided by total ion current (TIC) for HeLa digest. The data were taken from the apex of the precursor LC peaks. b) Histogram of estimates, showing the fraction of all precursors that exceeded two specimen thresholds of -0.15 and -0.20.
FIGURE 6. Comparison of observed and estimated frequency shifts (Equation 2) while theS-Lens voltage is varied, for a clamped injection time. a) Angiotensin 2H, m/z 648, b) MRFA 2H, m/z 262
Adjacent ion interactions are characterized by analyzing two closely spaced species at increasing abundances. When one species is kept at a constant abundance and the other species’ abundance is varied, the shift in oscillation frequency is linear (Figure 4). These slopes are measured for a series of different adjacent ions pairs in LTQ Calmix (Figure 5) and multiplied by the mass-to-charge to account for the conversion between frequency shift (proportional to acceleration) to force.
Prediction of Analyte Frequency Shift
Using empirically determined coefficients for Equation 2, the adjacent ion intensities and frequency spacings can be used to estimate mono-isotope frequency shifts, which are compared to the observed frequency shifts. An LC peak was simulated by varying the amplitude of the stacked ring ion guide (S-Lens), while the injection time was not allowed to be less than 50 ms, to promote overfilling.
d
t
fcba
fffft
tdttftfF
1
...sin
coscos1
21
21
1
0
221
221
21
rqqk
F e
2 and 1ion between distance :
iion of charge :
constant charge :
force :
21rqkF
i
e
Equation 1
spacingfrequency :
parameters fitting : ,,,
iion offrequency :
time:
fdcba
ft
i
Equation 2
1000000 1E7 1E8
1
2
3
4
5
6
MS/
MS
Area
/ Ta
rget
1
2
3
5
9
15
27
46
80
Scans
Improved pAGC
1000000 1E7 1E8
1
2
3
4
5
6 Normal pAGC
Full Scan Area
MS/
MS
Area
/ Ta
rget
0 1 2 3 4 5 6 70.00
0.01
0.02
0.03
0.04
Prob
abilit
y D
ensi
ty
MS/MS Area / Target
Traditional 0% CE Traditional 35% CE Improved, 0% CE Improved, 35% CE
Improved PAGC Accuracy
Regulation of dependent scans in data-dependent acquisition (DDA) experiments is typically done by measuring the flux of precursors in an Orbitrap master scan. This can result in underestimation of the ion flux, with subsequent overfilling of the dependent scans. An improved procedure uses intensities from the master’s prescan, which is acquired in the ion trap.
Nano-LC/MS DDA experiments were performed with the traditional and improved methods, with collision energy of 0% and 35%, where dependent analysis was performed in the ion trap. The most probable number of ions for the traditional method is 3x the target, and 1x the target for the improved method (Figure 2). The difference between 0% and 35% experiments demonstrates that the efficiency of resonance collision induced dissociation is about 60-70%. Only scans that did not reach the maximum injection time were included (300 ms). An increase of the experimental duty cycle was realized, with improved method resulted in 33697 scans versus 28265 scans for the traditional method, or a 20% gain. FIGURE 2. Accuracy of dependent MS/MS scans with traditional and improved PAGC methods.
FIGURE 3. Accuracy of dependent MS/MS scans versus their master scan precursor flux . The shift towards lower intensity precursors for the improved method results from the increased duty cycle and increased probability of not reaching the maximum injection time.
The amount of frequency shift of adjacent ions with frequencies f1 and f2 depends on their frequency spacing δf, which determines the time averaged distance and thus force applied between them, through Coulomb’s law (Equation 1).
Application to LC/MS Experiment
The Orbitrap full scan target was adjusted based on the estimated frequency shifts for the most intense precursors in the previous full scan, using the intensity information from the ion trap prescan, as described in Equations 3 and 4. The nominal full scan target was 5e5, and the resolving power was set to 30k for this demonstration, because the lower resolving powers showed larger frequency shifts than higher resolving powers.
FIGURE 4. Shift of MRFA isotopes at constant 3e4 ions as adjacent isotope abundance is varied
0 20000 40000 60000 80000 100000-1.5
-1.0
-0.5
0.0
0.5
1.0
1.10 ppm/ion
C13 C12
Freq
uenc
y Sh
ift (p
pm)
Adjacent Ions
-1.62e-5 ppm/ion
hela_140_1_2 #17512 RT: 47.65 AV: 1 NL: 2.45E7T: FTMS + p NSI Full ms [400.00-2000.00]
400 450 500 550 600 650 700 750 800 850m/z
0
5
10
15
20
25
30
35
40
45
50
55
60
65
70
75
80
85
90
95
100
Rel
ativ
e Ab
unda
nce
654.31
654.98
583.73 655.31473.31
557.61 620.38557.94 644.84584.23446.21 790.43668.81512.77446.54 488.27558.28 669.31469.75 733.46 760.88517.28493.31 621.38416.25 717.84 849.40791.43
537.30
584.74
440.22
446.88 669.82 835.91710.83 856.34761.89416.75 468.26
611.64
809.44 877.40
hela_140_1_2 #17512 RT: 47.65 AV: 1 NL: 2.45E7T: FTMS + p NSI Full ms [400.00-2000.00]
400 450 500 550 600 650 700 750 800 850m/z
0
5
10
15
20
25
30
35
40
45
50
55
60
65
70
75
80
85
90
95
100
Rel
ativ
e A
bund
ance
654.31
654.98
583.73 655.31473.31
557.61 620.38557.94 644.84584.23446.21 790.43668.81512.77446.54 488.27558.28 669.31469.75 733.46 760.88517.28493.31 621.38416.25 717.84 849.40791.43
537.30
584.74
440.22
446.88 669.82 835.91710.83 856.34761.89416.75 468.26
611.64
809.44 877.40
OT Full Scan
MS/MS 1
IT Prescan
IT Prescan OT Full Scan
MS/MS 2
Time
0.000 0.005 0.010 0.015 0.020 0.025 0.030 0.035 0.040-0.8
-0.7
-0.6
-0.5
-0.4
-0.3
-0.2
-0.1
a)
TIC Fraction
Estim
ate
(ppm
)
1
2
3
6
11
20
37
68
125
Counts
-0.8 -0.7 -0.6 -0.5 -0.4 -0.3 -0.2 -0.1 0.00.00
0.01
0.02
0.03
0.04
0.05
0.06
0.07
b)
Threshold -0.15 : 30%
Prob
abilit
y D
ensi
ty
Estimated Shift (ppm)
Probability Density
Threshold -0.20 : 20%
0.0
0.1
0.2
0.3
0.4
0.5
0.6
0.7
0.8
0.9
1.0
Cumulative Probability
Cum
ulat
ive
Prob
abilit
y
0 1 2 3 4 5 6 7 8 9 1002468
101214161820222426 b)
Cou
nts
Mass Shift (ppm)
Control Correction (0.20) Correction (0.15)
1E-4 1E-3 0.01 0.10
2
4
6
8
10
12
14
16
18
20
a) Control Correction (0.20) Correction (0.15)
Max
imum
M
ass
(ppm
)
Precursor TICFraction
iAif
Sf
AfSf
i
i
iii
ion adjacent of area :
ion adjacent and analytefor spacingfrequency :
2)(Eqn slopeshift frequency :
estimateshift frequency : ˆ
ˆ
Equation 3 Equation 4
targetnominal :
targetnew :
ˆ
then ˆ
0
0
TT
fthreshTT
threshf if
New
New
FIGURE 8. a) Maximum mass shift over each precursor LC peak versus the precursor TIC fraction for HeLa digest. b) Histograms of the mass shifts for data points in the blue ellipse.
Specimen chromatographs from the BSA digest sample demonstrate how the reduced target at the top of the LC peak decreased the injection time (Figure 9ab), with a commensurate decrease in mass shift from ~4 ppm to ~0.5 ppm (Figure 9b).
FIGURE 9. Example data from 2+ precursor m/z 547.30 of BSA digest. a) full scan injection time versus LC elution time. b) Precursor intensity. c) Change in mass.
17.5 17.6 17.7 17.8 17.8 17.9 18.0 18.1 18.2 18.3 18.30
1x10⁶
2x10⁶
3x10⁶
4x10⁶
5x10⁶
6x10⁶
7x10⁶
b) Control Correction
Inte
nsity
Time (min)
17.5 17.6 17.7 17.8 17.8 17.9 18.0 18.1 18.2 18.3 18.30
10203040506070
a) Control Correction
Inje
ctio
nTim
e (m
s)
Time (min)
17.5 17.7 17.8 18.0 18.2-1
0
1
2
3
4
5
6
7
8
9 c)
Mas
s (p
pm)
Time (min)
Control Correction

4 Improved Control of Ion Populations for Orbitrap Mass Analysis
0 5 10 15 20 25 30 35 40 45 50 55 60-1.12
-0.84
-0.56
-0.28
-1.14
-0.76
-0.38
0.00
Freq
uenc
y Sh
ift (p
pm)
Time (s)
MRFA2+
b)Angiotensin2+
Observed Estimated
a)
0 1 2 3 4 5
-0.12
-0.10
-0.08
-0.06
-0.04
-0.02
0.00
Slop
e (p
pm /
ion
* mas
s)
Adjacent Isotope Spacing (kHz)
Deflector Measure (V) 400 V 453 V 500 V 550 V 600 V 650 V
Improved Control of Ion Populations for Orbitrap Mass Analysis Philip Remeš, Jesse Canterbury, Mike Senko, Romain Huguet, Vlad Zabrouskov, Nina Soltero, Shannon Eliuk Thermo Fisher Scientific, San Jose, CA
Conclusion The ion trap prescan for the Orbitrap full scan is an untapped source of intensity
information that can be used in several ways.
The accuracy of Predictive Automatic Gain Control for dependent scans is improved, from a median of 3x overfilling in the control case, to an ideal 1x of the requested target in the improved case.
Adjacent ion coupling in the Orbitrap can be characterized, and corrected for, such that we observe reduced mass shifts of intense precursor ions at the top of their elution profiles.
References 1. Grinfeld, D; Makarov, A.; Denisov, E. “Crowd Control” of Ions in Orbitrap Mass
Spectrometry. ASMS 2012.
Overview Purpose: Provide fine grained control of automatic gain control procedures, for increased mass accuracy and duty cycle
Methods: Electron multiplier measurement of ion flux coupled with study of ion coalescence effects allows to reduce over filling in both master scans and dependent scans
Results: Accuracy of dependent scan populations is improved by 3x, while adjacent ion coupling shifts in full scans are decreased by ~1.6x.
Introduction Trapping instruments such as a Thermo Scientific™ Orbitrap™ detector based mass spectrometer achieve highest performance when the number of ions analyzed is within certain limits, which depend on the parameters of the physical device and the detection system. Overfilling of the analyzer with a single analyte is particularly unfavorable, as it leads to a deviation of the observed mass-to-charge from the theoretical value, which is not accounted for by a global space-charge calibration. Using knowledge of how a given analyte ion is affected by adjacent ions, situations that will lead to erroneous mass measurements can be recognized, and the target for the Orbitrap master scan can be reduced to an acceptable level in those scans. On a hybrid instrument such as the Thermo Scientific™ Orbitrap Fusion™ Tribrid™ mass spectrometer, measurements can be made with the ion trap prescan spectrum, which can also be interrogated for predictive automatic gain control (PAGC) of the dependent scans. This eliminates underestimation of low level signals that occurs in Orbitrap master scans, resulting in accurate estimation of injection times and improved duty cycles.
Methods Mass Spectrometry
All experimental data were generated using an Orbitrap Fusion Tribrid Mass Spectrometer. Thermo Scientific™ Pierce™ LTQ ESI Positive Ion Calibration Solution was used for calibration of adjacent ion interactions. Nano-LC/MS experiments were performed by injecting 1 µg of tryptic HeLa digest or 100 fmol BSA digest onto a Thermo Scientific™ Acclaim™ PepMap™ C18 column (75µm x 25 cm), with 140 min gradient separation, performed using a Thermo Scientific™ EASY-nLC 1000 ultra-high pressure LC.
Sensitivity of Electron Multiplier Detection
Quadrupole ion traps typically use an electron multiplier detection scheme that is capable of detecting single ion events. A gain setting of 1e5 is used for prescans, which is high enough to capture much of the single ion pulse height distribution and low enough to not saturate for a single intense precursor at a target of 3e4 charges. The data from the ion trap prescan is combined with the data from the previous Orbitrap full scan to create a list of dependent precursors with their associated injection times, and to implement a fine-grained control of the next Orbitrap full scan injection time.
FIGURE 1. Schematic of a data dependent experiment. The Orbitrap and ion trap full scan information can be combined for better ion population control of both the full and dependent scans. Note that the IT prescan is closer in time to the dependent scans by as much as several seconds.
Characterization of Adjacent Ion Interactions
The interaction of ions with similar oscillation frequencies has been studied in a variety of related instruments, including ion cyclotron resonance, multi-reflectron devices (TOF and other), and Orbitrap mass analyzers.1 Under appropriate trapping conditions, the interaction of two adjacent ions results in a shift of both of their oscillation frequencies towards the others, as illustrated in Figure 4.
LC/MS Results Continued
Results from the control LC/MS experiment were compared to two different frequency shift thresholds. The significant differences are observed when a single precursor constitutes a significant fraction of the total TIC (Figure 8a). The correction reduced the mass shifts at the top of the LC peaks from a median of 2.74 ppm in the control experiment, to 1.75 and 1.69 ppm for thresholds of 0.20 and 0.15, respectively.
All trademarks are the property of Thermo Fisher Scientific and its subsidiaries.
This information is not intended to encourage use of these products in any manners that might infringe the intellectual property rights of others.
PO64117-EN 0614S
FIGURE 5. Slope of monoisotope oscillation frequency shift versus spacing between adjacent isotopes. The data are fit to Equation 2. Various experimental parameters can influence the magnitude of frequency shift.
FIGURE 7. a) Contour plot of frequency shifts versus the ratio of precursor area divided by total ion current (TIC) for HeLa digest. The data were taken from the apex of the precursor LC peaks. b) Histogram of estimates, showing the fraction of all precursors that exceeded two specimen thresholds of -0.15 and -0.20.
FIGURE 6. Comparison of observed and estimated frequency shifts (Equation 2) while theS-Lens voltage is varied, for a clamped injection time. a) Angiotensin 2H, m/z 648, b) MRFA 2H, m/z 262
Adjacent ion interactions are characterized by analyzing two closely spaced species at increasing abundances. When one species is kept at a constant abundance and the other species’ abundance is varied, the shift in oscillation frequency is linear (Figure 4). These slopes are measured for a series of different adjacent ions pairs in LTQ Calmix (Figure 5) and multiplied by the mass-to-charge to account for the conversion between frequency shift (proportional to acceleration) to force.
Prediction of Analyte Frequency Shift
Using empirically determined coefficients for Equation 2, the adjacent ion intensities and frequency spacings can be used to estimate mono-isotope frequency shifts, which are compared to the observed frequency shifts. An LC peak was simulated by varying the amplitude of the stacked ring ion guide (S-Lens), while the injection time was not allowed to be less than 50 ms, to promote overfilling.
d
t
fcba
fffft
tdttftfF
1
...sin
coscos1
21
21
1
0
221
221
21
rqqk
F e
2 and 1ion between distance :
iion of charge :
constant charge :
force :
21rqkF
i
e
Equation 1
spacingfrequency :
parameters fitting : ,,,
iion offrequency :
time:
fdcba
ft
i
Equation 2
1000000 1E7 1E8
1
2
3
4
5
6
MS/
MS
Area
/ Ta
rget
1
2
3
5
9
15
27
46
80
Scans
Improved pAGC
1000000 1E7 1E8
1
2
3
4
5
6 Normal pAGC
Full Scan Area
MS/
MS
Area
/ Ta
rget
0 1 2 3 4 5 6 70.00
0.01
0.02
0.03
0.04
Prob
abilit
y D
ensi
ty
MS/MS Area / Target
Traditional 0% CE Traditional 35% CE Improved, 0% CE Improved, 35% CE
Improved PAGC Accuracy
Regulation of dependent scans in data-dependent acquisition (DDA) experiments is typically done by measuring the flux of precursors in an Orbitrap master scan. This can result in underestimation of the ion flux, with subsequent overfilling of the dependent scans. An improved procedure uses intensities from the master’s prescan, which is acquired in the ion trap.
Nano-LC/MS DDA experiments were performed with the traditional and improved methods, with collision energy of 0% and 35%, where dependent analysis was performed in the ion trap. The most probable number of ions for the traditional method is 3x the target, and 1x the target for the improved method (Figure 2). The difference between 0% and 35% experiments demonstrates that the efficiency of resonance collision induced dissociation is about 60-70%. Only scans that did not reach the maximum injection time were included (300 ms). An increase of the experimental duty cycle was realized, with improved method resulted in 33697 scans versus 28265 scans for the traditional method, or a 20% gain. FIGURE 2. Accuracy of dependent MS/MS scans with traditional and improved PAGC methods.
FIGURE 3. Accuracy of dependent MS/MS scans versus their master scan precursor flux . The shift towards lower intensity precursors for the improved method results from the increased duty cycle and increased probability of not reaching the maximum injection time.
The amount of frequency shift of adjacent ions with frequencies f1 and f2 depends on their frequency spacing δf, which determines the time averaged distance and thus force applied between them, through Coulomb’s law (Equation 1).
Application to LC/MS Experiment
The Orbitrap full scan target was adjusted based on the estimated frequency shifts for the most intense precursors in the previous full scan, using the intensity information from the ion trap prescan, as described in Equations 3 and 4. The nominal full scan target was 5e5, and the resolving power was set to 30k for this demonstration, because the lower resolving powers showed larger frequency shifts than higher resolving powers.
FIGURE 4. Shift of MRFA isotopes at constant 3e4 ions as adjacent isotope abundance is varied
0 20000 40000 60000 80000 100000-1.5
-1.0
-0.5
0.0
0.5
1.0
1.10 ppm/ion
C13 C12
Freq
uenc
y Sh
ift (p
pm)
Adjacent Ions
-1.62e-5 ppm/ion
hela_140_1_2 #17512 RT: 47.65 AV: 1 NL: 2.45E7T: FTMS + p NSI Full ms [400.00-2000.00]
400 450 500 550 600 650 700 750 800 850m/z
0
5
10
15
20
25
30
35
40
45
50
55
60
65
70
75
80
85
90
95
100
Rel
ativ
e Ab
unda
nce
654.31
654.98
583.73 655.31473.31
557.61 620.38557.94 644.84584.23446.21 790.43668.81512.77446.54 488.27558.28 669.31469.75 733.46 760.88517.28493.31 621.38416.25 717.84 849.40791.43
537.30
584.74
440.22
446.88 669.82 835.91710.83 856.34761.89416.75 468.26
611.64
809.44 877.40
hela_140_1_2 #17512 RT: 47.65 AV: 1 NL: 2.45E7T: FTMS + p NSI Full ms [400.00-2000.00]
400 450 500 550 600 650 700 750 800 850m/z
0
5
10
15
20
25
30
35
40
45
50
55
60
65
70
75
80
85
90
95
100
Rel
ativ
e A
bund
ance
654.31
654.98
583.73 655.31473.31
557.61 620.38557.94 644.84584.23446.21 790.43668.81512.77446.54 488.27558.28 669.31469.75 733.46 760.88517.28493.31 621.38416.25 717.84 849.40791.43
537.30
584.74
440.22
446.88 669.82 835.91710.83 856.34761.89416.75 468.26
611.64
809.44 877.40
OT Full Scan
MS/MS 1
IT Prescan
IT Prescan OT Full Scan
MS/MS 2
Time
0.000 0.005 0.010 0.015 0.020 0.025 0.030 0.035 0.040-0.8
-0.7
-0.6
-0.5
-0.4
-0.3
-0.2
-0.1
a)
TIC Fraction
Estim
ate
(ppm
)
1
2
3
6
11
20
37
68
125
Counts
-0.8 -0.7 -0.6 -0.5 -0.4 -0.3 -0.2 -0.1 0.00.00
0.01
0.02
0.03
0.04
0.05
0.06
0.07
b)
Threshold -0.15 : 30%
Prob
abilit
y D
ensi
ty
Estimated Shift (ppm)
Probability Density
Threshold -0.20 : 20%
0.0
0.1
0.2
0.3
0.4
0.5
0.6
0.7
0.8
0.9
1.0
Cumulative Probability
Cum
ulat
ive
Prob
abilit
y
0 1 2 3 4 5 6 7 8 9 1002468
101214161820222426 b)
Cou
nts
Mass Shift (ppm)
Control Correction (0.20) Correction (0.15)
1E-4 1E-3 0.01 0.10
2
4
6
8
10
12
14
16
18
20
a) Control Correction (0.20) Correction (0.15)
Max
imum
M
ass
(ppm
)
Precursor TICFraction
iAif
Sf
AfSf
i
i
iii
ion adjacent of area :
ion adjacent and analytefor spacingfrequency :
2)(Eqn slopeshift frequency :
estimateshift frequency : ˆ
ˆ
Equation 3 Equation 4
targetnominal :
targetnew :
ˆ
then ˆ
0
0
TT
fthreshTT
threshf if
New
New
FIGURE 8. a) Maximum mass shift over each precursor LC peak versus the precursor TIC fraction for HeLa digest. b) Histograms of the mass shifts for data points in the blue ellipse.
Specimen chromatographs from the BSA digest sample demonstrate how the reduced target at the top of the LC peak decreased the injection time (Figure 9ab), with a commensurate decrease in mass shift from ~4 ppm to ~0.5 ppm (Figure 9b).
FIGURE 9. Example data from 2+ precursor m/z 547.30 of BSA digest. a) full scan injection time versus LC elution time. b) Precursor intensity. c) Change in mass.
17.5 17.6 17.7 17.8 17.8 17.9 18.0 18.1 18.2 18.3 18.30
1x10⁶
2x10⁶
3x10⁶
4x10⁶
5x10⁶
6x10⁶
7x10⁶
b) Control Correction
Inte
nsity
Time (min)
17.5 17.6 17.7 17.8 17.8 17.9 18.0 18.1 18.2 18.3 18.30
10203040506070
a) Control Correction
Inje
ctio
nTim
e (m
s)
Time (min)
17.5 17.7 17.8 18.0 18.2-1
0
1
2
3
4
5
6
7
8
9 c)
Mas
s (p
pm)
Time (min)
Control Correction
5Thermo Scientific Poster Note • PN-64117-ASMS-EN-0614S
0 5 10 15 20 25 30 35 40 45 50 55 60-1.12
-0.84
-0.56
-0.28
-1.14
-0.76
-0.38
0.00
Freq
uenc
y Sh
ift (p
pm)
Time (s)
MRFA2+
b)Angiotensin2+
Observed Estimated
a)
0 1 2 3 4 5
-0.12
-0.10
-0.08
-0.06
-0.04
-0.02
0.00
Slop
e (p
pm /
ion
* mas
s)
Adjacent Isotope Spacing (kHz)
Deflector Measure (V) 400 V 453 V 500 V 550 V 600 V 650 V
Improved Control of Ion Populations for Orbitrap Mass Analysis Philip Remeš, Jesse Canterbury, Mike Senko, Romain Huguet, Vlad Zabrouskov, Nina Soltero, Shannon Eliuk Thermo Fisher Scientific, San Jose, CA
Conclusion The ion trap prescan for the Orbitrap full scan is an untapped source of intensity
information that can be used in several ways.
The accuracy of Predictive Automatic Gain Control for dependent scans is improved, from a median of 3x overfilling in the control case, to an ideal 1x of the requested target in the improved case.
Adjacent ion coupling in the Orbitrap can be characterized, and corrected for, such that we observe reduced mass shifts of intense precursor ions at the top of their elution profiles.
References 1. Grinfeld, D; Makarov, A.; Denisov, E. “Crowd Control” of Ions in Orbitrap Mass
Spectrometry. ASMS 2012.
Overview Purpose: Provide fine grained control of automatic gain control procedures, for increased mass accuracy and duty cycle
Methods: Electron multiplier measurement of ion flux coupled with study of ion coalescence effects allows to reduce over filling in both master scans and dependent scans
Results: Accuracy of dependent scan populations is improved by 3x, while adjacent ion coupling shifts in full scans are decreased by ~1.6x.
Introduction Trapping instruments such as a Thermo Scientific™ Orbitrap™ detector based mass spectrometer achieve highest performance when the number of ions analyzed is within certain limits, which depend on the parameters of the physical device and the detection system. Overfilling of the analyzer with a single analyte is particularly unfavorable, as it leads to a deviation of the observed mass-to-charge from the theoretical value, which is not accounted for by a global space-charge calibration. Using knowledge of how a given analyte ion is affected by adjacent ions, situations that will lead to erroneous mass measurements can be recognized, and the target for the Orbitrap master scan can be reduced to an acceptable level in those scans. On a hybrid instrument such as the Thermo Scientific™ Orbitrap Fusion™ Tribrid™ mass spectrometer, measurements can be made with the ion trap prescan spectrum, which can also be interrogated for predictive automatic gain control (PAGC) of the dependent scans. This eliminates underestimation of low level signals that occurs in Orbitrap master scans, resulting in accurate estimation of injection times and improved duty cycles.
Methods Mass Spectrometry
All experimental data were generated using an Orbitrap Fusion Tribrid Mass Spectrometer. Thermo Scientific™ Pierce™ LTQ ESI Positive Ion Calibration Solution was used for calibration of adjacent ion interactions. Nano-LC/MS experiments were performed by injecting 1 µg of tryptic HeLa digest or 100 fmol BSA digest onto a Thermo Scientific™ Acclaim™ PepMap™ C18 column (75µm x 25 cm), with 140 min gradient separation, performed using a Thermo Scientific™ EASY-nLC 1000 ultra-high pressure LC.
Sensitivity of Electron Multiplier Detection
Quadrupole ion traps typically use an electron multiplier detection scheme that is capable of detecting single ion events. A gain setting of 1e5 is used for prescans, which is high enough to capture much of the single ion pulse height distribution and low enough to not saturate for a single intense precursor at a target of 3e4 charges. The data from the ion trap prescan is combined with the data from the previous Orbitrap full scan to create a list of dependent precursors with their associated injection times, and to implement a fine-grained control of the next Orbitrap full scan injection time.
FIGURE 1. Schematic of a data dependent experiment. The Orbitrap and ion trap full scan information can be combined for better ion population control of both the full and dependent scans. Note that the IT prescan is closer in time to the dependent scans by as much as several seconds.
Characterization of Adjacent Ion Interactions
The interaction of ions with similar oscillation frequencies has been studied in a variety of related instruments, including ion cyclotron resonance, multi-reflectron devices (TOF and other), and Orbitrap mass analyzers.1 Under appropriate trapping conditions, the interaction of two adjacent ions results in a shift of both of their oscillation frequencies towards the others, as illustrated in Figure 4.
LC/MS Results Continued
Results from the control LC/MS experiment were compared to two different frequency shift thresholds. The significant differences are observed when a single precursor constitutes a significant fraction of the total TIC (Figure 8a). The correction reduced the mass shifts at the top of the LC peaks from a median of 2.74 ppm in the control experiment, to 1.75 and 1.69 ppm for thresholds of 0.20 and 0.15, respectively.
All trademarks are the property of Thermo Fisher Scientific and its subsidiaries.
This information is not intended to encourage use of these products in any manners that might infringe the intellectual property rights of others.
PO64117-EN 0614S
FIGURE 5. Slope of monoisotope oscillation frequency shift versus spacing between adjacent isotopes. The data are fit to Equation 2. Various experimental parameters can influence the magnitude of frequency shift.
FIGURE 7. a) Contour plot of frequency shifts versus the ratio of precursor area divided by total ion current (TIC) for HeLa digest. The data were taken from the apex of the precursor LC peaks. b) Histogram of estimates, showing the fraction of all precursors that exceeded two specimen thresholds of -0.15 and -0.20.
FIGURE 6. Comparison of observed and estimated frequency shifts (Equation 2) while theS-Lens voltage is varied, for a clamped injection time. a) Angiotensin 2H, m/z 648, b) MRFA 2H, m/z 262
Adjacent ion interactions are characterized by analyzing two closely spaced species at increasing abundances. When one species is kept at a constant abundance and the other species’ abundance is varied, the shift in oscillation frequency is linear (Figure 4). These slopes are measured for a series of different adjacent ions pairs in LTQ Calmix (Figure 5) and multiplied by the mass-to-charge to account for the conversion between frequency shift (proportional to acceleration) to force.
Prediction of Analyte Frequency Shift
Using empirically determined coefficients for Equation 2, the adjacent ion intensities and frequency spacings can be used to estimate mono-isotope frequency shifts, which are compared to the observed frequency shifts. An LC peak was simulated by varying the amplitude of the stacked ring ion guide (S-Lens), while the injection time was not allowed to be less than 50 ms, to promote overfilling.
d
t
fcba
fffft
tdttftfF
1
...sin
coscos1
21
21
1
0
221
221
21
rqqk
F e
2 and 1ion between distance :
iion of charge :
constant charge :
force :
21rqkF
i
e
Equation 1
spacingfrequency :
parameters fitting : ,,,
iion offrequency :
time:
fdcba
ft
i
Equation 2
1000000 1E7 1E8
1
2
3
4
5
6
MS/
MS
Area
/ Ta
rget
1
2
3
5
9
15
27
46
80
Scans
Improved pAGC
1000000 1E7 1E8
1
2
3
4
5
6 Normal pAGC
Full Scan Area
MS/
MS
Area
/ Ta
rget
0 1 2 3 4 5 6 70.00
0.01
0.02
0.03
0.04
Prob
abilit
y D
ensi
ty
MS/MS Area / Target
Traditional 0% CE Traditional 35% CE Improved, 0% CE Improved, 35% CE
Improved PAGC Accuracy
Regulation of dependent scans in data-dependent acquisition (DDA) experiments is typically done by measuring the flux of precursors in an Orbitrap master scan. This can result in underestimation of the ion flux, with subsequent overfilling of the dependent scans. An improved procedure uses intensities from the master’s prescan, which is acquired in the ion trap.
Nano-LC/MS DDA experiments were performed with the traditional and improved methods, with collision energy of 0% and 35%, where dependent analysis was performed in the ion trap. The most probable number of ions for the traditional method is 3x the target, and 1x the target for the improved method (Figure 2). The difference between 0% and 35% experiments demonstrates that the efficiency of resonance collision induced dissociation is about 60-70%. Only scans that did not reach the maximum injection time were included (300 ms). An increase of the experimental duty cycle was realized, with improved method resulted in 33697 scans versus 28265 scans for the traditional method, or a 20% gain. FIGURE 2. Accuracy of dependent MS/MS scans with traditional and improved PAGC methods.
FIGURE 3. Accuracy of dependent MS/MS scans versus their master scan precursor flux . The shift towards lower intensity precursors for the improved method results from the increased duty cycle and increased probability of not reaching the maximum injection time.
The amount of frequency shift of adjacent ions with frequencies f1 and f2 depends on their frequency spacing δf, which determines the time averaged distance and thus force applied between them, through Coulomb’s law (Equation 1).
Application to LC/MS Experiment
The Orbitrap full scan target was adjusted based on the estimated frequency shifts for the most intense precursors in the previous full scan, using the intensity information from the ion trap prescan, as described in Equations 3 and 4. The nominal full scan target was 5e5, and the resolving power was set to 30k for this demonstration, because the lower resolving powers showed larger frequency shifts than higher resolving powers.
FIGURE 4. Shift of MRFA isotopes at constant 3e4 ions as adjacent isotope abundance is varied
0 20000 40000 60000 80000 100000-1.5
-1.0
-0.5
0.0
0.5
1.0
1.10 ppm/ion
C13 C12
Freq
uenc
y Sh
ift (p
pm)
Adjacent Ions
-1.62e-5 ppm/ion
hela_140_1_2 #17512 RT: 47.65 AV: 1 NL: 2.45E7T: FTMS + p NSI Full ms [400.00-2000.00]
400 450 500 550 600 650 700 750 800 850m/z
0
5
10
15
20
25
30
35
40
45
50
55
60
65
70
75
80
85
90
95
100
Rel
ativ
e Ab
unda
nce
654.31
654.98
583.73 655.31473.31
557.61 620.38557.94 644.84584.23446.21 790.43668.81512.77446.54 488.27558.28 669.31469.75 733.46 760.88517.28493.31 621.38416.25 717.84 849.40791.43
537.30
584.74
440.22
446.88 669.82 835.91710.83 856.34761.89416.75 468.26
611.64
809.44 877.40
hela_140_1_2 #17512 RT: 47.65 AV: 1 NL: 2.45E7T: FTMS + p NSI Full ms [400.00-2000.00]
400 450 500 550 600 650 700 750 800 850m/z
0
5
10
15
20
25
30
35
40
45
50
55
60
65
70
75
80
85
90
95
100
Rel
ativ
e A
bund
ance
654.31
654.98
583.73 655.31473.31
557.61 620.38557.94 644.84584.23446.21 790.43668.81512.77446.54 488.27558.28 669.31469.75 733.46 760.88517.28493.31 621.38416.25 717.84 849.40791.43
537.30
584.74
440.22
446.88 669.82 835.91710.83 856.34761.89416.75 468.26
611.64
809.44 877.40
OT Full Scan
MS/MS 1
IT Prescan
IT Prescan OT Full Scan
MS/MS 2
Time
0.000 0.005 0.010 0.015 0.020 0.025 0.030 0.035 0.040-0.8
-0.7
-0.6
-0.5
-0.4
-0.3
-0.2
-0.1
a)
TIC Fraction
Estim
ate
(ppm
)
1
2
3
6
11
20
37
68
125
Counts
-0.8 -0.7 -0.6 -0.5 -0.4 -0.3 -0.2 -0.1 0.00.00
0.01
0.02
0.03
0.04
0.05
0.06
0.07
b)
Threshold -0.15 : 30%
Prob
abilit
y D
ensi
ty
Estimated Shift (ppm)
Probability Density
Threshold -0.20 : 20%
0.0
0.1
0.2
0.3
0.4
0.5
0.6
0.7
0.8
0.9
1.0
Cumulative Probability
Cum
ulat
ive
Prob
abilit
y
0 1 2 3 4 5 6 7 8 9 1002468
101214161820222426 b)
Cou
nts
Mass Shift (ppm)
Control Correction (0.20) Correction (0.15)
1E-4 1E-3 0.01 0.10
2
4
6
8
10
12
14
16
18
20
a) Control Correction (0.20) Correction (0.15)
Max
imum
M
ass
(ppm
)
Precursor TICFraction
iAif
Sf
AfSf
i
i
iii
ion adjacent of area :
ion adjacent and analytefor spacingfrequency :
2)(Eqn slopeshift frequency :
estimateshift frequency : ˆ
ˆ
Equation 3 Equation 4
targetnominal :
targetnew :
ˆ
then ˆ
0
0
TT
fthreshTT
threshf if
New
New
FIGURE 8. a) Maximum mass shift over each precursor LC peak versus the precursor TIC fraction for HeLa digest. b) Histograms of the mass shifts for data points in the blue ellipse.
Specimen chromatographs from the BSA digest sample demonstrate how the reduced target at the top of the LC peak decreased the injection time (Figure 9ab), with a commensurate decrease in mass shift from ~4 ppm to ~0.5 ppm (Figure 9b).
FIGURE 9. Example data from 2+ precursor m/z 547.30 of BSA digest. a) full scan injection time versus LC elution time. b) Precursor intensity. c) Change in mass.
17.5 17.6 17.7 17.8 17.8 17.9 18.0 18.1 18.2 18.3 18.30
1x10⁶
2x10⁶
3x10⁶
4x10⁶
5x10⁶
6x10⁶
7x10⁶
b) Control Correction
Inte
nsity
Time (min)
17.5 17.6 17.7 17.8 17.8 17.9 18.0 18.1 18.2 18.3 18.30
10203040506070
a) Control Correction
Inje
ctio
nTim
e (m
s)
Time (min)
17.5 17.7 17.8 18.0 18.2-1
0
1
2
3
4
5
6
7
8
9 c)
Mas
s (p
pm)
Time (min)
Control Correction
6 Improved Control of Ion Populations for Orbitrap Mass Analysis
0 5 10 15 20 25 30 35 40 45 50 55 60-1.12
-0.84
-0.56
-0.28
-1.14
-0.76
-0.38
0.00
Freq
uenc
y Sh
ift (p
pm)
Time (s)
MRFA2+
b)Angiotensin2+
Observed Estimated
a)
0 1 2 3 4 5
-0.12
-0.10
-0.08
-0.06
-0.04
-0.02
0.00
Slop
e (p
pm /
ion
* mas
s)
Adjacent Isotope Spacing (kHz)
Deflector Measure (V) 400 V 453 V 500 V 550 V 600 V 650 V
Improved Control of Ion Populations for Orbitrap Mass Analysis Philip Remeš, Jesse Canterbury, Mike Senko, Romain Huguet, Vlad Zabrouskov, Nina Soltero, Shannon Eliuk Thermo Fisher Scientific, San Jose, CA
Conclusion The ion trap prescan for the Orbitrap full scan is an untapped source of intensity
information that can be used in several ways.
The accuracy of Predictive Automatic Gain Control for dependent scans is improved, from a median of 3x overfilling in the control case, to an ideal 1x of the requested target in the improved case.
Adjacent ion coupling in the Orbitrap can be characterized, and corrected for, such that we observe reduced mass shifts of intense precursor ions at the top of their elution profiles.
References 1. Grinfeld, D; Makarov, A.; Denisov, E. “Crowd Control” of Ions in Orbitrap Mass
Spectrometry. ASMS 2012.
Overview Purpose: Provide fine grained control of automatic gain control procedures, for increased mass accuracy and duty cycle
Methods: Electron multiplier measurement of ion flux coupled with study of ion coalescence effects allows to reduce over filling in both master scans and dependent scans
Results: Accuracy of dependent scan populations is improved by 3x, while adjacent ion coupling shifts in full scans are decreased by ~1.6x.
Introduction Trapping instruments such as a Thermo Scientific™ Orbitrap™ detector based mass spectrometer achieve highest performance when the number of ions analyzed is within certain limits, which depend on the parameters of the physical device and the detection system. Overfilling of the analyzer with a single analyte is particularly unfavorable, as it leads to a deviation of the observed mass-to-charge from the theoretical value, which is not accounted for by a global space-charge calibration. Using knowledge of how a given analyte ion is affected by adjacent ions, situations that will lead to erroneous mass measurements can be recognized, and the target for the Orbitrap master scan can be reduced to an acceptable level in those scans. On a hybrid instrument such as the Thermo Scientific™ Orbitrap Fusion™ Tribrid™ mass spectrometer, measurements can be made with the ion trap prescan spectrum, which can also be interrogated for predictive automatic gain control (PAGC) of the dependent scans. This eliminates underestimation of low level signals that occurs in Orbitrap master scans, resulting in accurate estimation of injection times and improved duty cycles.
Methods Mass Spectrometry
All experimental data were generated using an Orbitrap Fusion Tribrid Mass Spectrometer. Thermo Scientific™ Pierce™ LTQ ESI Positive Ion Calibration Solution was used for calibration of adjacent ion interactions. Nano-LC/MS experiments were performed by injecting 1 µg of tryptic HeLa digest or 100 fmol BSA digest onto a Thermo Scientific™ Acclaim™ PepMap™ C18 column (75µm x 25 cm), with 140 min gradient separation, performed using a Thermo Scientific™ EASY-nLC 1000 ultra-high pressure LC.
Sensitivity of Electron Multiplier Detection
Quadrupole ion traps typically use an electron multiplier detection scheme that is capable of detecting single ion events. A gain setting of 1e5 is used for prescans, which is high enough to capture much of the single ion pulse height distribution and low enough to not saturate for a single intense precursor at a target of 3e4 charges. The data from the ion trap prescan is combined with the data from the previous Orbitrap full scan to create a list of dependent precursors with their associated injection times, and to implement a fine-grained control of the next Orbitrap full scan injection time.
FIGURE 1. Schematic of a data dependent experiment. The Orbitrap and ion trap full scan information can be combined for better ion population control of both the full and dependent scans. Note that the IT prescan is closer in time to the dependent scans by as much as several seconds.
Characterization of Adjacent Ion Interactions
The interaction of ions with similar oscillation frequencies has been studied in a variety of related instruments, including ion cyclotron resonance, multi-reflectron devices (TOF and other), and Orbitrap mass analyzers.1 Under appropriate trapping conditions, the interaction of two adjacent ions results in a shift of both of their oscillation frequencies towards the others, as illustrated in Figure 4.
LC/MS Results Continued
Results from the control LC/MS experiment were compared to two different frequency shift thresholds. The significant differences are observed when a single precursor constitutes a significant fraction of the total TIC (Figure 8a). The correction reduced the mass shifts at the top of the LC peaks from a median of 2.74 ppm in the control experiment, to 1.75 and 1.69 ppm for thresholds of 0.20 and 0.15, respectively.
All trademarks are the property of Thermo Fisher Scientific and its subsidiaries.
This information is not intended to encourage use of these products in any manners that might infringe the intellectual property rights of others.
PO64117-EN 0614S
FIGURE 5. Slope of monoisotope oscillation frequency shift versus spacing between adjacent isotopes. The data are fit to Equation 2. Various experimental parameters can influence the magnitude of frequency shift.
FIGURE 7. a) Contour plot of frequency shifts versus the ratio of precursor area divided by total ion current (TIC) for HeLa digest. The data were taken from the apex of the precursor LC peaks. b) Histogram of estimates, showing the fraction of all precursors that exceeded two specimen thresholds of -0.15 and -0.20.
FIGURE 6. Comparison of observed and estimated frequency shifts (Equation 2) while theS-Lens voltage is varied, for a clamped injection time. a) Angiotensin 2H, m/z 648, b) MRFA 2H, m/z 262
Adjacent ion interactions are characterized by analyzing two closely spaced species at increasing abundances. When one species is kept at a constant abundance and the other species’ abundance is varied, the shift in oscillation frequency is linear (Figure 4). These slopes are measured for a series of different adjacent ions pairs in LTQ Calmix (Figure 5) and multiplied by the mass-to-charge to account for the conversion between frequency shift (proportional to acceleration) to force.
Prediction of Analyte Frequency Shift
Using empirically determined coefficients for Equation 2, the adjacent ion intensities and frequency spacings can be used to estimate mono-isotope frequency shifts, which are compared to the observed frequency shifts. An LC peak was simulated by varying the amplitude of the stacked ring ion guide (S-Lens), while the injection time was not allowed to be less than 50 ms, to promote overfilling.
d
t
fcba
fffft
tdttftfF
1
...sin
coscos1
21
21
1
0
221
221
21
rqqk
F e
2 and 1ion between distance :
iion of charge :
constant charge :
force :
21rqkF
i
e
Equation 1
spacingfrequency :
parameters fitting : ,,,
iion offrequency :
time:
fdcba
ft
i
Equation 2
1000000 1E7 1E8
1
2
3
4
5
6
MS/
MS
Area
/ Ta
rget
1
2
3
5
9
15
27
46
80
Scans
Improved pAGC
1000000 1E7 1E8
1
2
3
4
5
6 Normal pAGC
Full Scan Area
MS/
MS
Area
/ Ta
rget
0 1 2 3 4 5 6 70.00
0.01
0.02
0.03
0.04
Prob
abilit
y D
ensi
ty
MS/MS Area / Target
Traditional 0% CE Traditional 35% CE Improved, 0% CE Improved, 35% CE
Improved PAGC Accuracy
Regulation of dependent scans in data-dependent acquisition (DDA) experiments is typically done by measuring the flux of precursors in an Orbitrap master scan. This can result in underestimation of the ion flux, with subsequent overfilling of the dependent scans. An improved procedure uses intensities from the master’s prescan, which is acquired in the ion trap.
Nano-LC/MS DDA experiments were performed with the traditional and improved methods, with collision energy of 0% and 35%, where dependent analysis was performed in the ion trap. The most probable number of ions for the traditional method is 3x the target, and 1x the target for the improved method (Figure 2). The difference between 0% and 35% experiments demonstrates that the efficiency of resonance collision induced dissociation is about 60-70%. Only scans that did not reach the maximum injection time were included (300 ms). An increase of the experimental duty cycle was realized, with improved method resulted in 33697 scans versus 28265 scans for the traditional method, or a 20% gain. FIGURE 2. Accuracy of dependent MS/MS scans with traditional and improved PAGC methods.
FIGURE 3. Accuracy of dependent MS/MS scans versus their master scan precursor flux . The shift towards lower intensity precursors for the improved method results from the increased duty cycle and increased probability of not reaching the maximum injection time.
The amount of frequency shift of adjacent ions with frequencies f1 and f2 depends on their frequency spacing δf, which determines the time averaged distance and thus force applied between them, through Coulomb’s law (Equation 1).
Application to LC/MS Experiment
The Orbitrap full scan target was adjusted based on the estimated frequency shifts for the most intense precursors in the previous full scan, using the intensity information from the ion trap prescan, as described in Equations 3 and 4. The nominal full scan target was 5e5, and the resolving power was set to 30k for this demonstration, because the lower resolving powers showed larger frequency shifts than higher resolving powers.
FIGURE 4. Shift of MRFA isotopes at constant 3e4 ions as adjacent isotope abundance is varied
0 20000 40000 60000 80000 100000-1.5
-1.0
-0.5
0.0
0.5
1.0
1.10 ppm/ion
C13 C12
Freq
uenc
y Sh
ift (p
pm)
Adjacent Ions
-1.62e-5 ppm/ion
hela_140_1_2 #17512 RT: 47.65 AV: 1 NL: 2.45E7T: FTMS + p NSI Full ms [400.00-2000.00]
400 450 500 550 600 650 700 750 800 850m/z
0
5
10
15
20
25
30
35
40
45
50
55
60
65
70
75
80
85
90
95
100
Rel
ativ
e Ab
unda
nce
654.31
654.98
583.73 655.31473.31
557.61 620.38557.94 644.84584.23446.21 790.43668.81512.77446.54 488.27558.28 669.31469.75 733.46 760.88517.28493.31 621.38416.25 717.84 849.40791.43
537.30
584.74
440.22
446.88 669.82 835.91710.83 856.34761.89416.75 468.26
611.64
809.44 877.40
hela_140_1_2 #17512 RT: 47.65 AV: 1 NL: 2.45E7T: FTMS + p NSI Full ms [400.00-2000.00]
400 450 500 550 600 650 700 750 800 850m/z
0
5
10
15
20
25
30
35
40
45
50
55
60
65
70
75
80
85
90
95
100
Rel
ativ
e A
bund
ance
654.31
654.98
583.73 655.31473.31
557.61 620.38557.94 644.84584.23446.21 790.43668.81512.77446.54 488.27558.28 669.31469.75 733.46 760.88517.28493.31 621.38416.25 717.84 849.40791.43
537.30
584.74
440.22
446.88 669.82 835.91710.83 856.34761.89416.75 468.26
611.64
809.44 877.40
OT Full Scan
MS/MS 1
IT Prescan
IT Prescan OT Full Scan
MS/MS 2
Time
0.000 0.005 0.010 0.015 0.020 0.025 0.030 0.035 0.040-0.8
-0.7
-0.6
-0.5
-0.4
-0.3
-0.2
-0.1
a)
TIC Fraction
Estim
ate
(ppm
)
1
2
3
6
11
20
37
68
125
Counts
-0.8 -0.7 -0.6 -0.5 -0.4 -0.3 -0.2 -0.1 0.00.00
0.01
0.02
0.03
0.04
0.05
0.06
0.07
b)
Threshold -0.15 : 30%
Prob
abilit
y D
ensi
ty
Estimated Shift (ppm)
Probability Density
Threshold -0.20 : 20%
0.0
0.1
0.2
0.3
0.4
0.5
0.6
0.7
0.8
0.9
1.0
Cumulative Probability
Cum
ulat
ive
Prob
abilit
y
0 1 2 3 4 5 6 7 8 9 1002468
101214161820222426 b)
Cou
nts
Mass Shift (ppm)
Control Correction (0.20) Correction (0.15)
1E-4 1E-3 0.01 0.10
2
4
6
8
10
12
14
16
18
20
a) Control Correction (0.20) Correction (0.15)
Max
imum
M
ass
(ppm
)
Precursor TICFraction
iAif
Sf
AfSf
i
i
iii
ion adjacent of area :
ion adjacent and analytefor spacingfrequency :
2)(Eqn slopeshift frequency :
estimateshift frequency : ˆ
ˆ
Equation 3 Equation 4
targetnominal :
targetnew :
ˆ
then ˆ
0
0
TT
fthreshTT
threshf if
New
New
FIGURE 8. a) Maximum mass shift over each precursor LC peak versus the precursor TIC fraction for HeLa digest. b) Histograms of the mass shifts for data points in the blue ellipse.
Specimen chromatographs from the BSA digest sample demonstrate how the reduced target at the top of the LC peak decreased the injection time (Figure 9ab), with a commensurate decrease in mass shift from ~4 ppm to ~0.5 ppm (Figure 9b).
FIGURE 9. Example data from 2+ precursor m/z 547.30 of BSA digest. a) full scan injection time versus LC elution time. b) Precursor intensity. c) Change in mass.
17.5 17.6 17.7 17.8 17.8 17.9 18.0 18.1 18.2 18.3 18.30
1x10⁶
2x10⁶
3x10⁶
4x10⁶
5x10⁶
6x10⁶
7x10⁶
b) Control Correction
Inte
nsity
Time (min)
17.5 17.6 17.7 17.8 17.8 17.9 18.0 18.1 18.2 18.3 18.30
10203040506070
a) Control Correction
Inje
ctio
nTim
e (m
s)
Time (min)
17.5 17.7 17.8 18.0 18.2-1
0
1
2
3
4
5
6
7
8
9 c)
Mas
s (p
pm)
Time (min)
Control Correction

www.thermofisher.com©2016 Thermo Fisher Scientific Inc. All rights reserved. All trademarks are the property of Thermo Fisher Scientific and its subsidiaries. This information is presented as an example of the capabilities of Thermo Fisher Scientific products. It is not intended to encourage use of these products in any manners that might infringe the intellectual property rights of others. Specifications, terms and pricing are subject to change. Not all products are available in all countries. Please consult your local sales representative for details.
PN-64117-EN-0716S
Africa +43 1 333 50 34 0Australia +61 3 9757 4300Austria +43 810 282 206Belgium +32 53 73 42 41Canada +1 800 530 8447China 800 810 5118 (free call domestic)
400 650 5118
Denmark +45 70 23 62 60Europe-Other +43 1 333 50 34 0Finland +358 9 3291 0200France +33 1 60 92 48 00Germany +49 6103 408 1014India +91 22 6742 9494Italy +39 02 950 591
Japan +81 45 453 9100Latin America +1 561 688 8700Middle East +43 1 333 50 34 0Netherlands +31 76 579 55 55New Zealand +64 9 980 6700Norway +46 8 556 468 00Russia/CIS +43 1 333 50 34 0
Singapore +65 6289 1190Spain +34 914 845 965Sweden +46 8 556 468 00Switzerland +41 61 716 77 00UK +44 1442 233555USA +1 800 532 4752