Embed Size (px)
Citation preview
Chapter 4
Improved Disaster ManagementUsing Data Assimilation
Paul R. Houser
Additional information is available at the end of the chapter
http://dx.doi.org/10.5772/55840
1. Introduction
Decision makers must have timely and actionable information to guide their response toemergency situations. For environmental problems, this information is often produced usingdecision support systems (DSS), which is usually a computer-based, environmental simulationand prediction model that emphasizes access and manipulation of data and algorithms. Usinghistorical time series data, current conditions, and physically-based algorithms the DSS canpredict the potential outcomes for various decision scenarios, and may also provide thedecision maker with uncertainty and risk estimates. In this way, the DSS can improve decisionmaking efficiency and accuracy, facilitate decision maker exploration and discovery, commu‐nication and information organization, and outreach and education.
An important component of advanced decision support tools is data assimilation. Dataassimilation is the application of recursive Bayesian estimation to combine current and pastdata in an explicit dynamical model, using the model’s prognostic equations to provide timecontinuity and dynamic coupling amongst the fields. Data assimilation aims to utilize bothour knowledge of physical processes as embodied in a numerical process model, and infor‐mation that can be gained from observations, to produce an improved, continuous system stateestimate in space and time. When implemented in near-real time, data assimilation canobjectively provide decision makers with the timeliest information, as well as provide superiorinitializations for short term scenario predictions. Data assimilation can also act as a parameterestimation method to help reduce DSS bias and uncertainty.
This chapter will provide an overview of data assimilation theory and its application todecision support tools, and then provide a review of current data assimilation applications indisaster management.
© 2013 Houser; licensee InTech. This is an open access article distributed under the terms of the CreativeCommons Attribution License (http://creativecommons.org/licenses/by/3.0), which permits unrestricted use,distribution, and reproduction in any medium, provided the original work is properly cited.
2. Background
Information about environmental conditions is of critical importance to real-world applica‐tions such as agricultural production, water resource management, flood prediction, watersupply, weather and climate forecasting, and environmental preservation. Improved estimatesabout current environmental conditions useful for agriculture, ecology, civil engineering,water resources management, rainfall-runoff prediction, atmospheric process studies, climateand weather/climate prediction, and radiation management [1,2].
This information is usually provided to decision makers through Decision Support Systems(DSS). DSS’s are generally defined as interactive software-based systems that help toassemble useful information from raw data, documents, knowledge, and models to identifyand resolve problems and make decisions. A model-driven DSS emphasizes access to andoperation of a statistical, financial, optimization or physical simulation model. A data-driven DSS emphasizes access to and manipulation of a time-series of data and informa‐tion. Data-driven DSS’s combined with analytical model processing provide the highestlevel of functionality and decision support that is linked to analysis of large collections ofhistorical data.
Physically-based environmental models are often at the heart of powerful DSSs. They rely ona set of well-established physical principles to make current condition assessments and futureprojections. Physical model simulations are performed on powerful computer platforms,dividing the area of interest into elements in which fluxes and storages are calculated.Environmental parameters are provided by connected databases of observational andcalibration data.
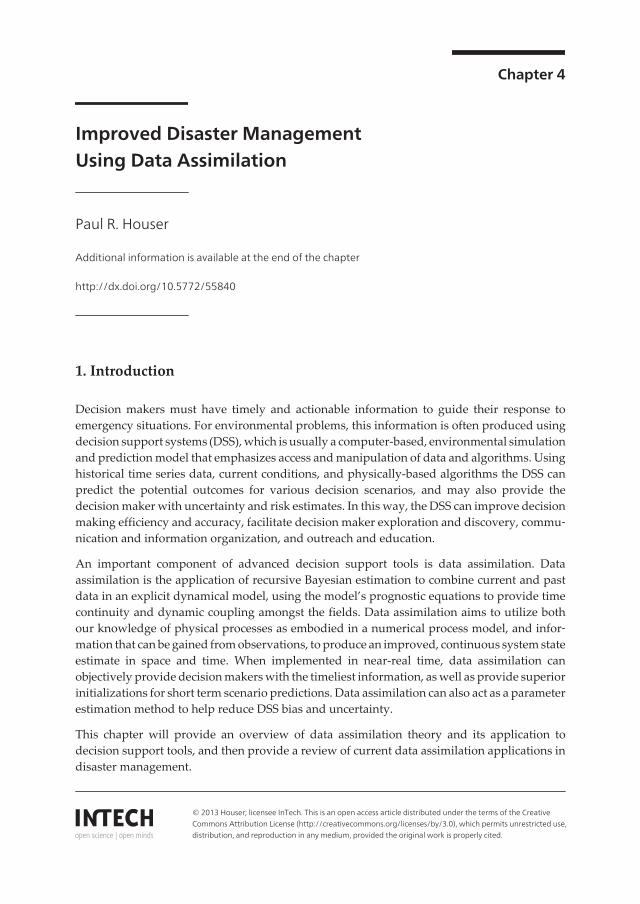
Observations are important components of DSSs, providing critical information that mitigatesthe risk of loss of life and damage to property. Environmental observations are sourced fromthe numerous disconnected observational networks and systems that have a wide variety ofcharacteristics (Figure 1). Basic monthly, seasonal and annual summaries of temperature,rainfall and other climate elements provide an essential resource for planning endeavors inareas such as agriculture, water resources, emergency management, urban design, insurance,energy supply and demand management and construction.
While ground-based observational networks are improving, the only practical way toobserve the environment on continental to global scales is via satellites. Remote sensingcan make spatially comprehensive measurements of various components of the environ‐ment, but it cannot provide information on the entire system, and the observationsrepresent only an instant in time. Environmental process models may be used to predictthe temporal and spatial state variations, but these predictions are often poor, due to modelinitialization, parameter and forcing, and physics errors. Therefore, an attractive prospectis to combine the strengths of environmental models contained within DSSs and observa‐tions and minimize the weaknesses to provide a superior environmental state estimate.This is the goal of data assimilation.
Approaches to Disaster Management - Examining the Implications of Hazards, Emergencies and Disasters84
Figure 1. Illustration of an integrated environmental observation network. The network illustrated is the National Sci‐ence Foundation (NSF) National Ecological Observatory Network (NEON).
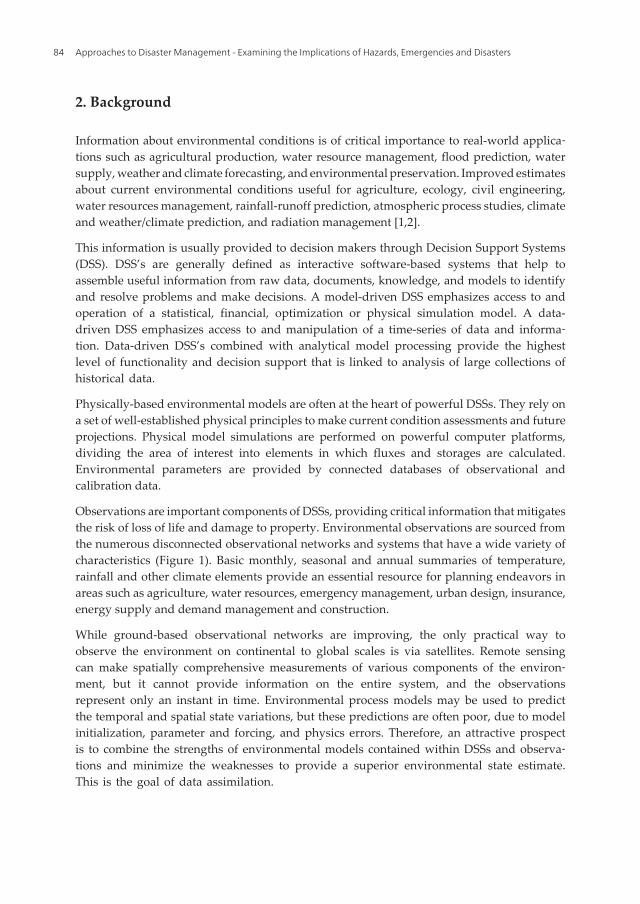
Data assimilation combines observations into a dynamical model, using the model’s equationsto provide time continuity and coupling between the estimated fields. Data assimilation aimsto utilize both our environmental process knowledge, as embodied in a numerical computermodel, and information that can be gained from observations. Both model predictions andobservations are imperfect and we wish to use both synergistically to obtain a more accurateresult. Moreover, both contain different kinds of information, that when used together, providean accuracy level that cannot be obtained individually.
Figure 2. Numerical models contain errors that increase with time due to model imperfections and uncertainties ininitial and boundary conditions. Data assimilation minimizes these errors by correcting the model stats using new ob‐servations (from http://www.hzg.de/institute/coastal_research/cosyna).
Improved Disaster Management Using Data Assimilationhttp://dx.doi.org/10.5772/55840
85
The data assimilation challenge is to merge the spatially comprehensive observations with thedynamically complete but typically poor predictions of an environmental model to yield thebest possible system state estimation (Figure 2). In this illustration, the model represents anyenvironmental model that simulates system states. Model biases can be mitigated using acomplementary calibration and parameterization process. However, model imperfections willalways remain and will be exasperated by uncertain initial and boundary (forcing) conditions.Data assimilation techniques can be used to continuously partially reinitialize the model withinformation provided by observations. This reinitialization can be constrained by the modelphysics to assure that it is physically and dynamically realistic. Limited point measurementsare often used to calibrate the model(s) and validate the assimilation results [3].
3. Data assimilation
Charney et al. (1969) first suggested combining current and past data in an explicit dynamicalmodel, using the model’s prognostic equations to provide time continuity and dynamiccoupling amongst the fields [4]. This concept has evolved into a family of techniques knownas data assimilation. In essence, data assimilation aims to utilize both our physical processknowledge as embodied in an environmental model, and information that can be gained fromobservations. Both model predictions and observations are imperfect and we wish to use bothsynergistically to obtain a more accurate result. Moreover, both contain different kinds ofinformation, that when used together, provide an accuracy level that cannot be obtained whenused separately.
Data assimilation techniques were established by meteorologists [5] and have been used verysuccessfully to improve operational weather forecasts. Data assimilation has also beensuccessfully used in oceanography[6] for improving ocean dynamics prediction. Houser et al.,(2010) gave an overview of hydrological data assimilation, discussing different data assimila‐tion methods and several case studies in hydrology [7].
Data assimilation was meant for state estimation, but in the broadest sense, data assimilationrefers to any use of observational information to improve a model [8]. Basically, there are fourmethods for “model updating”, as follows:
• Input: corrects model input forcing errors or replaces model-based forcing with observa‐tions, thereby improving the model’s predictions;
• State: corrects the state or storages of the model so that it comes closer to the observations(state estimation, data assimilation in the narrow sense);
• Parameter: corrects or replaces model parameters with observational information (parameterestimation, calibration);
• Error correction: correct the model predictions or state variables by an observed time-integrated error term in order to reduce systematic model bias (e.g. bias correction).
Approaches to Disaster Management - Examining the Implications of Hazards, Emergencies and Disasters86
State updating can be justified by lack of knowledge about the model’s initial conditions, butwith unconstrained state updating, the model logic is foregone, while this is exactly the mainstrength of dynamic assimilation and modelling. If an intensive update of the state is neededfor good results, the model may simply not be able to produce correct state or flux values. Insuch cases, assimilation for parameter estimation is better advised. The static parametersobtained through off-line calibration, prior to the actual forecast simulations, may not alwaysresult in a proper model definition, because of the state and time dependency of parametersor problems in the model structure or input. Often the model validation residuals show thepresence of bias, variation in error and a correlation structure.
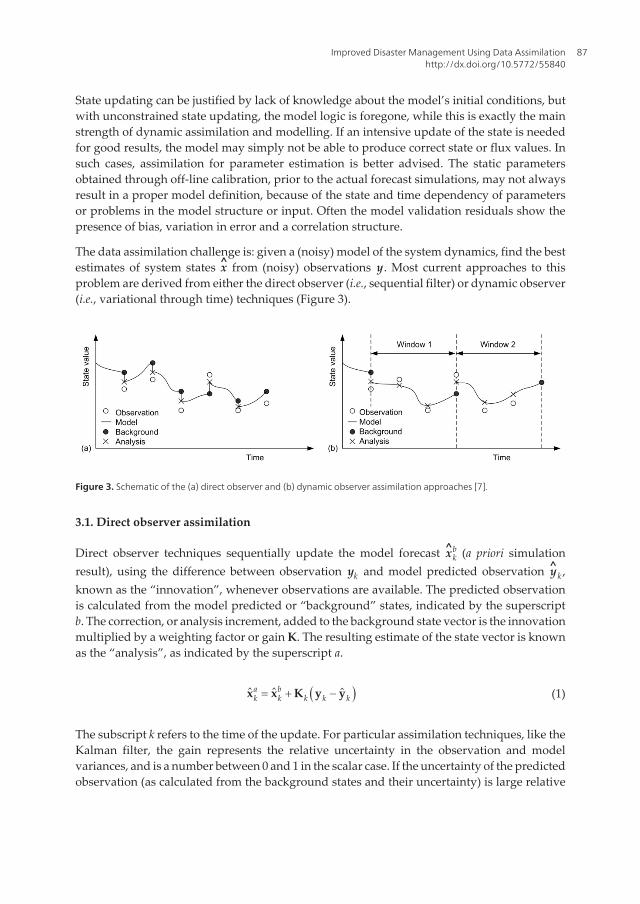
The data assimilation challenge is: given a (noisy) model of the system dynamics, find the bestestimates of system states x from (noisy) observations y. Most current approaches to thisproblem are derived from either the direct observer (i.e., sequential filter) or dynamic observer(i.e., variational through time) techniques (Figure 3).
Figure 3. Schematic of the (a) direct observer and (b) dynamic observer assimilation approaches [7].
3.1. Direct observer assimilation
Direct observer techniques sequentially update the model forecast xkb (a priori simulation
result), using the difference between observation yk and model predicted observation yk ,known as the “innovation”, whenever observations are available. The predicted observationis calculated from the model predicted or “background” states, indicated by the superscriptb. The correction, or analysis increment, added to the background state vector is the innovationmultiplied by a weighting factor or gain K. The resulting estimate of the state vector is knownas the “analysis”, as indicated by the superscript a.
( )ˆ ˆ ˆa bk k k k k= + -x x K y y (1)
The subscript k refers to the time of the update. For particular assimilation techniques, like theKalman filter, the gain represents the relative uncertainty in the observation and modelvariances, and is a number between 0 and 1 in the scalar case. If the uncertainty of the predictedobservation (as calculated from the background states and their uncertainty) is large relative
Improved Disaster Management Using Data Assimilationhttp://dx.doi.org/10.5772/55840
87
to the uncertainty of the actual observation, then the analysis state vector takes on values thatwill closely yield the actual observation. Conversely, if the uncertainty of the predictedobservation is small relative to the uncertainty of the actual observation, then the analysis statevector is unchanged from the original background value. The commonly used direct observermethods are: (i) direct insertion; (ii) statistical correction; (iii) successive correction; (iv) analysiscorrection; (v) nudging; (vi) optimal interpolation/statistical interpolation; (vii) 3-D variation‐al, 3D-Var; and (viii) Kalman filter and variants [7].
While approaches like direct insertion, nudging and optimal interpolation are computationallyefficient and easy to implement, the updates do not account for observation uncertainty orutilize system dynamics in estimating model background state uncertainty, and informationon estimation uncertainty is limited. The Kalman filter, while computationally demanding inits pure form, can be adapted for near-real-time application and provides information onestimation uncertainty. However, it has only limited capability to deal with different types ofmodel errors, and necessary linearization approximations can lead to unstable solutions. TheEnsemble Kalman filter (EnKF), while it can be computationally demanding (depending onthe size of the ensemble) is well suited for near-real-time applications without any need forlinearization, is robust, very flexible and easy to use, and is able to accommodate a wide rangeof model error descriptions.
Direct insertion. One of the earliest and most simplistic approaches to data assimilation is directinsertion. As the name suggests, the forecast model states are directly replaced with theobservations by assuming that K = I, the unity matrix. This approach makes the explicitassumption that the model is wrong (has no useful information) and that the observations areright, which both disregards important information provided by the model and preservesobservational errors. The risk of this approach is that unbalanced state estimates may result,which causes model shocks: the model will attempt to restore the dynamic balance that wouldhave existed without insertion. A further key disadvantage of this approach is that model physicsare solely relied upon to propagate the information to unobserved parts of the system [9,10].
Statistical correction. A derivative of the direct insertion approach is the statistical correctionapproach, which adjusts the mean and variance of the model states to match those of theobservations. This approach assumes the model pattern is correct but contains a non-uniformbias. First, the predicted observations are scaled by the ratio of observational field standarddeviation to predicted field standard deviation. Second, the scaled predicted observationalfield is given a block shift by the difference between the means of the predicted observationalfield and the observational field [9]. This approach also relies upon the model physics topropagate the information to unobserved parts of the system.
Successive correction. The successive corrections method (SCM) [5,11-13] is also known asobservation nudging. The scheme begins with an a priori state estimate (background field) foran individual (scalar) variable, which is successively adjusted by nearby observations in aseries of scans (iterations, n) through the data. The advantage of this method lies in itssimplicity. However, in case of observational error or different sources (and accuracies) ofobservations, this scheme is not a good option for assimilation, since information on theobservational accuracy is not accounted for. Mostly, this approach assumes that the observa‐
Approaches to Disaster Management - Examining the Implications of Hazards, Emergencies and Disasters88
tions are more accurate than model forecasts, with the observations fitted as closely as isconsistent. Furthermore, the radii of influence are user-defined and should be determined bytrial and error or more sophisticated methods that reduce the advantage of its simplicity. Theweighting functions are empirically chosen and are not derived based on physical or statisticalproperties. Obviously, this method is not effective in data sparse regions.
Analysis correction. This is a modification to the successive correction approach that is appliedconsecutively to each observation [14]. In practice, the observation update is mostly neglectedand further assumptions make the update equation equivalent to that for optimal interpola‐tion [15].
Nudging. Nudging or Newtonian relaxation consists of adding a term to the prognostic modelequations that causes the solution to be gradually relaxed towards the observations. Nudgingis very similar to the successive corrections technique and only differs in the fact that throughthe numerical model the time dimension is included. Two distinct approaches have beendeveloped [16]. In analysis nudging, the nudging term for a given variable is proportional tothe difference between the model simulation at a given grid point and an “analysis” ofobservations (i.e., processed observations) calculated at the corresponding grid point. Forobservation nudging, the difference between the model simulation and the observed state iscalculated at the observation locations.
Optimal interpolation The optimal interpolation (OI) approach, sometimes referred to asstatistical interpolation, is a minimum variance method that is closely related to kriging. OIapproximates the “optimal” solution often with a “fixed” structure for all time steps, given byprescribed variances and a correlation function determined only by distance [17]. Sometimes,the variances are allowed to evolve in time, while keeping the correlation structure time-invariant.
3-D variational. This approach directly solves the iterative minimization problem given [18].The same approximation for the background covariance matrix as in the optimal interpolationapproach is typically used.
Kalman filter. The optimal analysis state estimate for linear or linearized systems (Kalman orExtended Kalman filter, EKF) can be found through a linear update equation with a Kalmangain that aims at minimizing the analysis error (co)variance of the analysis state estimate [19].The essential feature which distinguishes the family of Kalman filter approaches from morestatic techniques, like optimal interpolation, is the dynamic updating of the forecast (back‐ground) error covariance through time. In the traditional Kalman filter (KF) approach this isachieved by application of standard error propagation theory, using a (tangent) linear model.(The only difference between the Kalman filter and the Extended Kalman filter is that theforecast model is linearized using a Taylor series expansion in the latter; the same forecast andupdate equations are used for each approach.)
A further approach to estimating the state covariance matrix is the Ensemble Kalman filter(EnKF). As the name suggests, the covariances are calculated from an ensemble of state forecastsusing the Monte Carlo approach rather than a single discrete forecast of covariances [20].
Improved Disaster Management Using Data Assimilationhttp://dx.doi.org/10.5772/55840
89
3.2. Dynamic observer assimilation
The dynamic observer techniques find the best fit between the forecast model state and theobservations, subject to the initial state vector uncertainty and observation uncertainty, byminimizing over space and time an objective or penalty function, including a background andobservation penalty term. To minimize the objective function over time, an assimilation time“window” is defined and an “adjoint” model is typically used to find the derivatives of theobjective function with respect to the initial model state vector. The adjoint is a mathematicaloperator that allows one to determine the sensitivity of the objective function to changes in thesolution of the state equations by a single forward and backward pass over the assimilationwindow. While an adjoint is not strictly required (i.e., a number of forward passes can be usedto numerically approximate the objective function derivatives with respect to each state), it makesthe problem computationally tractable. The dynamic observer techniques can be consideredsimply as an optimization or calibration problem, where the state vector – not the modelparameters – at the beginning of each assimilation window is “calibrated” to the observationsover that time period. The dynamic observer techniques can be formulated with: (i) strongconstraint (variational); (ii) weak constraint (dual variational or representer methods).
Dynamic observer methods are well suited for smoothing problems, but provide informationon estimation accuracy only at considerable computational cost. Moreover, adjoints are notavailable for many existing environmental models, and the development of robust adjointmodels is difficult due to the non-linear nature of environmental processes.
4D-Var. In its pure form, the 4-D (3-D in space, 1-D in time) “variational” (otherwise knownas Gauss-Markov) dynamic observer assimilation methods use an adjoint to efficientlycompute the derivatives of the objective function with respect to each of the initial state vectorvalues. Solution to the variational problem is then achieved by minimization and iteration. Inpractical applications the number of iterations is usually constrained to a small number.
Given a model integration with finite time interval, and assuming a perfect model, 4D-Var andthe Kalman filter yield the same result at the end of the assimilation time interval. Inside thetime interval, 4D-Var is more optimal, because it uses all observations at once (before and afterthe time step of analysis), i.e., it is a smoother. A disadvantage of sequential methods is thediscontinuity in the corrections, which causes model shocks. Through variational methods,there is a larger potential for dynamically based balanced analyses, which will always besituated within the model climatology. Operational 4D-Var assumes a perfect model: no modelerror can be included. With the inclusion of model error, coupled equations are to be solvedfor minimization. Through Kalman filtering it is in general simpler to account for model error.
Both the Kalman filter and 3D/4D-Var rely on the validity of the linearity assumption. Adjointsdepend on this assumption and incremental 4D-Var is even more sensitive to linearity.Uncertainty estimates via the Hessian are critically dependent on a valid linearization.Furthermore, with variational assimilation it is more difficult to obtain an estimate of thequality of the analysis or of the state’s uncertainty after updating. In the framework ofestimation theory, the goal of variational assimilation is the estimation of the conditional mode
Approaches to Disaster Management - Examining the Implications of Hazards, Emergencies and Disasters90
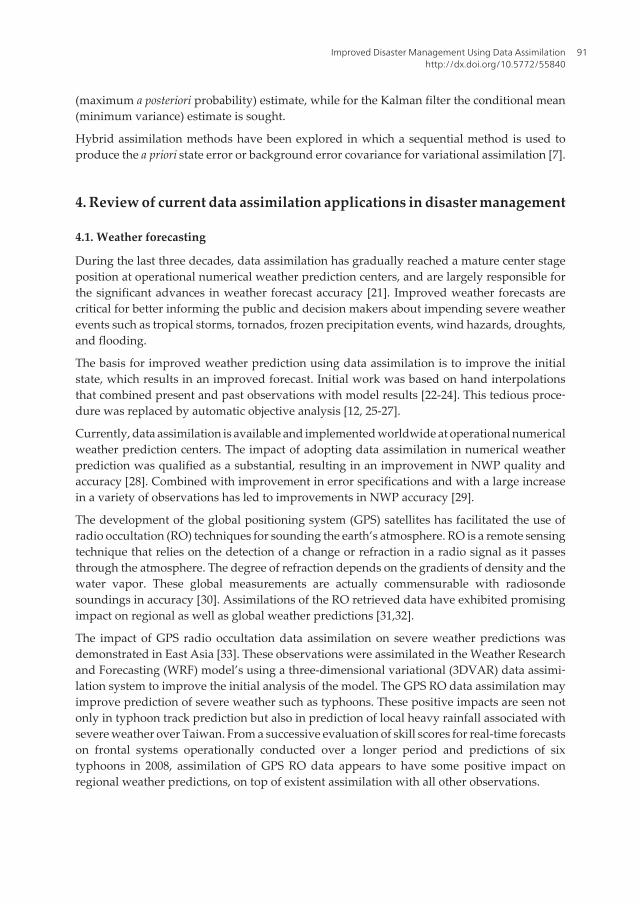
(maximum a posteriori probability) estimate, while for the Kalman filter the conditional mean(minimum variance) estimate is sought.
Hybrid assimilation methods have been explored in which a sequential method is used toproduce the a priori state error or background error covariance for variational assimilation [7].
4. Review of current data assimilation applications in disaster management
4.1. Weather forecasting
During the last three decades, data assimilation has gradually reached a mature center stageposition at operational numerical weather prediction centers, and are largely responsible forthe significant advances in weather forecast accuracy [21]. Improved weather forecasts arecritical for better informing the public and decision makers about impending severe weatherevents such as tropical storms, tornados, frozen precipitation events, wind hazards, droughts,and flooding.
The basis for improved weather prediction using data assimilation is to improve the initialstate, which results in an improved forecast. Initial work was based on hand interpolationsthat combined present and past observations with model results [22-24]. This tedious proce‐dure was replaced by automatic objective analysis [12, 25-27].
Currently, data assimilation is available and implemented worldwide at operational numericalweather prediction centers. The impact of adopting data assimilation in numerical weatherprediction was qualified as a substantial, resulting in an improvement in NWP quality andaccuracy [28]. Combined with improvement in error specifications and with a large increasein a variety of observations has led to improvements in NWP accuracy [29].
The development of the global positioning system (GPS) satellites has facilitated the use ofradio occultation (RO) techniques for sounding the earth’s atmosphere. RO is a remote sensingtechnique that relies on the detection of a change or refraction in a radio signal as it passesthrough the atmosphere. The degree of refraction depends on the gradients of density and thewater vapor. These global measurements are actually commensurable with radiosondesoundings in accuracy [30]. Assimilations of the RO retrieved data have exhibited promisingimpact on regional as well as global weather predictions [31,32].
The impact of GPS radio occultation data assimilation on severe weather predictions wasdemonstrated in East Asia [33]. These observations were assimilated in the Weather Researchand Forecasting (WRF) model’s using a three-dimensional variational (3DVAR) data assimi‐lation system to improve the initial analysis of the model. The GPS RO data assimilation mayimprove prediction of severe weather such as typhoons. These positive impacts are seen notonly in typhoon track prediction but also in prediction of local heavy rainfall associated withsevere weather over Taiwan. From a successive evaluation of skill scores for real-time forecastson frontal systems operationally conducted over a longer period and predictions of sixtyphoons in 2008, assimilation of GPS RO data appears to have some positive impact onregional weather predictions, on top of existent assimilation with all other observations.
Improved Disaster Management Using Data Assimilationhttp://dx.doi.org/10.5772/55840
91
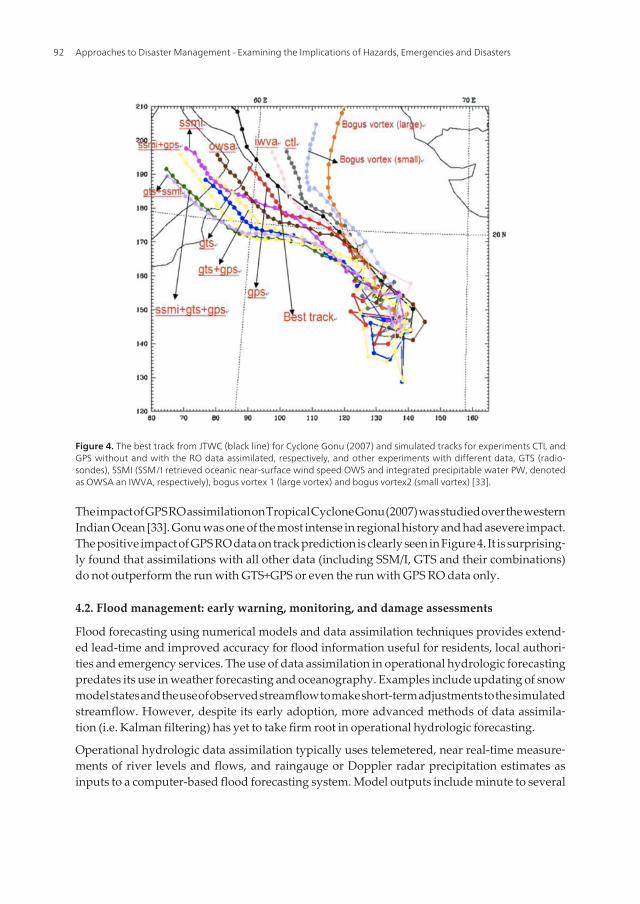
The impact of GPS RO assimilation on Tropical Cyclone Gonu (2007) was studied over the westernIndian Ocean [33]. Gonu was one of the most intense in regional history and had asevere impact.The positive impact of GPS RO data on track prediction is clearly seen in Figure 4. It is surprising‐ly found that assimilations with all other data (including SSM/I, GTS and their combinations)do not outperform the run with GTS+GPS or even the run with GPS RO data only.
4.2. Flood management: early warning, monitoring, and damage assessments
Flood forecasting using numerical models and data assimilation techniques provides extend‐ed lead-time and improved accuracy for flood information useful for residents, local authori‐ties and emergency services. The use of data assimilation in operational hydrologic forecastingpredates its use in weather forecasting and oceanography. Examples include updating of snowmodel states and the use of observed streamflow to make short-term adjustments to the simulatedstreamflow. However, despite its early adoption, more advanced methods of data assimila‐tion (i.e. Kalman filtering) has yet to take firm root in operational hydrologic forecasting.
Operational hydrologic data assimilation typically uses telemetered, near real-time measure‐ments of river levels and flows, and raingauge or Doppler radar precipitation estimates asinputs to a computer-based flood forecasting system. Model outputs include minute to several
Figure 4. The best track from JTWC (black line) for Cyclone Gonu (2007) and simulated tracks for experiments CTL andGPS without and with the RO data assimilated, respectively, and other experiments with different data, GTS (radio‐sondes), SSMI (SSM/I retrieved oceanic near-surface wind speed OWS and integrated precipitable water PW, denotedas OWSA an IWVA, respectively), bogus vortex 1 (large vortex) and bogus vortex2 (small vortex) [33].
Approaches to Disaster Management - Examining the Implications of Hazards, Emergencies and Disasters92
day forecasts for river levels, river flows, and reservoir and lake levels. Forecasts can beextended further using weather forecasts, and can include snowmelt processes and rivercontrol operations.
Hydrologic rainfall-runoff models are used to estimate river flows from rainfall observationsand forecasts. These models may take into account local catchment topography, soils, vegeta‐tion, temperature, river flow hydrodynamics, and structure operations and backwater effects.These models are enhanced using data assimilation methods such as error prediction, stateupdating, and parameter updating techniques. Forecast uncertainties can arise and propagatethrough the modeling network from errors in model parameters, initial conditions, boundaryconditions, data inputs and model physics.
As part of the European Union near real time flood forecasting, warning and management“FloodMan” project data-assimilation techniques were developed, demonstrated and validat‐ed for integrated hydrological and hydraulic models in a pilot study of the Rhine River [34].The model combines a hydraulic model (SOBEK) representing the Rhine River betweenAndernach and Düsseldorf with a hydrological model (HBV) for the Sieg tributary. To increasethe accuracy of flood forecasts, data assimilation is applied, using measured water levels atBonn and Cologne to adapt bed roughness and lateral discharges until the calculated waterlevels agree with the measured water levels.
The data-assimilation technique computes model corrections based on the assumption that theuncertainties in model output and observations are known and are normally distributed. Thedata-assimilation algorithm compares the observed value with the calculated value, and makescorrections to the parameters. The changes are made taking into consideration the uncertaintyof the parameters and measured data. For example, a mean water level measurement isaccurate compared to calculated water levels. Therefore the water level calculated with data-assimilation will be closer to the measured water level than the calculated without data-assimilation.
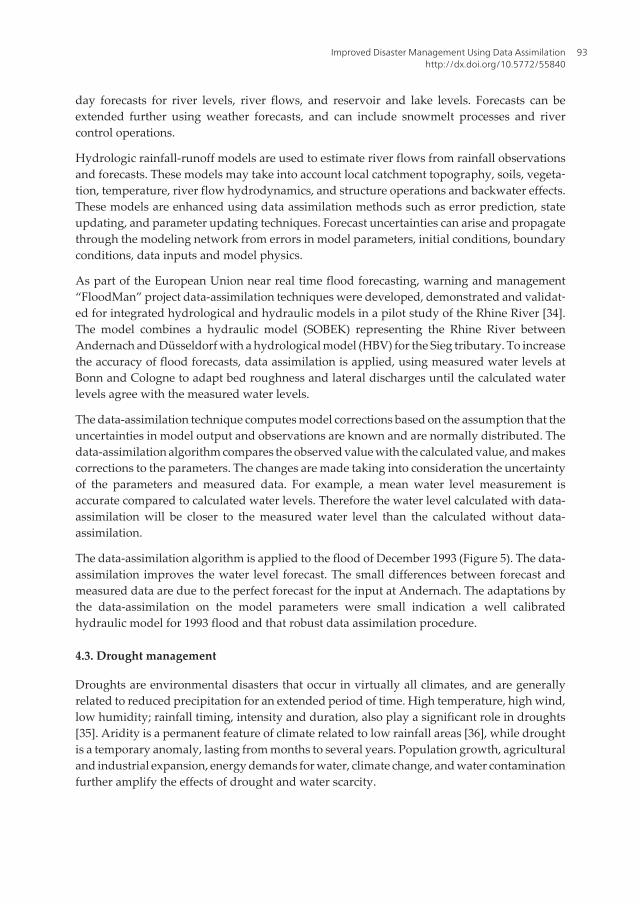
The data-assimilation algorithm is applied to the flood of December 1993 (Figure 5). The data-assimilation improves the water level forecast. The small differences between forecast andmeasured data are due to the perfect forecast for the input at Andernach. The adaptations bythe data-assimilation on the model parameters were small indication a well calibratedhydraulic model for 1993 flood and that robust data assimilation procedure.
4.3. Drought management
Droughts are environmental disasters that occur in virtually all climates, and are generallyrelated to reduced precipitation for an extended period of time. High temperature, high wind,low humidity; rainfall timing, intensity and duration, also play a significant role in droughts[35]. Aridity is a permanent feature of climate related to low rainfall areas [36], while droughtis a temporary anomaly, lasting from months to several years. Population growth, agriculturaland industrial expansion, energy demands for water, climate change, and water contaminationfurther amplify the effects of drought and water scarcity.
Improved Disaster Management Using Data Assimilationhttp://dx.doi.org/10.5772/55840
93
Droughts impact both surface and groundwater, leading to reduced water supply and quality,crop failure, reduced livestock range, reduced power supply, disturbed riparian habitat, anddeferred recreation [37]. Therefore, droughts are of great importance in the planning andmanagement of water resources.
Droughts rank first among all natural hazards when measured in terms of the number ofpeople affected [38]. Hazard events were ranked based on the degree of severity, the length ofevent, total areal extent, total loss of life, total economic loss, social effect, long-term impact,suddenness, and occurrence of associated hazards [39]. It was found that drought stood firstbased on most of the hazard characteristics. Other natural hazards, which followed droughtsin terms of their rank, are tropical cyclones, regional floods, earthquakes, and volcanoes.
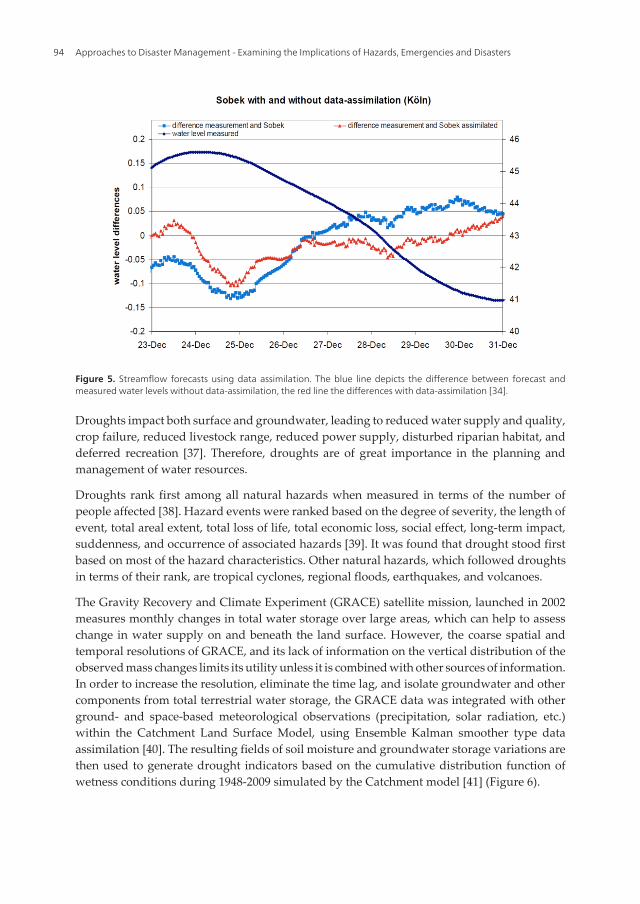
The Gravity Recovery and Climate Experiment (GRACE) satellite mission, launched in 2002measures monthly changes in total water storage over large areas, which can help to assesschange in water supply on and beneath the land surface. However, the coarse spatial andtemporal resolutions of GRACE, and its lack of information on the vertical distribution of theobserved mass changes limits its utility unless it is combined with other sources of information.In order to increase the resolution, eliminate the time lag, and isolate groundwater and othercomponents from total terrestrial water storage, the GRACE data was integrated with otherground- and space-based meteorological observations (precipitation, solar radiation, etc.)within the Catchment Land Surface Model, using Ensemble Kalman smoother type dataassimilation [40]. The resulting fields of soil moisture and groundwater storage variations arethen used to generate drought indicators based on the cumulative distribution function ofwetness conditions during 1948-2009 simulated by the Catchment model [41] (Figure 6).
Figure 5. Streamflow forecasts using data assimilation. The blue line depicts the difference between forecast andmeasured water levels without data-assimilation, the red line the differences with data-assimilation [34].
Approaches to Disaster Management - Examining the Implications of Hazards, Emergencies and Disasters94
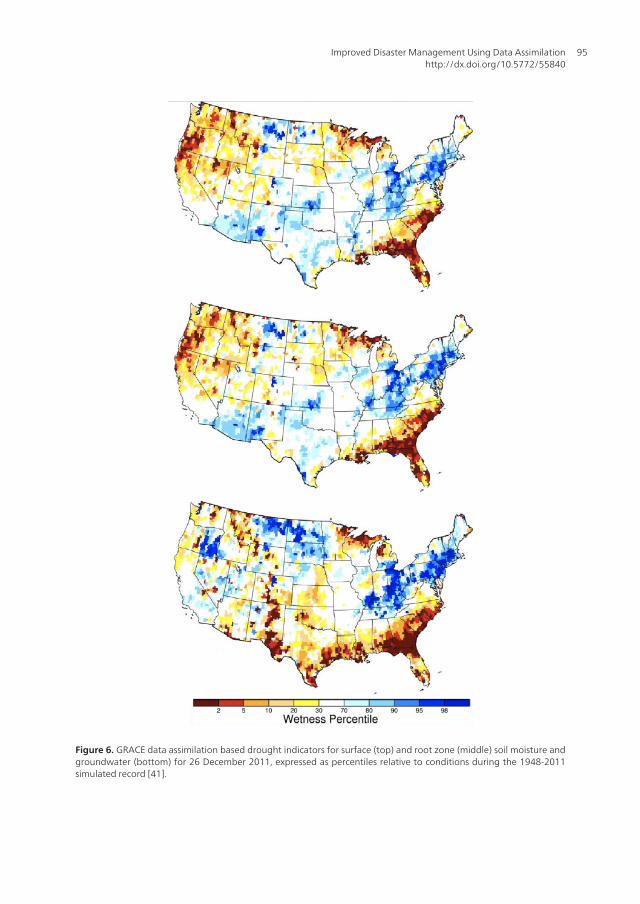
Figure 6. GRACE data assimilation based drought indicators for surface (top) and root zone (middle) soil moisture andgroundwater (bottom) for 26 December 2011, expressed as percentiles relative to conditions during the 1948-2011simulated record [41].
Improved Disaster Management Using Data Assimilationhttp://dx.doi.org/10.5772/55840
95
There are several aquifers in the U.S. that have been depleted in that way over the past century,such as the southern half of the High Plains aquifer in the central U.S. If the groundwaterdrought indicator map accounted for human-induced depletion, such regions would be redall the time, which would not be useful for evaluating current wetness conditions relative toprevious conditions. On time scales of weeks to ten years, we expect that these maps will bereasonably well correlated with measured water table variations over spatial scales of 25 km(16 miles) or more. However, users should not assume a direct correspondence between thesegroundwater percentiles and measured groundwater levels over multiple decades. The color-coded maps show how much water is stored now as a probability of occurrence in the recordfrom 1948 to the present.
4.4. Radiation guidance and monitoring
Decision makers must have the information needed to react in a rapid and appropriate mannerbefore, during and immediately after an accidental or intentional contamination of theenvironment. Decision support systems are needed to estimate the likely evolution of theenvironmental contamination. The primary goal is to determine the area likely to be affectedby a possible release and to obtain an estimate of the potential maximum environmentalconsequences. In the early phases of an accident the main goal is to provide a forecast of themagnitude and geographical coverage of the potential environmental consequences. It isimportant to know the prevailing and forecasted meteorological conditions in the local area.Also the status of the source should be known in detail. Depending on the meteorologicalsituation and the model used, trajectories may be calculated first to give a rough estimation ofthe plume transport.
Dispersion models driven with weather data and best-estimate source information can be used.When results of radiological measurements are available they can be used to improve modelcalculations by data assimilation. Atmospheric dispersion modeling of radioactive material inradiological risk assessment and emergency response has evolved significantly over the past50 years. The three types of dispersion models are the Gaussian plume, Lagrangian-puff andparticle random walk, and computational fluid dynamic models. When data from radiologicalmeasurements are available, they should be taken into account in the consequence assessmentand used to correct and update model calculation results (data assimilation). Because obser‐vations are often sparse in emergency situations, data assimilation procedures should bedesigned to handle cases with only a few measurements. Even simple dispersion modelswould benefit from data assimilation, and may also run faster to provide critical time-sensitiveinformation to decision makers [42].
Rojas-Palma et al., (2005) describe an in-depth effort to integrate a suite of computer codes,with different degrees of complexity, into a European real-time, on-line decision supportsystem for off-site management of nuclear emergencies (the RODOS system) [42]. The resultingmodeling system describes the transport and dispersion of radionuclides in both atmosphericand aquatic systems, as well as their impact on the food chain.
RODOS predicts the values of many quantities that are likely to be of interest to decisionmakers after an accident (e.g. activity concentration in air, deposition, concentration in foods,
Approaches to Disaster Management - Examining the Implications of Hazards, Emergencies and Disasters96
external dose rates, concentrations in water bodies). The predictions will not exactly reflect thesituation after an accident, as the models use a number of assumptions that are appropriate tothe average situation across large areas of Europe, rather than to the particular conditions ofthe area affected by the accident. In the period immediately after the accident there will be alimited amount of information available from monitoring programs. To make the best use ofthis information, it is necessary to correct the RODOS predictions in light of the availablemeasurements.
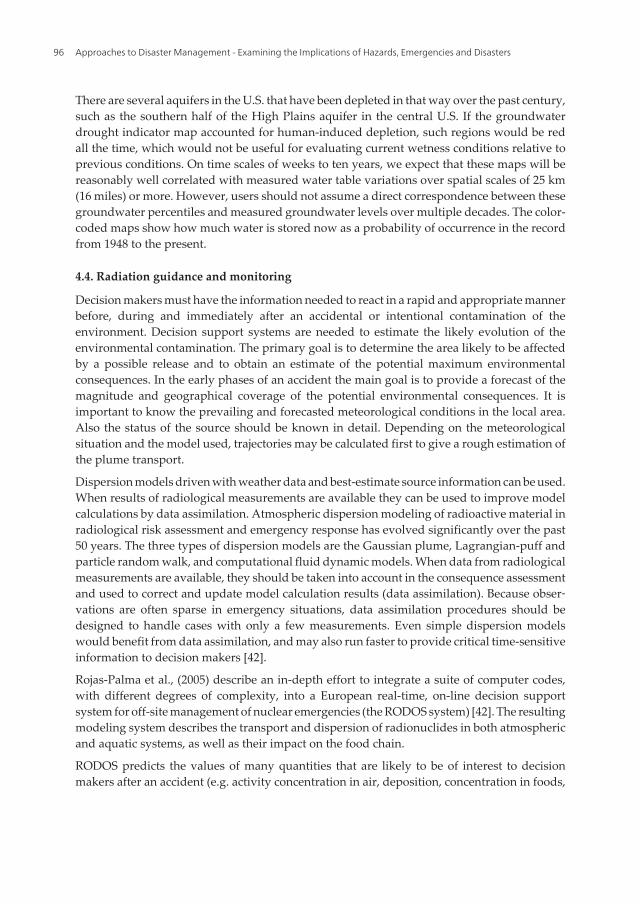
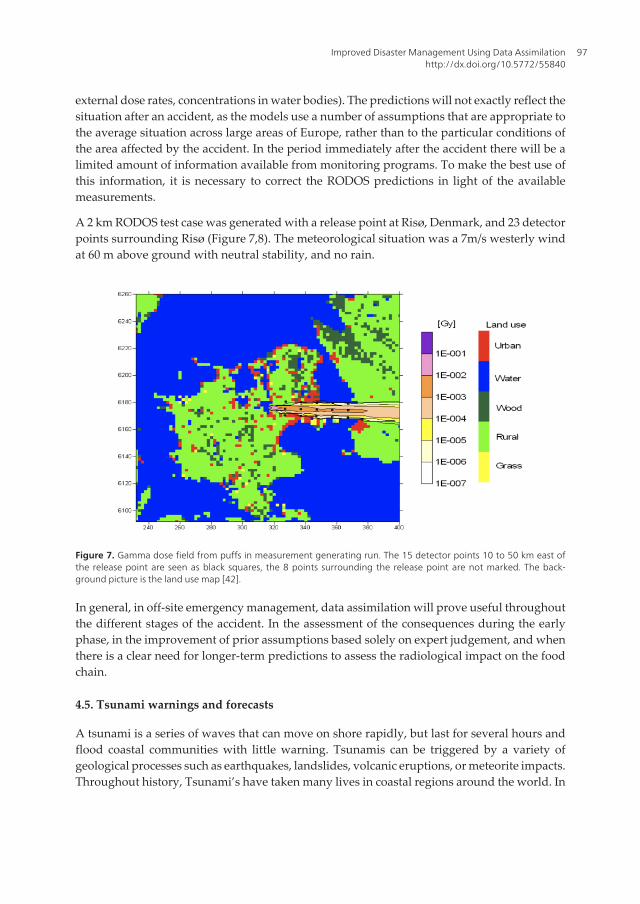
A 2 km RODOS test case was generated with a release point at Risø, Denmark, and 23 detectorpoints surrounding Risø (Figure 7,8). The meteorological situation was a 7m/s westerly windat 60 m above ground with neutral stability, and no rain.
Figure 7. Gamma dose field from puffs in measurement generating run. The 15 detector points 10 to 50 km east ofthe release point are seen as black squares, the 8 points surrounding the release point are not marked. The back‐ground picture is the land use map [42].
In general, in off-site emergency management, data assimilation will prove useful throughoutthe different stages of the accident. In the assessment of the consequences during the earlyphase, in the improvement of prior assumptions based solely on expert judgement, and whenthere is a clear need for longer-term predictions to assess the radiological impact on the foodchain.
4.5. Tsunami warnings and forecasts
A tsunami is a series of waves that can move on shore rapidly, but last for several hours andflood coastal communities with little warning. Tsunamis can be triggered by a variety ofgeological processes such as earthquakes, landslides, volcanic eruptions, or meteorite impacts.Throughout history, Tsunami’s have taken many lives in coastal regions around the world. In
Improved Disaster Management Using Data Assimilationhttp://dx.doi.org/10.5772/55840
97
the wake of the catastrophic 2004 Indian Ocean tsunami, which caused over 200,000 deathsand widespread destruction, many governmental organizations have increased their effortsto diminish the potential impacts of a tsunami by strengthening tsunami detection, warning,education and preparedness efforts [43].
In contrast to forecasting other natural hazards such as hurricanes or floods, near-real-timetsunami forecast models must produce predictions after a seismic event has been detected, butbefore the event arrive at the coast. These forecasts provide emergency managers near-realtimeinformation about the time of first impact as well as the sizes and duration of the tsunamiwaves, and give an estimate of the area of inundation. The entire forecasting process has to becompleted very quickly, to allow time for evacuation efforts. The entire forecast, includingdata acquisition, data assimilation and inundation projections, must take place within a fewhours [44].
Titov et al., (2003) presented a method for tsunami forecasting that combining real-time datafrom tsunameters with numerical model estimates to provide site- and event-specific fore‐casts for tsunamis in real time [45]. Observational networks will never be sufficiently densebecause the ocean is vast. Establishing and maintaining monitoring stations is costly and difficult,
Figure 8. Gamma dose rates 50 km from the release point, right below the plume. Kalman filtering applied in runswith the release doubled and halved relative to that having generated the "measurements", and with different releaserate uncertainties "a" [42].
Approaches to Disaster Management - Examining the Implications of Hazards, Emergencies and Disasters98
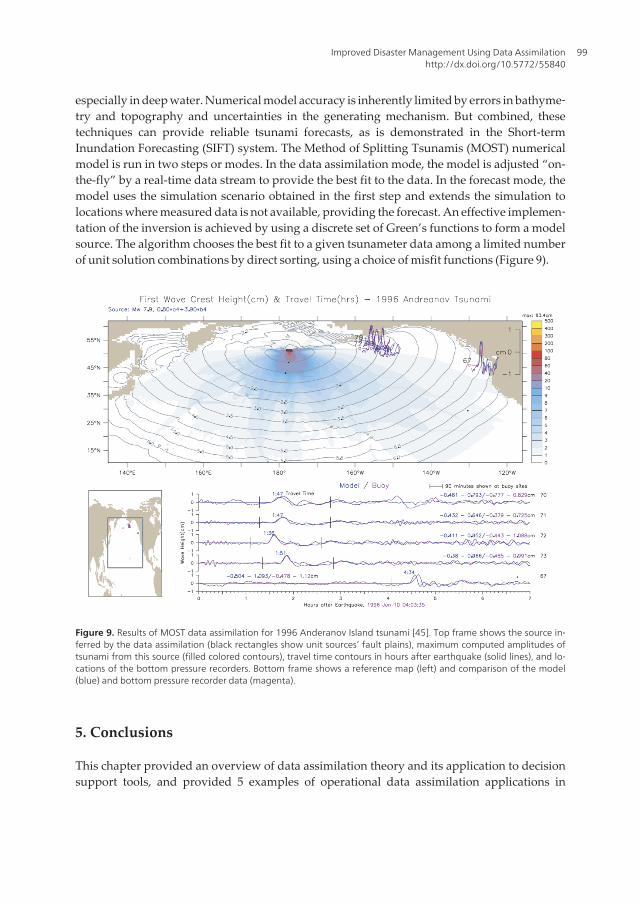
especially in deep water. Numerical model accuracy is inherently limited by errors in bathyme‐try and topography and uncertainties in the generating mechanism. But combined, thesetechniques can provide reliable tsunami forecasts, as is demonstrated in the Short-termInundation Forecasting (SIFT) system. The Method of Splitting Tsunamis (MOST) numericalmodel is run in two steps or modes. In the data assimilation mode, the model is adjusted “on-the-fly” by a real-time data stream to provide the best fit to the data. In the forecast mode, themodel uses the simulation scenario obtained in the first step and extends the simulation tolocations where measured data is not available, providing the forecast. An effective implemen‐tation of the inversion is achieved by using a discrete set of Green’s functions to form a modelsource. The algorithm chooses the best fit to a given tsunameter data among a limited numberof unit solution combinations by direct sorting, using a choice of misfit functions (Figure 9).
Figure 9. Results of MOST data assimilation for 1996 Anderanov Island tsunami [45]. Top frame shows the source in‐ferred by the data assimilation (black rectangles show unit sources’ fault plains), maximum computed amplitudes oftsunami from this source (filled colored contours), travel time contours in hours after earthquake (solid lines), and lo‐cations of the bottom pressure recorders. Bottom frame shows a reference map (left) and comparison of the model(blue) and bottom pressure recorder data (magenta).
5. Conclusions
This chapter provided an overview of data assimilation theory and its application to decisionsupport tools, and provided 5 examples of operational data assimilation applications in
Improved Disaster Management Using Data Assimilationhttp://dx.doi.org/10.5772/55840
99
disaster management. These included tsunami warning, radiation guidance and monitoring,flood and drought management, and weather forecasting.
Information about environmental conditions is of critical importance to real-world applica‐tions disaster management in areas such as agricultural production, water resource manage‐ment, flood prediction, water supply, weather and climate forecasting, and environmentalpreservation. This information is usually provided to decision makers through DecisionSupport Systems (DSS). Observations are important components of DSSs, providing criticalinformation that mitigate the risk of loss of life and damage to property. Environmental processmodels are used in DSSs to predict the temporal and spatial state variations, but thesepredictions are often poor, due to model initialization, parameter and forcing, and physicserrors. Therefore, we must combine the strengths of environmental models contained withinDSSs and observations and minimize the weaknesses to provide a superior environmentalstate estimate – data assimilation.
Data assimilation merges the spatially comprehensive observations with the dynamicallycomplete but typically poor predictions of an environmental model to yield the best possiblesystem state estimation. Data assimilation aims to utilize both our knowledge of physicalprocesses as embodied in a numerical process model, and information that can be gained fromobservations, to produce an improved, continuous system state estimate in space and time.When implemented in near-real time, data assimilation can objectively provide decisionmakers with the timeliest information, as well as provide superior initializations for short termscenario predictions. Data assimilation can also act as a parameter estimation method to helpreduce DSS bias and uncertainty.
Author details
Paul R. Houser*
Address all correspondence to: [email protected]
George Mason University, Fairfax, VA, USA
References
[1] Houser, P. (2002). Air and Water Monitoring for Homeland Security, Earth Observa‐tion Magazine, , 11(8), 33-36.
[2] Houser, P, Hutchinson, M. F, & Viterbo, P. Hervé Douville, J., and Running, S. W.(2004). Terrestrial data assimilation, Chapter C.4 in Vegetation, Water, Humans andthe Climate. Global Change- The IGB Series. Kabat, P. et al. (eds). Springer, Berlin.
Approaches to Disaster Management - Examining the Implications of Hazards, Emergencies and Disasters100
[3] Walker, J. P, & Houser, P. R. (2005). Hydrologic Data Assimilation, In: A. Aswatha‐narayana (Ed.), Advances in Water Science Methodologies, A.A. Balkema, TheNe‐therlands, 230pp.
[4] Charney, J. G, Halem, M, & Jastrow, R. (1969). Use of incomplete historical data toinfer the present state of the atmosphere. J. Atmos. Sci., , 26, 1160-1163.
[5] Daley, R. (1991). Atmospheric data analysis. Cambridge University Press, 460 pp.
[6] Bennett, A. F. (1992). Inverse methods in physical oceanography. Cambridge Univer‐sity Press, 346 pp.
[7] Houser, P. R, De Lannoy, G, & Walker, J. P. Land Surface Data Assimilation, pIn: La‐hoz, W., Khatattov, B. and Menard, R. (Eds.), Data Assimilation: Making sense of ob‐servations, Springer, The Netherlands, (2010). pp., 549-598.
[8] WMO(1992). Simulated real-time intercomparison of hydrological models (Tech.Rep. Geneva.(38)
[9] Houser, P. R, Shuttleworth, W. J, Famiglietti, J. S, Gupta, H. V, Syed, K. H, & Good‐rich, D. C. (1998). Integration of soil moisture remote sensing and hydrologic model‐ing using data assimilation. Water Resour. Res., , 34, 3405-3420.
[10] [10] Walker, J. P, Willgoose, G. R, & Kalma, J. D. (2001). One-dimensional soil mois‐ture profile retrieval by assimilation of near-surface observations: A comparison ofretrieval algorithms. Adv. Water Resour., , 24, 631-650.
[11] Bergthorsson, P, & Döös, B. (1955). Numerical weather map analysis. Tellus, , 7,329-340.
[12] Cressman, G. P. (1959). An operational objective analysis system. Mon. WeatherRev., , 87, 367-374.
[13] Bratseth, A. M. (1986). Statistical interpolation by means of successive corrections.Tellus, 38A, , 439-447.
[14] Lorenc, A. C, Bell, R. S, & Macpherson, B. (1991). The Meteorological Office analysiscorrection data assimilation scheme. Q. J. R. Meteorol. Soc., , 117, 59-89.
[15] Nichols, N. K. (2001). State estimation using measured data in dynamic system mod‐els, Lecture notes for the Oxford/RAL Spring School in Quantitative Earth Observa‐tion.
[16] Stauffer, D. R, & Seaman, N. L. (1990). Use of four-dimensional data assimilation in alimited-area mesoscale model. Part I: Experiments with synoptic-scale data. Mon.Weather Rev., , 118, 1250-1277.
[17] Lorenc, A. (1981). A global three-dimensional multivariate statistical interpolationscheme. Mon. Weather Rev., , 109, 701-721.
Improved Disaster Management Using Data Assimilationhttp://dx.doi.org/10.5772/55840
101
[18] Parrish, D, & Derber, J. (1992). The National Meteorological Center’s spectral statisti‐cal interpolation analysis system. Mon. Weather Rev., , 120, 1747-1763.
[19] Kalman, R. E. (1960). A new approach to linear filtering and prediction problems.Trans. ASME, Ser. D, J. Basic Eng., , 82, 35-45.
[20] Turner, M. R. J, Walker, J. P, & Oke, P. R. (2007). Ensemble Member Generation forSequential Data Assimilation. Remote Sensing of Environment, 112, doi:10.1016/j.rse.2007.02.042.
[21] Navon, I. Data assimilation for numerical weather prediction: A Review; Springer: Berlin,Germany, (2009).
[22] Richardson, L. F. (1922). Weather prediction by numerical processes. Cambridge Uni‐versity Press. Reprinted by Dover (1965, New York).With a New Introduction bySydney Chapman, xvi+236
[23] Charney, J. G, et al. (1950). Numerical integration of the barotropic vorticity equation.Tellus , 2, 237-254.
[24] Kalnay, E. (2003). Atmospheric modeling, data assimilation and predictability. Cam‐bridge Univ Press, Cambridge, , 341.
[25] Panofsky, H. A. (1949). Objective weather-map analysis. J Appl Meteor , 6, 386-392.
[26] Gilchrist, B, & Cressman, G. P. (1954). An experiment in objective analysis. Tellus , 6,309-318.
[27] Barnes, S. L. (1964). A technique for maximizing details in numerical weather mapanalysis. J Appl Meteor , 3, 395-409.
[28] Rabier, F. (2005). Overview of global data assimilation developments in numericalweather prediction centers. Q J R Meteorol Soc , 131(613), 215-3233.
[29] Simmons, A. J, & Hollingsworth, A. (2002). Some aspects of the improvement in skillof numerical weather prediction. Q J R Meteorol Soc , 128, 647-677.
[30] Kursinski, E. R, Leroy, S. S, & Herman, B. (2000). The GPS radio occultation techni‐que. Terr. Atmos. Oceanic Sci., , 11, 53-114.
[31] Kuo, Y, Zou, H. , X, & Huang, W. (1997). The impact of GPS data on the prediction ofan extratropical cyclone: An observing system simulation experiment. J. Dyn. Atmos.Ocean., , 27, 439-470.
[32] Chen, S-Y, Huang, C-Y, Kuo, Y-H, Guo, Y-R, & Sokolovskiy, S. (2009). Typhoon pre‐dictions with GPS radio occultation data assimilations by WRF-VAR using local andnonlocal operators. Terr Atmos Oceanic Sci , 20, 133-154.
[33] Huang, C, Kuo, Y. , Y. -H, Chen, S. -Y, Terng, C. -T, Chien, F. -C, Lin, P. -L, Kueh, M.-T, Chen, S. -H, Yang, M. -J, Wang, C. -J, & Rao, A. S. K. A. V. P. (2010). Impact of
Approaches to Disaster Management - Examining the Implications of Hazards, Emergencies and Disasters102
GPS radio occultation data assimilation on regional weather predictions. GPS Solu‐tions, DOI:s10291-009-0144-1., 14, 35-49.
[34] Vermeulen, C. J. M, Barneveld, H. J, Huizinga, H. J, & Havinga, F. J. (2005). Data-as‐similation in flood forecasting using time series and satellite data. International con‐ference on innovation advances and implementation of flood forecasting technology,October 2005, Tromsø, Norway, 17-19.
[35] Mishra, A. K, & Singh, V. P. (2010). A review of drought concepts. J Hydrol , 391,202-21.
[36] Wilhite, D. A. (1992). Preparing for Drought: A Guidebook for Developing Countries,Climate Unit, United Nations Environment Program, Nairobi, Kenya.
[37] [37]Riebsame, W. E, Changnon, S. A, & Karl, T. R. (1991). Drought and Natural Re‐source Management in the United States: Impacts and Implications of the 1987-1989Drought. Westview Press, Boulder, CO, , 174.
[38] Wilhite, D. A. Drought as a natural hazard: concepts and definitions. D.A. Wilhite(Ed.), Drought: A Global Assessment, New York ((2000). , 1Routledge, 1-18.
[39] Bryant, E. A. Natural Hazards, Cambridge University Press, Cambridge ((1991).
[40] Zaitchik, B. F, Rodell, M, & Reichle, R. H. (2008). Assimilation of GRACE terrestrialwater storage data into a land surface model: results for the Mississippi river basin. J.Hydrometeorol. , 9, 535-548.
[41] Houborg, R, Rodell, M, Li, B, Reichle, R, & Zaitchik, B. Drought indicators based onmodel assimilated GRACE terrestrial water storage observations, Wat. Resour. Res.,48, W07525, doi:10.1029/2011WR011291,(2012).
[42] Rojas-palma, C. Data assimilation for off site nuclear emergency management,” Tech.Rep., SCK-CEN, DAONEM final report, RODOS(RA5)-RE(04)-01, (2005).
[43] NRC(2011). Tsunami Warning and Preparedness: An Assessment of the US TsunamiProgram and the Nation’s Preparedness Efforts. National Academies Press, Wash‐ington, DC, 284 pp.
[44] Whitmore, P. M, Benz, H, Bolton, M, Crawford, G. L, Dengler, L, Fryer, G, Goltz, J,Hansen, R, Kryzanowski, K, Malone, S, Oppenheimer, D, Petty, E, Rogers, G, & Wil‐son, J. (2008). NOAA/WestCoast and Alaska Tsunami Warning Center Pacific Oceanresponse criteria. Science of Tsunami Hazards , 27(2), 1-21.
[45] Titov, V. V, Gonz, F. I, Alez, E. N, Bernard, M. C, Eble, H. O, Mofjeld, J. C, & New‐man, A. J. Venturato ((2004). Real-time tsunami forecasting: Challenges and solu‐tions. Nat. Haz., 35(1), 41-58.
Improved Disaster Management Using Data Assimilationhttp://dx.doi.org/10.5772/55840
103