Embed Size (px)
Citation preview
Improved harvesting technology for thinning of small diameter stands
Impact on forest management and national supply of
forest biomass
Lars Sängstuvall Faculty of Forest Sciences
Department of Forest Resource Management
Umeå
Doctoral thesis
Swedish University of Agricultural Sciences
Umeå 2018
Acta Universitatis agriculturae Sueciae
2018:66
ISSN 1652-6880
ISBN (print version) 978-91-7760-272-9
ISBN (electronic version) 978-91-7760-273-6
© 2018 Lars Sängstuvall, Umeå
Print: SLU Service/Repro, Uppsala 2018
Cover: Two 2×10 m2 harvest corridors in a V-shaped pattern.
(photo: Lars Sängstuvall)

Forest biomass is used as feedstock for forest products as well as for bioenergy. The current
Swedish roundwood utilization is near the sustainable maximum. This implies that increased
forest biomass consumption in Sweden must utilize additional parts of the trees already harvested,
and/or that small trees not utilized today must be harvested, with current or novel methods,
techniques and practices. This thesis explores thinning of small diameter forest stands with the
removal of thinned trees including stems, tops, branches and needles – biomass thinning (BT) in
Sweden. Major advances in BT were witnessed in the Nordic countries between the years 2005-
2010. Harvesting in a geometrical pattern (boom-corridors), with a conventional harvester head or
a specialized area-based felling device, was defined and conceptually evaluated. These
evaluations showed potential BT harvester productivity gains, but the lack of generic productivity
models for BT machines prevented further analyses. The overall objective of this thesis is to
analyse the impact of such new BT harvesting technology with regards to recovery costs, forest
management and national forest biomass supply.
Many of the scenarios analysed in this thesis include non-existing phenomena, a fact being one
of the challenges for providing reliable BT assessments. A harvester simulation model was used
to quantify BT harvester productivity benefits from geometrical harvest patterns and area-based
felling devices. Deductive modelling boosted the conclusions that could be drawn from a limited
and heterogeneous set of empirical observations on BT haulage with medium-sized forwarders.
Derived generic BT harvester and forwarder productivity functions were implemented in the
Heureka decision support system and thus available in the subsequent SweFor partial equilibrium
model, which was examined for influences of assumptions regarding land owner behaviour and
saw log supply models. Finally, SweFor was employed to quantify the forest impact, and national
potential supply, of forest biomass from BT. Given the current energy market conditions, BT was
the preferred management regime on about 15% of the managed Swedish forest area, and
provided 15% of the total supply to heat plants. Market limitations aside, BT could increase with
more than 300%, which could be seen as a potential for increased forest biomass utilization for
other products.
In conclusion, this thesis demonstrates methods to address forest operations and management
research questions including non-existing phenomena, and confirms BT as a viable major future
option in Swedish forestry.
Keywords: Thinning, biomass, harvester, forwarder, simulation, deductive framework, forest
planning, forest impact, sector model, partial equilibrium model.
Author’s address: SLU, Department of Forest Resource Management, 901 83 Umeå, Sweden.
E-mail: [email protected]
Improved harvesting technology for thinning of small diameter stands – Impact on forest management and national supply of forest biomass
Abstract

Biomassa från skogen används som råvara för såväl skogsprodukter (papper, massa, sågade
trävaror) som bioenergi. Den svenska avverkningen av rundvirke ligger nära den högsta hållbara
nivån. Detta innebär att ökat utnyttjande av biomassa från den svenska skogen till del måste
baseras på andra delar av de träd som redan avverkas, och/eller småträd som inte tillvaratas idag,
med hjälp av befintlig eller ny drivningsteknik. Denna avhandling undersöker gallring av klen
skog med tillvaratagande av stamved, toppar, grenar samt barr och blad – biomassagallring –
under svenska förhållanden. Stora utvecklingssteg togs inom biomassagallring i de nordiska
länderna under åren 2005-2010. Gallring i ett geometriskt mönster (krankorridorer) som ett
alternativ till selektiv gallring, med ett konventionellt skördaraggregat eller en specialbyggd
arealbaserad fällningsutrustning, definierades och utvärderades konceptuellt. Utvärderingen
visade på potentiella produktivitetsökningar i biomassagallring, men var för begränsad för att
tjäna som underlag för mer generella slutsatser. Det övergripande syftet med denna avhandling är
att analysera effekterna av nya tekniker och metoder för biomassagallring, med avseende på
drivningskostnad, skogsskötsel och nationell biomassaförsörjning från den svenska skogen.
Flera av de analyserade scenarierna i denna avhandling innehåller icke-existerande fenomen
(t.ex. den arealbaserade fällningsutrustningen), vilket utgör en extra utmaning i utvärderingen av
biomassagallring. Skördarproduktivitet i biomassagallring med bl.a. geometrisk skörd och
arealbaserad fällningsutrustning utvärderades med en simuleringsmodell. Skotarproduktivitet i
biomassagallring kunde skattas med högre noggrannhet ur ett begränsat datamaterial tack vare
deduktiv modellering. Funktioner för skattning av produktivitet i biomassagallring
implementerades sedan i beslutsstödssystemet Heureka, för vidare användning i SweFor, en
sektorsmodell över det svenska skogsbruket och den svenska skogsindustrin. SweFor
kontrollerades med avseende på markägarbeteende vid föryngringsavverkning samt modellering
av sågtimmerförsörjning. Därefter beräknades de skogliga och energiförsörjningsmässiga
konsekvenserna av biomassagallring med nya tekniker och metoder. Med dagens
marknadsförutsättningar blev biomassagallring optimal skötselregim på 15% av den brukade
skogsmarksarealen och stod för 15% av skoglig biomassaförsörjning till värmeverken. Med
obegränsad efterfrågan på skoglig biomassa, givet dagens prisnivåer, ökade den nyttjande
volymen från biomassagallring med 300%. Denna ökning kan ses som en potential för ökad
användning av skoglig biomassa till nya industrier eller produkter.
Sammanfattningsvis visar denna avhandling exempel på metoder för att analysera skogliga
frågeställningar som inkluderar icke-existerande fenomen, och indikerar att biomassagallring kan
få ett stort genomslag i svenskt skogsbruk.
Nyckelord: Gallring, biomassa, skördare, skotare, simulering, deduktivt ramverk, skoglig
planering, skogliga konsekvensanalyser, sektorsmodell, partiell jämviktsmodell.
Författarens adress: SLU, Institutionen för skoglig resurshushållning, 901 83 Umeå.
E-post: [email protected]
Improved harvesting technology for thinning of small diameter stands – Impact on forest management and national supply of forest biomass
Sammanfattning

To my family.
A work task will occupy the amount of time allotted to it.
- Freely after C. Northcote Parkinson
Dedication

List of publications 9
Abbreviations 11
1 Introduction 13
1.1 Forest biomass utilization in Sweden – the current situation 14
1.2 Forest biomass harvesting alternatives 15
1.3 Potential for utilization of forest biomass in Sweden 18
1.4 Objectives 21
2 Methods and material 23
2.1 Forest operations management and Forest work science 25
2.1.1 Paper I 27
2.1.2 Paper II 30
2.2 Forest planning and impact assessment 31
2.2.1 Papers III and IV 34
3 Results and paper-wise discussion 39
3.1 Paper I 39
3.2 Paper II 41
3.3 Paper III 43
3.4 Paper IV 46
4 Synthesis 55
4.1 Methodological aspects 55
4.2 Summarizing discussion of the results 58
4.3 Extended use of SweFor and its results 59
5 Conclusions 61
6 References 63
Popular science summary 71
Populärvetenskaplig sammanfattning 73
Acknowledgements 75
Contents


9
This thesis is based on the work contained in the following papers, referred to
by Roman numerals in the text:
I Sängstuvall, L.*, Bergström, D., Lämås, T. & Nordfjell, T. (2012).
Simulation of harvester productivity in selective and boom-corridor
thinning of young forests. Scandinavian Journal of Forest Research,
27(1), pp. 56-73.
II Sängstuvall, L.*, Lämås, T. & Nordfjell, T. (2014). Application of a
primarily deductive framework describing time consumption for hauling of
logs to road-side. Annals of Operations Research 219(1), pp. 477-489.
III Eriksson, L.O.* & Sängstuvall, L. Sensitivity of a Swedish forest sector
model to assumptions regarding forest owner behaviour and saw log
supply. Submitted manuscript.
IV Sängstuvall, L.*, Lämås, T., & Eriksson, L.O. Analyzing bioenergy from
young dense stands using a forest sector partial equilibrium model –
optimal forest management and Swedish wood market consequences.
Manuscript.
* Corresponding author.
Paper I is reproduced with the permission of the publisher.
Paper II is reproduced by permission from Springer Science+Business Media,
LLC 2012.
List of publications

10
I Planned the study together with the co-authors. Responsible for major
parts of the model development, simulations and analyses and significantly
contributed to the writing of the manuscript.
II Elaborated the initial idea and planned the study. Responsible for the
modelling, calculations and analyses, as well as writing major parts of the
manuscript.
III Planned the study together with the co-author. Responsible for major parts
of indata preparation, essential parts of the model structure, and minor
parts of the model implementation. Contributed to the analysis as well as
writing of the manuscript.
IV Planned the study in conjunction with the co-authors. Responsible for
major parts of indata preparation, and parts of the model implementation.
Conducted major parts of the analysis and significantly contributed to the
writing of the manuscript.
The contribution of Lars Sängstuvall to the papers included in this thesis was
as follows:

11
The following abbreviations are used throughout this thesis:
BT - biomass thinning
ContC2 - area-based, continuous felling, multi-tree handling felling
mode, working in two meter wide boom corridors
DF - deductive framework
DSS - decision support system
NFI - national forest inventory
NoBT - ordinary forest management with no BT
NPS - net present surplus
PCT - pre-commercial thinning
PEM - partial equilibrium model
TC - time consumption
TMC2 - tree-based multi-tree handling felling mode, working in two
meter wide boom corridors
Abbreviations

12

13
Sweden is a country rich in forests, which constitute a renewable resource that
has been important in the provision of goods and services to society and
individuals during the past, present and presumably future. Whereas the
demand for forest goods and services in the past often stemmed from its
superior usability and/or economic advantages, the present and future demand
also includes values like sustainability and climate mitigation. Forest biomass
used for e.g. energy can be seen as a contributor to climate change mitigation
because of its potential to replace fossil fuels and application in an expanding
range of products, with varying climate benefits for different products and
supply chains, as well as different perspectives applied in the assessment
(Berndes et al., 2016). Intensive forest management combined with subsequent
utilization of forest products as a substitute to other materials in construction,
packaging and as an energy feedstock has been proposed to be a more efficient
strategy for climate change mitigation than forest conservation and storing CO2
in the growing forest (Gustavsson et al., 2017). Furthermore, the applications
of forest biomass in new kinds of products continuously expands (Demirbas,
2009; BillerudKorsnäs, 2018; Domsjö Fabriker, 2018). The current Swedish
utilization of forest biomass in the form of roundwood – saw logs and
pulpwood – is near the sustainable maximum (Swedish Forest Agency, 2015),
and so increases in forest biomass utilization must come from other parts of the
tree. There are many methods for extracting forest biomass, including among
others the thinning of forest stands with the removal of thinned trees including
stems, tops, branches and needles or leaves, and utilizing trees of smaller
diameter than what is commonly used for pulpwood. This thesis explores some
possibilities for such forest biomass thinning (BT) in Sweden.
1 Introduction
14
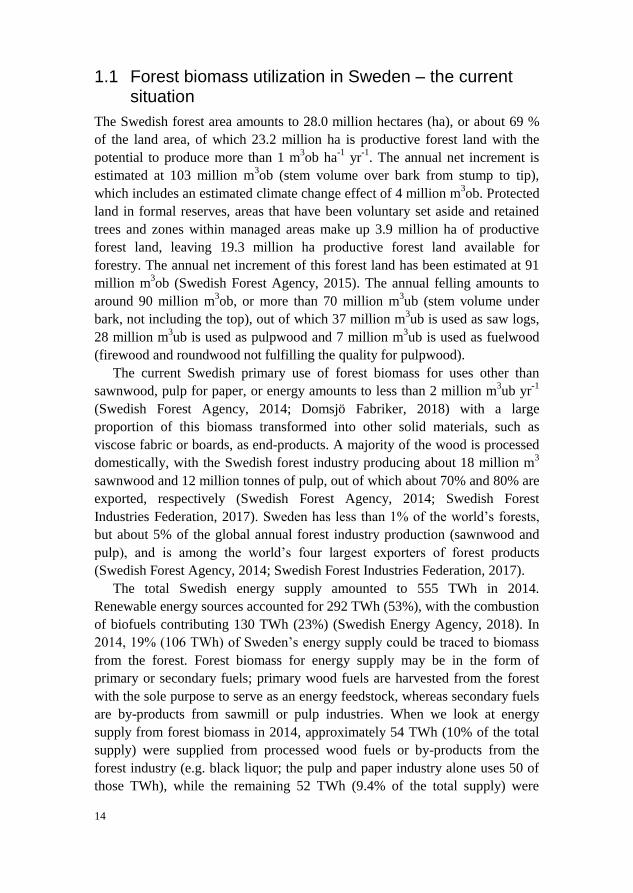
1.1 Forest biomass utilization in Sweden – the current situation
The Swedish forest area amounts to 28.0 million hectares (ha), or about 69 %
of the land area, of which 23.2 million ha is productive forest land with the
potential to produce more than 1 m3ob ha
-1 yr
-1. The annual net increment is
estimated at 103 million m3ob (stem volume over bark from stump to tip),
which includes an estimated climate change effect of 4 million m3ob. Protected
land in formal reserves, areas that have been voluntary set aside and retained
trees and zones within managed areas make up 3.9 million ha of productive
forest land, leaving 19.3 million ha productive forest land available for
forestry. The annual net increment of this forest land has been estimated at 91
million m3ob (Swedish Forest Agency, 2015). The annual felling amounts to
around 90 million m3ob, or more than 70 million m
3ub (stem volume under
bark, not including the top), out of which 37 million m3ub is used as saw logs,
28 million m3ub is used as pulpwood and 7 million m
3ub is used as fuelwood
(firewood and roundwood not fulfilling the quality for pulpwood).
The current Swedish primary use of forest biomass for uses other than
sawnwood, pulp for paper, or energy amounts to less than 2 million m3ub yr
-1
(Swedish Forest Agency, 2014; Domsjö Fabriker, 2018) with a large
proportion of this biomass transformed into other solid materials, such as
viscose fabric or boards, as end-products. A majority of the wood is processed
domestically, with the Swedish forest industry producing about 18 million m3
sawnwood and 12 million tonnes of pulp, out of which about 70% and 80% are
exported, respectively (Swedish Forest Agency, 2014; Swedish Forest
Industries Federation, 2017). Sweden has less than 1% of the world’s forests,
but about 5% of the global annual forest industry production (sawnwood and
pulp), and is among the world’s four largest exporters of forest products
(Swedish Forest Agency, 2014; Swedish Forest Industries Federation, 2017).
The total Swedish energy supply amounted to 555 TWh in 2014.
Renewable energy sources accounted for 292 TWh (53%), with the combustion
of biofuels contributing 130 TWh (23%) (Swedish Energy Agency, 2018). In
2014, 19% (106 TWh) of Sweden’s energy supply could be traced to biomass
from the forest. Forest biomass for energy supply may be in the form of
primary or secondary fuels; primary wood fuels are harvested from the forest
with the sole purpose to serve as an energy feedstock, whereas secondary fuels
are by-products from sawmill or pulp industries. When we look at energy
supply from forest biomass in 2014, approximately 54 TWh (10% of the total
supply) were supplied from processed wood fuels or by-products from the
forest industry (e.g. black liquor; the pulp and paper industry alone uses 50 of
those TWh), while the remaining 52 TWh (9.4% of the total supply) were

15
produced from unprocessed wood fuels. When the latter supply is studied in
more detail, 25 TWh comes from unprocessed by-products such as bark and
saw dust, and 27 TWh (4.9% of the total supply) – corresponding to 13.5% of
all utilized forest stem biomass – were produced from primary wood fuels,
with branches and tops contributing 10.5 TWh (1.9% of the total supply), tree
sections (from small-diameter trees as well as long tops) 1.5 TWh (0.28%) and
stumps 0.26 TWh (0.05%) (Swedish Energy Agency, 2015; Swedish Energy
Agency, 2018). The 106 TWh that was produced from forest biomass roughly
corresponds to 40-50 million m3ub of stemwood, or 60-70% of the entire
Swedish forest stemwood biomass utilization. This comparison does not
consider, e.g., the import of roundwood and/or wood fuels, but merely aims to
show how much forest biomass already contributes to the energy supply today.
The price at heat plant for wood chips from forest biomass has ranged from
100-140 SEK × MWh-1
over the years 2000 to 2006, then risen to 200-220
SEK × MWh-1
over the years 2010-2013, and is at present established at
around 180-200 SEK × MWh-1
(Swedish Energy Agency, 2017).
1.2 Forest biomass harvesting alternatives
Ghaffariyan et al. (2017) performed a comprehensive international review of
primary forest biomass supply systems, which revealed major variations in
forest biomass supply costs across assortments, technologies and countries.
The main source of primary forest biomass fuel in Sweden is logging residues
from final fellings (Swedish Energy Agency, 2015), and this source has been
fairly well utilized during past years. There is, of course, some regional and
periodical variation due to changes in total demand (Swedish Forest Agency,
2017), as well as competition from other, non-forest energy sources (Swedish
Energy Agency, 2015). Therefore, other sources must be better utilized if the
supply of primary forest biomass fuel is to increase (Routa et al., 2013).
Harvesting stumps in final fellings could contribute a significant amount of
primary forest biomass fuel in Sweden (Swedish Forest Agency, 2015b).
However, this approach is impeded by higher costs (Berg, 2014; Lundmark, et
al., 2015; Athanassiadis & Nordfjell, 2017), higher levels of contaminants than
other sources of forest biomass (Anerud, 2012) and a disputed ecological
impact (Swedish Forest Agency, 2009; Melin, 2014). Hence, the current stump
harvesting activity is in practice non-existing in Sweden.
Harvesting of small-diameter trees is another potential source of primary
woody biomass fuel. Productivity for harvesting stemwood from larger trees
with the cut-to-length method is well explored under Nordic conditions (e.g.
(Brunberg, 1997; Nurminen et al., 2006)), and described in generic

16
productivity functions. Stemwood of sufficient dimensions and tree species is
usually used in the pulp or sawmill industries, but with increasing interest from
the energy sector, stemwood may be more profitable to sell as fuelwood than
pulpwood (Swedish Energy Agency, 2017; Swedish Forest Agency, 2016).
When harvesting a tree for energy production purposes, an integrated
harvesting operation also makes it possible to utilize the tops, branches and
needles of the tree. This significantly increases the utilized volume from the
harvested trees, and most so in young dense stands in which trees are small of
diameter and a relatively large proportion of the stemwood biomass falls short
of the minimum diameter for pulpwood (di Fulvio et al., 2011). For example,
utilizing all aboveground biomass in 10.4 and 13.9 cm DBH stands increased
the biomass output with factors 3 and 1.5, respectively, compared to the output
of pulpwood from the same stands in a study by di Fulvio et al. (2011).
Major advances in BT systems and techniques and, notably, an expansion
of the scope where BT is economically viable in the short term, were witnessed
in the Nordic countries between the years 2005-2010 (Bergström et al., 2007;
Jylhä & Laitila, 2007; Laitila et al., 2007; Iwarsson Wide & Belbo, 2009;
Bergström et al., 2010a,b; Oikari et al., 2010; di Fulvio et al., 2011). Among
others, harvesting in a geometrical pattern – as exemplified in Figure 1 – with
either a conventional multiple-tree handling harvester head or an idea-based
BT harvester head with an area-based felling device was defined and
conceptually evaluated by Bergström et al. (2007). This initial evaluation
showed potential BT harvester productivity gains, which eventually led to the
development of a prototype harvester head with continuous accumulation of
small-diameter stems (Forsberg & Wennberg, 2011). This course of events
illustrates the early stages of a business innovation process quite well; Ideation,
Concept design, and Prototyping (Geissdoerfer et al., 2016). The drivers
behind such business innovation processes in forest operations may however
differ: Lindroos et al. (2017) described the (re-)emergence of the interest for
forest biomass as energy feedstock as an example of how new products can act
as a driver of advances in mechanized timber harvesting. They also mention
the opposite; when the cost for an established system increases and new
technology is needed to maintain competitiveness (also confer Samset’s Law of
discontinuous evolution (1966)). BT has elements of both those perspectives.
Returning to the business innovation perspective, the subsequent steps are
detailed design, implementation and adjustments & diversification
(Geissdoerfer et al., 2016), with iterations and backtracking across the stages a
natural part of the business innovation process. It is important to remember that
this is a resource intensive process, as the diverse tasks of each stage require
time and money. Thus, the product development process will be more efficient

17
if the duration of a step can be accelerated. In the case of the area-based felling
device, further prototyping was planned but has yet to be carried out. This is
partly due to a decrease in primary forest fuel demand, i.e. a market change –
which essentially is addressed in the implementation stage. The Swedish
energy market change has decreased the in utilization of primary forest
biomass from e.g. logging residues (Swedish Forest Agency, 2017), and a
materially reduced BT activity in Sweden. A parallel decrease in the further
research and development of forest biomass harvesting alternatives as energy
feedstock took place before BT – even with a common tree-based felling
device – had matured into an established forest management action. Thus, no
generic BT productivity estimates were elaborated following the
aforementioned early exploring studies. One of the closest calls were however
Laitila et al.’s (2007) study of forwarding of whole-trees, which covered a
great variation in stand and operations characteristics, but was limited in terms
of machine size – and also brand.
(a) (b)
Figure 1. Examples of (a) selective harvest and (b) geometrical harvest patterns in boom corridors
(cf. Bergström et al. 2007), in identical stands. The machine-center position is indicated by M, Xs
indicate trees that will be actually cut, and black shading indicates trees selected for cutting under
the selective system. The horizontal boxes indicate the strip road whereas the lines radiating from
the strip road represent imaginary boom-corridors.
Recent long-term field evaluations have indicated that geometrical/corridor
pre-commercial thinning (PCT, i.e. no commercial volumes are extracted
during the treatment, also known as cleaning) or thinning do not produce any
noticeable differences in volume growth or standing volume compared to
selective PCT or thinning (Karlsson et al., 2013). In contrast, a review by
Egnell (2017) found a short- and medium-term volume growth reduction
related to the removal of branches, tops and needles in addition to stemwood
removal during thinning. The decrease is of the magnitude of 5%, but varies
across tree species, site quality and latitude. These dynamics imply that long-
term evaluations should provide the most reliable final conclusions also with

18
regards to this nutrient aspect. Egnell’s review, along with others covering
biodiversity, soil and water quality, and heavy metal availability, served as the
basis for a workshop series focusing on sustainable biomass harvest levels in
Sweden (de Jong et al., 2017).
PCT redistributes the growth potential of a forest stand to fewer stems
(Pettersson, 1993). This allows the forest manager to influence the remaining
stand by selecting which trees to thin and which trees to leave. As a result, the
individual retained trees will have a higher diameter increment (Varmola &
Salminen, 2004), leading to higher wood prices and lower cutting costs per
volume unit (Nurminen et al., 2006). Even so, PCT is often neglected in
Swedish forestry (Swedish Forest Agency, 2018). This is probably because
PCT is costly from the short-term perspective, and because many forest owners
have other goals and strategies than the maximization of economic returns, as
shown by Eggers et al. (2014). Hence the Swedish forests hold large areas of
young forests where no PCT has been performed in due time according to
current forest management guidelines, and a reduction of number of stems
would favor e.g. the net present economic value (NPV) of the forestry
(Hyytiäinen et al., 2005; Fernandez-Lacruz et al., 2015): these forests currently
encompass 2.1 – 9.8 million ha of productive forest land (Fernandez-Lacruz et
al., 2015), depending on the criteria applied in the definition, and the
application of BT to these areas could provide a significant source of primary
forest biomass.
1.3 Potential for utilization of forest biomass in Sweden
The current Swedish national estimate of forest biomass potential (including
logging residues in final felling, stumps and biomass from thinning stands) is
part of the national forest impact analyses, named SKA 15 (verbatim Skogliga
KonsekvensAnalyser – Forest Consequence Analyses), and last performed in
2015 (Swedish Forest Agency, 2015b). However, SKA 15 only considered the
biologically feasible harvesting of roundwood (with bioenergy assortments
obtained as a by-product wherever ecologically suited), and not the
economically valid deposition of the harvested wood, or the existence of
competing sources or consumers of wood. Roundwood has been addressed in
SKA 15 by indirectly assuming that future demand will equal future supply,
along with an appended consequence analysis that bases future supply on the
current demand structure (Swedish Forest Agency, 2015a). However, this
approach would be inappropriate for fractions that currently have a low market
share, such as BT volumes.
19
In addition to SKA 15, several other Swedish regional and national level
studies on forest biomass potential have been conducted, most of which have
been reviewed by Wetterlund et al. (2013). A number of these studies include
biomass from thinnings in the form of harvesting residues that are separated
from harvested roundwood (Lundmark et al., 2015; Swedish Forest Agency,
2015). Only a handful of forest biomass potential studies include BT as an
integrated operation (Nordfjell et al., 2008; Fernandez-Lacruz et al., 2015) and
a majority apply a simple statistical analysis approach (cf. (Dees &
Rettenmaier, 2009)). A selection of such studies is presented and categorized in
Table 1. For the Swedish studies, the short-term potential ranges from about 2
TWh × yr-1
, when considering market aspects, to a span of about 10 to 25
(mean 17) TWh × yr-1
, market aspects aside.
Allocating the entire sustainable growth of stemwood, branches, tops and
stumps in Sweden to energy generation would correspond to about 300 TWh
(Swedish Forest Agency, 2015b), or more than 50% of Sweden’s annual
energy supply. However, a number of issues limit such a radical utilization.
Techno-economical limitations such as production rates and transportation
costs are typically addressed using rules-of-thumb or through limited system
analyses, cf. Fernandez-Lacruz et al. (2015). The competing internal demand
for forest biomass as feedstock for industry products like sawnwood and
pulp, which offer a higher price than energy producers, is most often handled
with assumptions of static and fixed roundwood demand levels, with the left-
overs available as an energy feedstock (Swedish Forest Agency, 2015b).The
external competition with other, non-forest renewable energy sources is
sensitive not only to market forces but also policy decisions on the super-
national, national and/or sub-national levels. Finally, if all previous issues do
not constrain biomass harvesting at a particular site, ecological constraints to
the harvesting of tops, branches and stumps that are related to negative effects
on soil nutrient status and/or biological diversity, are largely regulated via a
common practice for where and when tops, branches and stumps may be
harvested in connection to ordinary stemwood harvest (Swedish Forest
Agency, 2008). However, certain researchers have suggested that the current
recommendations may need updating (de Jong, et al., 2017). These issues are
explicated and addressed to various extents within this thesis.
20
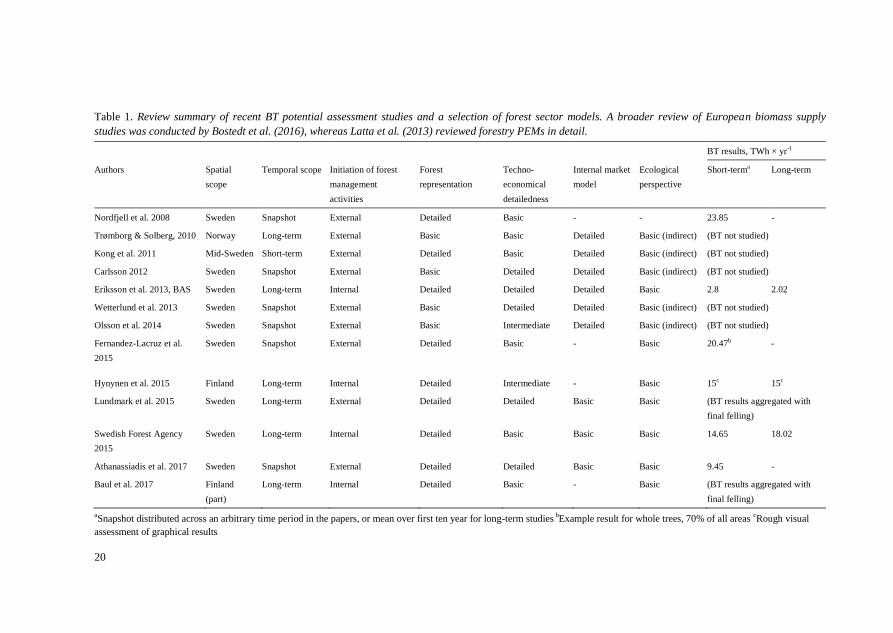
Table 1. Review summary of recent BT potential assessment studies and a selection of forest sector models. A broader review of European biomass supply
studies was conducted by Bostedt et al. (2016), whereas Latta et al. (2013) reviewed forestry PEMs in detail.
BT results, TWh × yr-1
Authors Spatial
scope
Temporal scope Initiation of forest
management
activities
Forest
representation
Techno-
economical
detailedness
Internal market
model
Ecological
perspective
Short-terma Long-term
Nordfjell et al. 2008 Sweden Snapshot External Detailed Basic - - 23.85 -
Trømborg & Solberg, 2010 Norway Long-term External Basic Basic Detailed Basic (indirect) (BT not studied)
Kong et al. 2011 Mid-Sweden Short-term External Detailed Basic Detailed Basic (indirect) (BT not studied)
Carlsson 2012 Sweden Snapshot External Basic Detailed Detailed Basic (indirect) (BT not studied)
Eriksson et al. 2013, BAS Sweden Long-term Internal Detailed Detailed Detailed Basic 2.8 2.02
Wetterlund et al. 2013 Sweden Snapshot External Basic Detailed Detailed Basic (indirect) (BT not studied)
Olsson et al. 2014 Sweden Snapshot External Basic Intermediate Detailed Basic (indirect) (BT not studied)
Fernandez-Lacruz et al.
2015
Sweden Snapshot External Detailed Basic - Basic 20.47b -
Hynynen et al. 2015 Finland Long-term Internal Detailed Intermediate - Basic 15c 15c
Lundmark et al. 2015 Sweden Long-term External Detailed Detailed Basic Basic (BT results aggregated with
final felling)
Swedish Forest Agency
2015
Sweden Long-term Internal Detailed Basic Basic Basic 14.65 18.02
Athanassiadis et al. 2017 Sweden Snapshot External Detailed Detailed Basic Basic 9.45 -
Baul et al. 2017 Finland
(part)
Long-term Internal Detailed Basic - Basic (BT results aggregated with
final felling)
aSnapshot distributed across an arbitrary time period in the papers, or mean over first ten year for long-term studies
bExample result for whole trees, 70% of all areas
cRough visual
assessment of graphical results

21
It is expected that forest biomass will be increasingly used in the production of
both new solid materials and liquid fuels; cellulose-based materials may
replace non-renewable materials in e.g. packaging solutions (BillerudKorsnäs,
2018) and refined biofuels from forest biomass may replace petroleum-based
fuels (Demirbas, 2009). By 2030, the total energy use of domestic and foreign
transportations is predicted to reach 109 TWh yr-1
and the Swedish demand for
forest biomass energy purposes is expected to increase by about 30 TWh yr-1
until the year 2030 (Swedish Energy Agency, 2014; Börjesson, et al., 2017).
This increase can be explained by liquid biofuels and feedstocks required by
the chemical and petrochemical industries, i.e. the scope of the presented
energy demand somewhat overlaps the demand for other products.
To sum up, several aspects imply a possible significant role for BT in
Swedish forestry. However, a universal synthesis of these aspects is missing,
along with crucial elements such as generally applicable BT productivity and
cost models.
1.4 Objectives
The overall objective of this thesis is to analyse the impact of new harvesting
technology for forest biomass recovered in thinning of young dense forest
stands (biomass thinning – BT) with regards to recovery costs, forest
management and national forest biomass supply.
The scopes and focus areas of the different papers I-IV are visualized in
Figure 2.The specific objectives relating to papers I-IV are:
I) i) to study how different harvesting techniques, stand factors and
thinning methods affect time consumption (TC) for both present
and future BT harvesting systems, and ii) to obtain productivity
functions for such systems that can be used in cost calculations
and scenario analyses.
II) to assess the utility of the presented deductive framework (DF)
approach for modelling TC in forwarding, with a focus on new
combinations of machines and environments and calculating the
cost of forest operations.
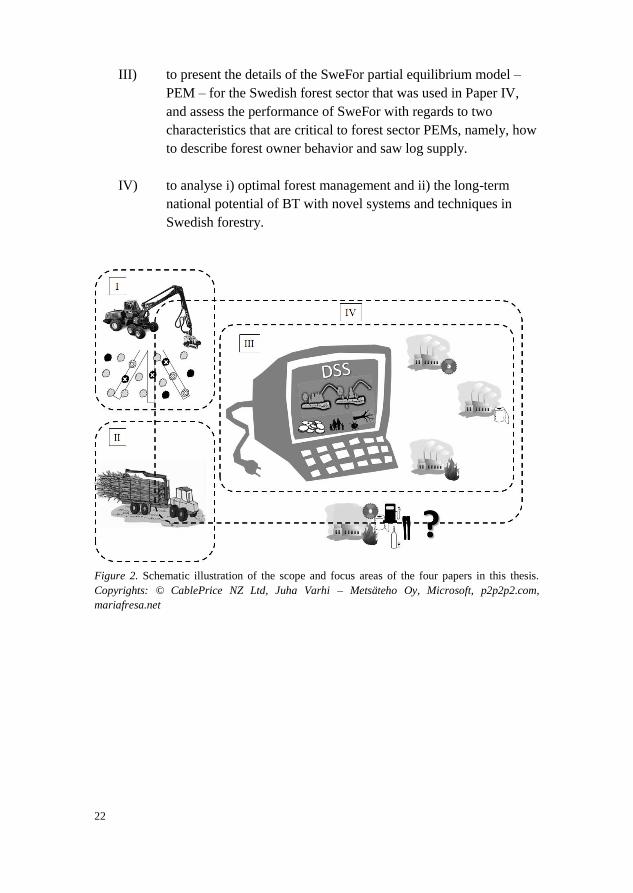
22
III) to present the details of the SweFor partial equilibrium model –
PEM – for the Swedish forest sector that was used in Paper IV,
and assess the performance of SweFor with regards to two
characteristics that are critical to forest sector PEMs, namely, how
to describe forest owner behavior and saw log supply.
IV) to analyse i) optimal forest management and ii) the long-term
national potential of BT with novel systems and techniques in
Swedish forestry.
Figure 2. Schematic illustration of the scope and focus areas of the four papers in this thesis.
Copyrights: © CablePrice NZ Ltd, Juha Varhi – Metsäteho Oy, Microsoft, p2p2p2.com,
mariafresa.net
23
Many of the scenarios analysed in the research underlying this thesis are
hypothetical in the sense that they include non-existing phenomena, such as the
productivity and market impact of new and hypothetical BT machine systems
and techniques. These phenomena would typically be analysed via empirical
observations or empirically-based projection models. However, when such
approaches are unavailable, the evaluation of novel technologies must instead
rely on non-empirical, yet well-founded and reliable methods. All of the papers
included in this thesis share the ambition to develop such robust methods that
will provide reliable assessments of how the implementation of BT will affect
the Swedish forest biomass supply. A tentative overview of methods relevant
in the context of this thesis is given in Figure 3.
2 Methods and material
24
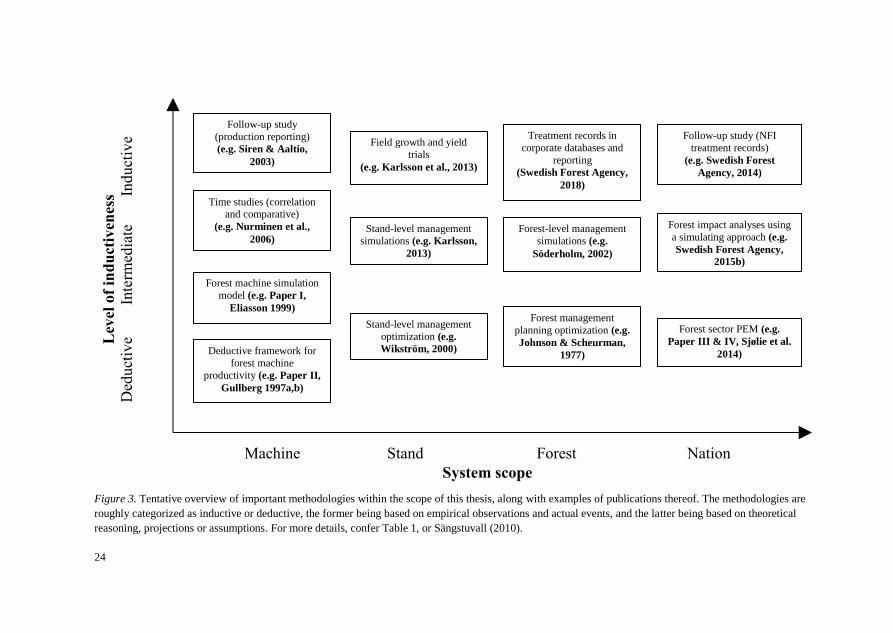
Figure 3. Tentative overview of important methodologies within the scope of this thesis, along with examples of publications thereof. The methodologies are
roughly categorized as inductive or deductive, the former being based on empirical observations and actual events, and the latter being based on theoretical
reasoning, projections or assumptions. For more details, confer Table 1, or Sängstuvall (2010).
Machine Stand Forest Nation
System scope
Follow-up study
(production reporting)
(e.g. Siren & Aaltio,
2003)
Time studies (correlation and comparative)
(e.g. Nurminen et al.,
2006)
Deductive framework for
forest machine
productivity (e.g. Paper II,
Gullberg 1997a,b)
Forest machine simulation
model (e.g. Paper I,
Eliasson 1999) Forest management
planning optimization (e.g.
Johnson & Scheurman,
1977)
Forest impact analyses using
a simulating approach (e.g.
Swedish Forest Agency,
2015b)
Forest sector PEM (e.g.
Paper III & IV, Sjølie et al.
2014)
Follow-up study (NFI
treatment records)
(e.g. Swedish Forest
Agency, 2014)
Field growth and yield
trials
(e.g. Karlsson et al., 2013)
Stand-level management
simulations (e.g. Karlsson,
2013)
Stand-level management
optimization (e.g.
Wikström, 2000)
Treatment records in
corporate databases and
reporting
(Swedish Forest Agency,
2018)
Forest-level management
simulations (e.g.
Söderholm, 2002)
Lev
el o
f in
du
ctiv
enes
s D
educt
ive
I
nte
rmed
iate
I
nduct
ive

25
2.1 Forest operations management and Forest work science
Forest operations management concerns the performance of forest operations
and involves, among others, the quantification of economic performance of
forest operations devices. Heinimann (2007) defined forest operations
management as follows: “It consists of analysis, design, control, and
continuous improvement of business processes, such as procurement order
fulfilment, distribution, monitoring, and control within firms and business to
business (B2B) networks. It measures and analyses internal processes with
emphasis on effectiveness, efficiency, and quality by using quantitative models
to map and solve related problems of scheduling, inventory, shipment routing,
or facility location.”. The increased importance of the sustainability and
climate mitigation benefits of forest biomass (Berndes et al., 2016) has been a
key driver in the emergence of the concept of Sustainable Forest Operations
(SFO), which is defined by Marchi et al. (2018).
The sub-discipline of forest work science concentrates on the productivity
and cost of forest operations. The scientific methods used in this field may be
categorized as either inductive or deductive. Inductive methods are based on
empirical observations of a system (e.g. a forest machine), which are then
analysed using statistical methods with the aim to predict the behaviour of the
studied system. This application of inductive methods in forest work science is
often referred to as forest work studies, and is well described by Sundberg &
Silversides (1988) and Samset (1990). In contrast, a deductive approach
provides predictions for the behaviour of a system based on theories, laws and
models (Ford, 2000).To illustrate the difference between inductive and
deductive reasoning in forest engineering, an inductive approach would entail
measuring the TC of various work elements, e.g. the TC to cut and process a
tree, and after which differences in TC are correlated to independent variables
describing the forest and machine environments. Conversely, a deductive
approach would use theoretical methods to analyse the work elements and
identify the independent variables that affect the TC for specific work
elements; these data could then be used to estimate the productivity of the
entire system. For example, estimates of the cutting and processing speed of a
certain machine could be used to compute how much time will be required to
cut and process a tree of a given size. Inductive methods are more common
since they are fairly straight-forward and will, if properly implemented, return
reliable average productivity or cost estimates. However, inductive methods
are limited in the sense that they require a functioning system as subject for the
26
study, whereas deductive methods can be used to analyse e.g. forest machine
systems that have not yet – or may never be – built in practice.
Forest work science often focuses on productivity, which is defined as the
ratio of the input and output of a system. The input is typically calculated in
terms of the working time (either of employees or machines), and the output is
most often defined in terms of a produced quantity. Since TC per work element
or work cycle is the most common measure of input, such studies are
commonly referred to as time studies. There are two different kinds of time
studies: comparative and correlation (Samset, 1990; Eliasson, 1998; Lindroos,
2010). In comparative studies, environmental factors are kept constant to
facilitate comparisons between different working techniques, systems and
methods. This type of time study is usually performed quite early in the life-
cycle of a technique, system or method e.g. (Bergström, et al., 2010a).
Correlation studies, on the other hand, evaluate how various factors influence a
specific method, system or technique e.g. (Nurminen, et al., 2006; Laitila, et
al., 2007). This type of time study is often performed during the later stages of
the life-cycle, e.g. to provide a basis for a fair and general piece-rate-based
salary system. A literature review of productivity estimations in cut-to-length
forest operations was performed early during the course of doctoral studies to
serve as a starting point for modelling BT productivity under varying
conditions (Sängstuvall, 2010). Research on the productivity of harvesters and
forwarders (a total of 14 and 8 studies, respectively) were categorized in terms
of inductive/deductive research, comparative/correlation study and the
independent variables that were used to explain variations in productivity. The
estimated productivities of different systems were also compared under various
conditions. Largely, most studies were inductive time studies: Roundwood
harvesting operations were investigated through correlation studies whereas
comparative studies were used to assess biofuel harvesting operations, and
between-study variation in the estimated productivities could be observed.
One study on forwarder productivity stands out as deductive; Gullberg’s
deductive framework (DF) for TC for off-road extraction of shortwood
(Gullberg, 1997a; Gullberg, 1997b). Gullberg attempted to describe the TC of
a forwarder by using independent variables and deductive parameters: after a
thorough review of previous studies, he identified and defined four main work
elements and described them in terms of independent variables and
coefficients. Gullberg validated his model for the loading work element against
an inductive model (1997a), with the graphical presentations of the results
showing good correspondence. He emphasized that rather than being the
absolute truth, his model was intended to act as a framework or starting point
for further deductive or inductive research.
27
As for harvester productivity, one simulation study (Eliasson, 1999) was
included in the review by Sängstuvall (2010), but several others have been
scrutinized during the writing of Paper I (Newnham, 1966; Santesson &
Sjunnesson, 1972; AedoOrtiz, et al., 1997; Eliasson, 1999; Talbot, et al., 2003;
Wang, et al., 2005; Ringdahl, et al., 2012). Simulation models of forest
machines represent an intermediate between the inductive and deductive
approaches. Their structures and inputs are designed using a combination of
deductive and inductive reasoning, and their outputs are often interpreted as
empirical observations and used as an alternative to time study results.
In the following sections, brief descriptions are given of the methods and
materials used in Papers I and II. For more detailed descriptions of settings and
assumptions, the reader is referred to those papers.
2.1.1 Paper I
Paper I employed a simulation approach to study how different harvesting
techniques, stand factors and thinning methods on affect the TC of both current
and future BT systems, as well as to obtain productivity functions that describe
such systems. The simulations were performed using field data (Bredberg,
1972; Gustavsson, 1974) on individual tree characteristics and tree positions.
The datasets comprised 47 first thinning type stands with an original size of 25
× 40 m2 and nine pre-commercial thinning type stands with an original size of
25 × 20 m2.
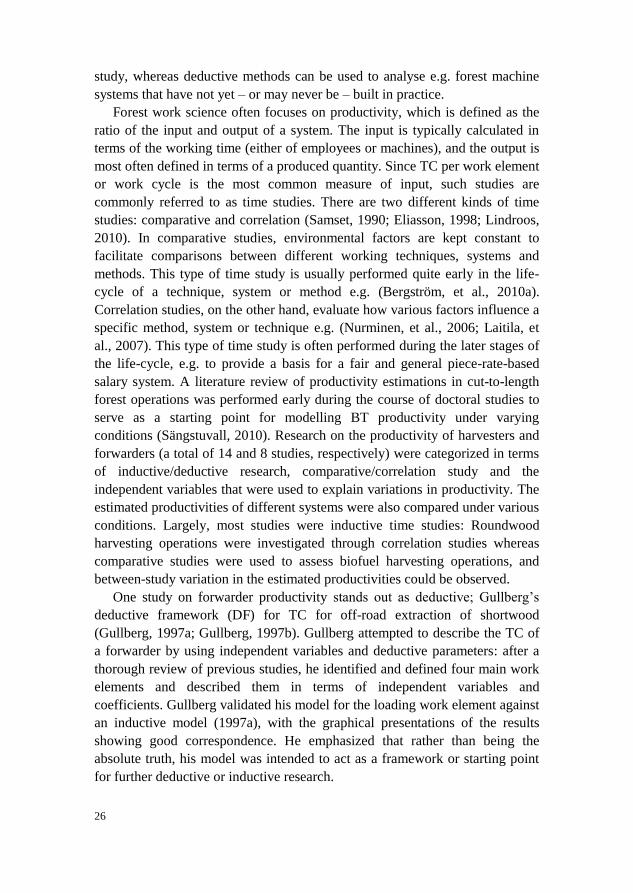
Figure 4. Characteristics of the 56 type stands used in Paper I, which were located at sites
throughout Sweden and had not been subjected to a first commercial thinning. The diameter of
the trees was measured at breast height, 1.3 m above ground, and o.b. refers to over bark. Xs
indicate individual observations, Os indicate mean values and the distances along the lines that
intersect the mean values indicate standard deviations. Note: the lower end of the interval for
number of stems per hectare is outside the graph.

28
Computer programming and simulations were performed using MATLAB
R2009b software (The MathWorks, Inc., Natick, MA, USA), and Minitab 15
(Minitab, Inc., PA, USA) was used for statistical analysis of the results.
The simulation model was based on the harvester simulation model
developed by Eliasson (1999), with extended functionalities derived from other
published simulation models e.g. (Santesson & Sjunnesson, 1972; Wang et al.,
2005), felling operations in environments similar to those considered in the
presented research e.g. (Bergström et al., 2007; Iwarsson Wide & Belbo, 2009)
and harvester and forwarder working patterns e.g. (Gullberg, 1997b;
Ovaskainen et al., 2004; Ovaskainen et al., 2006; Ovaskainen, 2008).
Functions describing new machine systems that include boom-tip mounted,
area-based felling devices and new working techniques were also
implemented.
A total of 6 048 simulations were run on the 56 type stands, with six
variations in thinning intensity and thinning ratio, and nine combinations of
harvesting techniques and systems (Table 2). Every combination of stand,
thinning and machinery was simulated twice with randomized machine starting
positions. The type stands are graphically described in Figure 4, and the
simulation model is briefly described in Figure 5.
Table 2. Simulated thinning scenarios (felling mode and applied harvest pattern between strip
roads) and the acronyms used hereafter. RW and FF refer to roundwood and forest biomass
(denoted FF, for forest fuel, in Paper I), respectively. Corridor widths are provided for the
geometrical harvest patterns. Abbreviations for thinning scenarios without parentheses are used
in this thesis, whereas thinning scenario abbreviations within parentheses were used in the
published version of Paper I.
Thinning scenario
Thinning pattern (between strip roads) and harvested
assortment
Felling mode Selective Geometrical (corridor width)
RW FF FF (1 m) FF (2 m)
Tree-based single-tree handling TSRWSel
Tree-based multi-tree handling TMRWSel TMFFSel TMC1
(TMFFCorr1)
TMC2
(TMFFCorr2)
Area-based, felling 2m2 at a time,
multi-tree handling
2m2C1 2m
2C2
Area-based, continuous felling,
multi-tree handling
ContC1
(CFFCorr1)
ContC2
(CFFCorr2)

29
Figure 5. Flowchart for the simulation model in Paper I, that is based on work by Eliasson (1999),
but including additional functionalities (marked by *). TC means time consumption.
The total TC per tree for harvester work was calculated using Eq. (1)
𝑇𝑇𝑜𝑡 = 𝑇𝐵𝑜𝑜𝑚𝑂𝑢𝑡𝐼𝑛 + 𝑇𝐵𝑜𝑜𝑚𝐼𝑛𝑡 + 𝑇𝐹𝑒𝑙𝑙 + 𝑇𝐿𝑖𝑚𝑏𝐶𝑢𝑡 + 𝑇𝑀𝑜𝑣𝑒 (1.)
where TotT is total TC, and the other terms denote TC per work element;
BoomOutInT is the TC for boom movements towards the first tree to be cut in a
work cycle along with movements towards the processing spot after the last
tree in a work cycle has been cut or towards the default harvester head is
positioned in front of the machine, BoomIntT is TC for boom movements
between trees to be cut in the same work cycle, FellT is the TC for felling trees,
LimbCutT is the TC for processing (i.e. delimbing and cross-cutting) trees and
MoveT is the TC for moving between machine positions. TC values were
calculated at either the tree, work cycle or stand level, whichever was
appropriate for the work element and thinning scenario (Table 2). TC per
calculation unit was then distributed equally among all trees handled in the
calculation unit under consideration.

30
Generic TC functions for the different thinning scenarios (cf. Table 2) were
constructed using the simulated TC measures and independent stand and
treatment variables as inputs in a regression analysis.
2.1.2 Paper II
In this paper, Gullberg’s (1997b) deductive framework (DF) was implemented
for two machine configurations that represented small- and medium-sized
thinning forwarders with maximum load carrying capacities of 8.5 and 11
tonnes respectively. These machines were then simulated over a set of
environments ,...,X,XXX nm X21 with a total of 16 different
combinations of the independent variables included in the DF (forwarding
distance, mean loading pile size, amount of piles along strip road, and
unloading grapple volume). The simpler version of Gullberg’s TC model for
loading was used, i.e. only single-assortment loads were considered and it was
assumed that all driving was done on strip roads. In the case of the small
forwarder, the operation examined involved the hauling of whole trees for
energy feedstock following mechanized felling during thinning (Laitila et al.,
2007). For the medium-sized forwarder, the operation of interest was the
hauling of pulpwood during thinning (Nurminen, et al., 2006). The two
publications that described these tasks were analysed carefully to obtain
accurate descriptions of relevant machine and environmental parameters, such
as the grapple area or the mean pile size during the loading phase. Parts of the
DF were adjusted in advance to match the conditions of the field studies.
Estimated productivities nGGG ,...,ô,ôô
21 for each machine were calculated
using the DF, and the corresponding productivities n,...,ô,ôô 21 were
calculated using the work productivity functions presented by Nurminen et al.
(2006) and Laitila et al. (2007).
The coefficients AG of the DF were then altered in a bid to improve the
accuracy of the DF in terms of conformity with the original work productivity
functions. The adaptation was done by minimizing the squared sums (over the
16 combinations of independent variables, per forwarder type) of the
differences between the productivity estimates and the observed productivity.
This was performed separately for each machine by adjusting the default
values in AG, resulting in a new set of coefficients AG' and the corresponding
productivity estimates '''21 nGGG ,...,ô,ôô . No single coefficient in the adapted
DF set (AG') was allowed to deviate from its original value by more than 50%.
All data management and calculations were performed with Microsoft Excel
2007 (Microsoft, 2007) using the Solver add-in.
31
2.2 Forest planning and impact assessment
Forest planning encompasses a decision making process in which e.g. the
timing and type of forest management activities are chosen to fulfil the
decision maker’s goals (cf. Bettinger et al. 2009), and the end of the planning
process are decisions to be taken by a decision maker. Furthermore, a plan can
be defined as a system of decisions (Mintzberg, 2000). Thus, whereas
operations management could be interpreted to focus on processes and their
interlinkage, planning is more concerned with decisions and their
interrelatedness. Forest owners’ goals often involve economic criteria or
measures; hence, accurate forest operations cost models are crucial in such
forest management planning.
Forest impact assessment on the other hand involves elements similar to
forest planning, such as projecting future forest conditions given different
assumptions of e.g. forest management, but rather than being a plan the
assessment informs about the consequences of one or several potential
scenarios (cf. SKA 15 (Swedish Forest Agency, 2015b)), and is typically a
component within policy processes. Forest impact assessment is typically
performed on regional (sub-national) or national level. It has similar
components as a planning process, such as definition and formulation of the
problem, data collection, and generation and evaluation of alternatives.
Both papers III and IV reviewed and employed forest planning and impact
assessment methods. This section briefly summarizes these two methodologies.
Forest planning and impact assessment provides forest owners and
stakeholders with the tools necessary to quantify and describe different values
associated with forests and forestry, as well as to direct forest management in
ways that maximizes the extent to which the forest owner’s objectives are
fulfilled. Forest utilization problems (my addendum in italics) can be
categorized according to six dimensions: temporal scale; spatial context; spatial
scale; number of decision makers; number of objectives and types of goods and
services provided, as described by the FORSYS Cost Action (Borges, et al.,
2014). For example, the spatial scale of typical forest planning problems can
range from stand, or even tree, level, to the regional, national and global levels,
while the temporal scale ranges from months to hundreds of years.
A specific scale should be used with the appropriate context and/or forest
utilization problem, for example, a stand-level analysis of optimal forest
management under certain conditions will only return the optimal way to
manage that particular stand. However, a forest management unit (e.g. the
forests owned by a non-industrial private forest owner or a municipality)
usually consists of different stands with different characteristics. The forest
management unit typically has a certain set of preconditions that are related to

32
forest characteristics and owner preferences, e.g., even harvest levels over
time. Such super-stand criteria imply that the optimal stand-level forest
management approach can not always be applied on the forest (management
unit) level. On the regional/national level, variations among forest owners and
stakeholders in their specific preferences and goals make it challenging to
assess potential long-term sustainable forest growth and yield on the national
level. A total of 432 combinations of categories to describe forest utilization
problems exist across the six dimensions (Borges et al., 2014).
Decision support systems (DSS) are one alternative for solving or analysing
various forest utilization problems. DSS are defined as “computer based
systems that represent and process knowledge in ways that allow the user to
take decisions that are more productive, agile, innovative and reputable” by
Holsapple (2008), and “tools providing support to solve ill-structured decision
problems by integrating a user interface, simulation tools, expert rules,
stakeholder preferences, database management and optimization algorithms”
by Muys et al. (2010). An example of a forestry DSS is the Heureka system
(Wikström, et al., 2011), which compiles current Swedish knowledge and
practices in forest growth and yield, biological processes related to forests, and
forest operations, along with information from other disciplines. The Heureka
DSS is relatively fixed towards the long- (and to some extent medium-) term
end of the temporal scale, but allows for analyses across the other dimensions
described by Borges et al. (2014). For example the spatial scale of forest
utilization problems is already integrated into the Heureka system design, as
the StandWise application addresses the stand level, while PlanWise and
RegWise address the forest/estate and regional/national levels, respectively.
Heureka is the DSS employed in the SKA 15 analyses (Swedish Forest
Agency, 2015), which include a number of cutting scenarios for the entire
Swedish forestry sector, modelled over 100 years using the Heureka RegWise
application (Wikström, et al., 2011). Approximately 30,000 inventory plots,
measured during the five-year period between 2008 and 2012 as part of the
Swedish National Forest Inventory (NFI), were used to predict growth and
yield at the plot level. Treatments were assigned to each plot using priority
functions based on either per cent volume growth or probability functions
describing historical landowner behaviour.
Consider the overall objective of this PhD-project the forest utilization
problem at hand: “to analyse the impact of new harvesting technology BT, with
regards to recovery costs, forest management and national forest biomass
supply”. This mere formulation leaves vast degrees of freedom on how to
categorize the forest utilization problem along the six dimensions, and then
select the materials and methods to solve it. Turning to the literature, a number
33
of different approaches across the dimensions have been made (see also Table
1): Starting on stand level along the spatial scale, a number of studies have
explored the profitability of BT-like treatments in arbitratry forest stands
potentially suited for BT. In terms of the evaluation of net economic returns,
many studies at hand fall on the forest operations side of the distinction
between scientific disciplines, since they are based on a time study case, which
is extended with economic measures and analyses, e.g. (Iwarsson Wide &
Belbo, 2010). Alternatively, a couple of studies analysed BT in economic
terms as part of the stand management over a rotation period (Heikkilä et al.,
2009; Karlsson, 2013; Karttunen et al., 2016). However, these studies only use
simulating approaches to solve the forest utilization problem, and thus, provide
answers to the question “What if we manage these particular stands with this
particular BT management program under these specific conditions?”. No
studies that aim to optimize management objectives including BT at the stand
level were identified in the literature review work underlying this thesis (cf.
Table 1, Sängstuvall (2010)).
The intermediate level along the spatial scale – forest level – is often
characterized by stand-level subunits in which the forest management takes
place. Nevertheless, all of the stands (or subunits) are subjected to forest level
conditions. At this level, it is common that the market prices are fixed, i.e. the
way the forest is managed affects neither the input factor nor timber prices.
Thus, this spatial resolution disregards regional and national phenomena such
as market conditions. In this way, models on the forest level rarely consider
competing supply from other forests or industrial sectors, or that demand for
forest goods and services can change over time, in the form of e.g.: spatial
allocation of industries; willingness to pay and price elasticity. The largest
forest management companies in Sweden (and on the global scene) commonly
use this approach because their assets are usually valuated on the basis of
forest-level harvest prognoses and wood price assumptions. No studies on BT
that were limited to the forest level were identified during the literature review
underlying this thesis (cf. Table 1, Sängstuvall (2010)).
On the regional/national scale, the market aspect cannot be disregarded if
the results of the forest utilization problem solving are to be useful. Another
aspect – the diversity of forest owners within Sweden and across different
regions – separates the forest level from the regional/national level in the
Swedish context. Different forest owners manage their forests in different
ways, either in accordance or conflict with their own forest management goals
and objectives (Eggers, et al., 2014). In SKA 15, this is handled through an
empirically based, owner-type specific random element within the priority
functions mentioned above.
34
There are several tools that specifically address the ecological and techno-
economical restrictions that are relevant to analyzing the role of forest biomass
in the Swedish energy supply (section 1.3). As was the case in using a
deductive approach to investigate forest operations, the internal and external
market dynamics for forest products may also present unknown conditions –
such as new market forces, policies and/or regulations – in the system
environment. An inductive approach in this context usually entails either a)
assuming constant supply and/or demand based on current knowledge, or b)
disregarding demand criterias, i.e. assuming infinite demand. On the other
hand, a deductive approach will handle these issues by gathering existing
knowledge of market behaviour under different conditions, and transferring it
into the analysis of the system at hand. In such a case, a sector model – which
describes the supply and demand for different actors in the forest and/or energy
sector – presents a powerful tool. According to Solberg (1986), a forest sector
model is “a model (numerical or strictly analytical) which takes into account
both forestry and forest industries and the interaction between these two
activities”. A partial equilibrium model (PEM) is a kind of sector model. It is
partial in the sense that relative prices from other sectors are given
exogenously, and an equilibrium model in the sense that supplied and
demanded quantities match, which implies that the sum of the consumer and
producer surpluses is maximized. PEMs have been applied to various forest
contexts around the world for several decades. Selected PEMs relevant to the
scope of this thesis have been reviewed during the work of this project and are
summarized in Table 1, along with other studies focusing on the potential of
BT.
2.2.1 Papers III and IV
A Swedish sector model, SweFor, was developed in AIMMS modelling
software (AIMMS, 2016) and originally used to explore the supply of wood
fuel to the Swedish district heating industry under different market and
technological assumptions (Eriksson et al., 2013). SweFor connects the
management of Swedish forests with the demands of three branches: the
sawmill industry; the pulp and paper industries; and the energy sector
(represented by district heating plants). The model uses parts of the NFI plot
data used in SKA 15 and the Heureka DSS to make growth and yield
projections of the plots under different forest management scenarios. A
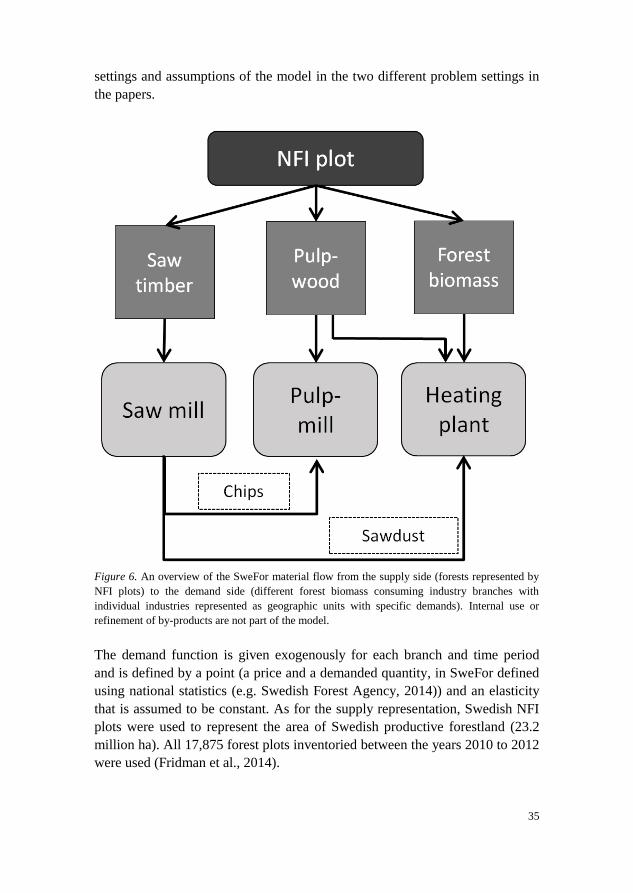
tentative overview of the SweFor model is given in Figure 6, and the
geographic dimensions of the supply and demand sides are shown in Figure 7.
Papers III and IV provide more detailed formulations as well as the specific
35
settings and assumptions of the model in the two different problem settings in
the papers.
Figure 6. An overview of the SweFor material flow from the supply side (forests represented by
NFI plots) to the demand side (different forest biomass consuming industry branches with
individual industries represented as geographic units with specific demands). Internal use or
refinement of by-products are not part of the model.
The demand function is given exogenously for each branch and time period
and is defined by a point (a price and a demanded quantity, in SweFor defined
using national statistics (e.g. Swedish Forest Agency, 2014)) and an elasticity
that is assumed to be constant. As for the supply representation, Swedish NFI
plots were used to represent the area of Swedish productive forestland (23.2
million ha). All 17,875 forest plots inventoried between the years 2010 to 2012
were used (Fridman et al., 2014).
36
The Heureka PlanWise application was used to generate growth and yield
projections – excluding estimated climate effects on annual increment – for
different management alternatives for all of the NFI plots and three alternative
management regimes that correspond to three different BT technology
scenarios:
ordinary management with no BT (NoBT)
management with the possibility to harvest forest biomass in 2 m wide
geometrical boom corridors either with an accumulating multi-tree
handling harvester head (Tree Multi Corridor, 2 m wide, TMC2)
management that employs a fictional, idea-based continuously felling
harvester head also operating in 2 m wide boom corridors (Continuous
Corridor, 2 m wide, ContC2).
Harvester productivity functions for the TMC2 and ContC2 scenarios from
Paper I and forwarder productivity functions obtained with a methodology
similar to that in Paper II were included in the Heureka DSS so that BT could
be integrated in the Heureka simulations and analyses. The simulations resulted
in 0.5-1 million alternative management programs for the set of plots, which
were then exported to SweFor along with the corresponding cost and yield
information.
In SweFor, management programs and the subsequent transportation of the
harvested wood assortments to different industries are assigned to each NFI
plot in a way that maximizes the model objective. The target function in
SweFor aims to maximize the sum of the net present (discounted) social
surplus (NPS) across periods. The net surplus of a period can be obtained by
calculating the area under the demand functions of the associated branches, for
the supplied volumes, and subtracting the forest management costs (stand
establishment and harvesting costs), transportation costs from harvest sites to
the processing facility, and, in the case of forest biomass, the cost of
comminution.
In Paper III, variations were made in the post-Heureka AIMMS stage to
evaluate model characteristics related to forest owner behaviour and saw log
supply. Different proxies for non-industrial private land owners’ behaviour
were evaluated, more specifically, amenity values given to old forests
(Amenity), random forest management program selection (Random) and strict
age-control rules in final felling (AgeCtrl). Furthermore, the impact of different
saw log supply models was assessed. In the Free alternative, the merchantable
volume could be freely distributed among sawmills, pulp mills, and heating
plants, whereas in the Dia alternative, the merchantable volume was attributed
a relative value based on the mean stand diameter at the time of harvest. In the

37
Theo alternative, theoretical bucking into saw logs and pulpwood, exogenously
provided by the Heureka simulations, is followed when distributing the
merchantable volume on sawmills and pulp mills.
In Paper IV, SweFor was employed and adapted to the forest utilization
problem at hand in this thesis, whose final formulation include both BT effects
and short- and long term aspects, namely, forest management and forest
impact, along with how the potential supply of forest biomass from BT is
affected by competition with other forest biomass sources.
The NoBT management program was used in Paper III, whereas the NoBT,
TMC2 and ContC2 management programs were used in Paper IV.
Figure 7. Inventory tract layout in the Swedish NFI in the years 2010–2012 (tracts are clusters of
plots), and industry locations representing the wood-consuming industry branches in Sweden in
the SweFor model.

38

39
3.1 Paper I
The research presented in Paper I demonstrated that BT, when exercised in a
geometrical harvest pattern leads to increases in productivity, and more so
using an area-based felling device. The productivity increases were of greatest
magnitude in the stands with the smallest mean stem volumes (Figure 8).
Direct comparisons among thinning scenarios are primarily valid within the
same assortment (roundwood or forest fuel, cf. Table 2). In stands with mean
stems volumes of up to 0.02 m3ob, the machine systems and techniques that
were further investigated in Paper IV, ContC2 and TMC2, showed
productivities (expressed as tonnes dry matter (DM) per productive work hour
(PWH)) that were 282% and 80% higher, respectively, than what was found
for selective harvesting operations that involved multiple tree handling
(TMFFSel). When the mean stem volumes were between 0.06 and 0.08 m3ob,
the productivity gains for ContC2 and TMC2 decreased to 44% and 10%,
respectively, relative to TMFFSel. Parts of the observed increase in productivity
when using a geometrical harvest pattern could be explained by the reduced
selectivity in such treatments, leading to changes in the composition of
harvested trees – i.e. the thinning ratio and thinning intensity could be altered.
The positive effect of multiple-tree handling versus single-tree handling in a
selective harvest pattern could be determined at 39% and 26% for the
roundwood thinning scenarios at the same mean stem volumes.
3 Results and paper-wise discussion

40
(a)
(b)
Figure 8. Mean productivity values, expressed as (a) trees harvested per productive work hour
(PWH) and (b) tonnes dry matter (DM) of the given assortment harvested per PWH, obtained
from the simulations for various classes of stand mean stem volume (in m3 over bark (o.b.))
indicated on the x-axis. Different lines indicate values for different thinning scenarios, as
explained in the legend (cf. Table II). The forest biomass assortment in the simulations illustrated
in (b) comprises entire stems and 50% of other above-ground biomass. The simulations included
all 56 studied type stands, with 9, 6, 9 14, 9, and 9 stands included in the mean stem volume
classes from left to right, respectively.
3

41
The TC functions obtained with regression analysis were implemented in the
Heureka DSS, to enable integrated analyses of BT in long-term forest planning.
The functions contain a high number of independent variables. This facilitates
– and requires – detailed analyses in e.g. the Heureka DSS, which include data
for all selected independent variables. Other applications of the functions
obtained in Paper I have been problematic, since some of the independent
variables rarely are included in an ordinary forest management plan or stand
inventory.
The simulation model was continuously verified during programming (by
comparing model results to manual calculations), and the obtained results were
validated by comparing them to three other datasets: another implementation of
the simulation model (Eliasson, 1999); the most commonly used empirically
based thinning productivity estimates in Sweden (Brunberg, 1997); and
observed productivity in comparative time studies of similar BT operations
(Bergström, et al., 2010a). In many cases, the simulation model used in Paper I
somewhat underestimated TC, but that should be the case in a simulation (cf.
Eliasson 1999). For example, the simulation model considered stem form
expressed as tapering, but not the occurrence of difficult branches, forks and
crooks, which, in practice, affects the potential of multiple-tree harvesting
(Laitila et al., 2016).
3.2 Paper II
Both the original and the adapted DF yielded results that agreed well with what
was produced by inductive time study functions adapted to the same
environments (set of independent variables, n = 16 in this case). The difference
between predictions of total TC per m3 from the unadapted DF functions (AG)
and the time study functions (Â) for the tested environments were 6.1 % and
6.9 % relative root mean square error (RMSE) for the small and medium-sized
forwarders, respectively.
The adapted DF (A´G) yielded somewhat lower differences when the results
were compared to the performance of time study functions (Â): differences,
measured in relative RMSE, amounted to 4.1 % and 5.5 % for the small- and
medium-sized forwarders, respectively. Two examples of productivity
estimates obtained using the three sets of coefficients are given in Figure 9.
42
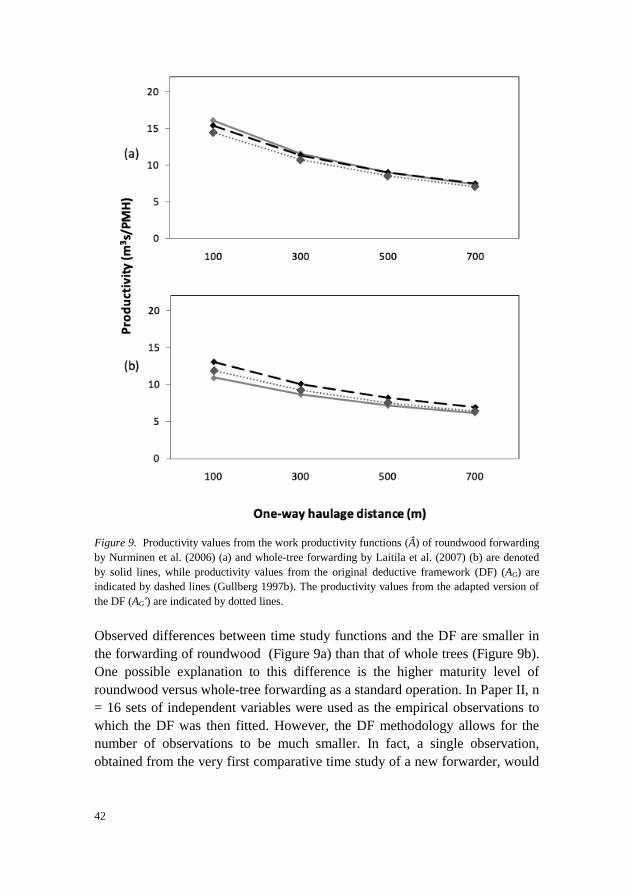
Figure 9. Productivity values from the work productivity functions (Â) of roundwood forwarding
by Nurminen et al. (2006) (a) and whole-tree forwarding by Laitila et al. (2007) (b) are denoted
by solid lines, while productivity values from the original deductive framework (DF) (AG) are
indicated by dashed lines (Gullberg 1997b). The productivity values from the adapted version of
the DF (AG') are indicated by dotted lines.
Observed differences between time study functions and the DF are smaller in
the forwarding of roundwood (Figure 9a) than that of whole trees (Figure 9b).
One possible explanation to this difference is the higher maturity level of
roundwood versus whole-tree forwarding as a standard operation. In Paper II, n
= 16 sets of independent variables were used as the empirical observations to
which the DF was then fitted. However, the DF methodology allows for the
number of observations to be much smaller. In fact, a single observation,
obtained from the very first comparative time study of a new forwarder, would
43
add valuable information to the DF, while the robustness of the DF would
prevent the productivity model from returning totally unrealistic estimates.
The DF employed in Paper II could be useful for improving predictions of
hauling TC with a forwarder in several contexts. This, in turn, would lead to
more accurate estimates of work amount and costs in forestry. Arguably, one
could also combine the advantages of both the inductive and deductive
approaches by using deductive reasoning to identify suitable independent
variables for incorporation into work productivity functions based on time
study results (Samset, 1990; Laitila et al., 2007).
Paper II provided a robust model that could be used to reliably predict the
productivities, and as a result, the cost, of forest operations. More specifically,
the DF was adapted to a set of comparative time study observations (n = 37
loads, performed by Skogforsk (e.g. Iwarsson Wide & Belbo 2009; 2010). The
resulting DF was then implemented in the Heureka DSS as a productivity
function for BT forwarding (Sängstuvall, 2018).
3.3 Paper III
In Paper III, the SweFor model is presented in detail, and two assumptions that
influence the results presented in Paper IV are examined. One assumption refer
to how a model could better reflect forest owner behaviour, or more
specifically, how to capture the fact that old forests are not harvested to the
extent that economic rationality would suggest. The desired effect is that
forests older than 80 years should be less intensively harvested than what the
maximization of NPV would suggest. Different proxies for non-industrial
private forest owners’ behaviour resulted in slightly different forest
characteristics over time. The clearest difference between the approaches was
observed for how forests older than 120 years were handled (Figure 10).
Applying an amenity value of moderate size seems to give almost the same
effect as conserving the area by a strict constraint. Saw log prices over time
does not seem directly correlated with the amount of old forests, which could
be said to represent the theoretical potential supply of saw logs. Various parts
of this theoretical potential supply were however unavailable for harvest due to
the hard constraints in behavioural assumptions Random and AgeCtrl.
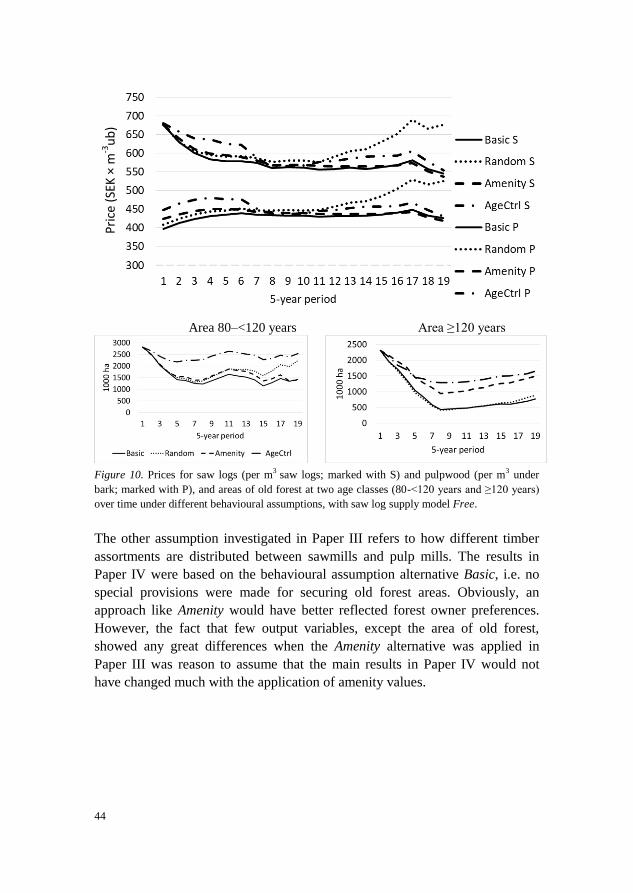
44
Area 80–<120 years Area ≥120 years
Figure 10. Prices for saw logs (per m
3 saw logs; marked with S) and pulpwood (per m
3 under
bark; marked with P), and areas of old forest at two age classes (80-<120 years and ≥120 years)
over time under different behavioural assumptions, with saw log supply model Free.
The other assumption investigated in Paper III refers to how different timber
assortments are distributed between sawmills and pulp mills. The results in
Paper IV were based on the behavioural assumption alternative Basic, i.e. no
special provisions were made for securing old forest areas. Obviously, an
approach like Amenity would have better reflected forest owner preferences.
However, the fact that few output variables, except the area of old forest,
showed any great differences when the Amenity alternative was applied in
Paper III was reason to assume that the main results in Paper IV would not
have changed much with the application of amenity values.
Pri
ce (
SEK
× m
-3u
b)
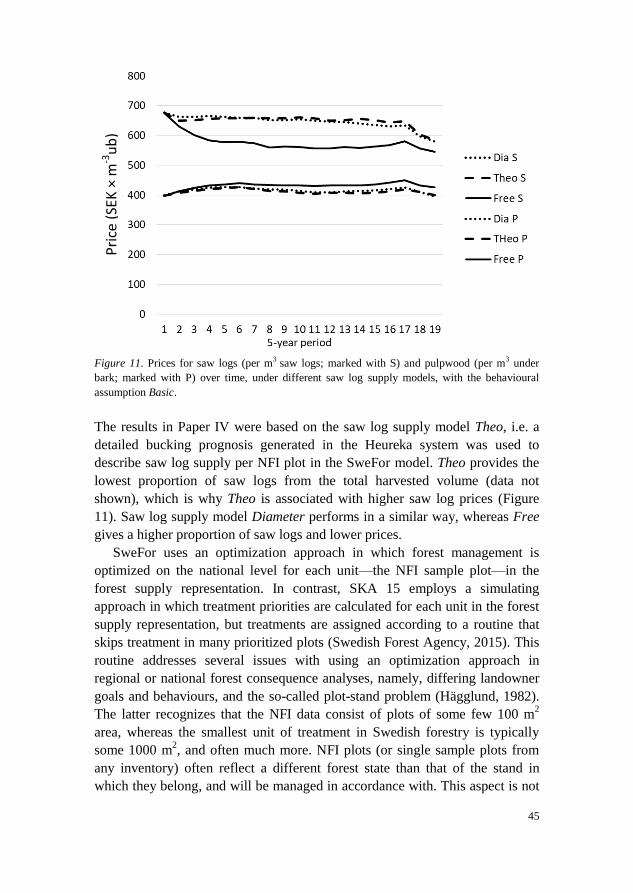
45
Figure 11. Prices for saw logs (per m
3 saw logs; marked with S) and pulpwood (per m
3 under
bark; marked with P) over time, under different saw log supply models, with the behavioural
assumption Basic.
The results in Paper IV were based on the saw log supply model Theo, i.e. a
detailed bucking prognosis generated in the Heureka system was used to
describe saw log supply per NFI plot in the SweFor model. Theo provides the
lowest proportion of saw logs from the total harvested volume (data not
shown), which is why Theo is associated with higher saw log prices (Figure
11). Saw log supply model Diameter performs in a similar way, whereas Free
gives a higher proportion of saw logs and lower prices.
SweFor uses an optimization approach in which forest management is
optimized on the national level for each unit—the NFI sample plot—in the
forest supply representation. In contrast, SKA 15 employs a simulating
approach in which treatment priorities are calculated for each unit in the forest
supply representation, but treatments are assigned according to a routine that
skips treatment in many prioritized plots (Swedish Forest Agency, 2015). This
routine addresses several issues with using an optimization approach in
regional or national forest consequence analyses, namely, differing landowner
goals and behaviours, and the so-called plot-stand problem (Hägglund, 1982).
The latter recognizes that the NFI data consist of plots of some few 100 m2
area, whereas the smallest unit of treatment in Swedish forestry is typically
some 1000 m2, and often much more. NFI plots (or single sample plots from
any inventory) often reflect a different forest state than that of the stand in
which they belong, and will be managed in accordance with. This aspect is not
Pri
ce (
SEK
× m
-3u
b)

46
fully addressed in Papers III and IV, and those results must be treated with that
in mind. On the other hand, plots in SKA 15 for which a highly prioritized final
felling is skipped in one period may be felled in the next period instead – this
dynamic is comparable to the Random scenario. This leads to a depletion of
older production forests over time (Swedish Forest Agency, 2015), whereas the
other approaches evaluated in Paper III ensure a higher proportion of older
forests over time.
3.4 Paper IV
The research showed that BT had little effect on NPS, and only to a limited
extent contributed to the fulfilment of heat plant demands (Table 3, Figure 12).
Table 3. Effects of biomass thinning (BT) on net present surplus (NPS), forest management
regimes and heat plant supply for the Swedish forestry and forest sector.
Scenario
Variable Unit NoBT TMC2 ContC2 TMC2∞ ContC2∞
NPS at 3% interest
rate
SEK 109 287.13 288.70 288.97 296.34 297.52
Forest area managed
in BT regime
1000 ha 0 2,707 3,064 12,996 13,499
%* 0 13.8 15.6 66.2 68.7
Heat plant supply
from BT over 100
years
TWh 0 573.2 650.5 2,694 2,806
%** 0 15.2 17.2 31.9 32.8
BT proportion of all
harvested forest
biomass (including
roundwood)
% 0 3.0 3.3 12.2 12.8
* Proportion of forest land available for production
** Proportion of the total supplied amount of energy to heat plants over 100 years
However, the contribution of BT varied between heat plants depending on the
distance to competing heat plants, other industries and the available supply
(Figure 16). If heat plant demand was considered infinite in terms of industrial
capacity – as in scenarios TMC2∞ and ContC2∞ – then NPS increased
considerably; this was dependent on BT as well as the increased removal of
logging residues in final felling and increased use of pulpwood as an energy
feedstock. Under these scenarios, BT became the dominant forest management
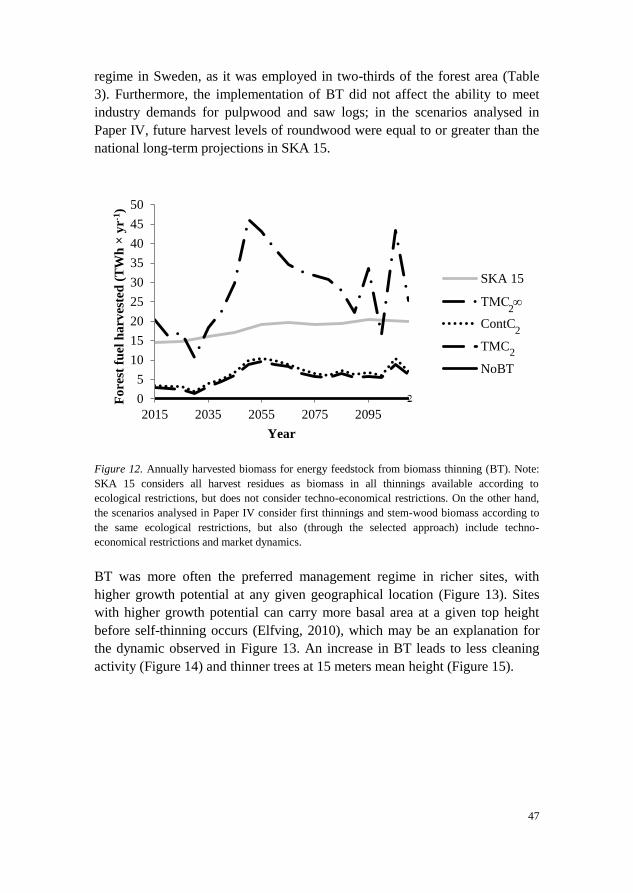
47
regime in Sweden, as it was employed in two-thirds of the forest area (Table
3). Furthermore, the implementation of BT did not affect the ability to meet
industry demands for pulpwood and saw logs; in the scenarios analysed in
Paper IV, future harvest levels of roundwood were equal to or greater than the
national long-term projections in SKA 15.
Figure 12. Annually harvested biomass for energy feedstock from biomass thinning (BT). Note:
SKA 15 considers all harvest residues as biomass in all thinnings available according to
ecological restrictions, but does not consider techno-economical restrictions. On the other hand,
the scenarios analysed in Paper IV consider first thinnings and stem-wood biomass according to
the same ecological restrictions, but also (through the selected approach) include techno-
economical restrictions and market dynamics.
BT was more often the preferred management regime in richer sites, with
higher growth potential at any given geographical location (Figure 13). Sites
with higher growth potential can carry more basal area at a given top height
before self-thinning occurs (Elfving, 2010), which may be an explanation for
the dynamic observed in Figure 13. An increase in BT leads to less cleaning
activity (Figure 14) and thinner trees at 15 meters mean height (Figure 15).
0
5
10
15
20
25
30
35
40
45
50
2015 2035 2055 2075 2095
Fo
rest
fu
el h
arv
este
d (
TW
h ×
yr
-1)
Year
SKA 15
TMC ∞
ContC
TMC
NoBT
2
2
2
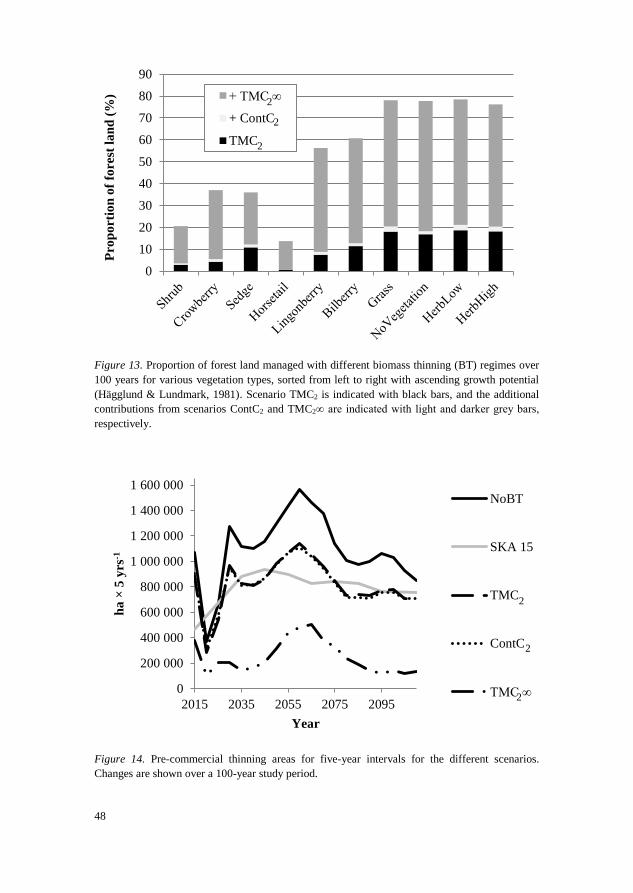
48
Figure 13. Proportion of forest land managed with different biomass thinning (BT) regimes over
100 years for various vegetation types, sorted from left to right with ascending growth potential
(Hägglund & Lundmark, 1981). Scenario TMC2 is indicated with black bars, and the additional
contributions from scenarios ContC2 and TMC2∞ are indicated with light and darker grey bars,
respectively.
Figure 14. Pre-commercial thinning areas for five-year intervals for the different scenarios.
Changes are shown over a 100-year study period.
0
10
20
30
40
50
60
70
80
90
Pro
po
rtio
n o
f fo
rest
la
nd
(%
) + TMC ∞
+ ContC
TMC
2
2
2
0
200 000
400 000
600 000
800 000
1 000 000
1 200 000
1 400 000
1 600 000
2015 2035 2055 2075 2095
ha
× 5
yrs
-1
Year
NoBT
SKA 15
TMC
ContC
TMC ∞
2
2
2
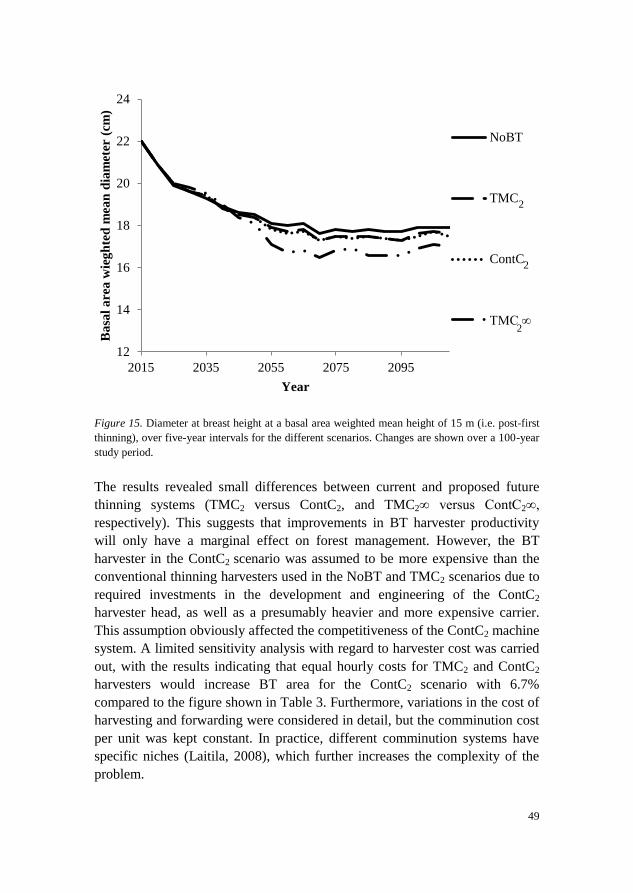
49
Figure 15. Diameter at breast height at a basal area weighted mean height of 15 m (i.e. post-first
thinning), over five-year intervals for the different scenarios. Changes are shown over a 100-year
study period.
The results revealed small differences between current and proposed future
thinning systems (TMC2 versus ContC2, and TMC2∞ versus ContC2∞,
respectively). This suggests that improvements in BT harvester productivity
will only have a marginal effect on forest management. However, the BT
harvester in the ContC2 scenario was assumed to be more expensive than the
conventional thinning harvesters used in the NoBT and TMC2 scenarios due to
required investments in the development and engineering of the ContC2
harvester head, as well as a presumably heavier and more expensive carrier.
This assumption obviously affected the competitiveness of the ContC2 machine
system. A limited sensitivity analysis with regard to harvester cost was carried
out, with the results indicating that equal hourly costs for TMC2 and ContC2
harvesters would increase BT area for the ContC2 scenario with 6.7%
compared to the figure shown in Table 3. Furthermore, variations in the cost of
harvesting and forwarding were considered in detail, but the comminution cost
per unit was kept constant. In practice, different comminution systems have
specific niches (Laitila, 2008), which further increases the complexity of the
problem.
12
14
16
18
20
22
24
2015 2035 2055 2075 2095
Ba
sal
are
a w
ieg
hte
d m
ean
dia
met
er (
cm)
Year
NoBT
TMC
ContC
TMC ∞
2
2
2
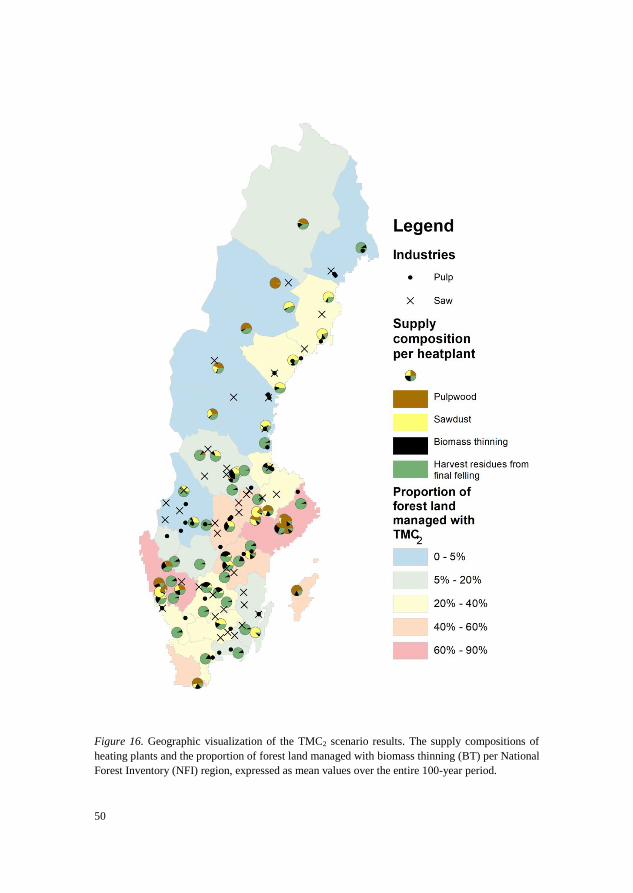
50
Figure 16. Geographic visualization of the TMC2 scenario results. The supply compositions of
heating plants and the proportion of forest land managed with biomass thinning (BT) per National
Forest Inventory (NFI) region, expressed as mean values over the entire 100-year period.

51
In the analyses, the TMC2 and ContC2 systems were applied to first thinnings
up to a mean height of 15 m, which corresponds to the tree size scope reported
in Paper I. In the TMC2 scenario, BT was most commonly applied to a mean
tree height of around 12–14 m mean tree height and a mean stem volume of
0.06 m3ob, both of which are similar to the values for the first thinning when
harvesting roundwood (Anon., 2017). The results showed that BT stands out as
an alternative to ordinary thinning rather than as a hybrid between cleaning and
thinning. However, the performance and durability of a ContC2 machine for
this set of tree sizes should be investigated further, as ContC2 treatments were
applied to tree sizes that were similar to those handled by the TMC2 system
(data not shown). The additional costs associated with development and/or the
heavier carrier machine may well be higher than the assumed 100 SEK h-1
E15
(productive machine time including stops up to 15 minutes, measured in hours)
compared to an ordinary thinning harvester with an accumulating, multiple-tree
handling harvester head.
In NFI regions with low population density or low demand for pulpwood,
BT activity was very low since pulpwood would be available for the limited
local demand for energy. Correspondingly, densely populated areas with a high
demand for biomass for energy showed a higher proportion of forest land
managed with BT. Near the large urban areas of Stockholm and Gothenburg,
BT was heavily utilized as an energy feedstock, as was pulpwood (Figure 16).
Our results are expected in the sense that the availability and competitiveness
of alternative biomass sources can be assumed to have a large effect on the
demand for biomass from BT.
In comparison to SKA 15, the results in Paper IV revealed lower levels of
bioenergy harvesting from Swedish forests. SKA 15 considered technical and
biological restrictions to bioenergy harvesting, but not the market conditions.
Hence, according to SKA 15, the available amount of bioenergy would be
larger than what is finally utilized. The PCT activities in Paper IV were of the
same magnitude as what was presented in SKA 15 (Figure 14), which could be
attributed to a fairly low proportion of forest land that is managed with a BT
regime (Table 3), with the exception of the TMC2∞ scenario, in which cleaning
was clearly less preferred over time.
When compared with the results of Olsson & Lundmark (2014), the results
in Paper IV indicate higher recovery of logging residues in final fellings, and in
addition, an active supply of bioenergy from young dense forest stands (Figure
11). The difference in biomass utilization might stem from the selected
modelling approaches. The detailed forest supply and industry demand
descriptions in Paper IV—including geographical aspects—often limit the

52
supply of by-products which can be readily used in a particular heat plant — in
favour of nearby logging residues or bioenergy from BT.
The baseline scenarios showed that BT has limited implications for current
forest policy and practice. Nevertheless, the impact and importance of BT
could grow with an increase in demand (Table 3). Theoretically, BT could
sustainably provide 5% or more of Sweden’s total energy demand if market
conditions were altered (e.g. through higher capacities or governmental
subsidies).
Differences in the amount of material that BT can supply heat plants with
(Table 3) between TMC2 and TMC2∞, and between ContC2 and ContC2∞,
respectively, suggest that BT can supply industries that consume biomass (heat
plant, biorefineries or other consumers) with feedstock if these industries
would increase their demand for biomass. When these results are compared
with what has been previously reported, e.g., Nordfjell et al. (2008) and
Fernandez-Lacruz et al. (2015), the magnitude of the difference demonstrates
that simpler approaches are poor at estimating the potential of BT. If such a
overoptimistic potential estimate is used for decisions on investment in
machinery and/or the development of new machine equipment—such as a
ContC2 harvester head—there is a risk that such investments will be
unprofitable because the actual demand for forest biomass from BT is rather
low.
The SweFor framework gives indirect indications for where industrial
capacities could be altered (Figure 16). The development and introduction of
an investment model that adjusts capacity based on profitability would be an
important task in the future development of SweFor. Further research and
development efforts could also be directed at using SweFor to analyse other
forest management or silvicultural aspects, further develop the detail at which
the industrial sectors are described in SweFor, e.g. considering multiple
assortments per industry, integrating terminals and multiple transport solutions
in the transportation model, or including saw mill and pulp mill bark
production and use.
Growth reduction related to removal of nutrients in tops, branches and
needles in thinnings was addressed in Paper IV using the standard Heureka
settings, i.e. 5% reduced growth for the next 15 years following BT. This is in
line with the conclusions by Egnell (2017) in his review on the subject – but
wide variations in the reviewed results stresses the need for long-term studies
Furthermore, Paper IV assumed that a proportion of the branches and needles
would remain in the forest following extraction of the biomass assortment. A
limited Finnish field experiment has suggested that the occurrence of wind and
snow damage is positively correlated with the quota tree height / tree diameter

53
at breast (Zubizarreta-Gerendiain et al., 2012). This quota increases over time,
and most so for the BT intensive scenarios (cf. Figure 15). Forsell (2009)
showed that adapting forest management to high wind damage risks leads to
increases, however small, in net present value compared to business-as-usual
forest management. Conversely, managing the forest in a more wind-sensitive
way could potentially reduce NPV, yet the magnitude of this effect is
unknown. Since neither adaptations of management nor adjustment for major
storm occurrences were implemented it is possible that the models discussed in
this thesis overestimate BT supply and advantages. Chudy et al. (2016) propose
a structured method to incorporate risk in a broader sense – including
stochastic events as well as data quality – in forest sector modelling by using
an iterative sensitivity analysis based on known probabilities for risks and data
errors. As for the ecological aspect, de Jong et al. (2017) concluded that BT
impacts forest production at all harvest levels, but it was not explicitly
mentioned to have negative effects, e.g. acidification or the release of toxins.

54
55
4.1 Methodological aspects
Papers I and II applied forest work science methods to obtain generic
productivity functions for BT harvesters and forwarders. The research
presented in both papers selected methods which ensured that no real, palpable
forest machine was necessary for the analyses; as such, they may be entirely
based on hypothetical forest machine systems with assumed associated
properties. Considering the proposed future felling modes studied in Paper I
(e.g. 2m2C2, ContC2 (Table 2)), the only alternative to the described approach
would have been the construction of a physical piece of machinery to perform
a time study with. This would have required substantial investments in product
development and operator training if the study were to provide a fair and
reliable comparison to existing felling modes. For this reason, an initial
analysis of non-existing phenomena in the early stages of forest machinery
innovation is a resource-efficient way to provide information on the benefits
that may be provided by new systems, and prevent the unnecessary
development costs for forest machine systems that in the end would have
turned out to be less successful. Development resources may then instead be
directed to other, more promising forest machine systems. One could therefore
argue that a simulation model such as the one used in Paper I is the obvious
method of choice in such cases. As for Paper II however, the forest machine
under study was a forwarder used in, and perhaps adapted to, the forwarding of
tree sections or whole trees in BT. Such forwarders exist in practice, and have
been studied using inductive forest work science methods (Laitila, et al., 2007;
Iwarsson Wide & Belbo, 2009; Iwarsson Wide & Belbo, 2010). Clearly, to
fulfil the objectives of Paper II, other approaches, both a simulation model as
well as an inductive approach – e.g. a correlation time study – could have been
4 Synthesis
56
used instead. However, great variations in the productivity reported in previous
time studies were observed, and it was decided that current BT forwarding
practices are too heterogeneous to be generically described with reasonable
means. On the other hand, the combination of a DF and the available
comparative time study observations facilitated cost-effective, fairly accurate
yet still empirically influenced BT forwarding productivity estimations. An
empirical correlation-type validation of the productivity functions estimated
using the methodology in Paper II should be performed in the future.
As for Papers III and IV, an alternative approach would have been
addressing forest management issues – relevant on the stand or forest level –
and national potential supply in two different studies applying entirely different
methodologies. Such an approach would have given insight that was only valid
for those spatial scales that the separate studies investigated. In other words,
the forest level results would have lacked the market dimension, and the
national results would not provide information as to in which stands or when
BT should be applied. Moreover, the national study would not have taken into
account recursive forest management dynamics. The selected approach was
chosen precisely for this reason; it provides robust results on both levels, as the
detailed forest representation and internal initiation of forest management
activities (cf. Table 1) integrate forest management dynamics into the national
supply problem. Turning to market-forest interactions, as shown in Figure 15,
increased BT activity led to smaller mean diameter at a mean height of 15 m.
Such a change in forest management practices will also influence the
proportion of saw logs, and is captured using either Theo or Diameter saw log
supply models, described in Paper III.
Since a detailed forest representation – including variations in management
activities – was required to solve the investigated forest utilization problem, a
mechanism for determining forest management activities was essential.
Modelling forestry activities based on historical land owner behaviour, as is the
case in SKA 15, is only valid for current management practices – and thus
current market dynamics. Landowner behaviour associated with the harvesting
of bioenergy from logging residues in final felling is described by Roos &
Bohlin (2002), but was not implemented in SKA 15. Currently, BT is rarely
applied in Swedish forestry and thus both scientifically founded management
guidelines involving BT as well as the necessary empirical data are missing. In
this way, BT analyses using the SKA 15 framework would require unfounded
assumptions of market dynamics; that is, an arbitrary share of the theoretically
available biomass from BT would have to be assumed as utilized. With such an
approach, results concerning the impact of various forest management regimes
(Figures 13 – 15) would directly reflect the assumptions of utilization rather

57
than a projection of what BT utilization degree and forest management impacts
to expect. The lack of market models in SKA 15 also makes it difficult to
assess how new approaches for satisfying, for example, bioenergy demand will
affect national forest management trends, i.e. new practices will affect growth,
costs and revenues, which, in turn, affects supply, which in turn affect markets
that feed back on forest management. In contrast, an optimization approach
allows analytical variations of forest management activities that may be outside
of the empirically known boundaries, but requires detailed and accurate
formulations of the goals and constraints for the results to be adequate as
support for decision-making or policy assessments.
The overarching aim of Paper IV deemed PEM the method of choice since
this approach offers vast degrees of freedom regarding which aspects or issues
of a forest utilization problem should be considered on the regional or national
scale. However, the inclusion of multiple detailed aspects makes the model and
its results more sensitive to errors in any of the underlying assumptions. For
precisely this reason, one of the key deliverables of Paper III was investigating
the validity of the model and identifying some potential errors – including land
owner behaviour associated with the timing of final felling – in the PEM
eventually employed in Paper IV.
When the research presented in this thesis is compared with similar
Swedish studies, the method used in this thesis boasts the highest resolution
across the different properties identified in Table 1. Nevertheless, ecological
constraints were only addressed to a small extent, and external market
dynamics (by definition) were kept constant. It is possible to modify SweFor to
include additional ecological aspects, and extend the “partial” limit for which
market dynamics are internal, but such changes represent a trade-off not only
with model accuracy and sensitivity to errors, but also resolution in the
currently addressed issues; e.g. all of the other reviewed PEMs (Table 1)
except for NorFor (Sjølie et al., 2011, Sjølie et al., 2014) are rougher on the
forest representation end. The observed difference between the TMC2 and
TMC2∞ scenarios provides the best proof of the contribution of the PEM
approach in relation to simpler market models or market assumptions: when
competing supply from other forest fuels in fulfilling the current district
heating demand is included in the model, projected BT activity decreases to
20% of what is expected when competition between forest fuels is not
considered.
58
4.2 Summarizing discussion of the results
A harvester performing BT was found to be more productive than a harvester
that extracts only roundwood assortments. This is because the BT harvester
utilizes a larger proportion of the harvested trees’ total above-ground biomass
without any additional TC (Paper I). To some extent, this gain in BT harvester
productivity could be seen as lost in the BT forwarding activity (Paper II),
since the BT assortment has a lower density than roundwood assortments
(Bergström et al., 2010b). A geometrical harvest pattern led to higher harvester
productivity than selective treatments (Paper I), and this dynamic was most
pronounced for the wider 2 m boom corridors. This increase in harvester
productivity was correlated with the amount of biomass accumulated by the
harvester head per work cycle. Forwarder loading productivity also increased
with larger piles (Paper II); in this aspect, BT with wide boom corridors
favours both harvester and forwarder productivity. To summarize, BT
operations seem to be a competitive alternative to roundwood harvesting
operations, with regards to TC per harvested unit biomass.
The impacts of BT on forest management were identified and quantified in
Papers I and IV; a geometrical harvesting pattern reduced selectivity in BT
compared to an ordinary selective first thinning, and the increased BT activity
was preceded by reduced PCT activity. These factors imply higher stem
densities, and thus thinner trees, throughout the rotation period – and especially
so up until the time of first (biomass) thinning. Nevertheless, saw log as well as
pulpwood demands could be fulfilled in the different simulated scenarios in
Paper IV, without compromising the sustainability of the forestry.
Paper IV analysed whether BT could be used to supply the district heating
industry in Sweden. As has been put forth, forest biomass is expected to be
increasingly used in new kinds of products, both solid materials and liquid
fuels. SweFor can be used to analyse such scenarios, i.e. the heating plant
industry (Figure 6) could be expanded to include all forest biomass consuming
industries. The infinite demand scenarios (Table 3) hint that the industries that
consume forest biomass have the potential to expand. The results in Paper IV
revealed that BT has more potential than has been estimated in prior studies
(Table 1). This finding can be attributed to several aspects, namely, BT was
scheduled later in the rotation period, the analyses included the extraction of
whole trees instead of only the harvesting residues, and the SweFor model
considering both forest management activities as well as their effects, i.e.
reduced PCT activity translates to more available biomass.
59
4.3 Extended use of SweFor and its results
SweFor could be used to analyse potential locations for new forest biomass
consuming industries, such as the Metsä Äänekoski bioproduct mill, launched
in August 2017. Although its main products are “softwood and birch pulp for
board, tissue, printing paper and speciality products”, it is being marketed as
“the world’s first next-generation bioproduct mill”. Notable by-products
(albeit many arise to some extent from the production in any arbitrary pulp
mill) are tall oil, turpentine, bioelectricity, product gas, sulphuric acid and
biogas (Metsä, 2018). Locations analyses could be performed either by starting
with manually identified potential locations which are then evaluated
iteratively, or deducing optimal sites using GIS analyses of the SweFor results,
and/or spatial optimization. Other studies on localization of new forest biomass
consuming industries – or terminals for transportation rationalization – can
guide future extensions of the SweFor analyses (e.g. Forsberg et al., 2005;
Pettersson et al., 2015; Athanassiadis & Nordfjell, 2017).
Revisiting the business innovation process aspect, the results in Paper IV
indicated that an area-based felling device, such as ContC2, had limited effects
on additionally supplied biomass from BT, or NPS (Table 3). The differences
in NPS between TMC2 versus ContC2, and TMC2∞ versus ContC2∞ amount to
270 and 1,180 million SEK respectively. When converted to annual net cash
flow with a simple assumption of equal annual real-term net return, these
differences in NPS corresponds to additional annual surpluses of 8.1 and 35.4
million SEK, respectively. This annual margin can be seen as a bonus
associated with the development and usage of area-based felling devices. In
Paper IV, it was assumed that a ContC2 machine hour would cost 10% more
than a TMC2 machine hour to reflect the development costs of the new
technology as well as the higher costs associated with a more complex area-
based felling device and carrier. However, this assumed cost difference may
not entirely reflect the cost of development as well as the associated risks. For
speculative purposes, the additional annual surpluses derived from the NPS
values in Paper IV should be interpreted as the possible reward for successfully
developing (and marketing) an area-based ContC2 felling device. However, the
cost estimations should cover for one additional aspect that was not included in
the ContC2 system costs (Paper IV): the relocation of machines, both in BT and
other forest management regimes. This approach is standard in strategic level
forestry analyses, and the problems of relocation and aggregation of harvesting
sites are usually considered on the tactical and operational levels. The spatial
result in Figure 16 reveals regions with low BT activity. In those regions, it is
likely that the relocation cost for specialized BT machinery (i.e. an area-based
felling device) will outweigh the productivity benefits. Furthermore, forest

60
harvesting machines are commonly used in an area that has a maximum radius
of about 100 km from the owners’ and operators’ residences, and this distance
is often much less. If one piece of machinery is not fully utilized its action
range, the hourly cost of an expensive and specialized BT harvester will
increase even further. It is likely that these unconsidered costs will restrain BT
harvesting with area-based felling devices in some regions. However,
according to the TMC and TMC∞ scenarios, relocation will have a negligible
effect on BT harvesting as this forestry operation can use conventional
machinery to apply an altered harvest pattern (Table 2). Finally, errors in e.g.
the cost assumptions underlying this kind of assessment can be considered a
risk factor, just as stochastic damage events or random errors in input
descriptive data. The Monte Carlo approach proposed by Chudy et al. (2016)
could in fact be a mean to cover also this aspect.
61
The main outcomes of this thesis can be concluded as:
The productivity of biomass thinning (BT) harvesters increases with
multiple-tree handling, geometrical harvest patterns and area-based
felling devices, compared with a selective, single-tree handling
thinning scenario. Productivity increases were greater in denser stands
with smaller trees.
Simulation and deductive productivity modelling seems to offer cost-
efficient means for analysing the productivity of novel harvester and
forwarder machine systems and techniques.
o Inventions and new applications of existing equipment can be
assessed already at a theoretical stage, early in the innovation
process, as empirical data are not required in this approach.
The results of such analyses may guide the continued
innovation process in a more auspicious direction, but must be
handled with consideration of the results’ sensitivity to errors
in descriptive data and assumptions.
The SweFor partial equilibrium model (PEM) performs expectedly
with regards to forest owner behaviour and saw log supply. This
implies that other aspects – e.g. BT – analysed with SweFor can be
expected to perform in a reliable way.
The potential contribution of BT to Sweden’s energy supply – given
the current demand – is minor on national level, but may be of
significant importance on the regional level.
5 Conclusions
62
Although ContC2 is superior to TMC2 in terms of productivity in
small-diameter stands, the contribution of ContC2 to additionally
supplied biomass, i.e. the increase in net present surplus (NPS), is
small relative to TMC2.
BT activity seems positively correlated with high site qualities, high
demand and lack of either alternative fuels or regional demand for
pulpwood. Increased BT activity leads to reduced pre-commercial
thinning (PCT) activity and a greater decrease in mean diameter at 15
m height over time.
A PEM seems to be a useful tool for integrating the market aspect in
the innovation process of novel machine systems and techniques. The
results suggest that the predicted impact of BT, and the associated
machinery, will vary greatly depending on whether or not the model
takes into account market factors (total demand and competing supply
with its associated costs). This implies two alternative consequences:
o Ignoring the market aspect during the innovation process may
lead to unnecessary investment in the development and
implementation of machine systems that will ultimately be
less successful than productivity or simple potential estimates
predicted.
or
o The significant difference between the current market and
infinite demand scenarios present a huge potential for the
increased utilization of forest biomass in new products. In this
way, an increase in the demand for forest biomass would
increase net social surplus in the forest sector and a new
doctrine for Swedish forest management.
63
AedoOrtiz, D., Olsen, E. & Kellogg, L. (1997). Simulating a harvester-forwarder softwood
thinning: A software evaluation. Forest Products Journal, 47(5), pp. 36-41.
Ahnlund Ulvcrona, K., Bergström, D. & Bergsten, U. (2017). Stand structure after thinning in 1–2
m wide corridors in young dense stands. Silva Fennica, 51(3), pp. 1-15.
AIMMS (2016). AIMMS B.V., The Netherlands.
Anerud, E. (2012). Stumps as Fuel – the influence of handling method on fuel quality. Acta
Unversitatis agriculturae Sueciae 2012:85, Uppsala: SLU.
Anon. (2017). INGVAR - beslutsstöd för gallring och röjning (Decision support for thinning and
cleaning). In Swedish.. [Online]
Available at: https://www.skogforsk.se/produkter-och-evenemang/verktyg/ingvar/
[Accessed 4 December 2017].
Athanassiadis, D. & Nordfjell, T. (2017). Regional GIS-based evaluation of the potential and
supply costs of forest biomass in Sweden. Frontiers of Agricultural Science and Engineering,
4(4), pp. 493-501.
Baul, T. K., Alam, A., Ikonen, A., Standman, H., Asikainen, A., Peltola, H. & Kilpeläinen, A.
(2017). Climate Change Mitigation Potential in Boreal Forests: Impacts of Management,
Harvest Intensity and Use of Forest Biomass to Substitute Fossil Resources. Forests, 8(11).
Berg, S. (2014). Technology and Systems for Stump Harvesting with Low Ground Disturbance.
Acta Universitatis agriculturae Sueciae 2014:95. Umeå: SLU.
Bergström, D., Bergsten, U. & Nordfjell, T. (2007). Simulation of geometric thinning systems
and their time requirements for young forests. Silva Fennica 41(1), pp. 137-147.
Bergström, D., Bergsten, U. & Nordfjell, T. (2010a). Comparison of boom-corridor thinning and
thinning from below harvesting methods in young dense Scots pine stands. Silva Fennica,
44(4), pp. 669-679.
Bergström, D., Nordfjell, T. & Bergsten, U. (2010b). Compression Processing and Load
Compression of Young Scots Pine and Birch Trees in Thinnings for Bioenergy. International
Journal of Forest Engineering, 21(1), pp. 31-39.
Berndes, G., Abt, B., Asikainen, A., Cowie, A., Dale, V., Egnell, G., Lindner, M., Marelli, L.,
Paré, D., Pingoud, K. & Yeh, S. (2016). Forest biomass, carbon neutrality and climate
change mitigation. From Science to Policy 3., s.l.: European Forest Institute.
6 References
64
BillerudKorsnäs (2018). The Paper Bottle project. [Online]
Available at: https://www.billerudkorsnas.com/about-us/the-paper-bottle-project
[Accessed 19 08 2018].
Bohlin, F. & Roos, A. (2002). Wood fuel supply as a function of forest owner preferences and
management styles. Biomass and Bioenergy, 22(4), pp. 237-249.
Borges, J., Nordström, E.M., Garcia-Gonzalo, J., Hujala, T. & Trasobares, A. (2014). Computer-
based tools for supporting forest management. The experience and the expertise world-wide,
Umeå: SLU, Dept. for Forest Resource Management. ISBN (electronic): 978-91-576-9237-5
Bostedt, G., Mustonen, M. & Gong, P. (2016). Increasing forest biomass supply in northern
Europe – countrywide estimates and economic perspectives. Scandinavian Journal of Forest
Research, 31(3), pp. 314-322.
Bredberg, C.-J. (1972). Type stands for the first thinning, Research Notes No. 55. Stockholm:
Royal College of Forestry. Dept. of Operational Efficiency.
Brunberg, T. (1997). Basic data for productivity norms for single-grip harvesters in thinning,
Redogörelse No. 8. Uppsala: Skogforsk.
Börjesson, P., Hansson, J. & Berndes, G. (2017). Future demand for forest-based biomass for
energy purposes in Sweden. Forest Ecology and Management, Volume 383, pp. 17-26.
Chudy, R., Sjølie, H. & Solberg, B. (2016). Incorporating risk in forest sector modeling – state of
the art and promising paths for future research. Scandinavian Journal of Forest Research,
31(7), pp. 719-727.
Dees, M. & Rettenmaier, N. (2009). Overview of European studies of biomass resource
assessment - BEE. [Online]
Available at: http://www.eu-bee.eu/_ACC/_components/ATLANTIS-
DigiStore/dees_biomass_potential5501.pdf?item=digistorefile;144642;837¶ms=open;gallery
[Accessed 13 08 2018].
Demirbas, N. (2009). Biorefineries for biofuel upgrading: A critical review. Applied energy,
Volume 86, pp. 151-161.
Domsjö Fabriker (2018). Domsjö Fabriker Sustainability. [Online]
Available at:
http://www.domsjo.adityabirla.com/Documents/Hallbarhetsredovisning/Domsjo_hallbarhetsredovis
ning.pdf [Accessed 19 08 2018].
Eggers, J., Lämås, T., Lind, T. & Öhman, K. (2014). Factors influencing the choice of
management strategy among small-scale private forest owners in Sweden. Forests, 5(7), pp.
1695-1716.
Egnell, G. (2017). A review of Nordic trials studying effects of biomass harvest intensity on
subsequent forest production. Forest Ecology and Management, Volume 383, pp. 27-36.
Elfving, B. (2010). Natural mortality in thinning and fertilisation experiments with pine and
spruce in Sweden. Forest Ecology and Management, Volume 260, pp. 353-360.
Eliasson, L. (1998). Analyses of Single-Grip Harvester Productivity, Acta Universitatis
agriculturae Sueciae, Silvestria, 1998:80. Umeå: SLU.
Eliasson, L. (1999). Simulation of thinning with a single-grip harvester. Forest Science, 45(1), pp.
26-34.

65
Eriksson, L.O., Athanassiadis, D. & Öhman, M. (2013). Ett energioptimerat skogsbruk i Sverige.
Rapport 2013:17., Stockholm: Svensk Fjärrvärme.
Fernandez-Lacruz, R., di Fulvio, F., Athanassiadis, D., Bergström, D. & Nordfjell, T. (2015).
Distribution, characteristics and potential of biomassdense thinning forests in Sweden. Silva
Fennica, 49(5), pp. 1-17.
Ford, E. (2000). Scientific Method for Ecological Research, Port Chester, NY: Cambridge
University Press.
Forsberg, J. & Wennberg, R. (2011). Teknikutveckling av aggregat för kontinuerligt
ackumulerande skörd i unga skogar. Examensarbete., Luleå: Luleå Tekniska Universitet.
Forsberg, M., Frisk, M. & Rönnqvist, M. (2005). FlowOpt - A Decision Support Tool for
Strategic and Tactical Transportation Planning in Forestry. International Journal of Forest
Engineering, 16(2), pp. 101-114.
Fridman, J., Holm, S., Nilsson, M., Nilsson, P., Hedström Ringvall, A. & Ståhl, G. (2014).
Adapting National Forest Inventories to changing requirements - the case of the Swedish
National Forest Inventory at the turn of the 20th century. Silva Fennica, 48(3).
di Fulvio, F., Kroon, A., Bergström, D. & Nordfjell, T. (2011). Comparison of energy-wood and
pulpwood thinning systems in young birch stands. Scandinavian Journal of Forest Research,
26(4), pp. 339-349.
Geissdoerfer, M., Bocken, N. M. & Hultink, E. J. (2016). Design thinking to enhance the
sustainable business modelling process - A workshop based on a value mapping process.
Journal of Cleaner Production, Volume 135.
Ghaffariyan, M., Brown, M., Acuna, M., Sessions, J., Gallagher, T., Kühmaier, M., Spinelli, R.,
Visser, R., Devlin, G., Eliasson, L., Laitila, J., Laina, R., Iwarsson Wide, M. & Egnell, G.
(2017). An international review of the most productive and cost effective forest biomass
recovery technologies and supply chains. Renewable and Sustainable Energy Reviews,
Volume 74, pp. 145-158.
Gullberg, T. (1997a). A deductive time consumption model for loading shortwood. Journal of
Forest Engineering, 8(1), pp. 35-44.
Gullberg, T. (1997b). Time consumption model for off-road extraction of shortwood, Papers and
Results, No. 297. Garpenberg: SLU.
Gustavsson, L., Haus, S., Lundblad, M., Lundström, A., Ortiz, C.A., Sathre, R., Truong, N.L. &
Wikberg, P-E. (2017). Climate change effects of forestry and substitution of carbon-intensive
materials and fossil fuels. Renewable and Sustainable Energy Reviews, Volume 67, pp. 612-
624.
Gustavsson, R. (1974). Type stands for cleaning, Research Note No. 70. Garpenberg: Royal
College of Forestry. Dept. of Operational Efficiency.
Heikkilä, J., Siren, M., Ahtikoski, A., Hynynen, J., Sauvula, R., Lehtonen, M. (2009). Energy
Wood Thinning as a Part of the Stand Management of Scots Pine and Norway Spruce. Silva
Fennica, 43(1), pp. 129-146.
Heinimann, H.R. (2007). Forest operations engineering and management - the ways behind and
ahead of a scientific disipline. Croatian Journal of Forest Engineering, 28(1), pp. 107-121.
Holsapple, C. (2008). Decision and knowledge. In: F. Burstein & C. Holsapple, eds. Handbook on
Decision Support Systems. Berlin: Springer, pp. 21-53.

66
Hynynen, J., Salminen, H., Ahtikoski, A., Huuskonen, S., Ojansuu, R., Siipiletho, J., Lehtonen,
M. & Eerikäinen, K. (2015). Long-term impacts of forest management on biomass supply and
forest resource development: a scenario analysis for Finland. European Journal of Forest
Research, 134(3), pp. 415-431.
Hyytiäinen, K., Tahvonen, I. & Valsta, L. (2005). Optimum juvenile density, harvesting, and
stand structure in even-aged Scots pine stands. Forest Science, 51(2), pp. 120-133.
Hägglund, B. (1982). Some remarks on the plot-stand problem in forest inventory. In: Statistics in
theory and practice: Essays in honour of Bertil Matérn. Umeå: Swedish University of
Agricultural Sciences, Section of Forest Biometry, pp. 137-157.
Hägglund, B. & Lundmark, J.-E. (1981). Handledning i bonitering med Skogshögskolans
boniteringssystem. 124 pp. (In Swedish.), Jönköping, Sweden: National Board of Forestry .
Iwarsson Wide, M. & Belbo, H. (2009). Jämförande studie av olika tekniker för
skogsbränsleuttag - Skogsbränsleuttag med Naarva-gripen 1500-40E, Bracke C16.A och
LogMax 4000, Mellanskog, Färila. Working papers no. 679. Uppsala: Skogforsk.
Iwarsson Wide, M. & Belbo, H. (2010). A comparative study of different techniques for forest fuel
extraction in very small forests - Forest fuel extraction with the Naarva 1500-40E grip and
LogMax 4000, Mellanskog, Simeå. Working papers no. 709. Uppsala: Skogforsk.
Johnson, K.N. & Scheurman, H.L. (1977). Techniques for prescribing optimal timber harvest and
investment under different objectives – Discussion and Synthesis. Forest Science Monograph
18.
de Jong, J., Akselsson, C., Egnell, G., Löfgren, S. & Olsson, B.A. (2017). Realizing the energy
potential of forest biomass in Sweden – How much is environmentally sustainable?. Forest
Ecology and Management, Volume 383, pp. 3-16.
Jylhä, P. & Laitila, J. (2007). Energy wood and pulpwood harvesting using a prototype whole-tree
bundler. Silva Fennica 41(4), pp. 763-779.
Karlsson, L. (2013). Silvicultural regimes and early biomass thinning in young, dense pine
stands, Acta Universitatis agriculturae Sueciae, Doctoral thesis No. 2013:90. Faculty of
Forest Sciences. Umeå: SLU.
Karlsson, L., Bergsten, U., Ulvcrona, T. & Elfving, B. (2013). Long-term effects on growth and
yield of corridor thinning in young Pinus silvestris stands. Scandinavian Journal of Forest
Research. 28., pp. 28-37.
Karttunen, K., Laitila, J. & Ranta, T. (2016). First-thinning harvesting alternatives for industrial
or energy purposes based on regional Scots pine stand simulations in Finland. Silva Fennica,
50(2).
Laitila, J. (2008). Harvesting technology and the cost of fuel chips from early thinnings. Silva
Fennica, 42(2), pp. 267-283.
Laitila, J., Asikainen, A. & Nuutinen, Y. (2007). Forwarding of whole trees after manual and
mechanized felling bunching in pre-commercial thinnings. International Journal of Forest
Engineering 18(2), pp. 29-39.
Laitila, J., Niemistö, P. & Väätäinen, K. (2016). Productivity of Multi-Tree Cutting in Thinnings
and Clear Cuttings of Young Downy Birch (Betula pubescens) Dominated Stands in the
Integrated Harvesting of Pulpwood and Energy Wood. Baltic Forestry, 22(1), pp. 116-131.
67
Latta, G. S., Sjølie, H. K. & Solberg, B. (2013). A review of recent developments and
applications of partial equilibrium models of the forest sector. Journal of Forest Economics
19, pp. 350-360.
Lindroos, O. (2010). Scrutinizing the theory of comparative time studies with operator as a block
effect. International Journal of Forest Engineering, 21(1), pp. 20-30.
Lindroos, O., La Hera, P. & Häggström, C. (2017). Drivers of Advances in Mechanized Timber
Harvesting – a Selective Review of Technological Innovation. Croatian Journal of Forest
Engineering, 38(2), pp. 243-258.
Lundmark, R., Athanassiadis, D. & Wetterlund, E. (2015). Supply assessment of forest biomass -
A bottom-up approach for Sweden. Biomass and Bioenergy, Volume 75, pp. 213-226.
Marchi, E., Chung, W., Visser, R., Abbas, D., Nordfjell, T., Mederski, P.S., McEwan, A., Brink,
M. & Laschi, A. (2018). Sustainable Forest Operations (SFO): A new paradigm in a changing
world and climate. Science of the Total Environment, Volume 634, pp. 1385-1397.
Melin, Y. (2014). Impacts of stumps and roots on carbon storage and bioenergy use in a climate
change context. Acta Universitatis agriculturae Sueciae 2014:79, Umeå: SLU.
Metsä (2018). Metsä Group's Bioproduct mill. [Online]
Available at: https://www.metsafibre.com/en/about-us/Bioproduct-mill/Pages/default.aspx#
[Accessed 13 09 2018].
Microsoft (2007). Microsoft, Redmond, WA.
Mintzberg, H. (2000). The rise and fall of strategic planning. London: Pearson Education.
Muys, B., Hynynen, J., Palahí, M., Lexer, M.J., Fabrika, M., Pretzsch, H., Gillet, F., Briceño, E.,
Nabuurs, G.J. & Kint, V. (2010). Simulation tools for decision support to adaptive forest
management in Europe. Forest Systems, Volume 19, pp. 86-99.
Newnham, R. (1966). A simulation model for studying the effect of stand structure on harvesting
pattern. Forest Chronicle, Volume 42, pp. 39-44.
Nordfjell, T., Nilsson, P., Henningsson, M. & Wästerlund, I. (2008). Unutilized biomass
resources in Swedish young dense forests. Proceedings of the World Bioenergy Conference
and Exhibition on Biomass for Energy, Jönköping, Sweden, 27-29 May 2008, The Swedish
Bioenergy Association, pp. 323-325.
Nurminen, T., Korpuhnen, H. & Uusitalo, J. (2006). Time consumption analysis of the
mechanized cut-to-length harvesting system. Silva Fennica, 40(2), pp. 335-363.
Oikari, M., Kärhä, K., Palander, T., Pajuoja, H. & Ovaskainen, H. (2010). Analyzing the Views of
Wood Harvesting Professionals Related to the Approaches for Increasing the Cost-Efficiency
of Wood Harvesting from Young Stands. Silva Fennica, 44(3), pp. 481-495.
Olsson, A. & Lundmark, R. (2014). Modelling the Competition for Forest Resources: The Case of
Sweden. Journal of Energy and Natural Resources, 3(2), pp. 11-19.
Ovaskainen, H. (2008). Timber harvester operators working technique in first thinning and the
importance of cognitive abilities on work productivity, Dissertationes Forestales 79. Joensuu:
University of Joensuu.
Ovaskainen, H., Uusitalo, J. & Sassi, T. (2006). Effect of edge trees on harvester positioning in
thinning. Forest Science, 52(6), pp. 659-669.

68
Ovaskainen, H., Uusitalo, J. & Väätäinen, K. (2004). Characteristics and significance of a
harvester operators' working technique in thinnings. International Journal of Forest
Engineering, 15(2), pp. 67-77.
Pettersson, K. et al. (2015). Integration of next-generation biofuel production in the Swedish
forest industry – A geographically explicit approach. Applied Energy, Volume 154, pp. 317-
332.
Pettersson, N. (1993). The Effect of Density after Precommercial Thinning on Volume and
Stucture in Pinus Sylvestris and Picea Abies stands.. Scandinavian Journal of Forest
Research, 8., pp. 528-539.
Ringdahl, O., Hellström, T. & Lindroos, O. (2012). Potentials of possible machine systems for
directly loading logs in cut-to-length harvesting. Canadian Journal of Forest Research, 42(5),
pp. 970-985.
Routa, J., Asikainen, A., Björheden, R., Laitila, J. & Röser, D. (2013). Forest energy
procurement: state of the art in Finland and Sweden. Wiley Interdisciplinary Reviews-Energy
and Environment, 2(6), pp. 602-613.
Samset, I. (1966). Loven om den sprangvise vikling (The law of discontinuous evolution). Norsk
Skogbruk, Volume 12, pp. 737-741.
Samset, I. (1990). Some observations on time and performance studies in forestry,
Communication No. 43.5. Ås: Norwegian Forest Research Institute.
Santesson, M. & Sjunnesson, S. (1972). Simulation model for thinning machines, Research Notes,
No. 49. Stockholm: Royal College of Forestry, Dept. of Operational Efficiency.
Siren, M. & Aaltio, H. (2003). Productivity and costs of thinning harvesters and harvester-
forwarders. International Journal of Forest Engineering 14(1), pp. 39-48.
Sjølie, H. K., Latta, G. S., Gobakken, T. & Solberg, B. (2011). NorFor - a forest sector model of
Norway. Model overview and structure, Ås: Department of Ecology and Natural Resource
Management, Norwegian University of Life Sciences.
Sjølie, H., Latta, G. & Solberg, B. (2014). Impacts of the Kyoto Protocol on boreal forest climate
change mitigation. Annals of Forest Science, Volume 71, pp. 267-277.
SLU, 2016. Heureka Wiki. [Online]
Available at: http://heurekaslu.org/wiki/Main_Page
[Accessed 09 08 2016].
Solberg, B. (1986). Forest sector simulation models as methodological tools in forest policy
analysis. Silva Fennica, 20(4), pp. 419-427.
Sundberg, U. & Silversides, C. (1988). Operational Efficiency in Forestry: Analysis (Vol. 1),
Springer.
Swedish Energy Agency (2014). Scenarier över Sveriges energisystem, ER 2014:19, Eskilstuna:
Swedish Energy Agency.
Swedish Energy Agency (2015). Production of unprocessed wood fuels 2014. ES 2015:08,
Eskilstuna: Swedish Energy Agency.
Swedish Energy Agency (2017). Trädbränsle- och torvpriser Nr 4 / 2017, Eskilstuna: Swedish
Energy Agency.
Swedish Energy Agency (2018). Energiläget i siffror 2018. [Online]
Available at: http://www.energimyndigheten.se/nyhetsarkiv/2018/nu-finns-energilaget-i-

69
siffror-20182/
[Accessed 03 10 2018].
Swedish Forest Agency (2008). Rekommendationer vid uttag av avverkningsrester och
askåterföring, Jönköping: Swedish Forest Agency.
Swedish Forest Agency (2009). Stubbskörd - kunskapssammanställning och Skogsstyrelsens
rekommendationer. (Meddelande no. 4:2009.), Jönköping: Swedish Forest Agency.
Swedish Forest Agency (2014). Swedish Statistical Yearbook of Forestry, Jönköping: Swedish
Forest Agency.
Swedish Forest Agency (2015a). Rundvirkes- och skogsbränslebalanser för år 2013 - SKA 15.
Meddelande 3:2015., Jönköping: Swedish Forest Agency.
Swedish Forest Agency (2015b). Skogliga konsekvensanalyser 2015 - SKA 15. Rapport 10:2015.,
Jönköping: Swedish Forest Agency.
Swedish Forest Agency (2016). Prices on roundwood in 2015. [Online]
Available at:
http://www.skogsstyrelsen.se/Global/myndigheten/Statistik/Statistiska%20meddelanden/2016
/SM_Rundvirkespriser_2016-01-28.pdf
[Accessed 01 08 2016].
Swedish Forest Agency (2017). Nationella sektorsrådet, minnesanteckningar 2017-09-26.
[Online]
Available at: https://www.skogsstyrelsen.se/globalassets/om-oss/radgivande-
grupper/nationella-sektorsradet/20170926/minnesanteckningar-sektorsrad-170926.pdf
[Accessed 28 09 2018].
Swedish Forest Agency (2018). Statistik efter ämne. [Online]
Available at: https://www.skogsstyrelsen.se/statistik/statistik-efter-amne/
[Accessed 07 09 2018].
Swedish Forest Industries Federation (2017). Statistics - International - Forest Industry. [Online]
Available at: http://www.forestindustries.se/forest-industry/statistics/international/
[Accessed 06 08 2018].
Sängstuvall, L. (2010). Estimates of the productivity of logging operations with a focus on forest
fuel extraction. Arbetsrapport 261., Umeå: SLU. Department of Forest Resource
Management.
Sängstuvall, L. (2018). Tidsåtgångsfunktioner för skotning av träddelar med mellanstor skotare.
[In Swedish], Umeå: SLU. Manuscript.
Söderholm, J. (2002). The planning system of Swedish forest companies. Arbetsrapport 98.,
Umeå: SLU. Department of Forest Resource Management and Geomatics.
Talbot, B., Nordfjell, T. & Suadicani, K. (2003). Assessing the utility of two integrated harvester-
forwarder machine concepts through stand-level simulation. International Journal of Forest
Engineering, 14(2), pp. 31-43.
Trømborg, E. & Solberg, B. (2010). Forest sector impacts of the increased use of wood in energy
production in Norway. Forest Policy and Economics, 12, pp. 39-47.
Wang, J., LeDoux, C. & Li, X. (2005). Simulating cut-to-length harvesting operations in
Appalachian hardwoods. International Journal of Forest Engineering, 16(2), pp. 11-27.

70
Varmola, M. & Salminen, H. (2004). Timing and intensity of precommercial thinning in Pinus
sylvestris stands. Scandinavian Journal of Forest Research, 19(2), pp. 142-151.
Wetterlund, E., Pettersson, K., Mossberg, J., Torén, C., Hoffstedt, A. & von Schenck, A. (2013).
Optimal localisation of next generation biofuel production in Sweden, 2013:8, Göteborg:
Swedish Knowledge Centre for Renewable Transportation Fuels (F3).
Wikström, P. (2000). A Solution Method for Uneven-Aged Management Applied to Norway
Spruce. Forest Science. 46(3), pp. 452-463.
Wikström, P. et al. (2011). The Heureka Forestry Decision Support System: An Overview.
Mathematical and Computational Forestry & Natural-Resource Sciences. 3(2) , pp. 87-94.

71
Forest biomass is used as feedstock for forest products as well as for
bioenergy. The current Swedish roundwood utilization is near the sustainable
maximum, and so increased forest biomass consumption in Sweden must
utilize additional parts of the trees already harvested, and/or that small trees not
utilized today must be harvested. New ways to harvest such small trees,
including stems, tops, branches and needles – biomass thinning (BT), were
developed over the years 2005-2010. Harvesting in a geometrical pattern
(boom-corridors, Figure 1), with a conventional harvester head or a specialized
area-based felling device, was described and tested. After promising tests,
more research was needed to see if the results were valid under other
conditions than those tested. The overall objective of this thesis is to analyse
the impact of new BT harvesting technology with regards to recovery costs,
forest management and national forest biomass supply. A popularized and
sharpened question at issue in this thesis is
“Should we stop doing pre-commercial thinning, and instead grow dense
young stands with small trees, which can be harvested for energy or other use
with new and efficient harvesting techniuque?”
Harvester and forwarder productivity in new kinds of BT operations were
modelled, and the results were implemented in the Heureka decision support
system, to allow long-term forest planning analyses of BT. Forest management
programs simulated with Heureka were used in the SweFor sector model,
where forest industry demand is balanced with potential supply from the forest,
and the consequences of industry consumption in one period affects the forest
development in the following periods. SweFor was tested for a couple of
assumptions other than BT, and worked expectedly there. As for BT, it was the
preferred management regime on about 15% of the managed Swedish forest
area, and provided 15% of the total supply to heat plants. If the forest
industries could consume endless amounts of biomass, for present or new uses
and products, BT activity could increase with 300%.
In conclusion, the answer to the popularized question asked is
“It depends, on market conditions as well as forest characteristics”.
Popular science summary

72
73
Biomassa från skogen används som råvara för såväl skogsprodukter (papper, massa,
sågade trävaror) som bioenergi. Den svenska avverkningen av rundvirke ligger nära
den högsta hållbara nivån. Detta innebär att ökat utnyttjande av biomassa från den
svenska skogen till del måste baseras på andra delar av de träd som redan avverkas,
och/eller småträd som inte tillvaratas idag. Nya metoder och tekniker för att tillvarata
sådana träd utvecklades under åren 2005-2010. med hjälp av befintlig eller ny
drivningsteknik. Gallring i ett geometriskt mönster (krankorridorer, Figur 1), med ett
vanligt skördaraggregat eller en specialbyggd arealbaserad fällningsutrustning,
beskrevs och testades. Efter lovande tester behövdes mer forskning för att se om
testresultaten blev de samma under fler förutsättningar. Det övergripande syftet med
denna avhandling är att analysera effekterna av nya tekniker och metoder för
biomassagallring, med avseende på drivningskostnad, skogsskötsel och nationell
biomassaförsörjning från den svenska skogen. En populariserad och tillspetsad
frågeställning i avhandlingen kan låta såhär:
“Ska man sluta röja skogen, och istället odla unga täta bestånd med klena träd, som
kan avverkas som energiråvara eller för annan användning, med ny och effektiv
drivningsteknik?”
Skördar- och skotarproduktivitet i nya typer av biomassagallring modellerades, och
resultaten implementerades i beslutsstödssystemet Heureka, så man kunde göra
långsiktiga analyser av biomassagallring. Skogsskötselprogram som simulerats med
Heureka användes sedan i sektorsmodellen SweFor, där skogsindustrins efterfrågan
balanseras med möjlig försörjning från skogen, och konsekvenserna av industrins
förbrukning av råvara från skogen i en period påverkar skogens sammansättning och
utveckling i de kommande perioderna. SweFor testades för ett par antaganden som inte
rörde biomassagallring, och fungerade som förväntat. Biomassagallring var det bästa
skötselalternativet på ungefär 15% av den brukade skogsmarksarealen, och stod för
ungefär 15% av försörjningen av skoglig biomassa till de svenska fjärrvärmeverken,
med dagens marknadsförutsättningar. Med obegränsad efterfrågan på skoglig biomassa,
givet dagens prisnivåer, ökar den nyttjande volymen från biomassagallring med 300%,
som kan gå till nya typer av användning och produkter.
Sammanfattningsvis är svaret på den populariserade frågeställningen
“Det beror på, marknadsläget och de skogliga förutsättningarna”.
Populärvetenskaplig sammanfattning

74
75
Mitt första och största tack går till min huvudhandledare, Tomas Lämås, vars
extraordinära tålamod och stöd har varit avgörande för genomförandet av det
här avhandlingsarbetet. Det hade också varit omöjligt utan mina engagerade
biträdande handledare Tomas Nordfjell och Ljusk Ola Eriksson. Ett särskilt
tack även till er, för att ni inte gav upp när jag började på nästa utmaning innan
denna var slutförd.
Tack Karin Öhman, Dan Bergström, Dimitris Athanassiadis, Simon Berg,
Peichen Gong, Juha Laitila, Elisabeth Wetterlund samt Bo Dahlin, som alla har
bidragit med värdefulla synpunkter på innehållet i avhandlingen. Ett stort tack
även till Brattåsstiftelsen, som finansierat det här arbetet.
Tomas Lämås, tillsammans med Ingemar Gillgren på Bergvik Skog, väckte
mitt intresse för skoglig planering under genomförandet av mitt examensarbete
år 2007. Under de elva år som förflutit sedan dess har jag kommit att jobba
med olika aspekter av skoglig planering; i näringslivet och i min
forskarutbildning. Under dessa år har fantastiska kollegor, samarbetspartners
och chefer vid Sveaskog, SLU och Bergvik Skog låtit mig utvecklas såväl som
människa som ämnesmässigt inom många aspekter av det alltmer
mångfacetterade skogsbruket. Tack Lars Fridh, Emanuel Erlandsson, Ingemar
Gillgren, Pekka Untinen, Björn Henningsson, Lars-Erik Wigert, och många
fler, ingen nämnd och ingen glömd.
Till sist tackar jag alla mina vänner och min familj, som är de viktigaste
människorna för mig. Mamma och pappa, som alltid stöttat mig. Min
underbara fru Linda. Våra barn Märta och Knut, som låter oss uppleva alla
spännande steg genom livet en gång till. Tack för att ni finns.
Bojepps, Hedesunda, november 2018
Acknowledgements