Embed Size (px)
Citation preview
IMPROVED INVENTORY AND MITIGATION OF GREENHOUSE GASES
IN LIVESTOCK PRODUCTION IN SOUTH EAST ASIA:
Central Research Institute for Animal Science, Indonesia
Malaysia Agriculture Research and Development Institute (MARDI)
Department of Livestock Development, Ministry of Agriculture and cooperation, Thailand
Institute of Animal Sciences for Southern Viet Nam (IASVN)
A Final Report Submitted to Livestock Emissions & Abatement Research Network (LEARN)
Submitted by
Kalaya Boonyanuwat, Kinh Lavan, Shanmugavelu Sithambaram, Yeni Widyawati
2013
i
Authors’ details
Dr. Kalaya Boonyanuwat
Department of Livestock Development Bangkok.
Thailand.
Website:http://www.dld.go.th/breeding/biodiversity/
Email : [email protected]
Assoc. Prof. Dr. La Van Kinh
Institute of Animal Sciences for SouthernVietnam
(IASVN).
Vietnam
Website: http://www.iasvn.vn
Email : [email protected]
Dr. Shanmugavelu Sithambaram
Strategic Livestock Research Centre.
Malaysian Agricultural Research and Development
Institute (MARDI).
Malaysia
Email: [email protected]
Dr., Yeni Widyawati
Central Research Institute for Animal Science.
Indonesia
Email: [email protected]
Acknowledgement
Livestock Emissions & Abatement Research Network (LEARN)
New Zealand Agricultural Greenhouse Gas Research Centre (NZAGRC)
ii
Contents
Page
1 Editors’ preface v
2 Executive Summary vi
3 Abbreviations and acronyms x
4 Introduction 1
5 General information of South East Asian countries 4
6 South East Asian livestock production system characterization 9
7 Livestock population by categories and subcategories and production scale 11
8 Methane emission from enteric fermentation 15
9 Methane emission from manure management 31
10 N2O emission from manure management 40
11 GHG emission from enteric fermentation and manure management of livestock in
South East Asian countries by using IPCC default emission factors
41
12 Livestock inventory improvement and biases reduction in regional emission estimates 49
13 Appendix 1
A Proposal Improved Inventory and Mitigation of Greenhouse Gases in Livestock
Production in South East Asia
53
14 References 60
iii
Figures
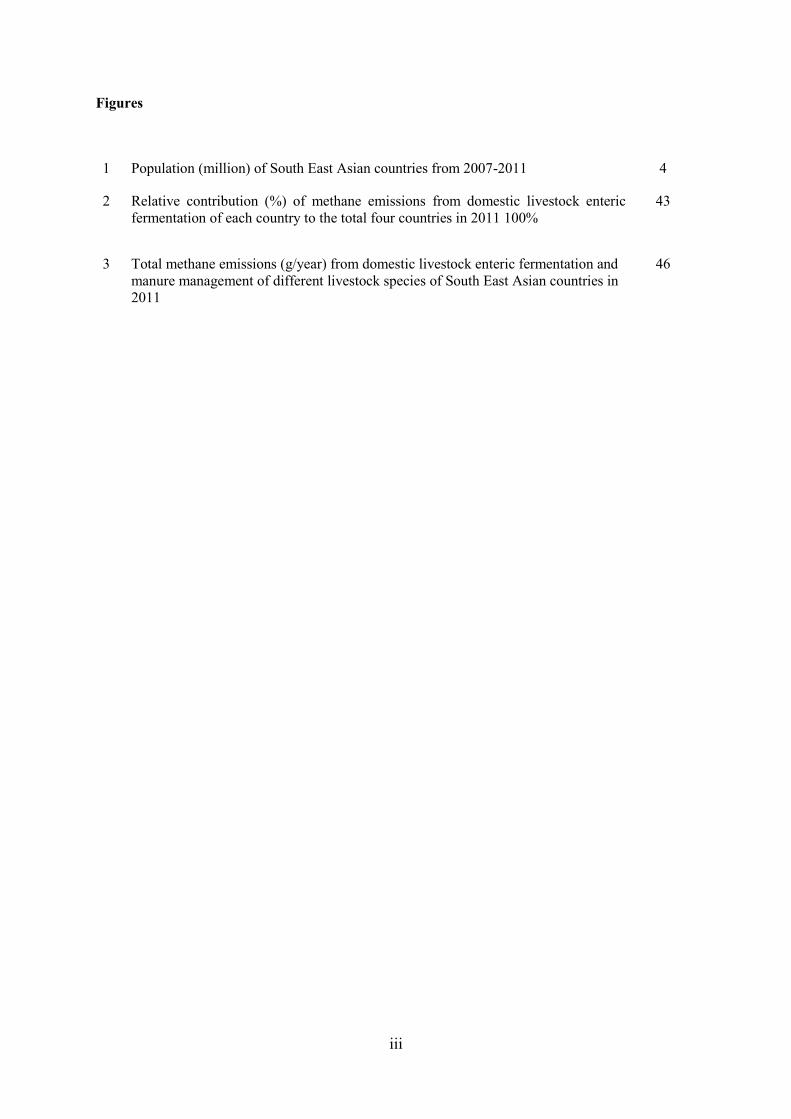
1 Population (million) of South East Asian countries from 2007-2011 4
2 Relative contribution (%) of methane emissions from domestic livestock enteric
fermentation of each country to the total four countries in 2011 100%
43
3 Total methane emissions (g/year) from domestic livestock enteric fermentation and
manure management of different livestock species of South East Asian countries in
2011
46
iv
Tables
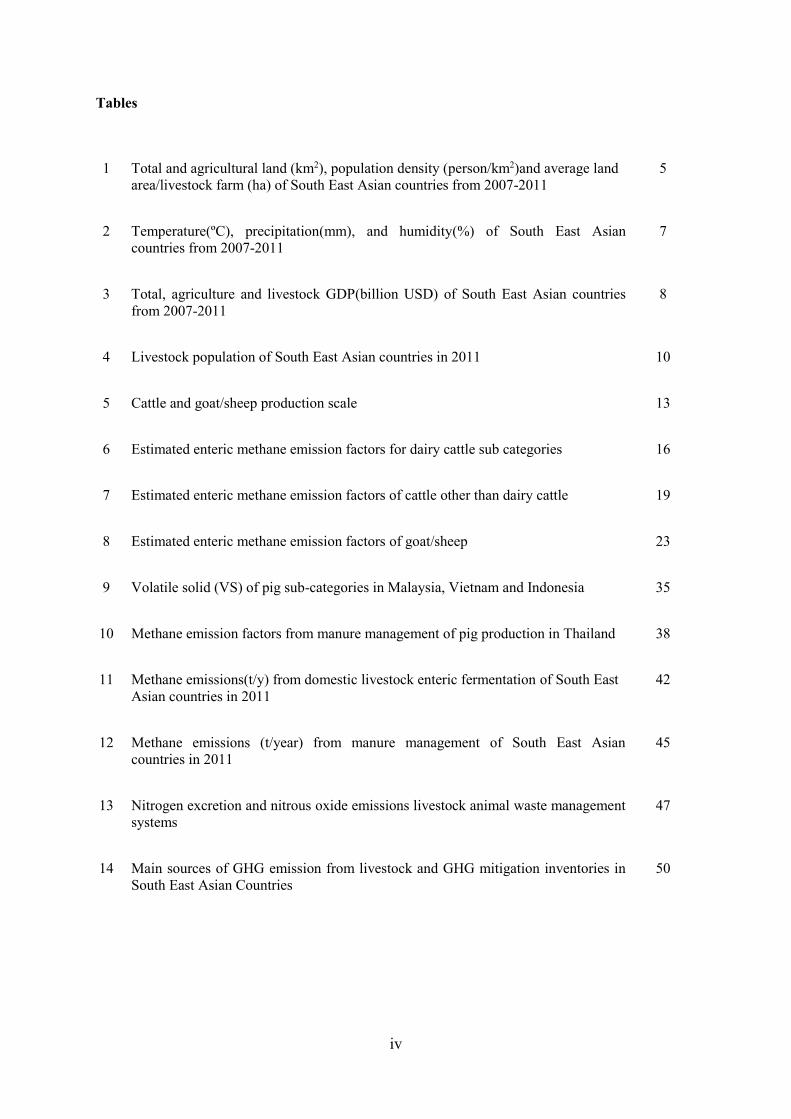
1 Total and agricultural land (km2), population density (person/km2)and average land
area/livestock farm (ha) of South East Asian countries from 2007-2011
5
2 Temperature(ºC), precipitation(mm), and humidity(%) of South East Asian
countries from 2007-2011
7
3 Total, agriculture and livestock GDP(billion USD) of South East Asian countries
from 2007-2011
8
4 Livestock population of South East Asian countries in 2011 10
5 Cattle and goat/sheep production scale 13
6 Estimated enteric methane emission factors for dairy cattle sub categories 16
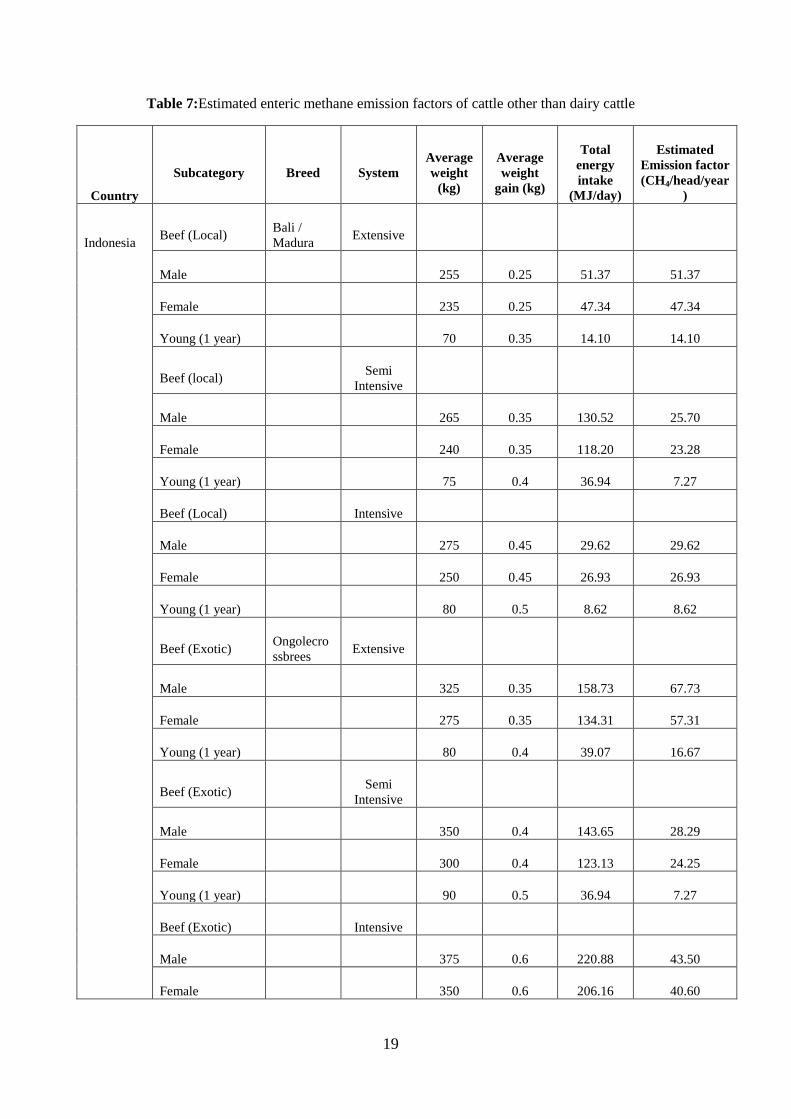
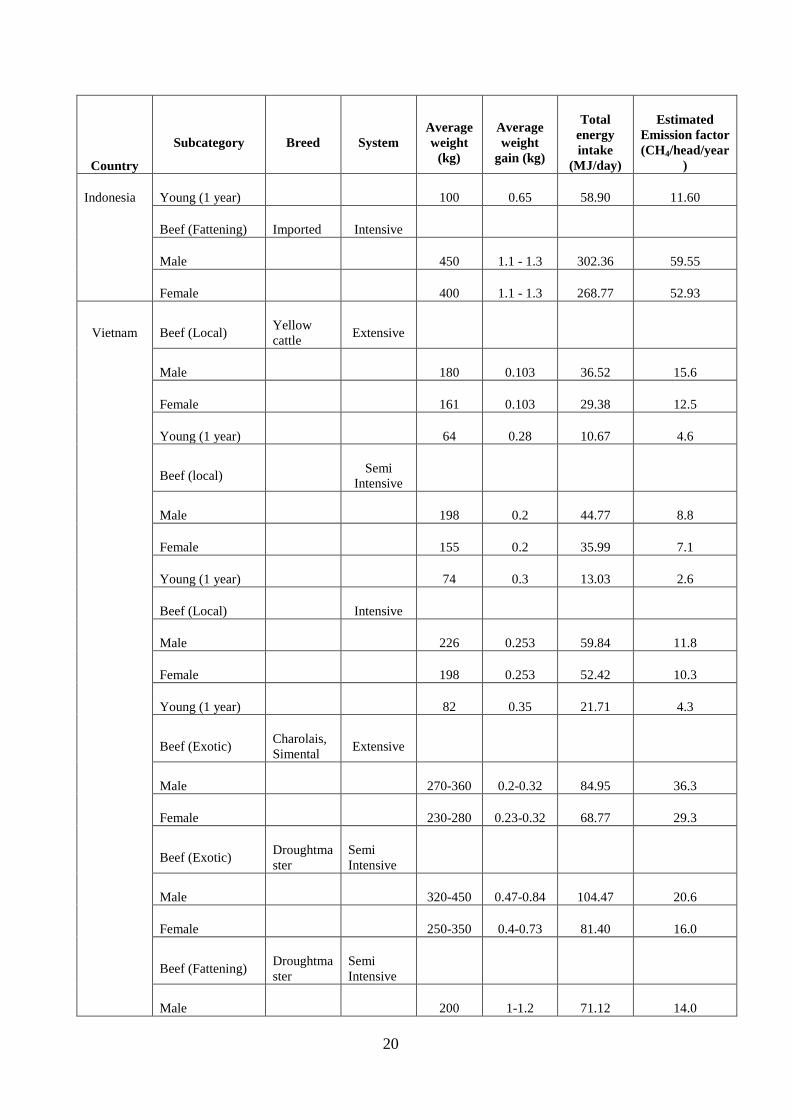
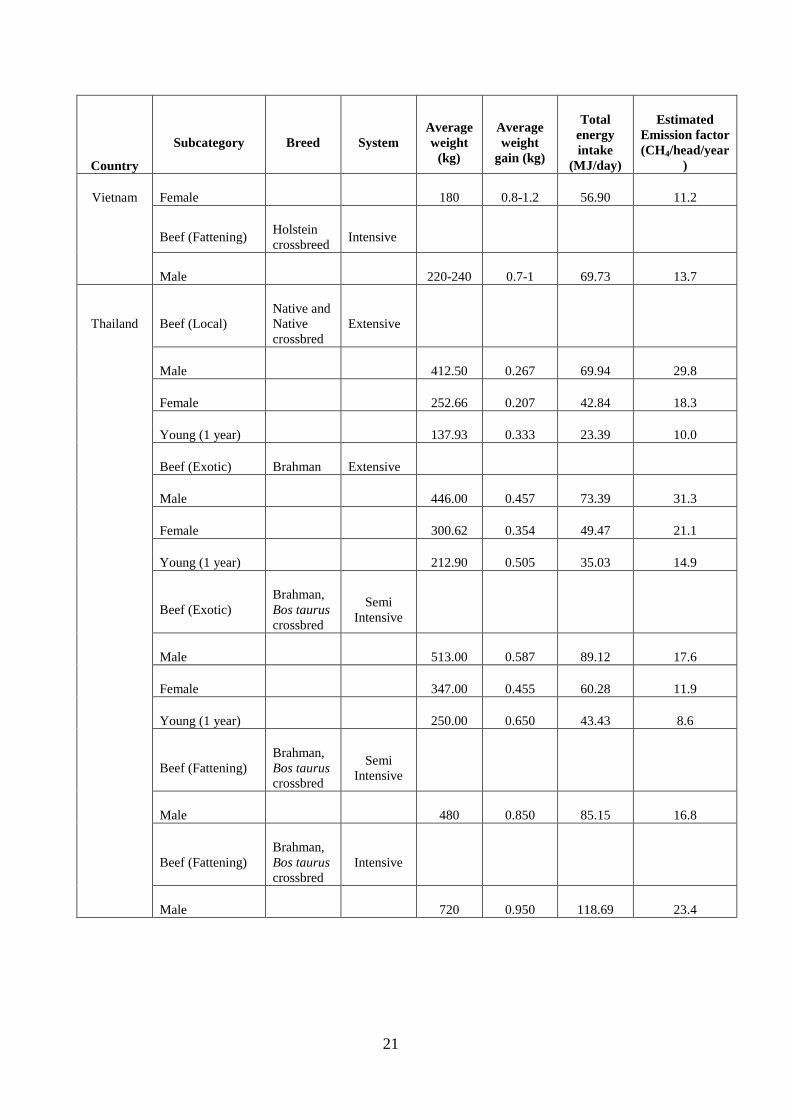
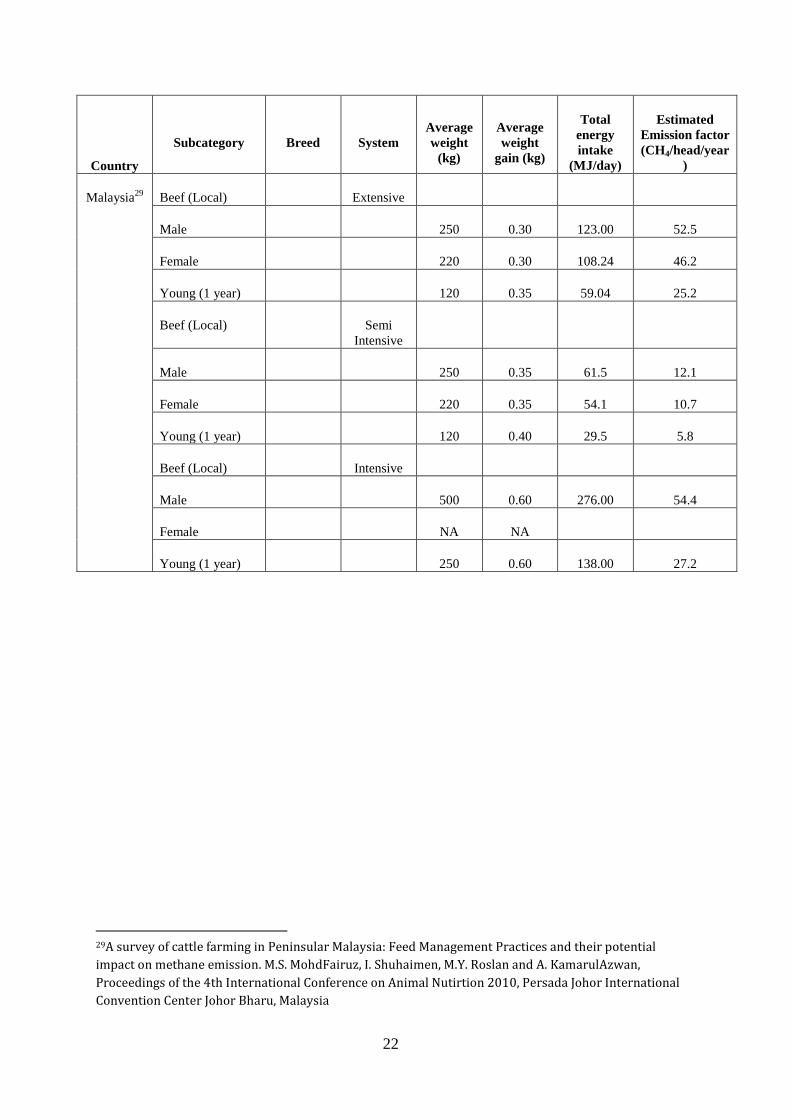
7 Estimated enteric methane emission factors of cattle other than dairy cattle 19
8 Estimated enteric methane emission factors of goat/sheep 23
9 Volatile solid (VS) of pig sub-categories in Malaysia, Vietnam and Indonesia 35
10 Methane emission factors from manure management of pig production in Thailand 38
11 Methane emissions(t/y) from domestic livestock enteric fermentation of South East
Asian countries in 2011
42
12 Methane emissions (t/year) from manure management of South East Asian
countries in 2011
45
13 Nitrogen excretion and nitrous oxide emissions livestock animal waste management
systems
47
14 Main sources of GHG emission from livestock and GHG mitigation inventories in
South East Asian Countries
50
v
Authors’ preface
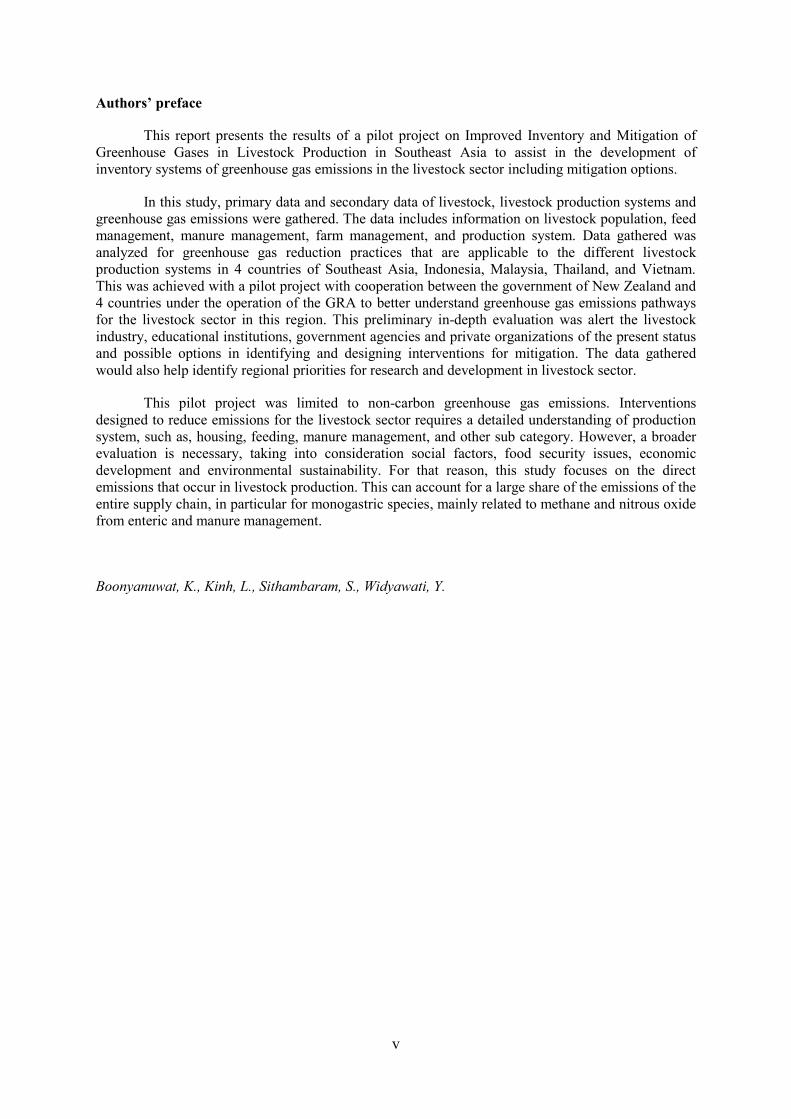
This report presents the results of a pilot project on Improved Inventory and Mitigation of
Greenhouse Gases in Livestock Production in Southeast Asia to assist in the development of
inventory systems of greenhouse gas emissions in the livestock sector including mitigation options.
In this study, primary data and secondary data of livestock, livestock production systems and
greenhouse gas emissions were gathered. The data includes information on livestock population, feed
management, manure management, farm management, and production system. Data gathered was
analyzed for greenhouse gas reduction practices that are applicable to the different livestock
production systems in 4 countries of Southeast Asia, Indonesia, Malaysia, Thailand, and Vietnam.
This was achieved with a pilot project with cooperation between the government of New Zealand and
4 countries under the operation of the GRA to better understand greenhouse gas emissions pathways
for the livestock sector in this region. This preliminary in-depth evaluation was alert the livestock
industry, educational institutions, government agencies and private organizations of the present status
and possible options in identifying and designing interventions for mitigation. The data gathered
would also help identify regional priorities for research and development in livestock sector.
This pilot project was limited to non-carbon greenhouse gas emissions. Interventions
designed to reduce emissions for the livestock sector requires a detailed understanding of production
system, such as, housing, feeding, manure management, and other sub category. However, a broader
evaluation is necessary, taking into consideration social factors, food security issues, economic
development and environmental sustainability. For that reason, this study focuses on the direct
emissions that occur in livestock production. This can account for a large share of the emissions of the
entire supply chain, in particular for monogastric species, mainly related to methane and nitrous oxide
from enteric and manure management.
Boonyanuwat, K., Kinh, L., Sithambaram, S., Widyawati, Y.
vi
Executive Summary
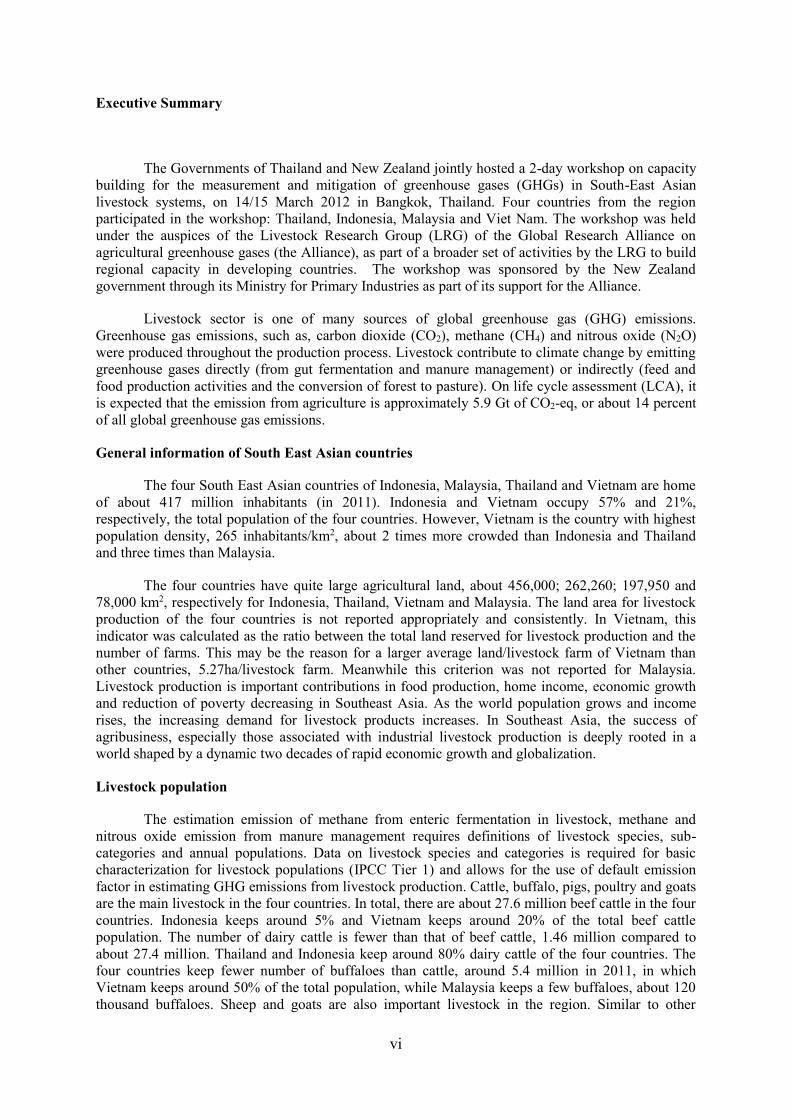
The Governments of Thailand and New Zealand jointly hosted a 2-day workshop on capacity
building for the measurement and mitigation of greenhouse gases (GHGs) in South-East Asian
livestock systems, on 14/15 March 2012 in Bangkok, Thailand. Four countries from the region
participated in the workshop: Thailand, Indonesia, Malaysia and Viet Nam. The workshop was held
under the auspices of the Livestock Research Group (LRG) of the Global Research Alliance on
agricultural greenhouse gases (the Alliance), as part of a broader set of activities by the LRG to build
regional capacity in developing countries. The workshop was sponsored by the New Zealand
government through its Ministry for Primary Industries as part of its support for the Alliance.
Livestock sector is one of many sources of global greenhouse gas (GHG) emissions.
Greenhouse gas emissions, such as, carbon dioxide (CO2), methane (CH4) and nitrous oxide (N2O)
were produced throughout the production process. Livestock contribute to climate change by emitting
greenhouse gases directly (from gut fermentation and manure management) or indirectly (feed and
food production activities and the conversion of forest to pasture). On life cycle assessment (LCA), it
is expected that the emission from agriculture is approximately 5.9 Gt of CO2-eq, or about 14 percent
of all global greenhouse gas emissions.
General information of South East Asian countries
The four South East Asian countries of Indonesia, Malaysia, Thailand and Vietnam are home
of about 417 million inhabitants (in 2011). Indonesia and Vietnam occupy 57% and 21%,
respectively, the total population of the four countries. However, Vietnam is the country with highest
population density, 265 inhabitants/km2, about 2 times more crowded than Indonesia and Thailand
and three times than Malaysia.
The four countries have quite large agricultural land, about 456,000; 262,260; 197,950 and
78,000 km2, respectively for Indonesia, Thailand, Vietnam and Malaysia. The land area for livestock
production of the four countries is not reported appropriately and consistently. In Vietnam, this
indicator was calculated as the ratio between the total land reserved for livestock production and the
number of farms. This may be the reason for a larger average land/livestock farm of Vietnam than
other countries, 5.27ha/livestock farm. Meanwhile this criterion was not reported for Malaysia.
Livestock production is important contributions in food production, home income, economic growth
and reduction of poverty decreasing in Southeast Asia. As the world population grows and income
rises, the increasing demand for livestock products increases. In Southeast Asia, the success of
agribusiness, especially those associated with industrial livestock production is deeply rooted in a
world shaped by a dynamic two decades of rapid economic growth and globalization.
Livestock population
The estimation emission of methane from enteric fermentation in livestock, methane and
nitrous oxide emission from manure management requires definitions of livestock species, sub-
categories and annual populations. Data on livestock species and categories is required for basic
characterization for livestock populations (IPCC Tier 1) and allows for the use of default emission
factor in estimating GHG emissions from livestock production. Cattle, buffalo, pigs, poultry and goats
are the main livestock in the four countries. In total, there are about 27.6 million beef cattle in the four
countries. Indonesia keeps around 5% and Vietnam keeps around 20% of the total beef cattle
population. The number of dairy cattle is fewer than that of beef cattle, 1.46 million compared to
about 27.4 million. Thailand and Indonesia keep around 80% dairy cattle of the four countries. The
four countries keep fewer number of buffaloes than cattle, around 5.4 million in 2011, in which
Vietnam keeps around 50% of the total population, while Malaysia keeps a few buffaloes, about 120
thousand buffaloes. Sheep and goats are also important livestock in the region. Similar to other
vii
livestock, Indonesia keeps a main part of the total population, around 97% for goat and 86% for
sheep.
The livestock population of the four countries was obtained from national statistical offices.
They were one-time animal inventory data. Estimation of annual average livestock population (AAP),
especially for growing livestock population such as growing pigs, beef cattle, broilers… is essential to
improve the accuracy of GHG emission estimation. This requires information in the number of days
animals are alive in a year or the duration of each batch or each production cycle. Further data
collection is required, because the data provided by Vietnam, Malaysia and Indonesia partners did not
have such information.
Livestock population by categories and subcategories and production scale
Beef (cow and buffalo) are mainly raised under smallholder production systems (<10 cows
and buffaloes/farm). The percentages of farms falling into smallholder farms are around 78, 90 and
99%, respectively for Vietnam, Indonesia and Thailand. Large-scale beef farms in South East Asian
countries occupy a small percentage in the total number of beef farms, from 0.03 to 3%. In contrary to
Vietnam, Indonesia and Thailand, most of beef farms in Malaysia are medium farms with about 10-50
beef/farm. Local breeds are dominant in the smallholder farms such as Yellow local cattle in Vietnam,
Bali and Madura cattle in Indonesia, Native and Native crossbred in Thailand. Exotic and crossbred
breeds are mainly raised in medium and large farms.
The definition of pig farms based on production scale was not similar among the four
countries. The meaning of smallholder, medium and large farms in terms of production scale were
different among countries. In addition, information on the number of days pigs are alive in a year or in
a production cycle in each farm type is not available. This makes difficult to estimate AAP of each
farm type, and then estimation and comparison of GHG emission from each farm type.
Methane emission from enteric fermentation
To increase the certainty of GHG emission estimation from enteric fermentation and manure
management (IPCC Tier 2 and 3), data on livestock body weight, productivity, and energy intake and
manure management practices is required.
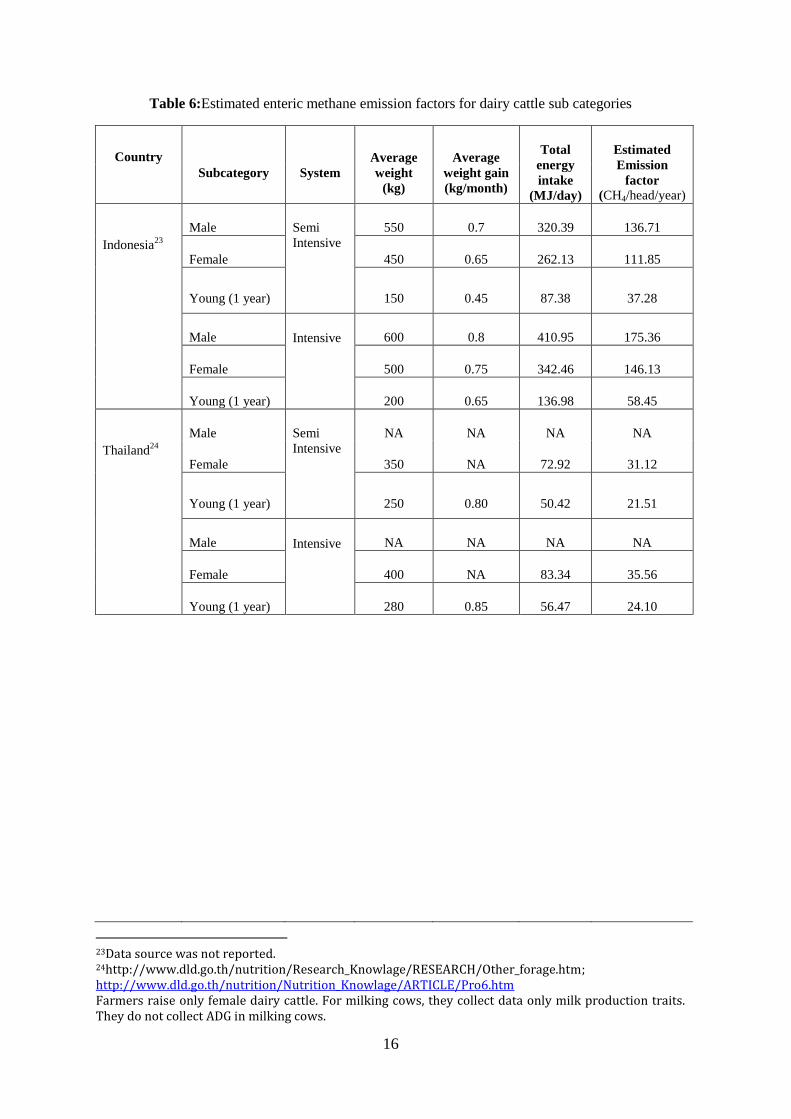
For dairy cattle, the four partner countries (Vietnam, Thailand, Indonesia and Malaysia) did
not provide information on milk yield per day and fat content. According to IPCC (2006), the
emission factor for dairy in Asia is 68 kg CH4/head/year and the average milk production/head/year is
800 kg. Information on milk yield, fat content of dairy in the condition of the four countries should be
collected to compare with the default value of IPCC (2006) or estimate emission factor for dairy in
each country in particular and in the South East Asia in general (IPCC Tier 3). Information on body
weight and weight gain, daily energy intake (MJ/day) of dairy cattle in Malaysia is not provided, for
other countries, they are presented in table 6. Dairy breeds in Vietnam, Thailand and Indonesia are
crossbred and exotic breeds between local and exotic breeds, they are mainly raised in semi intensive
and intensive production systems. In Vietnam and Indonesia, intensive production systems refer to
animals kept in pens all time and feed (grass and concentrate) brought to animals. Animals may be
allowed some exercise time around pens. The meaning of intensive dairy production in Thailand was
not described.
In the South East Asian countries, beef cattle are raised in extensive, semi-intensive and
intensive production systems. Local breeds are normally raised in extensive production systems.
Local breeds have a small body size from 160-260 kg and a low daily weight again, from 0.1 to 0.3
kg/day (Table 7). Exotic beef breeds and crossbreds between exotic and local breeds are raised in
semi-intensive and intensive production systems with average daily weight gain from 0.4 to 1.0
kg/day.
viii
The average total energy intake of various beef cattle subcategories in the four countries is
80.19 (MJ/day), however there is a huge variation between beef cattle subcategories and between
countries (standard deviation is 69.82). Based on the total energy intake (MJ/day), the methane
emission factor was estimated according to the IPCC (2006) method. The result showed that the
average emission factor for cattle other than beef is 23.64 (standard deviation is 16.61), which is big
deviation from the default IPCC emission factor Asia. There is a huge variation of the estimated
emission factors between different beef cattle sub-categories and between countries. The main reason
is the huge variation in the total energy intake. Further data collection for estimating emission factors
of different livestock subcategories in each country is required to improve the certainty of the
emission factors.
Methane emission from manure management
The main factors affecting CH4 emissions are related to the amount of manure produced and
the portion of the manure that is decomposed anaerobically. The former depends on the rate of waste
production per animal and the number of animals, the latter on how manure is managed and, how
much manure is handed under each manure management system. The temperature and retention time
of the storage unit greatly influences the amount of methane produced.
The simplest method of estimating methane emission from manure management is using
IPCC Tier 1 method with available default emission factors for livestock and livestock subcategories.
These emission factors present the range in manure volatile solids content and in manure management
practices used in each region, as well as difference in emission due to temperature. When we use the
Tier 1 method to estimate methane emission from manure management, we should review variables of
the country or region and compare to the variables, which were used to develop emission factors by
IPCC (2006).
N2O emission from manure management
There are both direct and indirect N2O emissions from livestock manure. The former occurs
via combined nitrification and denitrification of nitrogen content in the manure. The latter results from
volatile nitrogen losses that occur primarily in the form of ammonia and NOx.
To estimate direct N2O emission from manure management, we need information on nitrogen
excretion rate per head for each livestock category or subcategory, and information on manure
management practices – the faction of total nitrogen excretion for each livestock category or
subcategory as managed under each management system. However, collected information from the
four countries did not have the latter information. Therefore, it is was not possible to estimate N2O
emission factors from each manure management system and for comparison with the default N2O
emission factors proposed by IPCC (2006). Further studies or data collection on manure management
practices and N partition of each livestock category and sub-category is necessary to develop N2O
emission factor for each country (Tier 2).
To estimate indirect N2O emission from manure management, we need information on the
two factions of N losses due to volatilization and leaching and two indirect N2O emissions factors
associated with these losses (EF4 and EF5). The collected information collected from the four
countries did not allow calculating the two fractions of N losses. To improve the certainty of
estimation, each country is encouraged to develop EF4 and EF5 rather than using the default values of
IPCC (2006), however the four countries did not have information on ammonia and NOx emission to
the air from manure in each manure management system, it is therefore necessary to conduct studies
on ammonia and NOx emission and N leaching from different manure management system.
ix
GHG emission from enteric fermentation and manure management of livestock in South East
Asian countries by using IPCC default emission factors
Methane emissions (t/y) from domestic livestock enteric fermentation of the four countries in
2011 is shown in Table 11. This estimation is based tier 1 method, using IPCC default emission
factors. It can be seen from the table that Indonesia occupies about 52.7% total methane emission
from livestock enteric fermentation with around 969,275 tone/year. It is reasonable, because Indonesia
has a large livestock population, especially beef cattle, sheep and goat compared to other countries in
the region. Methane emission from livestock enteric fermentation of Vietnam, Thailand and Malaysia
occupies 23.5, 21.2 and 2.5% of total methane emissions from enteric fermentation of the four
countries, respectively (Figure 3). Malaysia has a very low methane emission from livestock domestic
fermentation due to their small livestock population.
Manure is also an important source of methane production and emission. It can be seen from
Table 12 that methane emission from manure management in Vietnam occupies about 50% of the
total methane emission from manure management of the four countries. This can be explained,
because Vietnam has the largest pig population compared to other countries in the region, around 27
million compared to 1.8, 7.5 and 11 millions pigs of Malaysia, Indonesia and Thailand, respectively.
In addition, emission factor for pig manure management is the second highest after dairy cattle.
Methane emission from pig manure management occupies about 85% in total methane emission from
livestock manure management in Vietnam. To reduce overall methane emission from livestock
production in Vietnam, reducing methane emission from manure should be given priority.
Livestock manure management in Thailand occupies about 25% of the total methane emission
from manure management of the four countries. Similar to Vietnam, pig manure management
occupies about 70% of total methane emission from livestock manure management in Thailand. Thus
improved pig manure management to reduce methane emission from livestock production should be a
prioritized option.
Livestock inventory improvement and biases reduction in regional emission estimates
The information on the contribution of livestock production to the total GHG emission and
the main sources of GHG emission in the four countries is shown in Table 14. It can be seen from the
table that livestock production in Vietnam contributes up to 45% of total GHG emission of the
country, however they are very small in the other countries, about 12%, 2% and 2% in Thailand,
Malaysia and Indonesia, respectively. The largest sources of GHG emission from livestock production
are enteric fermentation and manure management. In the four countries, livestock with main emission
from manure management are pigs, poultry, cattle and buffaloes while livestock with main emission
from enteric fermentation are cattle, goat and sheep.
Conclusions
To improve the certainty of GHG emission estimates, the four countries should
- Collect data and estimate annual average livestock population (AAP) for different livestock
categories and sub-categories
- Further characterize livestock categories and sub-categories in terms of population,
productivity…
- Further characterize livestock production systems of different livestock categories and
subcategories in terms of scale, feed and feeding, management….
- Further characterize manure management systems of different livestock categories and
subcategories in the sense that the amount of volatile solids, nitrogen partitioned in to
different manure management systems is quantified…
- Study ammonia and NOx emission and N leaching from different manure management
systems of different livestock categories and sub-categories
x
- There is a high variation between livestock subcategories and between countries in terms of
estimated methane emission factors (both enteric fermentation and manure management) and
there is a high deviation from IPCC default emission factors. Thus, it is necessary to develop
specific emission factors for each country. This will increase the certainty of the estimation.
- To be able to summarize/analyze the date, the four countries should develop and use a
template form which must be understood similarly by the partners in the four countries.
xi
Abbreviations and acronyms
GHG Green House Gas
LRG Livestock Research Group
CO2 Carbon Dioxide
CH4 Methane
N2O Nitrous Oxide
LCA Life Cycle Assessment
IPCC Intergovernmental Panel on Climate Change
GDP Gross Domestic Product
MJ Megajoule
MCR Methane Conversion ratio
DLD Department of Livestock Development
ADG Average Daily Gain
SF6 Sulfur Hexaflouride
IVGPT in vitro gas production technique
UFAs Unsaterated Fatty Acids
ONEP Office of Natural Resources and Environmental Policy and Planning
CDM Clean Development Mechanism
NRC Nutrition Resource Centre
RFI Residual Feed Intake
xii
FAO Food and Agriculture Organization of the United Nations
GC Gas Chromatography
CD Cyclodextrin
VFA Volatile Fatty Acids
VS Volatile Solid
EF Emission Factors
BOD Biochemical oxygen demand
EGAT Electricity Generating Authority of Thailand
CLS Crop Livestock System
GLC Government Linked Companies
GE Gross Energy
SBU Small Biogas Unit
MARDI Malaysia Agriculture Research and Development Institute
IAS Institute of Agricultural Sciences
1
Improved Inventory and Mitigation of Greenhouse Gases in Livestock Production in
Southeast Asia
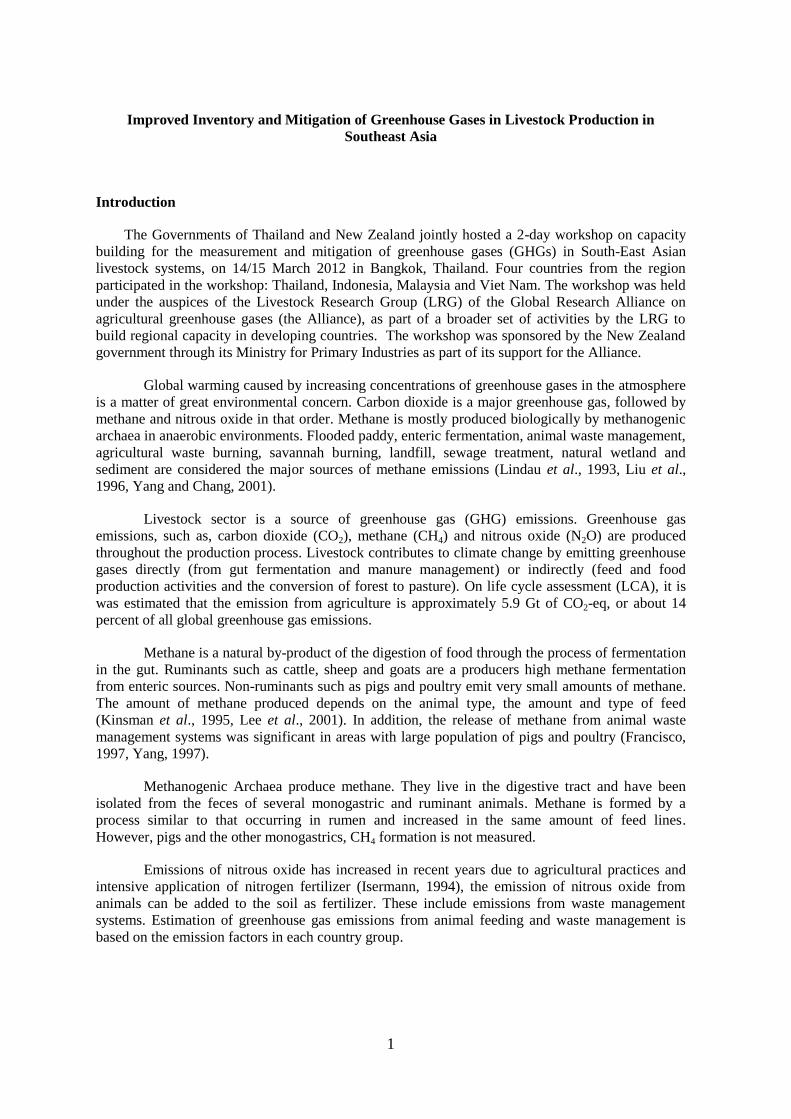
Introduction
The Governments of Thailand and New Zealand jointly hosted a 2-day workshop on capacity
building for the measurement and mitigation of greenhouse gases (GHGs) in South-East Asian
livestock systems, on 14/15 March 2012 in Bangkok, Thailand. Four countries from the region
participated in the workshop: Thailand, Indonesia, Malaysia and Viet Nam. The workshop was held
under the auspices of the Livestock Research Group (LRG) of the Global Research Alliance on
agricultural greenhouse gases (the Alliance), as part of a broader set of activities by the LRG to
build regional capacity in developing countries. The workshop was sponsored by the New Zealand
government through its Ministry for Primary Industries as part of its support for the Alliance.
Global warming caused by increasing concentrations of greenhouse gases in the atmosphere
is a matter of great environmental concern. Carbon dioxide is a major greenhouse gas, followed by
methane and nitrous oxide in that order. Methane is mostly produced biologically by methanogenic
archaea in anaerobic environments. Flooded paddy, enteric fermentation, animal waste management,
agricultural waste burning, savannah burning, landfill, sewage treatment, natural wetland and
sediment are considered the major sources of methane emissions (Lindau et al., 1993, Liu et al.,
1996, Yang and Chang, 2001).
Livestock sector is a source of greenhouse gas (GHG) emissions. Greenhouse gas
emissions, such as, carbon dioxide (CO2), methane (CH4) and nitrous oxide (N2O) are produced
throughout the production process. Livestock contributes to climate change by emitting greenhouse
gases directly (from gut fermentation and manure management) or indirectly (feed and food
production activities and the conversion of forest to pasture). On life cycle assessment (LCA), it is
was estimated that the emission from agriculture is approximately 5.9 Gt of CO2-eq, or about 14
percent of all global greenhouse gas emissions.
Methane is a natural by-product of the digestion of food through the process of fermentation
in the gut. Ruminants such as cattle, sheep and goats are a producers high methane fermentation
from enteric sources. Non-ruminants such as pigs and poultry emit very small amounts of methane.
The amount of methane produced depends on the animal type, the amount and type of feed
(Kinsman et al., 1995, Lee et al., 2001). In addition, the release of methane from animal waste
management systems was significant in areas with large population of pigs and poultry (Francisco,
1997, Yang, 1997).
Methanogenic Archaea produce methane. They live in the digestive tract and have been
isolated from the feces of several monogastric and ruminant animals. Methane is formed by a
process similar to that occurring in rumen and increased in the same amount of feed lines.
However, pigs and the other monogastrics, CH4 formation is not measured.
Emissions of nitrous oxide has increased in recent years due to agricultural practices and
intensive application of nitrogen fertilizer (Isermann, 1994), the emission of nitrous oxide from
animals can be added to the soil as fertilizer. These include emissions from waste management
systems. Estimation of greenhouse gas emissions from animal feeding and waste management is
based on the emission factors in each country group.
2
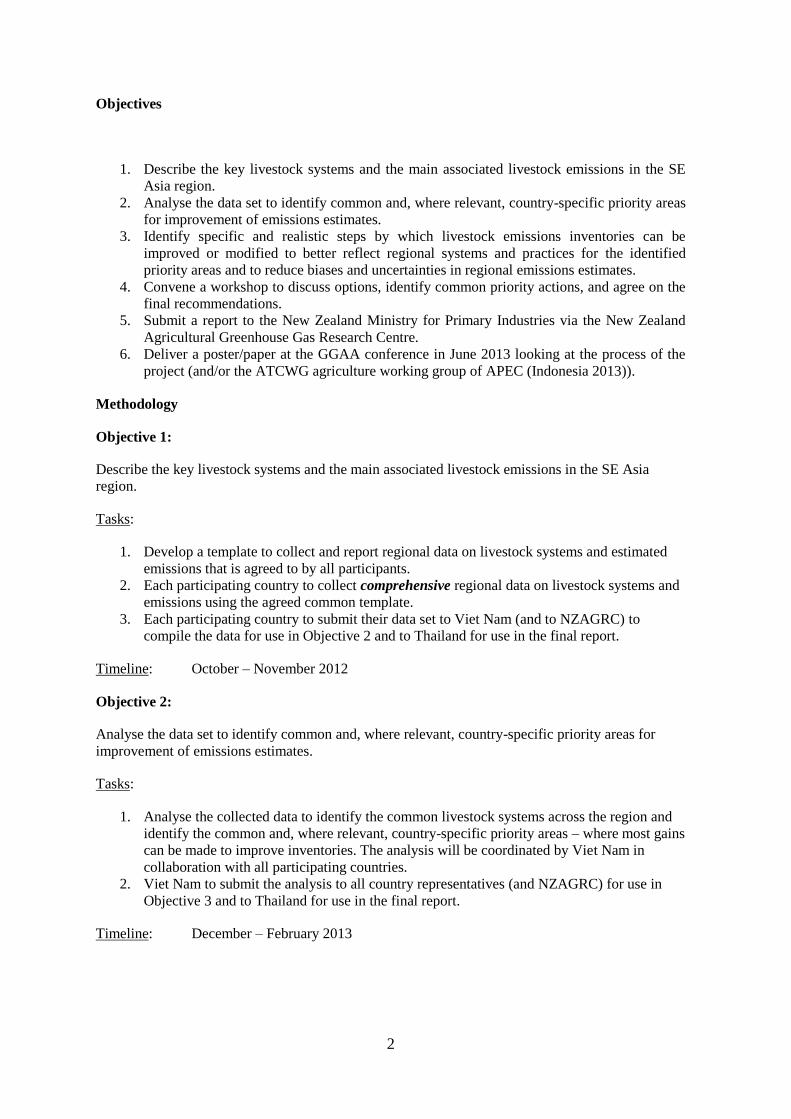
Objectives
1. Describe the key livestock systems and the main associated livestock emissions in the SE
Asia region.
2. Analyse the data set to identify common and, where relevant, country-specific priority areas
for improvement of emissions estimates.
3. Identify specific and realistic steps by which livestock emissions inventories can be
improved or modified to better reflect regional systems and practices for the identified
priority areas and to reduce biases and uncertainties in regional emissions estimates.
4. Convene a workshop to discuss options, identify common priority actions, and agree on the
final recommendations.
5. Submit a report to the New Zealand Ministry for Primary Industries via the New Zealand
Agricultural Greenhouse Gas Research Centre.
6. Deliver a poster/paper at the GGAA conference in June 2013 looking at the process of the
project (and/or the ATCWG agriculture working group of APEC (Indonesia 2013)).
Methodology
Objective 1:
Describe the key livestock systems and the main associated livestock emissions in the SE Asia
region.
Tasks:
1. Develop a template to collect and report regional data on livestock systems and estimated
emissions that is agreed to by all participants.
2. Each participating country to collect comprehensive regional data on livestock systems and
emissions using the agreed common template.
3. Each participating country to submit their data set to Viet Nam (and to NZAGRC) to
compile the data for use in Objective 2 and to Thailand for use in the final report.
Timeline: October – November 2012
Objective 2:
Analyse the data set to identify common and, where relevant, country-specific priority areas for
improvement of emissions estimates.
Tasks:
1. Analyse the collected data to identify the common livestock systems across the region and
identify the common and, where relevant, country-specific priority areas – where most gains
can be made to improve inventories. The analysis will be coordinated by Viet Nam in
collaboration with all participating countries.
2. Viet Nam to submit the analysis to all country representatives (and NZAGRC) for use in
Objective 3 and to Thailand for use in the final report.
Timeline: December – February 2013
3
Objective 3:
Identify specific and realistic steps by which livestock inventories can be improved or modified to
better reflect regional systems and practices for the identified priority areas and to reduce biases and
uncertainties in regional emissions estimates.
Tasks:
1. Each country to gather more detailed data for the common priority areas for each country
2. Each country will consider the following for their own country, and report on its findings
using an agreed template (to be developed with the assistance of NZAGRC):
i. Assess the appropriateness of the current methodologies used.
ii. Assess the validity of the IPCC default emission factors for the common priority areas.
iii. Assess availability and robustness of available activity data for current livestock
classification systems used in emissions inventories.
iv. Determine where the default classifications and Emission Factors differ most
significantly from the actual livestock systems present in the region.
v. Identify the options for improving activity data or the targeted measurement of
Emission Factors for more accurate emission estimates.
vi. Identify the available mitigation options and the current research being undertaken in
the identified priority areas.
vii. Identify potential funding streams and time frames for funding rounds (national funding
streams, university fellowship programmes, international/regional development banks
etc).
Timeframe: March – April 2013
Objective 4:
Convene a workshop to discuss options, identify common priority actions and agree on the final
recommendations for future work to enhance regional capacity, improve inventories and mitigation
of GHG emissions from livestock systems in south-east Asia.
Tasks:
1. Discuss the individual country priority areas and determine the regional priority framework
to obtain the balance between individual country priorities and regional priorities.
2. Discuss and agree on the final recommendations for the next stage of the project.
3. Agree the outline and content of the final report.
4. Develop a two-page concept note for each of the agreed priority areas.
5. A workshop report (compiled by NZAGRC) to be submitted to Thailand within 10 days for
use in the final report.
Timeline: April 2013
Objective 5:
Submit a report to the New Zealand Ministry for Primary Industries.
Tasks:
1. Thailand to draft a report for circulation to all country representatives for review and
comment.
2. All country representatives to approve the final report following modifications based on
feedback.
4
Timeline: May - June 2013
Objective 6:
Deliver a poster/paper at the GGAA conference in June 2013 looking at the process of this project.
General information of South East Asian countries
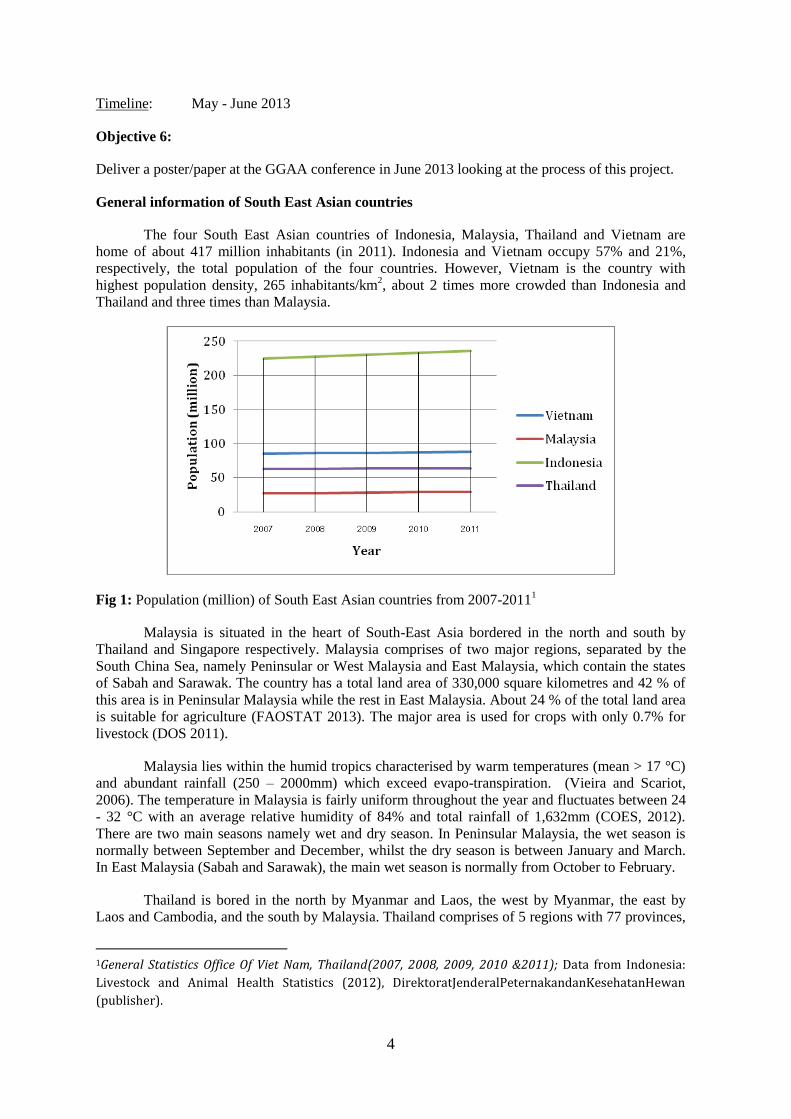
The four South East Asian countries of Indonesia, Malaysia, Thailand and Vietnam are
home of about 417 million inhabitants (in 2011). Indonesia and Vietnam occupy 57% and 21%,
respectively, the total population of the four countries. However, Vietnam is the country with
highest population density, 265 inhabitants/km2, about 2 times more crowded than Indonesia and
Thailand and three times than Malaysia.
Fig 1: Population (million) of South East Asian countries from 2007-20111
Malaysia is situated in the heart of South-East Asia bordered in the north and south by
Thailand and Singapore respectively. Malaysia comprises of two major regions, separated by the
South China Sea, namely Peninsular or West Malaysia and East Malaysia, which contain the states
of Sabah and Sarawak. The country has a total land area of 330,000 square kilometres and 42 % of
this area is in Peninsular Malaysia while the rest in East Malaysia. About 24 % of the total land area
is suitable for agriculture (FAOSTAT 2013). The major area is used for crops with only 0.7% for
livestock (DOS 2011).
Malaysia lies within the humid tropics characterised by warm temperatures (mean > 17 °C)
and abundant rainfall (250 – 2000mm) which exceed evapo-transpiration. (Vieira and Scariot,
2006). The temperature in Malaysia is fairly uniform throughout the year and fluctuates between 24
- 32 °C with an average relative humidity of 84% and total rainfall of 1,632mm (COES, 2012).
There are two main seasons namely wet and dry season. In Peninsular Malaysia, the wet season is
normally between September and December, whilst the dry season is between January and March.
In East Malaysia (Sabah and Sarawak), the main wet season is normally from October to February.
Thailand is bored in the north by Myanmar and Laos, the west by Myanmar, the east by
Laos and Cambodia, and the south by Malaysia. Thailand comprises of 5 regions with 77 provinces,
1General Statistics Office Of Viet Nam, Thailand(2007, 2008, 2009, 2010 &2011); Data from Indonesia:
Livestock and Animal Health Statistics (2012), DirektoratJenderalPeternakandanKesehatanHewan
(publisher).
5
Northern, Northeastern, Eastern, Central, and Southern part. The country has a total land area of
513,115 square kilometres. About 38% of the total land area is suitable for agriculture (Table 1). The
major area is used for crops. Livestocks population in Thailand are concentrated in the Northeastern
part of Thailand. Farmers in every part use local grasses, developed grasses, agricultural by-
products, and commercial feeds for feed supply. Agricultural by-product used are rice straw, corn
stem, corn leaves, sugar cane leaves, cassava leaves, pineapple coat, and palm oil by-product.
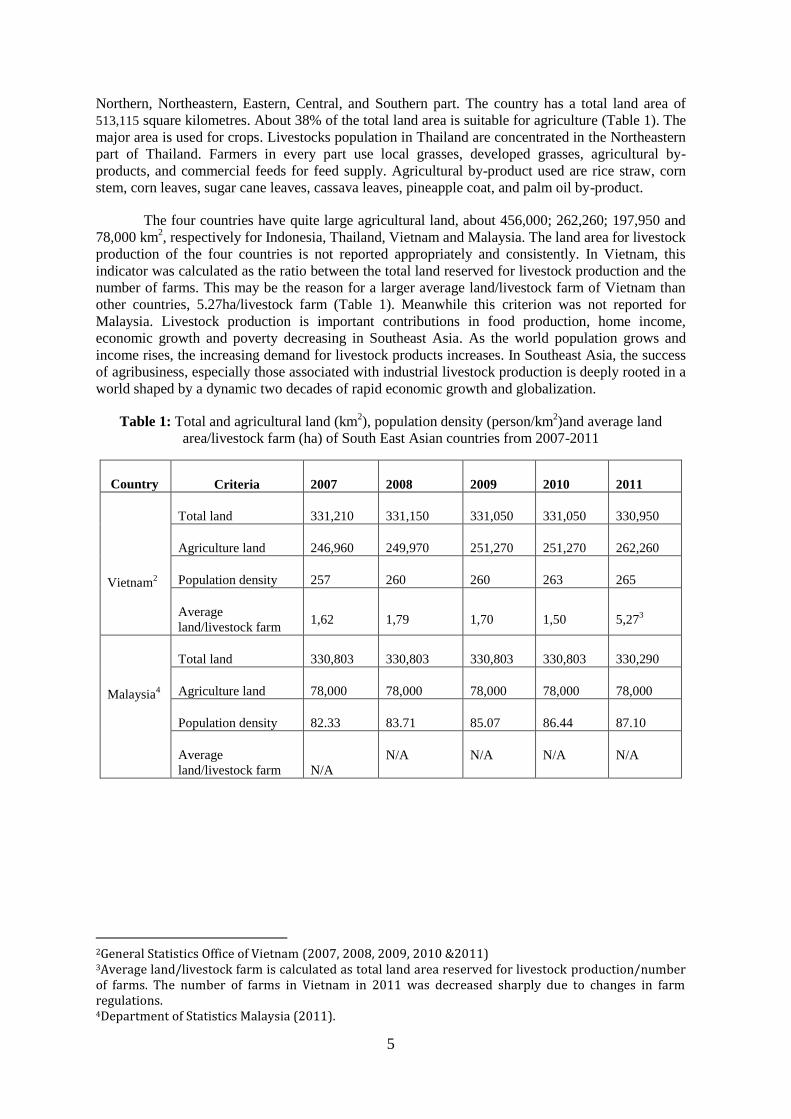
The four countries have quite large agricultural land, about 456,000; 262,260; 197,950 and
78,000 km2, respectively for Indonesia, Thailand, Vietnam and Malaysia. The land area for livestock
production of the four countries is not reported appropriately and consistently. In Vietnam, this
indicator was calculated as the ratio between the total land reserved for livestock production and the
number of farms. This may be the reason for a larger average land/livestock farm of Vietnam than
other countries, 5.27ha/livestock farm (Table 1). Meanwhile this criterion was not reported for
Malaysia. Livestock production is important contributions in food production, home income,
economic growth and poverty decreasing in Southeast Asia. As the world population grows and
income rises, the increasing demand for livestock products increases. In Southeast Asia, the success
of agribusiness, especially those associated with industrial livestock production is deeply rooted in a
world shaped by a dynamic two decades of rapid economic growth and globalization.
Table 1: Total and agricultural land (km2), population density (person/km
2)and average land
area/livestock farm (ha) of South East Asian countries from 2007-2011
Country Criteria 2007 2008 2009 2010 2011
Vietnam2
Total land 331,210 331,150 331,050 331,050 330,950
Agriculture land 246,960 249,970 251,270 251,270 262,260
Population density 257 260 260 263 265
Average
land/livestock farm 1,62 1,79 1,70 1,50 5,27
3
Malaysia4
Total land 330,803 330,803 330,803 330,803 330,290
Agriculture land 78,000 78,000 78,000 78,000 78,000
Population density 82.33 83.71 85.07 86.44 87.10
Average
land/livestock farm N/A
N/A N/A N/A N/A
2General Statistics Office of Vietnam (2007, 2008, 2009, 2010 &2011) 3Average land/livestock farm is calculated as total land area reserved for livestock production/number of farms. The number of farms in Vietnam in 2011 was decreased sharply due to changes in farm regulations. 4Department of Statistics Malaysia (2011).
6
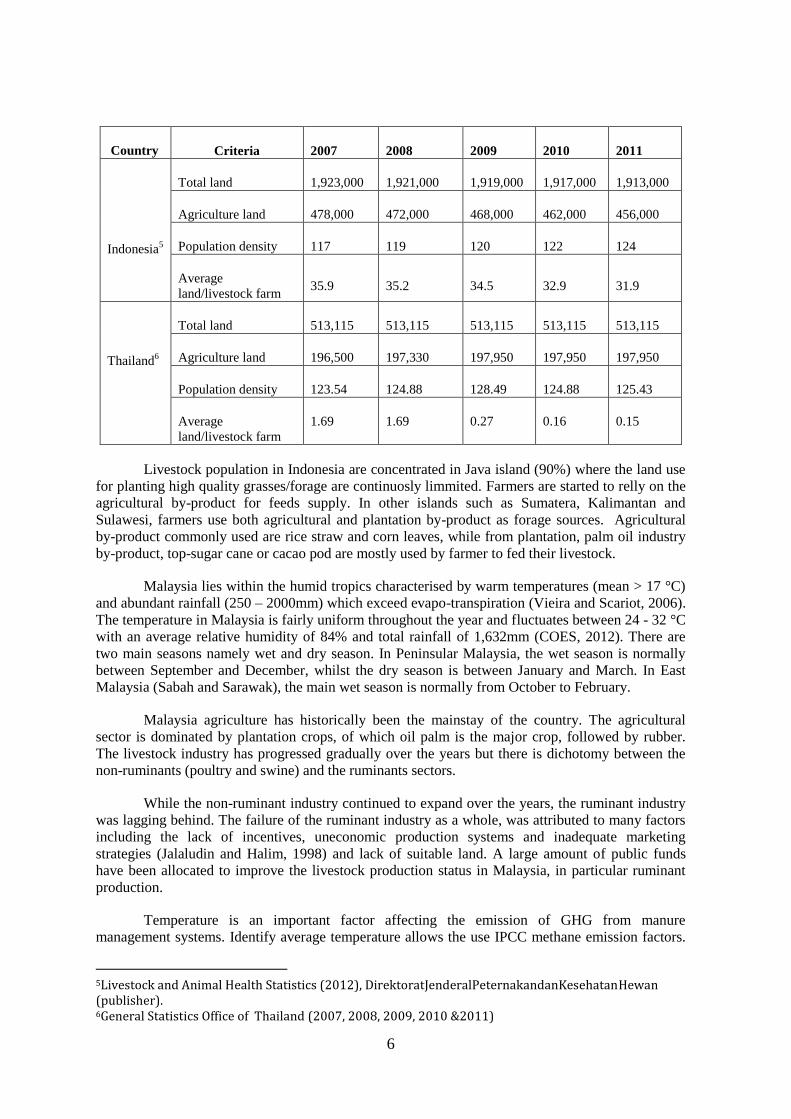
Country Criteria 2007 2008 2009 2010 2011
Indonesia5
Total land 1,923,000 1,921,000 1,919,000 1,917,000 1,913,000
Agriculture land 478,000 472,000 468,000 462,000 456,000
Population density 117 119 120 122 124
Average
land/livestock farm 35.9 35.2 34.5 32.9 31.9
Thailand6
Total land 513,115 513,115 513,115 513,115 513,115
Agriculture land 196,500 197,330 197,950 197,950 197,950
Population density 123.54 124.88 128.49 124.88 125.43
Average
land/livestock farm
1.69 1.69 0.27 0.16 0.15
Livestock population in Indonesia are concentrated in Java island (90%) where the land use
for planting high quality grasses/forage are continuosly limmited. Farmers are started to relly on the
agricultural by-product for feeds supply. In other islands such as Sumatera, Kalimantan and
Sulawesi, farmers use both agricultural and plantation by-product as forage sources. Agricultural
by-product commonly used are rice straw and corn leaves, while from plantation, palm oil industry
by-product, top-sugar cane or cacao pod are mostly used by farmer to fed their livestock.
Malaysia lies within the humid tropics characterised by warm temperatures (mean > 17 °C)
and abundant rainfall (250 – 2000mm) which exceed evapo-transpiration (Vieira and Scariot, 2006).
The temperature in Malaysia is fairly uniform throughout the year and fluctuates between 24 - 32 °C
with an average relative humidity of 84% and total rainfall of 1,632mm (COES, 2012). There are
two main seasons namely wet and dry season. In Peninsular Malaysia, the wet season is normally
between September and December, whilst the dry season is between January and March. In East
Malaysia (Sabah and Sarawak), the main wet season is normally from October to February.
Malaysia agriculture has historically been the mainstay of the country. The agricultural
sector is dominated by plantation crops, of which oil palm is the major crop, followed by rubber.
The livestock industry has progressed gradually over the years but there is dichotomy between the
non-ruminants (poultry and swine) and the ruminants sectors.
While the non-ruminant industry continued to expand over the years, the ruminant industry
was lagging behind. The failure of the ruminant industry as a whole, was attributed to many factors
including the lack of incentives, uneconomic production systems and inadequate marketing
strategies (Jalaludin and Halim, 1998) and lack of suitable land. A large amount of public funds
have been allocated to improve the livestock production status in Malaysia, in particular ruminant
production.
Temperature is an important factor affecting the emission of GHG from manure
management systems. Identify average temperature allows the use IPCC methane emission factors.
5Livestock and Animal Health Statistics (2012), DirektoratJenderalPeternakandanKesehatanHewan (publisher). 6General Statistics Office of Thailand (2007, 2008, 2009, 2010 &2011)
7
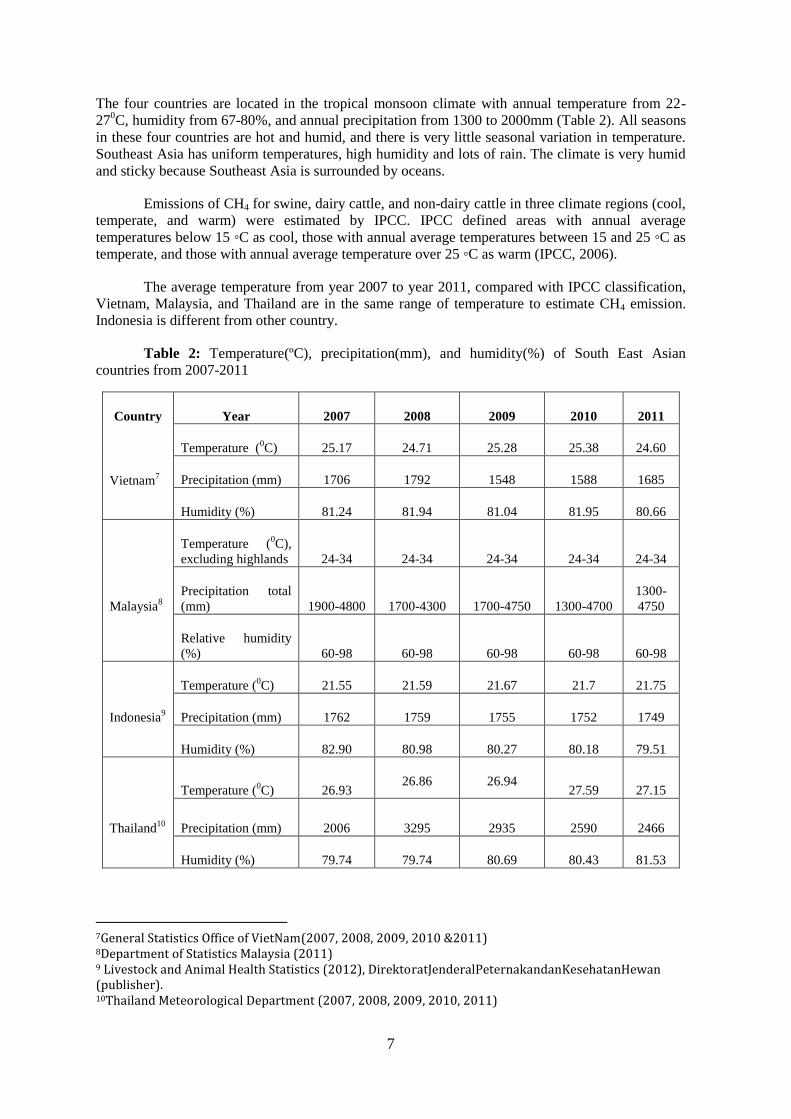
The four countries are located in the tropical monsoon climate with annual temperature from 22-
270C, humidity from 67-80%, and annual precipitation from 1300 to 2000mm (Table 2). All seasons
in these four countries are hot and humid, and there is very little seasonal variation in temperature.
Southeast Asia has uniform temperatures, high humidity and lots of rain. The climate is very humid
and sticky because Southeast Asia is surrounded by oceans.
Emissions of CH4 for swine, dairy cattle, and non-dairy cattle in three climate regions (cool,
temperate, and warm) were estimated by IPCC. IPCC defined areas with annual average
temperatures below 15 ◦C as cool, those with annual average temperatures between 15 and 25 ◦C as
temperate, and those with annual average temperature over 25 ◦C as warm (IPCC, 2006).
The average temperature from year 2007 to year 2011, compared with IPCC classification,
Vietnam, Malaysia, and Thailand are in the same range of temperature to estimate CH4 emission.
Indonesia is different from other country.
Table 2: Temperature(ºC), precipitation(mm), and humidity(%) of South East Asian
countries from 2007-2011
Country Year 2007 2008 2009 2010 2011
Vietnam7
Temperature (0C) 25.17 24.71 25.28 25.38 24.60
Precipitation (mm) 1706 1792 1548 1588 1685
Humidity (%) 81.24 81.94 81.04 81.95 80.66
Temperature (0C),
excluding highlands 24-34 24-34 24-34 24-34 24-34
Malaysia8
Precipitation total
(mm) 1900-4800 1700-4300 1700-4750 1300-4700
1300-
4750
Relative humidity
(%) 60-98 60-98 60-98 60-98 60-98
Temperature (0C) 21.55 21.59 21.67 21.7 21.75
Indonesia9 Precipitation (mm) 1762 1759 1755 1752 1749
Humidity (%) 82.90 80.98 80.27 80.18 79.51
Temperature (0C) 26.93
26.86 26.94 27.59 27.15
Thailand10
Precipitation (mm) 2006 3295 2935 2590 2466
Humidity (%) 79.74 79.74 80.69 80.43 81.53
7General Statistics Office of VietNam(2007, 2008, 2009, 2010 &2011) 8Department of Statistics Malaysia (2011) 9 Livestock and Animal Health Statistics (2012), DirektoratJenderalPeternakandanKesehatanHewan (publisher). 10Thailand Meteorological Department (2007, 2008, 2009, 2010, 2011)
8
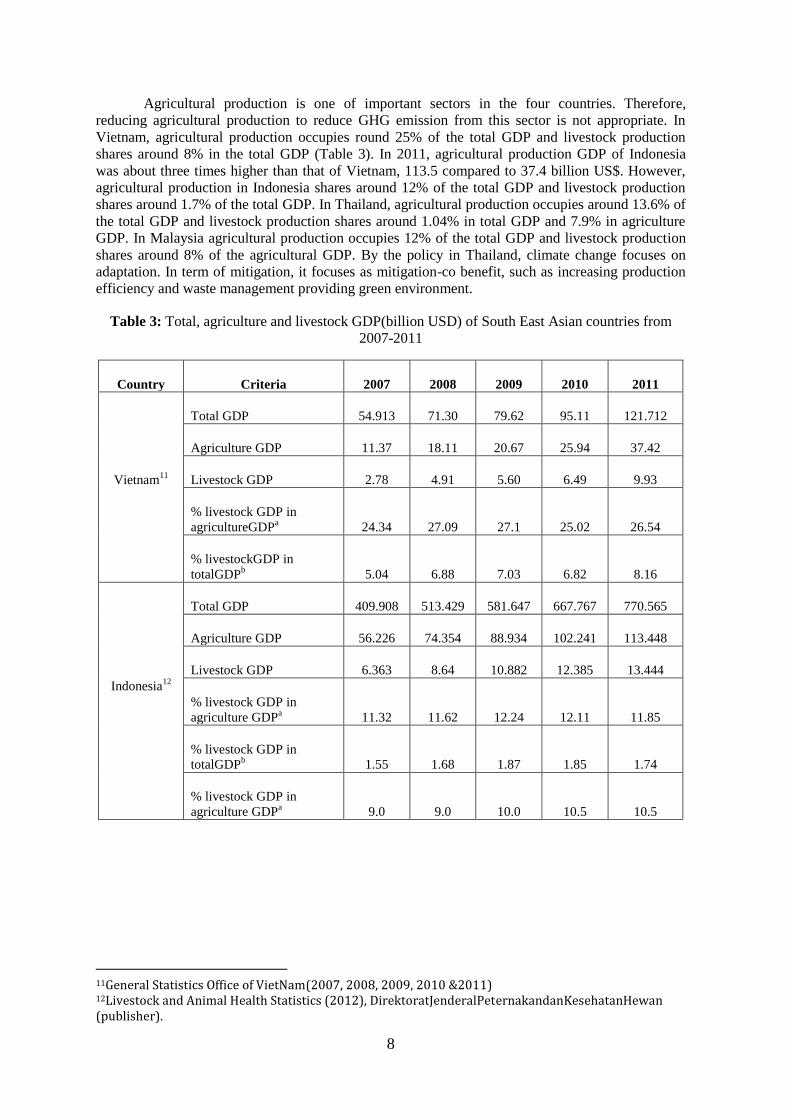
Agricultural production is one of important sectors in the four countries. Therefore,
reducing agricultural production to reduce GHG emission from this sector is not appropriate. In
Vietnam, agricultural production occupies round 25% of the total GDP and livestock production
shares around 8% in the total GDP (Table 3). In 2011, agricultural production GDP of Indonesia
was about three times higher than that of Vietnam, 113.5 compared to 37.4 billion US$. However,
agricultural production in Indonesia shares around 12% of the total GDP and livestock production
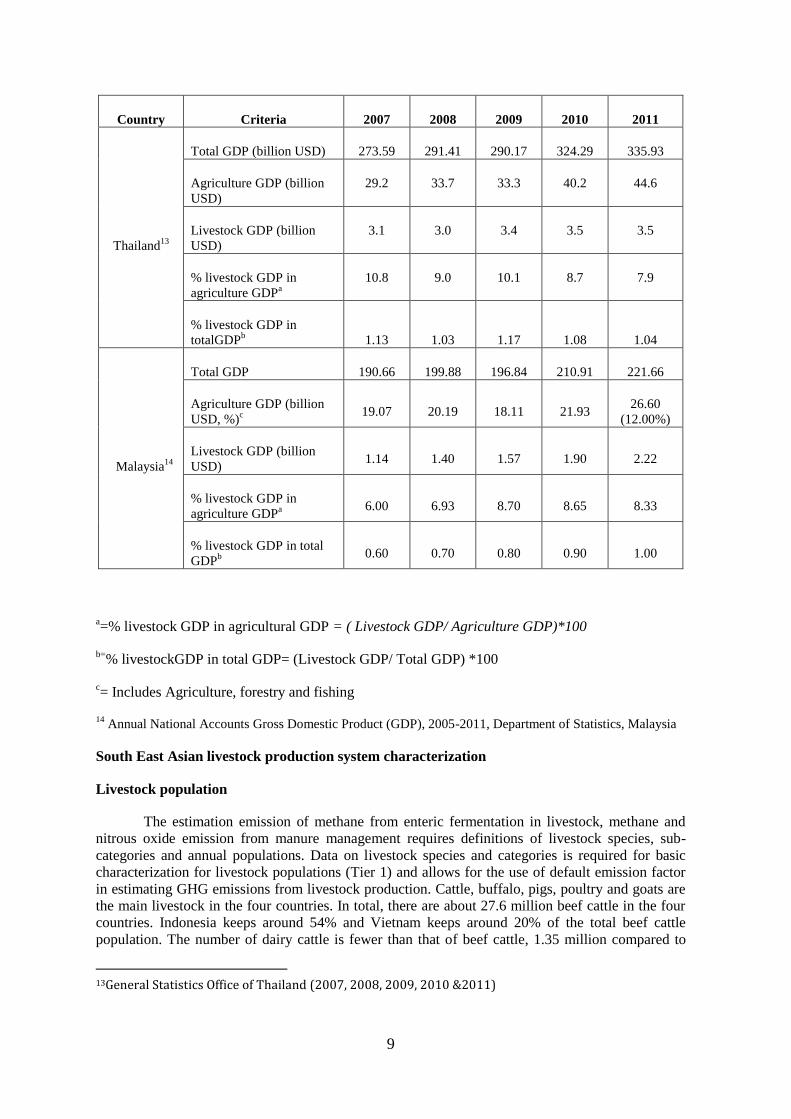
shares around 1.7% of the total GDP. In Thailand, agricultural production occupies around 13.6% of
the total GDP and livestock production shares around 1.04% in total GDP and 7.9% in agriculture
GDP. In Malaysia agricultural production occupies 12% of the total GDP and livestock production
shares around 8% of the agricultural GDP. By the policy in Thailand, climate change focuses on
adaptation. In term of mitigation, it focuses as mitigation-co benefit, such as increasing production
efficiency and waste management providing green environment.
Table 3: Total, agriculture and livestock GDP(billion USD) of South East Asian countries from
2007-2011
Country Criteria 2007 2008 2009 2010 2011
Vietnam11
Total GDP 54.913 71.30 79.62 95.11 121.712
Agriculture GDP 11.37 18.11 20.67 25.94 37.42
Livestock GDP 2.78 4.91 5.60 6.49 9.93
% livestock GDP in
agricultureGDPa
24.34 27.09 27.1 25.02 26.54
% livestockGDP in
totalGDPb
5.04 6.88 7.03 6.82 8.16
Indonesia12
Total GDP 409.908 513.429 581.647 667.767 770.565
Agriculture GDP 56.226 74.354 88.934 102.241 113.448
Livestock GDP 6.363 8.64 10.882 12.385 13.444
% livestock GDP in
agriculture GDPa
11.32 11.62 12.24 12.11 11.85
% livestock GDP in
totalGDPb
1.55 1.68 1.87 1.85 1.74
% livestock GDP in
agriculture GDPa
9.0 9.0 10.0 10.5 10.5
11General Statistics Office of VietNam(2007, 2008, 2009, 2010 &2011) 12Livestock and Animal Health Statistics (2012), DirektoratJenderalPeternakandanKesehatanHewan (publisher).
9
Country Criteria 2007 2008 2009 2010 2011
Thailand13
Total GDP (billion USD) 273.59 291.41 290.17 324.29 335.93
Agriculture GDP (billion
USD)
29.2 33.7 33.3 40.2 44.6
Livestock GDP (billion
USD)
3.1 3.0 3.4 3.5 3.5
% livestock GDP in
agriculture GDPa
10.8 9.0 10.1 8.7 7.9
% livestock GDP in
totalGDPb 1.13 1.03 1.17 1.08 1.04
Malaysia14
Total GDP 190.66 199.88 196.84 210.91 221.66
Agriculture GDP (billion
USD, %)c
19.07 20.19 18.11 21.93 26.60
(12.00%)
Livestock GDP (billion
USD) 1.14 1.40 1.57 1.90 2.22
% livestock GDP in
agriculture GDPa
6.00 6.93 8.70 8.65 8.33
% livestock GDP in total
GDPb
0.60 0.70 0.80 0.90 1.00
a=% livestock GDP in agricultural GDP = ( Livestock GDP/ Agriculture GDP)*100
b=% livestockGDP in total GDP= (Livestock GDP/ Total GDP) *100
c= Includes Agriculture, forestry and fishing
14 Annual National Accounts Gross Domestic Product (GDP), 2005-2011, Department of Statistics, Malaysia
South East Asian livestock production system characterization
Livestock population
The estimation emission of methane from enteric fermentation in livestock, methane and
nitrous oxide emission from manure management requires definitions of livestock species, sub-
categories and annual populations. Data on livestock species and categories is required for basic
characterization for livestock populations (Tier 1) and allows for the use of default emission factor
in estimating GHG emissions from livestock production. Cattle, buffalo, pigs, poultry and goats are
the main livestock in the four countries. In total, there are about 27.6 million beef cattle in the four
countries. Indonesia keeps around 54% and Vietnam keeps around 20% of the total beef cattle
population. The number of dairy cattle is fewer than that of beef cattle, 1.35 million compared to
13General Statistics Office of Thailand (2007, 2008, 2009, 2010 &2011)
10
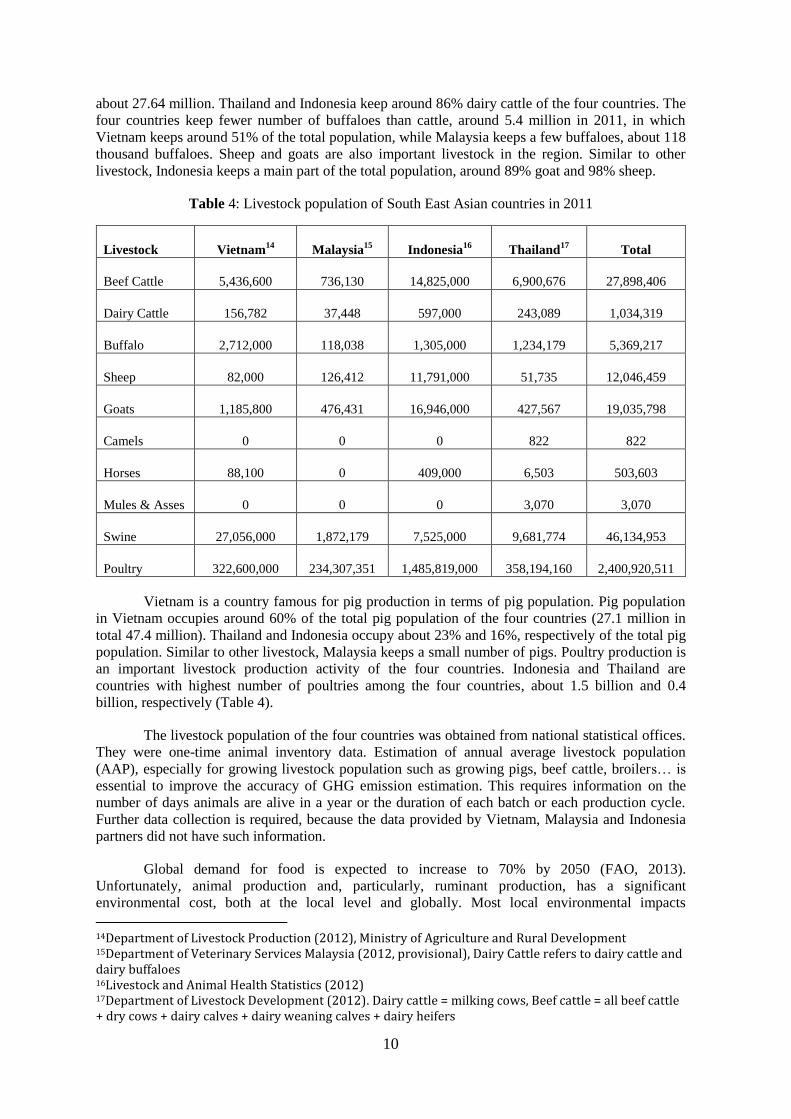
about 27.64 million. Thailand and Indonesia keep around 86% dairy cattle of the four countries. The
four countries keep fewer number of buffaloes than cattle, around 5.4 million in 2011, in which
Vietnam keeps around 51% of the total population, while Malaysia keeps a few buffaloes, about 118
thousand buffaloes. Sheep and goats are also important livestock in the region. Similar to other
livestock, Indonesia keeps a main part of the total population, around 89% goat and 98% sheep.
Table 4: Livestock population of South East Asian countries in 2011
Livestock Vietnam14
Malaysia15
Indonesia16
Thailand17
Total
Beef Cattle 5,436,600 736,130 14,825,000 6,900,676 27,898,406
Dairy Cattle 156,782 37,448 597,000 243,089 1,034,319
Buffalo 2,712,000 118,038 1,305,000 1,234,179 5,369,217
Sheep 82,000 126,412 11,791,000 51,735 12,046,459
Goats 1,185,800 476,431 16,946,000 427,567 19,035,798
Camels 0 0 0 822 822
Horses 88,100 0 409,000 6,503 503,603
Mules & Asses 0 0 0 3,070 3,070
Swine 27,056,000 1,872,179 7,525,000 9,681,774 46,134,953
Poultry 322,600,000 234,307,351 1,485,819,000 358,194,160 2,400,920,511
Vietnam is a country famous for pig production in terms of pig population. Pig population
in Vietnam occupies around 60% of the total pig population of the four countries (27.1 million in
total 47.4 million). Thailand and Indonesia occupy about 23% and 16%, respectively of the total pig
population. Similar to other livestock, Malaysia keeps a small number of pigs. Poultry production is
an important livestock production activity of the four countries. Indonesia and Thailand are
countries with highest number of poultries among the four countries, about 1.5 billion and 0.4
billion, respectively (Table 4).
The livestock population of the four countries was obtained from national statistical offices.
They were one-time animal inventory data. Estimation of annual average livestock population
(AAP), especially for growing livestock population such as growing pigs, beef cattle, broilers… is
essential to improve the accuracy of GHG emission estimation. This requires information on the
number of days animals are alive in a year or the duration of each batch or each production cycle.
Further data collection is required, because the data provided by Vietnam, Malaysia and Indonesia
partners did not have such information.
Global demand for food is expected to increase to 70% by 2050 (FAO, 2013).
Unfortunately, animal production and, particularly, ruminant production, has a significant
environmental cost, both at the local level and globally. Most local environmental impacts
14Department of Livestock Production (2012), Ministry of Agriculture and Rural Development 15Department of Veterinary Services Malaysia (2012, provisional), Dairy Cattle refers to dairy cattle and dairy buffaloes 16Livestock and Animal Health Statistics (2012) 17Department of Livestock Development (2012). Dairy cattle = milking cows, Beef cattle = all beef cattle + dry cows + dairy calves + dairy weaning calves + dairy heifers
11
associated with the operation of the concentration of air, land or water contaminated with nitrous
oxide and phosphorus compounds in the world is largely due to the contribution of intensive
production and wide emissions of greenhouse gases (GHG). To meet demand, the worldwide
production of meat and milk is projected to double. This strong growth in meat production is driven
not only by increasing the population, but also by the increasing demand for animal products by
other sectors of the population that are becoming more affluent.
Livestock population by categories and subcategories and production scale
The Tier 2 of livestock characterization requires the definition of livestock subcategories,
livestock population by subcategories and their production systems. Table 5 presents the
representative livestock categories of the four countries. Information on the number of livestock per
subcategory (such as growing pigs, fattening pigs, sows) is not available. Further data collection on
livestock population by categories and subcategories is required.
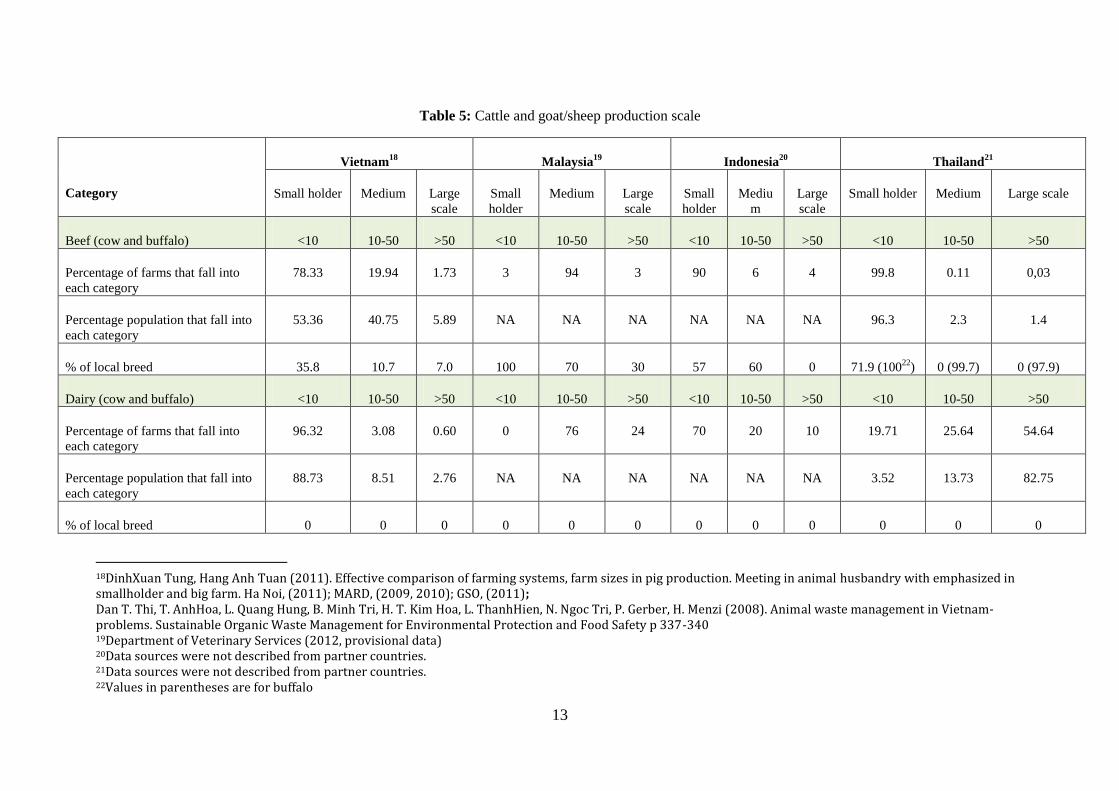
It can be seen from Table 5 that beef (cow and buffalo) are mainly raised in smallholder
production systems (<10 cows and buffaloes/farm). The percentages of farms falling into
smallholder farms are around 78, 90 and 99%, respectively for Vietnam, Indonesia and Thailand.
Large-scale beef farms in South East Asian countries occupy a small percentage in the total number
of beef farms, from 0.03 to 3%. In contrary to Vietnam, Indonesia and Thailand, most of beef farms
in Malaysia are medium with about 10-50 head/farm. Local breeds are dominant in the smallholder
farms such as Yellow local cattle in Vietnam, Bali and Madura cattle in Indonesia, Native and
Native crossbred in Thailand. Exotic and crossbred breeds are mainly raised in medium and large
farms.
In Vietnam and in Indonesia, dairy cattle are mainly raised in smallholder farms. Ninety-six
and 70% of dairy farms in Vietnam and Indonesia, respectively, are smallholder farms. In Thailand
and Malaysia dairy cattle are mainly raised in medium and large-scale farms. Dairy cattle
households had an important role in the development of dairy industry of Vietnam because over
80% of the country's dairy herds are in the hand of the smallholder households. Most of the
households keep dairy cattle as a small scale entity. In total 19,639 dairy farms in Vietnam are small
farms (90.4%) with between 1 to 5 dairy heads/farm. The “Holsteinisation” program of crossbred
Sindhi stock using artificial insemination (AI) has been executed to accelerate the milk production
of the country since the 90’s. Simultaneously live Holstein Friesian (HF) cows from temperate
countries have also been imported. Today the Vietnamese dairy population consists of 14% pure
HF, 80% of crossbred HF and the remaining 6% are crossbred Sindhi and other breeds (NIAH,
2010). The “Holsteinisation” has contributed to an increased milk yield, from 1,200
kg/cow/lactation to 3,400 kg/cow/lactation. However, cows with a high level of HF inheritance
cannot exhibit their full genetic potential in the tropics due to poor management and feed quality and
environmental stress factors. Moreover, although the increase of HF inheritance can increase milk
yield, it can also result in high mortality and reduced fertility. The major dairy population in
Thailand is Tropical Holstein Friesian that upgrade local cattle with Holstein by dairy national
development program with 4,500 kg milk/lactation. Total dairy population of Thailand is 560,659
heads with 243,089 milking cows and 20,645 farmers. Major group of them are old farmers that
have evolved from medium and large farms (DLD, 2012).
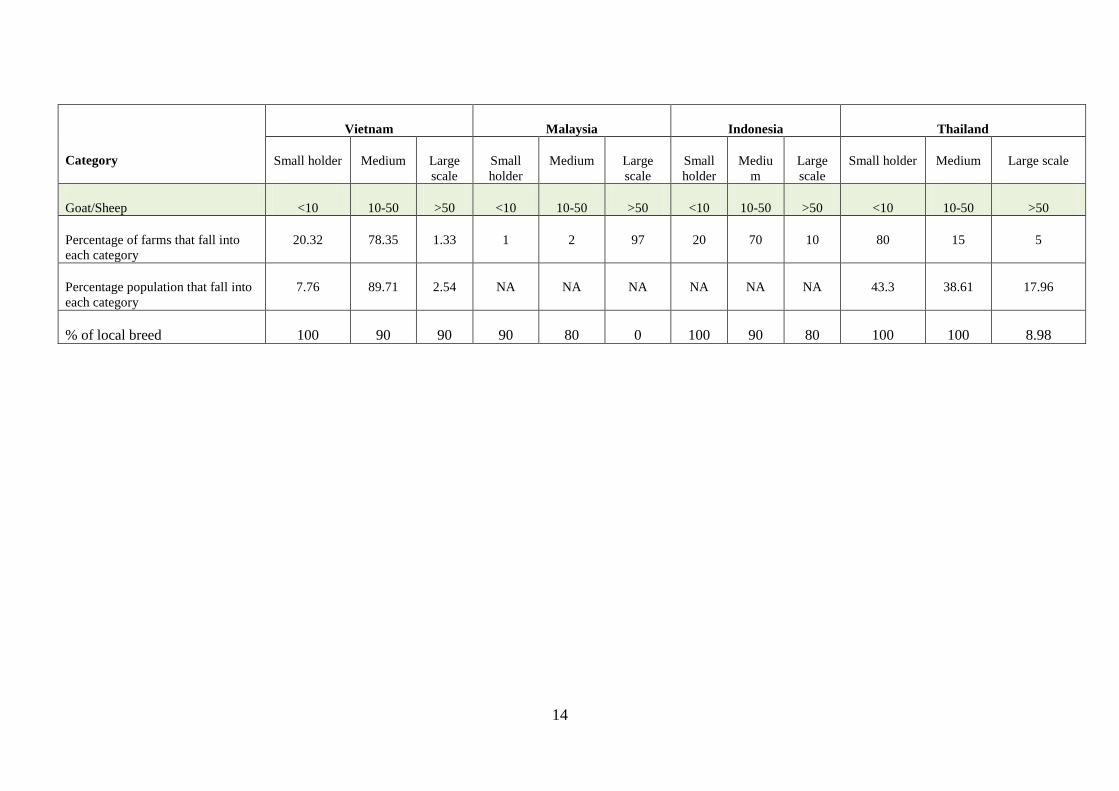
Most of goat/sheep in Vietnam, Indonesia and Thailand are reared on smallholder and
medium farms while 97% of goat/sheep farms in Malaysia are raised in large-scale farms. Local
breeds are dominant in goat/sheep production systems in the four countries.
The definition of pig farms based on production scale was not similar among the four
countries. The meaning of smallholder, medium and large farms in terms of production scale were
different among countries. In addition, information on the number of days pigs are alive in a year or
in a production cycle in each farm type is not available. This makes difficult to estimate AAP of
each farm type, and then estimation and comparison of GHG emission from each farm type.
12
Vietnam’s swine production is composed of mostly backyard/household operations or small
farms. In 2006, about 85% to 90% of swine were raised in backyard/household operations, while the
remainder were raised at larger, commercial farms. In Vietnam, farms are considered commercial if
they have 20 sows. While small farms account for 85% to 90% of the total pig population, they
produce only about 75% to 80% of the pork supply. Now, the pig system was only concentrated in
small and middle farm with opened house. The major breed is exotic breed.
In Indonesia, 50% pig farms have a production scale from 250 to 450 pigs/farm, 45% pig
farms have a production scale of more than 450 pigs/farm, and 5% of pig farms have a production
scale less than 250 pigs/farm.
In Malaysia, 45% of pig farms have a production scale of from 1000-5000 pigs/farm,
another 45% pig farms have a production scale of less than 1000 pig/farm and 10% pig farms have a
production scale of more than 10000 pigs/farm.
In Thailand, the classification of pig production scale is more detailed than the other three
countries. For breeder, 99.7% of pig farms have a production scale of less than 500 pigs/farm,
0.27% pig farms have a production scale of from 500-5000 pigs/farm, and 0.04% pig farms have a
production scale of more than 5000 pigs/farm. For fattening, about 97.42% pig farms have a
production scale of less than 500 pigs/farm, 1.48% pigs farms have a production scale of from 500-
5000 pigs/farm and 1.1% pig farms have a production scale of more than 5000 pigs/farm.
Similar to pigs, the definition of poultry production systems is not consistent among the four
countries. In addition, information on sub-categories of poultry such as broiler, layer, chicken or
ducks… is not available. Furthermore, information on the number of days poultry are alive in each
batch of each production system is not available. This makes difficult to establish Tier 2 livestock
characterization in terms of GHG emission estimation.
13
Table 5: Cattle and goat/sheep production scale
Category
Vietnam18
Malaysia19
Indonesia20
Thailand21
Small holder Medium Large
scale
Small
holder
Medium Large
scale
Small
holder
Mediu
m
Large
scale
Small holder Medium Large scale
Beef (cow and buffalo) <10 10-50 >50 <10 10-50 >50 <10 10-50 >50 <10 10-50 >50
Percentage of farms that fall into
each category
78.33 19.94 1.73 3 94 3 90 6 4 99.8 0.11 0,03
Percentage population that fall into
each category
53.36 40.75 5.89 NA NA NA NA NA NA 96.3 2.3 1.4
% of local breed 35.8 10.7 7.0 100 70 30 57 60 0 71.9 (10022
) 0 (99.7) 0 (97.9)
Dairy (cow and buffalo) <10 10-50 >50 <10 10-50 >50 <10 10-50 >50 <10 10-50 >50
Percentage of farms that fall into
each category
96.32 3.08 0.60 0 76 24 70 20 10 19.71 25.64 54.64
Percentage population that fall into
each category
88.73 8.51 2.76 NA NA NA NA NA NA 3.52 13.73 82.75
% of local breed 0 0 0 0 0 0 0 0 0 0 0 0
18DinhXuan Tung, Hang Anh Tuan (2011). Effective comparison of farming systems, farm sizes in pig production. Meeting in animal husbandry with emphasized in smallholder and big farm. Ha Noi, (2011); MARD, (2009, 2010); GSO, (2011); Dan T. Thi, T. AnhHoa, L. Quang Hung, B. Minh Tri, H. T. Kim Hoa, L. ThanhHien, N. Ngoc Tri, P. Gerber, H. Menzi (2008). Animal waste management in Vietnam-problems. Sustainable Organic Waste Management for Environmental Protection and Food Safety p 337-340 19Department of Veterinary Services (2012, provisional data) 20Data sources were not described from partner countries. 21Data sources were not described from partner countries. 22Values in parentheses are for buffalo
14
Category
Vietnam Malaysia Indonesia Thailand
Small holder Medium Large
scale
Small
holder
Medium Large
scale
Small
holder
Mediu
m
Large
scale
Small holder Medium Large scale
Goat/Sheep <10 10-50 >50 <10 10-50 >50 <10 10-50 >50 <10 10-50 >50
Percentage of farms that fall into
each category
20.32 78.35 1.33 1 2 97 20 70 10 80 15 5
Percentage population that fall into
each category
7.76 89.71 2.54 NA NA NA NA NA NA 43.3 38.61 17.96
% of local breed 100 90 90 90 80 0 100 90 80 100 100 8.98
15
Vietnam’s poultry production was similar to beef, dairy and swine productions, the size
farm and population were concentrated in small and middle farms with the local breed raised in
small farms. At present, there are 11 national poultry breeding centres with 3,000 pure breeds and
18,000 grandparent chickens. There are 106 local poultry breeding farms including ten farms
belonging to foreign companies, 20 farms belonging local companies and the rest belonging to
private companies. The characteristics of poultry intensive production system are high investment,
good management and a short husbandry period. Broilers have a short feeding period allowing
farmers to raise 4–5 batches per year. Exotic poultry breeds have a high growth rate. Foreign
companies or national breeding centres supply breeding poultry. One million parent and 4,000–
5,000 grandparent chickens per year are imported to produce commercial chicken for meat or egg
production.
In Malaysia, 100% of poultry farms with production scale less than 10,000 heads are open
house production system, while 79% of poultry farms with production scale from 10,000 to 50,000
and 79% of poultry farms with production scale more than 50,000 heads are open house production
system.
The classification of poultry production systems in Thailand is specific for broilers and
layers. There are around 50% broiler farms with a production scale of less than 10,000 broilers/farm,
and 49.2% broilers farms are with a production scale from 10,000 to 100,000 broilers/farm, in which
a half is open house and another half is closed house system. Around 0.36% farms with more than
100,000 broilers/farm, and all farms with closed house system. For layers, around 86% of layers
farms have a production scale of less than 10,000 layers/farm. Around 0.5% farms with a production
scale from 10,000 to 100,000 layers/farm, and they are all in open house systems. Around 14% layer
farms are with more than 100,000 layers/farm and they are all in closed house systems.
Information on poultry production systems in Indonesia is not understandable enough.
Therefore, it is not possible to summarize in this report.
Methane emission from enteric fermentation
To increase the certainty of GHG emission estimation from enteric fermentation and manure
management (Tier 2 and 3), data on livestock body weight, productivity, and energy intake and
manure management practices is required.
For dairy cattle, the four partner countries (Vietnam, Thailand, Indonesia and Malaysia) did
not provide information on milk yield per day and fat content. According to IPCC (2006), the
emission factor for dairy in Asia is 68 kg CH4/head/year and the average milk production/head/year
is 800 kg. Information on milk yield, fat content of dairy in the condition of the four countries
should be collected to compare with the default value of IPCC (2006) or estimate emission factor for
dairy in each country in particular and in the South East Asia in general (tier 3). Information on
body weight and weight gain, daily energy intake (MJ/day) of dairy cattle in Malaysia is not
provided, for other countries, they are presented in table 6. Dairy breeds in Vietnam, Thailand and
Indonesia are crossbred and exotic breeds between local and exotic breeds, they are mainly raised in
semi intensive and intensive production systems. In Vietnam and Indonesia, intensive production
systems mean animals are kept in pens all time and feed (grass and concentrate) brought to animals.
Animals may be allowed some exercise time around pens. The meaning of intensive dairy
production in Thailand was not described.
16
Table 6:Estimated enteric methane emission factors for dairy cattle sub categories
Country
Subcategory System
Average
weight
(kg)
Average
weight gain
(kg/month)
Total
energy
intake
(MJ/day)
Estimated
Emission
factor
(CH4/head/year)
Indonesia23
Male Semi
Intensive
550 0.7 320.39 136.71
Female 450 0.65 262.13 111.85
Young (1 year) 150 0.45 87.38 37.28
Male Intensive
600 0.8 410.95 175.36
Female 500 0.75 342.46 146.13
Young (1 year) 200 0.65 136.98 58.45
Thailand24
Male Semi
Intensive
NA NA NA NA
Female 350 NA 72.92 31.12
Young (1 year) 250 0.80 50.42 21.51
Male Intensive
NA NA NA NA
Female 400 NA 83.34 35.56
Young (1 year) 280 0.85 56.47 24.10
23Data source was not reported. 24http://www.dld.go.th/nutrition/Research_Knowlage/RESEARCH/Other_forage.htm; http://www.dld.go.th/nutrition/Nutrition_Knowlage/ARTICLE/Pro6.htm Farmers raise only female dairy cattle. For milking cows, they collect data only milk production traits. They do not collect ADG in milking cows.
17
Country
Subcategory System
Average
weight
(kg)
Average
weight gain
(kg/month)
Total
energy
intake
(MJ/day)
Estimated
Emission
factor
(CH4/head/year)
Vietnam25
Male Semi
Intensive
480 0.57 145.54 62.10
Female 500 0.67 181.87 77.61
Young (1 year) 255 0.50
64.18 27.38
Male Intensive
402 0.51 128.87 54.99
Female 453 0.76 145.22 61.97
Young (1 year) 180-220 0.61 61.98 26.45
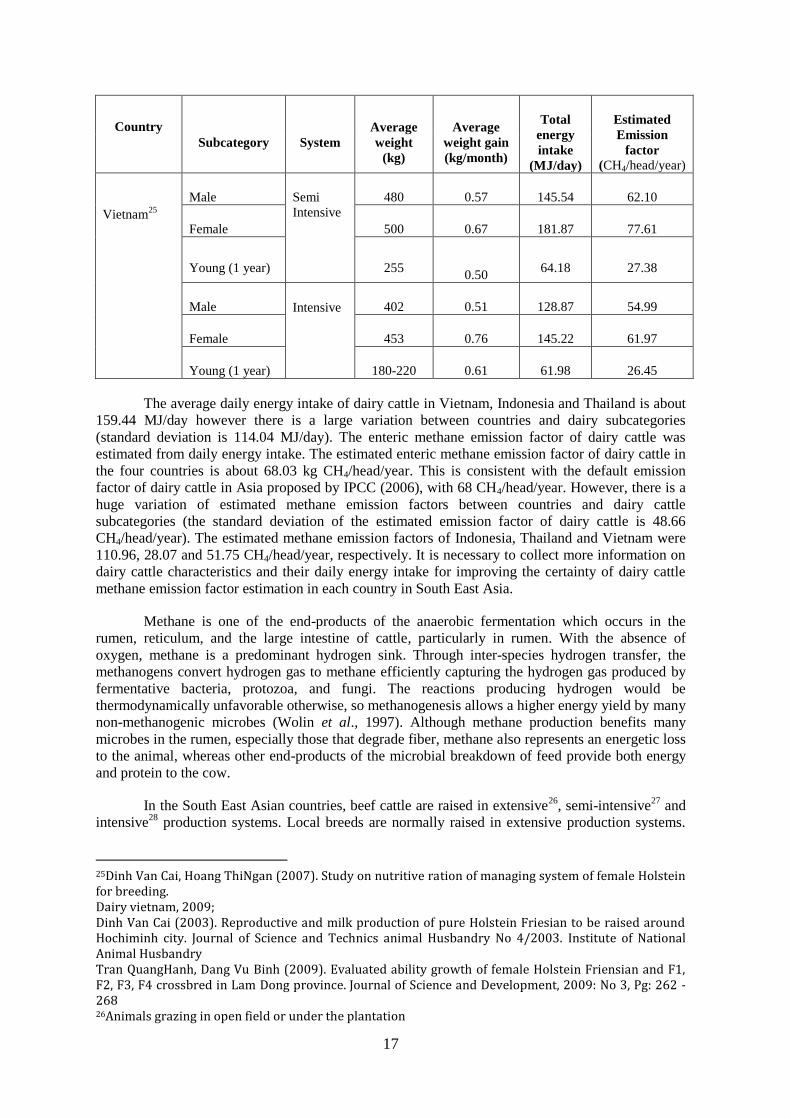
The average daily energy intake of dairy cattle in Vietnam, Indonesia and Thailand is about
159.44 MJ/day however there is a large variation between countries and dairy subcategories
(standard deviation is 114.04 MJ/day). The enteric methane emission factor of dairy cattle was
estimated from daily energy intake. The estimated enteric methane emission factor of dairy cattle in
the four countries is about 68.03 kg CH4/head/year. This is consistent with the default emission
factor of dairy cattle in Asia proposed by IPCC (2006), with 68 CH4/head/year. However, there is a
huge variation of estimated methane emission factors between countries and dairy cattle
subcategories (the standard deviation of the estimated emission factor of dairy cattle is 48.66
CH4/head/year). The estimated methane emission factors of Indonesia, Thailand and Vietnam were
110.96, 28.07 and 51.75 CH4/head/year, respectively. It is necessary to collect more information on
dairy cattle characteristics and their daily energy intake for improving the certainty of dairy cattle
methane emission factor estimation in each country in South East Asia.
Methane is one of the end-products of the anaerobic fermentation which occurs in the
rumen, reticulum, and the large intestine of cattle, particularly in rumen. With the absence of
oxygen, methane is a predominant hydrogen sink. Through inter-species hydrogen transfer, the
methanogens convert hydrogen gas to methane efficiently capturing the hydrogen gas produced by
fermentative bacteria, protozoa, and fungi. The reactions producing hydrogen would be
thermodynamically unfavorable otherwise, so methanogenesis allows a higher energy yield by many
non-methanogenic microbes (Wolin et al., 1997). Although methane production benefits many
microbes in the rumen, especially those that degrade fiber, methane also represents an energetic loss
to the animal, whereas other end-products of the microbial breakdown of feed provide both energy
and protein to the cow.
In the South East Asian countries, beef cattle are raised in extensive26
, semi-intensive27
and
intensive28
production systems. Local breeds are normally raised in extensive production systems.
25Dinh Van Cai, Hoang ThiNgan (2007). Study on nutritive ration of managing system of female Holstein for breeding. Dairy vietnam, 2009; Dinh Van Cai (2003). Reproductive and milk production of pure Holstein Friesian to be raised around Hochiminh city. Journal of Science and Technics animal Husbandry No 4/2003. Institute of National Animal Husbandry Tran QuangHanh, Dang Vu Binh (2009). Evaluated ability growth of female Holstein Friensian and F1, F2, F3, F4 crossbred in Lam Dong province. Journal of Science and Development, 2009: No 3, Pg: 262 - 268 26Animals grazing in open field or under the plantation
18
Local breeds have a small body size from 160-260 kg and a low daily weight again, from 0.1 to 0.3
kg/day (Table 7). Exotic beef breeds and crossbreds between exotic and local breeds are raised in
semi-intensive and intensive production systems with average daily weight gain from 0.4 to 1.0
kg/day. The average total energy intake of various beef cattle subcategories in the four countries is
80.19 (MJ/day), however there is a huge variation between beef cattle subcategories and between
countries (standard deviation is 69.82). Based on the total energy intake (MJ/day), the methane
emission factor was estimated according to the IPCC (2006) method. The result showed that the
average emission factor for cattle other than beef is 23.64 (standard deviation is 16.61), which is big
deviation from the default emission factor Asia (by IPCC, 2006): 47. There is a huge variation of the
estimated emission factors between different beef cattle sub-categories and between countries. The
main reason is the huge variation in the total energy intake. Further data collection for estimating
emission factors of different livestock subcategories in each country is required to improve the
certainty of the emission factors.
27Animals allowed to graze freely certain hours during the day and kept in pens and fed concentrate supplement/feed 28Animals are kept in pens all time and fed (grass and concentrate) brought to animals. Animals may be allowed some exercise time around pens
19
Table 7:Estimated enteric methane emission factors of cattle other than dairy cattle
Country
Subcategory Breed System
Average
weight
(kg)
Average
weight
gain (kg)
Total
energy
intake
(MJ/day)
Estimated
Emission factor
(CH4/head/year
)
Indonesia Beef (Local)
Bali /
Madura Extensive
Male
255 0.25 51.37 51.37
Female
235 0.25 47.34 47.34
Young (1 year)
70 0.35 14.10 14.10
Beef (local) Semi
Intensive
Male
265 0.35 130.52 25.70
Female
240 0.35 118.20 23.28
Young (1 year)
75 0.4 36.94 7.27
Beef (Local) Intensive
Male
275 0.45 29.62 29.62
Female
250 0.45 26.93 26.93
Young (1 year)
80 0.5 8.62 8.62
Beef (Exotic)
Ongolecro
ssbrees Extensive
Male
325 0.35 158.73 67.73
Female
275 0.35 134.31 57.31
Young (1 year)
80 0.4 39.07 16.67
Beef (Exotic) Semi
Intensive
Male 350 0.4 143.65 28.29
Female 300 0.4 123.13 24.25
Young (1 year) 90 0.5 36.94 7.27
Beef (Exotic) Intensive
Male
375 0.6 220.88 43.50
Female
350 0.6 206.16 40.60
20
Country
Subcategory Breed System
Average
weight
(kg)
Average
weight
gain (kg)
Total
energy
intake
(MJ/day)
Estimated
Emission factor
(CH4/head/year
)
Indonesia Young (1 year)
100 0.65 58.90 11.60
Beef (Fattening) Imported Intensive
Male
450 1.1 - 1.3 302.36 59.55
Female
400 1.1 - 1.3 268.77 52.93
Vietnam Beef (Local) Yellow
cattle Extensive
Male
180 0.103 36.52 15.6
Female
161 0.103 29.38 12.5
Young (1 year)
64 0.28 10.67 4.6
Beef (local) Semi
Intensive
Male
198 0.2 44.77 8.8
Female
155 0.2 35.99 7.1
Young (1 year)
74 0.3 13.03 2.6
Beef (Local) Intensive
Male
226 0.253 59.84 11.8
Female
198 0.253 52.42 10.3
Young (1 year)
82 0.35 21.71 4.3
Beef (Exotic) Charolais,
Simental Extensive
Male 270-360 0.2-0.32 84.95 36.3
Female 230-280 0.23-0.32 68.77 29.3
Beef (Exotic) Droughtma
ster
Semi
Intensive
Male 320-450 0.47-0.84 104.47 20.6
Female 250-350 0.4-0.73 81.40 16.0
Beef (Fattening) Droughtma
ster
Semi
Intensive
Male 200 1-1.2 71.12 14.0
21
Country
Subcategory Breed System
Average
weight
(kg)
Average
weight
gain (kg)
Total
energy
intake
(MJ/day)
Estimated
Emission factor
(CH4/head/year
)
Vietnam Female 180 0.8-1.2 56.90 11.2
Beef (Fattening) Holstein
crossbreed Intensive
Male 220-240 0.7-1 69.73 13.7
Thailand Beef (Local)
Native and
Native
crossbred
Extensive
Male
412.50 0.267 69.94 29.8
Female
252.66 0.207 42.84 18.3
Young (1 year)
137.93 0.333 23.39 10.0
Beef (Exotic) Brahman Extensive
Male
446.00 0.457 73.39 31.3
Female
300.62 0.354 49.47 21.1
Young (1 year)
212.90 0.505 35.03 14.9
Beef (Exotic)
Brahman,
Bos taurus
crossbred
Semi
Intensive
Male
513.00 0.587 89.12 17.6
Female
347.00 0.455 60.28 11.9
Young (1 year)
250.00 0.650 43.43 8.6
Beef (Fattening)
Brahman,
Bos taurus
crossbred
Semi
Intensive
Male
480 0.850 85.15 16.8
Beef (Fattening)
Brahman,
Bos taurus
crossbred
Intensive
Male
720 0.950 118.69 23.4
22
Country
Subcategory Breed System
Average
weight
(kg)
Average
weight
gain (kg)
Total
energy
intake
(MJ/day)
Estimated
Emission factor
(CH4/head/year
)
Malaysia29
Beef (Local) Extensive
Male 250 0.30 123.00 52.5
Female 220 0.30 108.24 46.2
Young (1 year) 120 0.35 59.04 25.2
Beef (Local)
Semi
Intensive
Male 250 0.35 61.5 12.1
Female 220 0.35 54.1 10.7
Young (1 year) 120 0.40 29.5 5.8
Beef (Local) Intensive
Male 500 0.60 276.00 54.4
Female NA NA
Young (1 year) 250 0.60 138.00 27.2
29A survey of cattle farming in Peninsular Malaysia: Feed Management Practices and their potential
impact on methane emission. M.S. MohdFairuz, I. Shuhaimen, M.Y. Roslan and A. KamarulAzwan,
Proceedings of the 4th International Conference on Animal Nutirtion 2010, Persada Johor International
Convention Center Johor Bharu, Malaysia
23
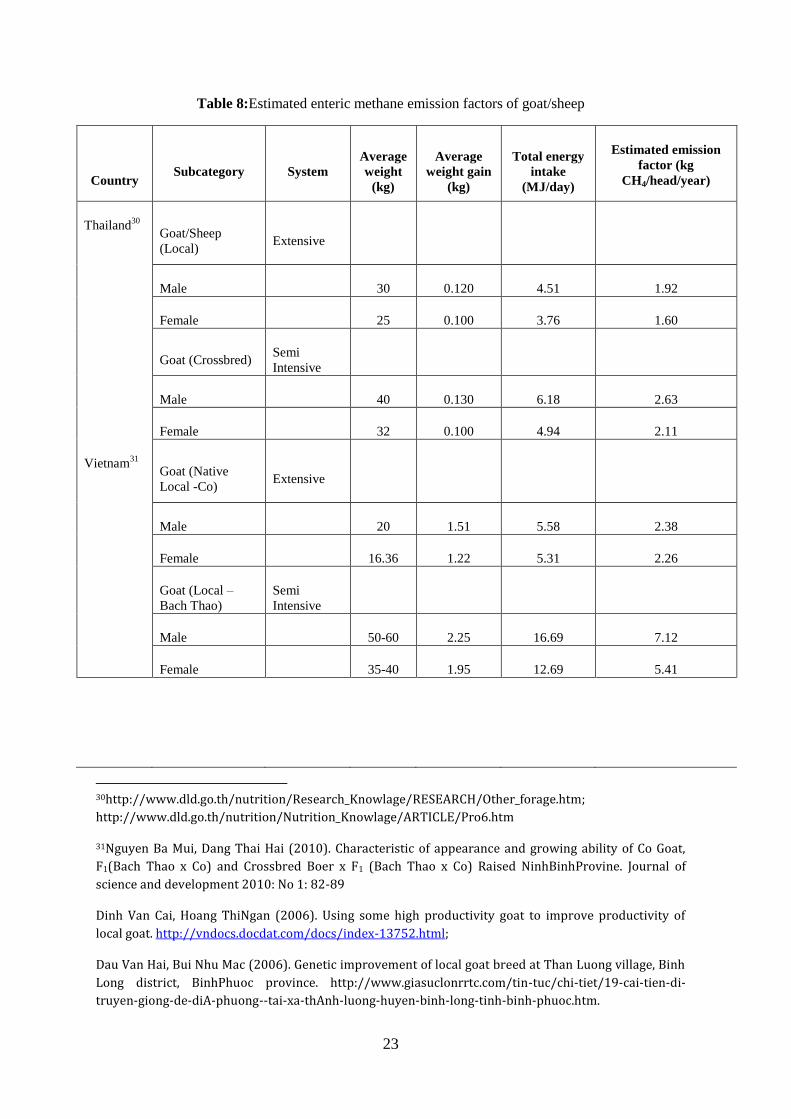
Table 8:Estimated enteric methane emission factors of goat/sheep
Country Subcategory System
Average
weight
(kg)
Average
weight gain
(kg)
Total energy
intake
(MJ/day)
Estimated emission
factor (kg
CH4/head/year)
Thailand30
Goat/Sheep
(Local) Extensive
Male 30 0.120 4.51 1.92
Female 25 0.100 3.76 1.60
Goat (Crossbred) Semi
Intensive
Male 40 0.130 6.18 2.63
Female 32 0.100 4.94 2.11
Vietnam31
Goat (Native
Local -Co) Extensive
Male 20 1.51 5.58 2.38
Female 16.36 1.22 5.31 2.26
Goat (Local –
Bach Thao)
Semi
Intensive
Male 50-60 2.25 16.69 7.12
Female 35-40 1.95 12.69 5.41
30http://www.dld.go.th/nutrition/Research_Knowlage/RESEARCH/Other_forage.htm;
http://www.dld.go.th/nutrition/Nutrition_Knowlage/ARTICLE/Pro6.htm
31Nguyen Ba Mui, Dang Thai Hai (2010). Characteristic of appearance and growing ability of Co Goat,
F1(Bach Thao x Co) and Crossbred Boer x F1 (Bach Thao x Co) Raised NinhBinhProvine. Journal of
science and development 2010: No 1: 82-89
Dinh Van Cai, Hoang ThiNgan (2006). Using some high productivity goat to improve productivity of
local goat. http://vndocs.docdat.com/docs/index-13752.html;
Dau Van Hai, Bui Nhu Mac (2006). Genetic improvement of local goat breed at Than Luong village, Binh
Long district, BinhPhuoc province. http://www.giasuclonrrtc.com/tin-tuc/chi-tiet/19-cai-tien-di-
truyen-giong-de-diA-phuong--tai-xa-thAnh-luong-huyen-binh-long-tinh-binh-phuoc.htm.
24
Country Subcategory System
Average
weight
(kg)
Average
weight gain
(kg)
Total energy
intake
(MJ/day)
Estimated emission
factor (kg
CH4/head/year)
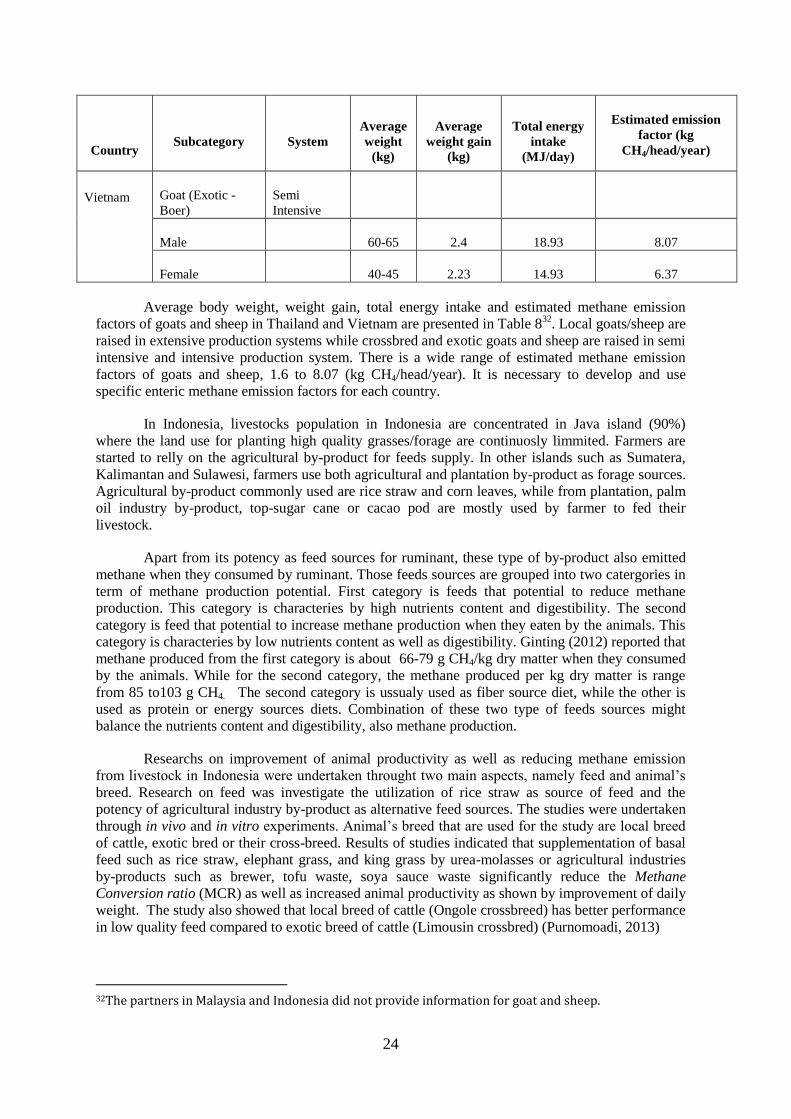
Vietnam Goat (Exotic -
Boer)
Semi
Intensive
Male 60-65 2.4 18.93 8.07
Female 40-45 2.23 14.93 6.37
Average body weight, weight gain, total energy intake and estimated methane emission
factors of goats and sheep in Thailand and Vietnam are presented in Table 832
. Local goats/sheep are
raised in extensive production systems while crossbred and exotic goats and sheep are raised in semi
intensive and intensive production system. There is a wide range of estimated methane emission
factors of goats and sheep, 1.6 to 8.07 (kg CH4/head/year). It is necessary to develop and use
specific enteric methane emission factors for each country.
In Indonesia, livestocks population in Indonesia are concentrated in Java island (90%)
where the land use for planting high quality grasses/forage are continuosly limmited. Farmers are
started to relly on the agricultural by-product for feeds supply. In other islands such as Sumatera,
Kalimantan and Sulawesi, farmers use both agricultural and plantation by-product as forage sources.
Agricultural by-product commonly used are rice straw and corn leaves, while from plantation, palm
oil industry by-product, top-sugar cane or cacao pod are mostly used by farmer to fed their
livestock.
Apart from its potency as feed sources for ruminant, these type of by-product also emitted
methane when they consumed by ruminant. Those feeds sources are grouped into two catergories in
term of methane production potential. First category is feeds that potential to reduce methane
production. This category is characteries by high nutrients content and digestibility. The second
category is feed that potential to increase methane production when they eaten by the animals. This
category is characteries by low nutrients content as well as digestibility. Ginting (2012) reported that
methane produced from the first category is about 66-79 g CH4/kg dry matter when they consumed
by the animals. While for the second category, the methane produced per kg dry matter is range
from 85 to103 g CH4. The second category is ussualy used as fiber source diet, while the other is
used as protein or energy sources diets. Combination of these two type of feeds sources might
balance the nutrients content and digestibility, also methane production.
Researchs on improvement of animal productivity as well as reducing methane emission
from livestock in Indonesia were undertaken throught two main aspects, namely feed and animal’s
breed. Research on feed was investigate the utilization of rice straw as source of feed and the
potency of agricultural industry by-product as alternative feed sources. The studies were undertaken
through in vivo and in vitro experiments. Animal’s breed that are used for the study are local breed
of cattle, exotic bred or their cross-breed. Results of studies indicated that supplementation of basal
feed such as rice straw, elephant grass, and king grass by urea-molasses or agricultural industries
by-products such as brewer, tofu waste, soya sauce waste significantly reduce the Methane
Conversion ratio (MCR) as well as increased animal productivity as shown by improvement of daily
weight. The study also showed that local breed of cattle (Ongole crossbreed) has better performance
in low quality feed compared to exotic breed of cattle (Limousin crossbred) (Purnomoadi, 2013)
32The partners in Malaysia and Indonesia did not provide information for goat and sheep.
25
Default factor for specific in Indonesia livestock system was calculated according to the in
vitro and in vivo study to analyze the enteric methane produced from various local feed types and
feeding management. The results indicated that there is a significant variance between the actual
calculated Emission Factors (EFs) for beef cattle and the default IPCC EFs used in the Agriculture
Inventory prepared in Indonesia. The default IPCC EF for beef cattle in Asia is 47, while the
average EFs for beef cattle in Indonesia is 37.6.
In Thailand, farmers use native grasses, developed grasses, agricultural by-product and
commercial feed for feeds supply. Agricultural by-product used are rice straw, fresh corn stem,
baby corn coat, sugar cane leaf, pineapple coat, palm oil by-product, and cassava leaf (DLD, 1981,
Snitwongse et al., 1983, Promma et al., 1982; Wannapat et al., 1983). Many researchers improve
nutritive values of agriculture by-product, such as urea treated rice straw, cassava hay. The major
group of livestock that used urea treated rice straw, cassava hay, pineapple coat, are dairy cattle and
fattening beef cattle, that can increase feed intake, milk yield and ADG (Promma et al., 1982,
Wannapat et al, 1983; Wannapat et al., 2000)
The difference in feed intake in each country leads to wide range of estimated methane
emission factors. It is necessary to develop emission factors of methane emission for each country.
Firstly, a standardized methane measurement method is required. In general, there are 4 methods
used to measure enteric methane, 1) Chamber Technique, 2) SF6 Tracer Technique, 3) In Vitro Gas
Production Technique, and 4) CO2 Technique. These methods are focused on single animal
measurements that fit well within a traditional experimental agricultural setup and are well suited for
comparing different treatments.
Different chamber systems or respiration chambers have been used for the last 100 years
with the main purpose of studying the energy metabolism of animals (Johnson et al., 2003, Mclean
and Tobin, 1987). Methane loss is an inherent part of the energy metabolism in ruminants, and
various types of chambers are valuable tools in the investigation of mitigation strategies for methane
emissions.
The SF6 Tracer Technique, is relatively new and was first described in 1993–1994 (Johnson
et al., 1994, Zimmerman, 1993). The main purpose of the method was to investigate energy efficacy
in free ranging cattle (Zimmerman, 1993), because it had been queried that results obtained in
respiration chambers could not be applied to free ranging animals (Johnson et al., 1994, Okelly and
Spiers, 1992). The SF6 method is used widely in New Zealand (Lassey et al., 2011, Lassey et al.,
1997), Canada (Mcginn et al., 2009, McCaughey et al., 1997), Australia (Grainger et al., 2010,
Goopy and Hegarty, 2004) and the US (Johnson et al., 1994, Tekippe et al., 2011), and also north
European countries e.g., Sweden (Patel et al., 2011) and Norway (Nes et al., 2010) employ the
method.
The in vitro gas production technique (IVGPT) has been used to simulate ruminal
fermentation of feed and feedstuffs (Rymer et al., 2005) for decades. With the increasing interest in
green house gas (GHG) emissions from agriculture in recent years, the traditional IVGPTs have
been modified to include measurement of methane production e.g., (Pellikaan et al., 2011, Navarro-
Villa et al., 2011).
The CO2 technique is a newly developed method for estimating methane emissions from
livestock and is based on the use of CO2 as a tracer gas (Madsen et al., 2010). Instead of using
externally added SF6, the naturally emitted CO2 is used to quantify CH4 emission. The CH4/CO2-
ratio in the production of air of the animal(s) in question is measured at regular intervals and
combined with the calculated total daily CO2 production of the animal(s). The calculations are the
same as for the SF6 tracer technique, only with CO2 as the tracer gas instead of SF6.
When methane measurement methods are developed in each country, then the assessment of
enteric methane may be more accurate. Similarly, the estimation of methane emission in each
26
subcategory of animal production will be done correctly. It will lead to formulation of possible
mitigation options across the region.
In Indonesia, each Research Institute and University has different equipment and method in
measuring methane emitted from ruminant. In consequence the data collected and reported might
also different. In Indonesia, there are two methods of measuring methane emitted from enteric
fermentation. One methods is by direct measurement and the other is by using equation. For direct
measurement, there are two types of equipment to measure methane. One is methane analyzer and
the other is GC. The differences mostly are in the way to collect the gas methane emitted from
enteric fermentation. There are several ways to collect methane from enteric fermentation. For in
vivo study, the first way is by using face-mask, where the gas from animal’s are collected for 10
minutes every three hours during 2 days of measurement. The gas collected are directly read by
methane analyzer (Purnomoadi, et al., 2002). Second way is by using head-box, where the animals
are stay in metabolise cage that connected to the head-box to collect the gas methane from enteric
fermentation (Suharyono et al., 2006). Two different measurement periodes has been done, during
the six hours of periode and during the 24 hours of periode. The gas collected from the head-box
are directly read by methane analyzer. Other way to collect the gas from in vivo study is by using
gas-bag made from plastic. The volume of gas collected from animals placed in the head-box are
known by measured it using gas meter. In in vitro study, direct measurement is by using
conventional technique modified by Thalib (Thalib et al., 2004) and by using GC. The gas from
bottle incubator is collected by using syringe glass or plastic-gas-pack, then analyze by using GC.
Measurement of methane emitted from enteric fermentation both in vivo and in vitro is also
undertake by using some equations. There are two equations used in the calculation, one is based on
VFA data according to Owens and Goetsch (1988) (Widiawati, 2004, Thalib and Widiawati, 2008,
Sukmawati et al., 2011) and another is by using equation from Kirchgessner et al. (1994) (Ginting,
2013).
In term of mitigation of livestock GHG emissions in many countries, the policy is to
decreasing emission per production unit without influencing food supply.
In the livestock production system, there are three main sources of the GHG emissions: the
enteric fermentation of the animals, manure (waste products) and production of feed and forage
(field use). While, indirect sources of GHGs from livestock systems are mainly changes in land use
and deforestation to create pasture land. For example, in the Amazon rainforest, 70% of
deforestation occurred in order to create grazing lands for livestock. Smallholder livestock systems
have, in general, a smaller ecological footprint compared to large scale industrialized livestock
operations. Mitigation of GHG emissions in the livestock sector can be achieved through various
activities including (FAO, 2013):
- Selection of faster growing breeds
- Improved feeding management
- Improved waste management
- Grazing management
- Lowering livestock production consumption
- Stocking rate management.
- Rotational, planned or adaptive grazing.
- Enclosure from livestock grazing
27
- Optimized production systems.
Selection of faster growing breeds - improved livestock efficiency to convert energy from
feed into production, and reducing losses through waste products. Increasing feed efficiency and
improving digestibility of feed intake are potential ways to reduce GHG emissions and maximize
production, gross efficiency, and indirectly reducing the number of heads. This includes all the
livestock practices such as genetics, nutrition, reproduction, health and dietary supplements and
proper feeding (incl. grazing) management that result in the improved feed efficiency.
Genetic selection over the past six decades has been based largely on the first approach
above, with increasing yields of milk and milk fat. Selection for yields of milk protein has been
implemented over the past two decades in dairy industry. Consequently, methane production per
unit of milk was not different between Holstein and Jersey. In recent cross-breeding experiments
conducted at Virginia Tech University, first lactation Jersey cows produced more energy-corrected
milk per unit of metabolic body weight than Holsteins and Jersey-Holstein F1 crosses (Olson et al.,
2010). However, it appears that the Jerseys were more physiologically mature at calving than the
Holsteins and did not use as much energy in support of growth during the first lactation. Whether
this breed difference in energetic efficiency would continue into the second and greater lactations is
unknown and would require further study.
An alternative approach would be to genetically select for those cows that are more efficient
in using feed nutrients to synthesize milk components. Residual feed intake (RFI) has been
increasingly used in non-ruminant and beef production systems as a tool to assess and genetically
select for feed efficiency (Herd and Arthur, 2009). RFI was originally defined by Koch at al. (1963)
as the difference between measured feed intake and feed intake predicted from maintenance and
growth estimates for an individual animal. Greater efficiency is denoted by a negative RFI value and
lower efficiency by a positive RFI value. RFI is moderately heritable in beef cattle (Koch et al.
1963) and follows a normal distribution improving its utility for conventional genetic selection
compared with feed efficiency (lb. energy-corrected milk/lb. dry matter intake) which is usually not
normally distributed. The genetic and physiological basis of RFI is sound (Herd and Arthur, 2009).
In dairy cattle, RFI may be computed as the deviation in feed intake of an individual cow
from that predicted by an equation such as that derived by the NRC Nutrient Requirements of Dairy
Cattle (2001). RFI offers considerable potential for improvement in productivity through genetic
selection compared with ratio-based measures of feed efficiency (St. Pierre & Thraen, 1999).
Genetic approaches that increase life-time production, including those that improve health,
disease resistance, reproduction, and tolerance to heat stress will lead to improvements in individual
life-time and herd productivity and indirectly reduce methane emissions per unit of milk. Incidences
of common diseases in dairy cattle have low to moderate heritabilities (h2 = 0.05 to 0.25, Uribe et
al., 1995, Zwald et al., 2004) and are positively associated with selection for increased milk
production (Rauw et al., 1998). It has been shown that tolerance to heat stress is also heritable, and
these authors and others have hypothesized that the threshold at which cows begin experiencing heat
stress is lower in higher-producing dairy cows. During the past decade, selection indexes for dairy
cattle have been modified to include reproductive traits, susceptibility to mastitis, and productive
life (Van Raden et al., 2004), all of which will increase the efficiency of milk production and further
reduce methane emissions.
Improved feeding management – the composition of feed has some effect on the enteric
fermentation and emission of CH4 from the rumen or the hindgut. Also the amount of feed intake is
related to the amount of waste product. The higher proportion of concentrate in the diet results in a
reduction of CH4 emission.
28
Improved waste management – improving management of animal waste products through
different mechanisms such as covered storage facilities is also important. The amount of GHG
emission from manure (CH4, N2O, and CH4 from liquid manure) will depend on the temperature and
duration of the storage. Therefore long term storage in high temperature will result higher GHG
emissions. In the case of ruminants, pasture grazing is an efficient way to reduce CH4 emission from
manure, because no storage is necessary. Indeed, there is not only the possibility of mitigating the
GHG emissions, but also of create an opportunity for renewable energy as in the case of the IFAD-
supported activities in China and Eritrea.
In Thailand, farmers use manure to produce biogas in CDM project to decrease methane
emission from livestocks. In addition, they use manure as fertilizer and compost fertilizer to
decrease methane emission (ONEP, 2000).
Grazing management – one of the major GHG emission contributions from livestock
production is from forage or feed crop production and land use of feed production. Thus pasture
grazing and proper pasture management through rotational grazing is the most cost effective way to
mitigate GHG emissions from feed crop production. Animal grazing on the pasture also helps
reduce emission due to animal manure storage. Introduction of grass species and legumes into
grazing lands can enhance carbon storage in soils.
In Thailand, researchers improve forage crop genetics to increase feed efficiency , leading
to reduce methane emission (Phonbumrung, 2012).
Mitigation in term of livestock grazing and soil carbon sequestration is very importance.
Experts assessed the value of carbon contained in the soil as more than twice the quantity in the
atmosphere and demonstrated that enhancing carbon sequestration into soils might offer a
potentially useful contribution to climate change mitigation. Terrestrial vegetation and soils have
been absorbing approximately 40% of global CO2 emissions from human activities.
Considering the importance of rangelands in land uses (about 40% of the total land surface),
herders and pastoralists could play a crucial role in soil carbon sequestration. All over the world
there are some 100-200 million pastoralist households covering 5000 Million hectares (Mh) of
rangelands in which are stored 30% of the world carbon stocks. Therefore, environmentally sounded
rangeland practices have a relevant potential to sequester carbon.
Global studies find that grazing can either have a positive or negative impact on rangeland
vegetation and soils, depending on climatic characteristics of rangeland ecosystems and grazing
history and effectiveness of management. Common grazing management practices that might
increase carbon sequestration include the following: (i) stocking rate management, (ii) rotational,
planned or adaptive grazing, and (iii) enclosure of grassland from livestock grazing.
Lowering livestock production consumption - lowering consumption of meat and milk in
areas having high standards of living will support short term response to the GHG mitigation.
Stocking rate management. Conventional rangeland science suggests that sustainable
management of grassland can be achieved by grazing livestock at stocking rates that do not exceed
the carrying capacity of grasslands.
Rotational, planned or adaptive grazing. Many grasslands increase biomass production in
response to frequent grazing which when managed appropriately, could increase the input of organic
matter to grassland soils. However, there have been very few studies of the effects of rotational
grazing on soil carbon stocks. Two published reports both indicate that rotational grazing would
have limited impacts on soil carbon stocks, despite the benefits for livestock production and/or
vegetation. Site-specific planned and adaptive grazing is likely to be more effective in managing soil
carbon but no published reports have been identified.
29
Enclosure from livestock grazing. Enclosure from livestock grazing has different effects
depending on the type of land. The US Conservation Reserve Programs and the Chinese ‘Return
Grazed Land to Grass’ Program are large scale programmes that support enclosure of degraded
grasslands from livestock grazing for defined periods of time. Grazing intensity should be properly
regulated in view of enhancing carbon sequestration. To this end, it is worth noting that methane
emissions, grazing intensity and wood-land increase are all interrelated issues. Therefore, GHG
emissions should be also considered along with carbon sequestration when analysing the impacts of
livestock on GHG emissions and climate change.
Grazing management drives change in soil C stocks by influencing the balance between
inputs (what goes into the soil) and outputs from the soil: an effective livestock management
systems both in terms of improved feeding practices and use of specific agents and dietary additives
has positive effects on food security (i.e. increased productivity as well as meat quality) and soil C
stocks.
Control of methane emission by rumen microbes has mainly been focused to apply the
various chemicals that inhibit the growth and activity of metanogens in the rumen. They are direct
inhibition of methane generation using halogenated methane analogues, chlorinated CH4 analogues,
and chemical complex of bromochloromethane and cyclodextrin. Bromoethanesulphonate (BES),
structural analogue of the cofactor mercaptoethanesulfonic acid (coenzyme M) used by
methanogenic bacteria also is a potent inhibitor of methane emission. The quantification of total
methanogen supported the results of methane production. Propionate enhancers are also one of the
effective alternatives in methane control. Fumarate and malate are four carbon intermediates
(dicarboxylic acid) in the propionate pathway in which they are reduced to succinate. In this
reaction, hydrogen ion (H+) is needed and therefore, reduction of the dicarboxylic acids may
provide an alternative electron sink for H2. Addition of fumarate or malate in acid form up to 24
mM each to culture solution containing concentrate (70%) and ground alfalfa hay (30%, DM)
reduced in vitro methane generation by 65.6% and 47.5%, respectively for 12 h incubation
compared to control. Thus the organic acid such as malate and fumarate may be put to practical use
for ruminant diets since it has the dual benefit of decreasing CH4 production and increasing net
energy retention.
The unsaturated fatty acids (UFAs) in the added fat were widely indentified to reduce CH4
emission through hydrogenation of them (Johnson and Johnson, 1995). The research was conducted
an in vitro experiment with 60mg linoleic acid (LA, C18:2) in associated with organic acids, and
found that 24 mM of C18:2 alone decreased methane generation compared to control, and malate
(24 mM) with C18:2 reduced methane emission by 38% and fumarate (24 mM) with C18:2 (F-LA)
by 47% compared with addition of C18:2 alone for 12 h.
Many other in vitro studies with methane reducing agents have been conducted in Korea.
One of them was cyclodextrin (CD) complex of fatty acids, and it decreased methane production at
8 h and 12 h incubation compared to control and CD alone (National Institute of Animal Science,
Korea, not published). Addition of Resveratrol and iodo propane-CD complex also reduced in vitro
methane emission by up to 64% and 50%, respectively, compared to control. Methane emission in
the ruminant animals, in general, is closely related with feed but dietary manipulation itself has been
limited in reducing it.
Ionophores, including monensin, have been long known to increase rumen propionate
concentrations and reduce methane production in vitro incubations and during short term feeding.
However, it is not clear whether the reduction is persistent. Potential disadvantages of these
mitigation approaches must be weighed against the potential benefits of methane emission
reductions, and alternative strategies should be viewed within their larger context of opportunities
such as improved feed efficiency (Beauchemin et al., 2008).
30
Improving feed efficiency (yield of milk components per unit of feed intake) is well
established as one of the best ways to reduce methane production in individual animals (IPCC,
2006). Feed ingredients provide the substrates for microbial fermentation, and differences in feed
quality alter the amount of energy extracted by the microbes and the pattern of VFA and methane
produced. These alterations can impact energy and protein availability to the cow and, ultimately,
the efficiency at which the feed nutrients are used for productive functions including growth and
milk synthesis (NRC, 2001). Nutrition advisors and dairy producers have known for over a century
that more digestible feeds improve lactation performance, reduce methane production, and increase
feed efficiency. However, there are still opportunities remaining for a better understanding of
nutrient requirements, feed digestibility, and nutrient supply for milk synthesis (NRC, 2001).
A significant amount of methane emissions is associated with the ruminal fermentation of
plant cell wall constituents of forages and by-products. Improving forage quality can improve diet
digestibility, and increase dry matter intake and milk production (Weiss, 1993, Johnson and
Johnson, 1995). Forage quality can be improved through plant breeding, including genetically
modified plants, and improved harvesting and storage conditions (Vogel and Sleper, 1994; Rotz and
Muck, 1994; Berger et al., 1994). Improvements in forage quality that translate into improved
digestibility also result in increased microbial growth, increased energy availability to the cow,
increased milk production, and improved feed efficiency (Beauchemin 1991; Beauchemin et al.,
2003). Methods of feed processing that increase diet digestibility will also improve feed efficiency
(Campling, 1991, Firkins et al., 2001). These methods include: grinding, rolling, and steam-flaking
grains; kernel processing of corn silage, addition of hydrolytic enzymes, and chemical treatment
with alkali, ammonia, or aldehydes (Bal et al., 2000, Firkins et al., 2001). Since all these methods
require energy inputs, the potential benefits must be considered in relation to the energetic cost of
processing.
On an individual cow basis, methane per unit of milk can be reduced by two different
approaches. The first is to increase milk yield per cow with correspondingly smaller increases in dry
matter intake, which dilutes the maintenance energy costs of the cow and increases energetic
efficiency. The second is to reduce body size without reducing yields of milk and milk components,
which also has the effect of increasing energetic efficiency, but by decreasing the energy
requirements of the animal. Both approaches are based on the fact that maintenance energy costs of
cows are a fixed cost and a function of their body size. Because methane production is proportional
to the energy intake of the animal, reducing maintenance energy costs and energy intake while
maintaining milk yield would decrease enteric methane, both on a per cow per day basis and a per
lb. of milk basis.
In Indonesia, many works on methane mitigation from livestock were undertaken by
reseacher at Universities and Research Institutes. Those technologies are grouped into three
categories: 1) feed processing; 2) feed supplementation; and 3) feed additives. Two processing
tehchniques are commonly used are throught biological (ensilage) and chemical (ammoniation)
(Antonius, 2009; Wisri, et al., 2010; Dwi Yulistiani, et al., 2012).
Technology supplementation is aimed to increase the nutrients content of low quality diet.
Feeds that can be used as supplement commonly forages that contain protein > 18%; grain from
industrial by-product. Gliricidia, Caliandra, Leucaena (lamtoro) and cassava leaves are some of
high quality forages that commonly used as feeds supplement. Palm kernel cake, soy-bean meal,
DDGS, brewer, rice huls, tofu waste are some by-products of industries that can also be used as feed
supplement (Widiawati, 2004; Suharyono dan Widiawati, 2007; Wisri et al., 2012).
Supplementation of those high quality feeds into low quality feeds such as agricultural and
plantation by-product would increase nutrients content of the basal diets, its digestibility and feed
utilisation by the animals, in turn reduce methane produced in the rumen.
Feed additives available resulted by some researcher are probiotic, prebiotic, fenolic
compound such as tannin and saponin (Thalib, 2004, Wina et al. 2006, Jayanegara, 2009,
31
Jayanegara et al., 2010, Thalib et al., 2010). Those materials are offered in small amount (<2 % of
diet weight) but have positive impact on animal’s productivity, including in reducing methane
produced in the rumen. Source of tannin mostly comes from legumiouse trees such as Calliandra
callothyrsus, Swietenia mahagoni, Acacia villosa, Eugenia aquea, Myristica fragrans and Clidemia
hirta (Jayanegara, 2013) or non-leguminouse tress such as tea-waste. The most valuable materials as
sources of saponin are lerak (Sapindus rarak) and kembang sepatu (Hibiscus rosa-sinensis L). One
of some probiotic that can depress methane production in the rumen are Acetoanaerobium noterae
(Thalib dan Widiawati, 2008).
Application of those mitigation techniques have been done in many areas. The most adopted
of mitigation technique by the farmers is suplementation of basal diet (by-product of agriculture and
plantation) by using leguminouse trees and industrial by-product (rice hulls, pollard, tofu-waste,
palm kernel cake etc). However limittation in the facilities of equipment that aplicable for field
measurement restricts the methane measurement. Therefore there were not recording on the
reducing methane emitted from animals as an impact of feed supplementation on low quality of
basal diet.
In Malaysia, most research have concentrated on evaluation of adaptable breed (Raymond
and Ratnakumar, 1997; Sivarajasingam and Wan Zahari, 1985; Sivarajasingam and Kumar, 1989),
development of economic feed (Wan Zahari et al, 2000, 2002, 2003, 2009; Alimon et. al., 2012),
and production systems (Brouwer Sutherland, 2012). Similarly, a number of research has been
conducted on the impact of livestock production on the environment, but was mainly concentrated
on waste and wastewater quality (Choo and Ong, 2000; Ong et al., 2002, 2005, Ong, 2008);
Shanmugavelu, et. al., 2002). There is almost no research on green house inventory from associated
livestock production. A number of studies have been published on livestock greenhouse gases
emissions, but generally based on extrapolating or simulated data based on animal population
(Yusuf et. al., 2012; Shuhaimen et. al. 2012) or small scale production system survey data (Mohd
Fairuz et. al, 2010). Nevertheless, there has been some recent interest in the study of rumen
methanogens, but generally exploiting high tannin feeds for the reduction of menthanogens in
ruminants (Tan, 2010). The research on the establishment on livestock greenhouse gas (GHG)
inventories based on local feeds and a production system is limited due to the lack of priority and
funding. This is mainly due to the low contribution of agriculture (3%) to the overall GHG of the
country (NC2, 2011).
Methane emission from manure management
The main factors affecting CH4 emissions are the amount of manure produced and the
portion of the manure that decomposes anaerobically. The former depends on the rate of waste
production per animal and the number of animals; the latter on how manure is managed, how much
manure is handed in each manure management system. The temperature and retention time of the
storage unit greatly affect the amount of methane produced.
The simplest method of estimating methane emission from manure management is using
IPCC Tier 1 method with available default emission factors for livestock and livestock
subcategories. These emission factors present the range in manure volatile solids content and in
manure management practices used in each region, as well as difference in emission due to
temperature. When we use the Tier 1 method to estimate methane emission from manure
management, we should review variables of the country or region and compare to the variables,
which were used to develop emission factors by IPCC (2006).
There are no information on manure management practices of dairy cattle, beef, goat and
sheep categories and subcategories in Vietnam, Indonesia and Malaysia (the partners in those
countries did not provide the information). Therefore, it is not possible to discuss about the
application of IPCC default methane emission factors (Tier 1) or estimation of methane emission
factors (tier 2) to estimate methane emission from dairy, beef; goat and sheep manure management
32
in those countries. There should be further data collection or studies to have such information on
manure management practices (manure characteristics and manure management characteristics) of
dairy, beef, goat and sheep in those countries.
Thailand is the only country that provides information on dairy cattle manure management
practices; actually it is the information on the faction of dairy manure handled in each manure
management system of compost, solid storage, daily spread and biogas. It is for subcategories of
female dairy cattle and dairy cattle younger than one year old in semi intensive and intensive
production systems. Similar information on other subcategories is not available. There are no
information on manure volatile solid (VS) or other information allowing VS estimation, thus, it is
not possible to estimate annual CH4 emission factors (EF) for those dairy cattle subcategories in
Thailand. Further data collection or studies on manure characteristics are required to estimate EFs.
Similar to dairy cattle, information on goat and sheep manure characteristics and manure
management practices are not enough to estimate VS and then EF. Further data collection or studies
are required to develop EFs for each category and subcategory
The four countries provide a bit information on pig manure characteristics and manure
management practices. In Vietnam, Malaysia and Indonesia the collected information allows to
estimate volatile solid (kg VS/day) (Table 9). However information on manure management systems
are not available enough. The faction of manure handed using different manure management
systems should be summed up to 100%, however, collected information showed that the faction of
manure handed using different manure management systems was up to 200%. Those countries split
waste management into solid and liquid waste management, but information on how much VS is
distributed into each manure management system is not available. Thus, it is not possible to estimate
EF of pig category and subcategories in those countries.
The average of VS of pig category in Vietnam is 0.22 kg dry matter/animal/day, ranging
from 0.03-0.37 for different pig sub-categories. The average of VS of pig category in Indonesia is
0.52 kg dry matter/animal/day, ranging from 0.14-0.82 for different pig sub-categories. The average
of VS of pig category in Malaysia is 0.20 kg dry matter/animal/day, ranging from 0.08-0.31 for
different pig sub-categories. The default VS for pigs in Asia according to IPCC (2006) is 0.3. There
is a high variation of VS between pig sub-categories in each country, between countries and
compared to the default VS of IPCC (2006). It is necessary to develop and use specific VS in
estimating EF for each pig sub-category in each country.
The swine and poultry industry is important for food production in Southeast Asia. By big
population of pig, it is the important source of methane from manure management. Global warming
effects resulting from greenhouse gas (GHG) emissions can influence pig physiology. In Southeast
Asia, high temperatures cause decrease in feed intake and production efficiency of pigs. Higher
temperatures can affect the quality and quantity of forage from grasslands and other food supplies.
Furthermore, it was found that climate change tended to restrict livestock productivity (e.g. reducing
milk production) through both declining forage quality and increased ambient temperature. GHGs
include carbon dioxide (mainly produced from fossil fuel combustion), methane, and nitrous oxide.
CO2, CH4, and N2O contribute 49, 15–20, and 6% of GHG to global warming, respectively.
In addition, the pig house is normally cleaned with a large volume of water. The anaerobic
treatment system of livestock farms may not produce more GHG. But for inventory, there is lack of
sub category of manure management, accurate estimation of methane emission.
Assuming constant organic concentration (e.g. BOD), increasing temperature may
accelerate microbial consumption labile organic matters, while methane production remains
constant. Solid/liquid separation is more efficient with dairy cattle manure than pig manure because
of the higher fiber content of cattle manure. Additionally, most dairy farms need less water for
cleaning the animal houses and the volume of wastewater remains constant throughout the year. The
production of GHG from anaerobic treatment of dairy cattle waste water is thus more stable than for
33
swine. Furthermore, the water quality index (i.e. organic concentration) of dairy cattle wastewater
was also more stable than that of piggery wastewater. Changes in methane production from
anaerobic treatment of dairy cattle wastewater were therefore insignificant. Generating methane
from manure has considerable merit because it appears to offer at least a partial solution to two
processing problems-environmental crisis and the energy shortage. Livestock manure contains
portion of organic solids such as proteins, carbohydrates and fats that are available as food and
energy for growth of anaerobic bacteria. Obvious benefit from methane production is the energy
value of the gas itself. But the gas production from manure depends mainly upon the efficiency of
operating system for it. Gas yield can be a certain amount of gas produced per unit of solids
degraded by the anaerobic bacteria. They estimated the average potential methane production from
the livestock manure, and found the production of 692, 946,125 and 6.4 cm3 daily from dairy cattle
(545 kg), beef cattle (450 kg), swine (68 kg) and poultry (1.8 kg), respectively. Thus, their energy
production rates (kcal/h/animal) were 143, 195, 30 and 1.3, respectively. They further speculated
that the number of animal heads which require energy for the use of kitchen range for 2h daily from
livestock manure will be 14, 11, 77 and 1,547, respectively.
Thailand government announced low carbon green agriculture as a country production
policy. The livestock manure and food leftover, therefore, should be developed to either fertilizer or
biogas. Especially, eco-friendly energy production from manure will give a solution for reducing
greenhouse gas emission. For this purpose, both the government and private sectors need to
cooperate together to lead the biogas project as an enterprise for public utility. In Thailand, the
biogas project has been developed in large scale farms under program of CDM (Clean Development
Mechanism). The purpose of CDM concerns green farming production and for energy power. They
had capacity of electricity production to use in farm and sell to EGAT (Electricity Generating
Authority of Thailand) or obtain carbon credit. There are not many biogas plants which are
commercially operated.
In Indonesia, government program for self-sufficient of beef meet has an effect on
increasing the cattle population, particularly for local and exotic beef cattle in Indonesia. Increasing
in beef cattle population will focussing on Bali and Madura cattle for local breed and Ongole or
Limousin crossbreed for exotic breed. Focus strategy in reducing GHG emision is adaptation to
climate change particularly in food crop to maintain food security. Actions of mitigation is
undertaken through the application of environmental friendly and low CH4 emision technologies.
The integrated between crop and livestock is implemented in crop livestock system (CLS) in 11
provinces (rice-beef; palm oil-cattle; cacao-beef cattle). The purpose of CLS technology is to
increase farmer income by increasing productivity. Another government policy is to support the
development of small-scale farmers both by increase the number of farmers as well as increasing the
number of animal per farmer.
In Malaysia, the government has formulated the fourth National Agricultural Policy (NAP4)
to enhance livestock production to meet local demands and reduce dependency on imports. Beef
cattle production is projected to increase 5.0% annually to 76,000 metric tonnes by 2020,
Goat/Sheep meat production, on the other hand, is anticipated to increase by 17.5% annually to
11,900 metric tonnes by 2020. A lot of emphasis has been given to the dairy industry with an
anticipated 5.8% annually increase in milk production from 71 million litres (2011) to 118 million
litres by 2020. This is envisaged to be achieved with the establishment of dairy clusters with 27,000
heads of dairy cattle including downstream processing facilities and injection of RM18.2 million
government funds. The production of pork however is expected to experience a 0.1% annual
decrease to 231,000 metric tonnes by 2020. Broiler meat, which is produced more that requirement,
is projected to increase 3% annually to 1.7 million metric tonnes by 2020. Similarly, a 3.6% annual
increase in egg production is expected from 536,000 metric tonnes (2011) to 773,000 metric tonnes
by 2020 (DAN, 2011). The government has drawn up these measures under its new economic
transformation program.
34
The government has initiatives in place for the enhancement of large and medium scale beef
production using government linked companies (GLC) to integrate cattle production under oil palm.
Similarly, incentives and policies are also in place to encourage sustainable livestock production
with effective waste management systems. This is very clear for swine production which has a strict
regulation on waste water discharge. The government has also allocated about USD 900,000 under
the Tenth Malaysian Plan for research and development on issues related to climate change
including green house gas mitigation for the agriculture sector.
From daily gas emission, it was found that methane concentration in the biogas produced
was approx. 60 to 70% which is considered to be highly efficient. Positive understanding for the
facility of biogas production and cooperative relationship between government and industry,
therefore, are necessary to satisfy the needs to reduce the greenhouse gas and energy production
from livestock manure. The large share of manure managed methane is from beef cattle and swine
because of big population. Correspondingly, emissions from land use are splitting from carbon
sequestration and from emissions from organic soils. For most animal products, emissions from
foregone carbon sequestration dominate enhanced carbon sequestration in managed grasslands
leading to net emissions under the position “carbon sequestration”.
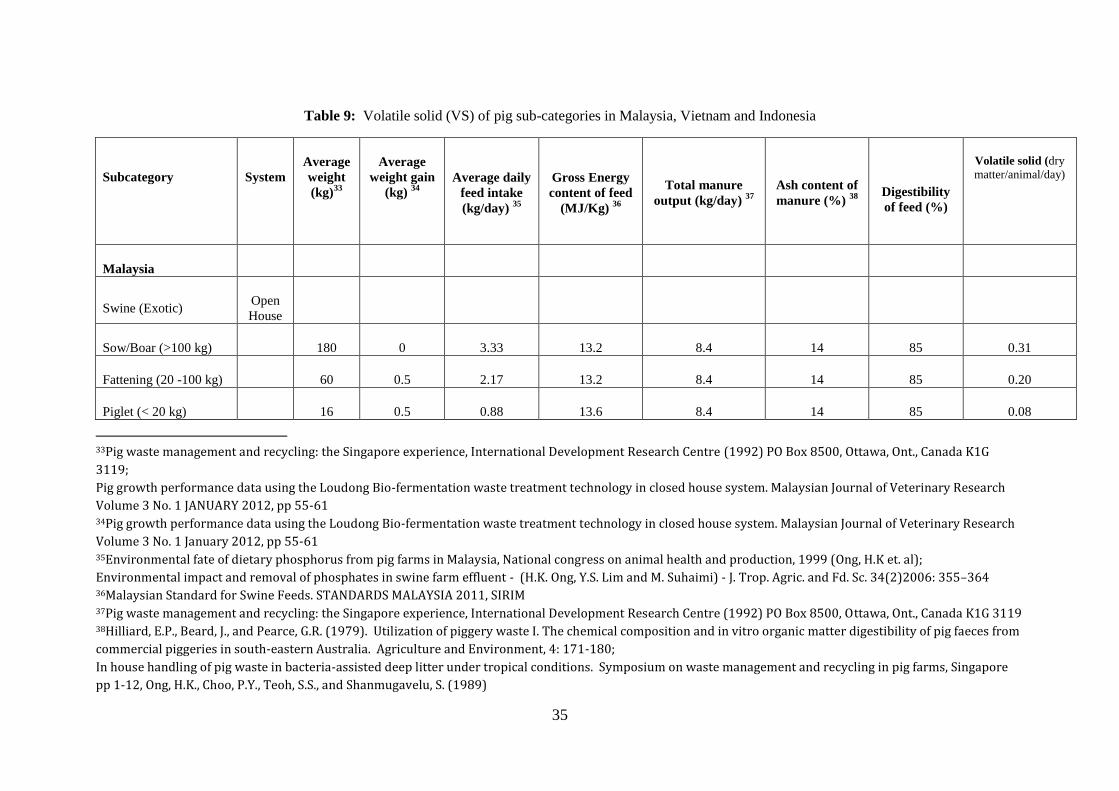
35
Table 9: Volatile solid (VS) of pig sub-categories in Malaysia, Vietnam and Indonesia
Subcategory
System
Average
weight
(kg)33
Average
weight gain
(kg) 34
Average daily
feed intake
(kg/day) 35
Gross Energy
content of feed
(MJ/Kg) 36
Total manure
output (kg/day) 37
Ash content of
manure (%) 38
Digestibility
of feed (%)
Volatile solid (dry
matter/animal/day)
Malaysia
Swine (Exotic) Open
House
Sow/Boar (>100 kg)
180 0 3.33 13.2 8.4 14 85 0.31
Fattening (20 -100 kg)
60 0.5 2.17 13.2 8.4 14 85 0.20
Piglet (< 20 kg)
16 0.5 0.88 13.6 8.4 14 85 0.08
33Pig waste management and recycling: the Singapore experience, International Development Research Centre (1992) PO Box 8500, Ottawa, Ont., Canada K1G
3119;
Pig growth performance data using the Loudong Bio-fermentation waste treatment technology in closed house system. Malaysian Journal of Veterinary Research
Volume 3 No. 1 JANUARY 2012, pp 55-61 34Pig growth performance data using the Loudong Bio-fermentation waste treatment technology in closed house system. Malaysian Journal of Veterinary Research
Volume 3 No. 1 January 2012, pp 55-61 35Environmental fate of dietary phosphorus from pig farms in Malaysia, National congress on animal health and production, 1999 (Ong, H.K et. al);
Environmental impact and removal of phosphates in swine farm effluent - (H.K. Ong, Y.S. Lim and M. Suhaimi) - J. Trop. Agric. and Fd. Sc. 34(2)2006: 355–364 36Malaysian Standard for Swine Feeds. STANDARDS MALAYSIA 2011, SIRIM 37Pig waste management and recycling: the Singapore experience, International Development Research Centre (1992) PO Box 8500, Ottawa, Ont., Canada K1G 3119 38Hilliard, E.P., Beard, J., and Pearce, G.R. (1979). Utilization of piggery waste I. The chemical composition and in vitro organic matter digestibility of pig faeces from
commercial piggeries in south-eastern Australia. Agriculture and Environment, 4: 171-180;
In house handling of pig waste in bacteria-assisted deep litter under tropical conditions. Symposium on waste management and recycling in pig farms, Singapore
pp 1-12, Ong, H.K., Choo, P.Y., Teoh, S.S., and Shanmugavelu, S. (1989)
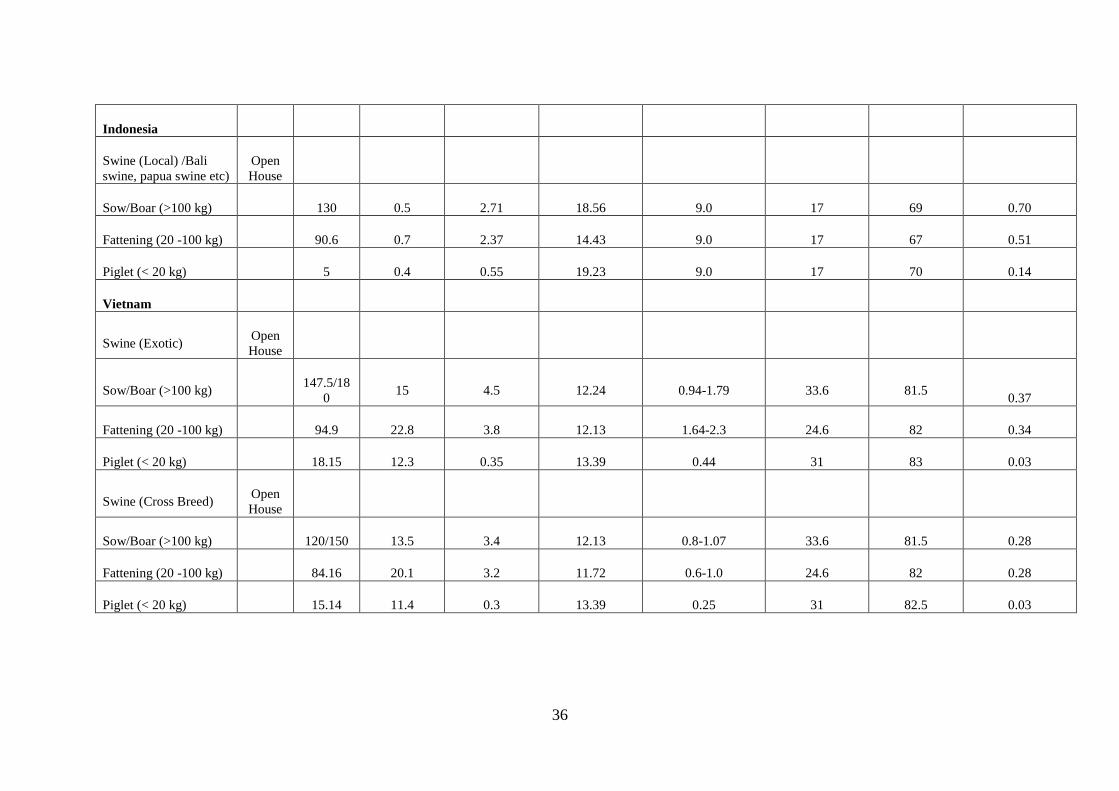
36
Indonesia
Swine (Local) /Bali
swine, papua swine etc)
Open
House
Sow/Boar (>100 kg) 130 0.5 2.71 18.56 9.0 17 69 0.70
Fattening (20 -100 kg) 90.6 0.7 2.37 14.43 9.0 17 67 0.51
Piglet (< 20 kg) 5 0.4 0.55 19.23 9.0 17 70 0.14
Vietnam
Swine (Exotic) Open
House
Sow/Boar (>100 kg) 147.5/18
0 15 4.5 12.24 0.94-1.79 33.6 81.5
0.37
Fattening (20 -100 kg) 94.9 22.8 3.8 12.13 1.64-2.3 24.6 82 0.34
Piglet (< 20 kg) 18.15 12.3 0.35 13.39 0.44 31 83 0.03
Swine (Cross Breed) Open
House
Sow/Boar (>100 kg) 120/150 13.5 3.4 12.13 0.8-1.07 33.6 81.5 0.28
Fattening (20 -100 kg) 84.16 20.1 3.2 11.72 0.6-1.0 24.6 82 0.28
Piglet (< 20 kg) 15.14 11.4 0.3 13.39 0.25 31 82.5 0.03
37
Collected data from Thailand allows the estimation of VS and EF that are presented in table
10. It can be seen from the table that the average of VS (kg dry matter/pig/day) is about 0.35; 0.5 kg
higher than the default VS proposed by IPCC (2006). However, the variation between pig sub
categories is high, standard deviation is 0.28 kg dry matter/pig/day. The EF is 1.17 kg
CH4/head/year, much lower than default EF of IPCC (2006), from 5-7 kg CH4/head/year. The
variation of estimated EF between pig subcategories is high, the standard deviation is about 1
CH4/head/year. This means it is necessary to develop and use EF for each pig sub categories.
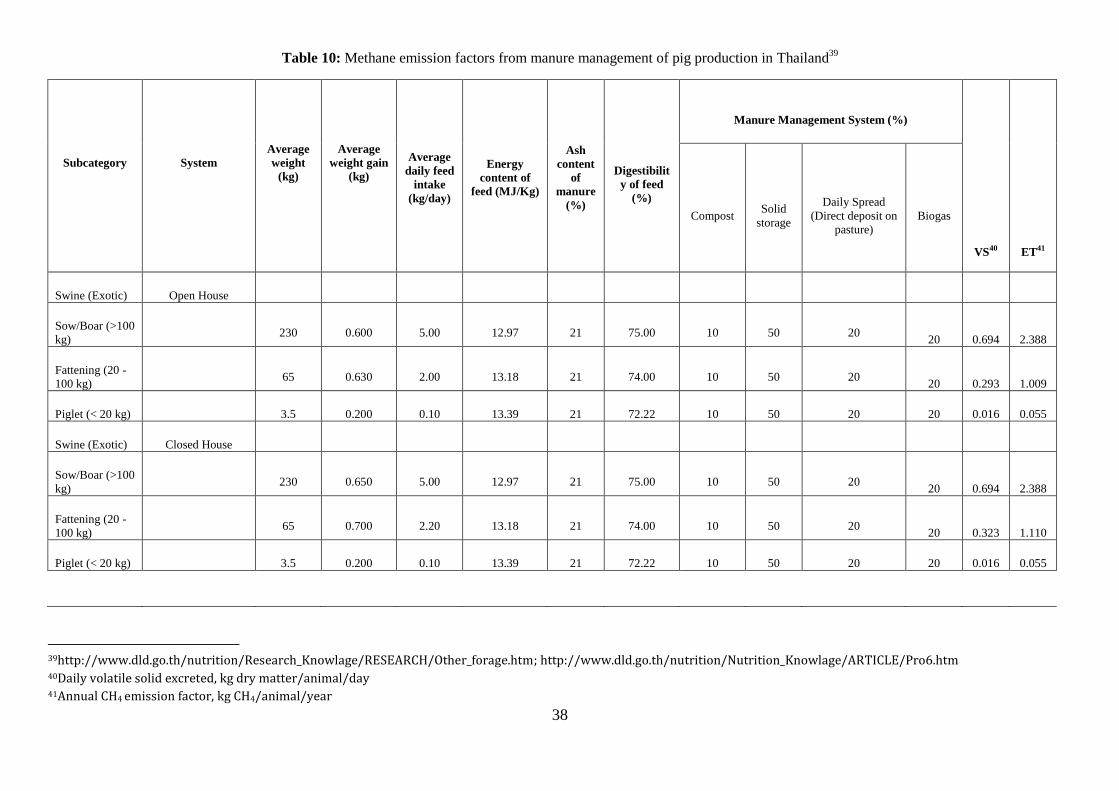
38
Table 10: Methane emission factors from manure management of pig production in Thailand39
Subcategory
System
Average
weight
(kg)
Average
weight gain
(kg)
Average
daily feed
intake
(kg/day)
Energy
content of
feed (MJ/Kg)
Ash
content
of
manure
(%)
Digestibilit
y of feed
(%)
Manure Management System (%)
VS40
ET41
Compost Solid
storage
Daily Spread
(Direct deposit on
pasture)
Biogas
Swine (Exotic) Open House
Sow/Boar (>100
kg)
230 0.600 5.00 12.97 21 75.00 10 50 20 20 0.694 2.388
Fattening (20 -
100 kg)
65 0.630 2.00 13.18 21 74.00 10 50 20 20 0.293 1.009
Piglet (< 20 kg)
3.5 0.200 0.10 13.39 21 72.22 10 50 20 20 0.016 0.055
Swine (Exotic) Closed House
Sow/Boar (>100
kg)
230 0.650 5.00 12.97 21 75.00 10 50 20 20 0.694 2.388
Fattening (20 -
100 kg)
65 0.700 2.20 13.18 21 74.00 10 50 20 20 0.323 1.110
Piglet (< 20 kg)
3.5 0.200 0.10 13.39 21 72.22 10 50 20 20 0.016 0.055
39http://www.dld.go.th/nutrition/Research_Knowlage/RESEARCH/Other_forage.htm; http://www.dld.go.th/nutrition/Nutrition_Knowlage/ARTICLE/Pro6.htm 40Daily volatile solid excreted, kg dry matter/animal/day 41Annual CH4 emission factor, kg CH4/animal/year
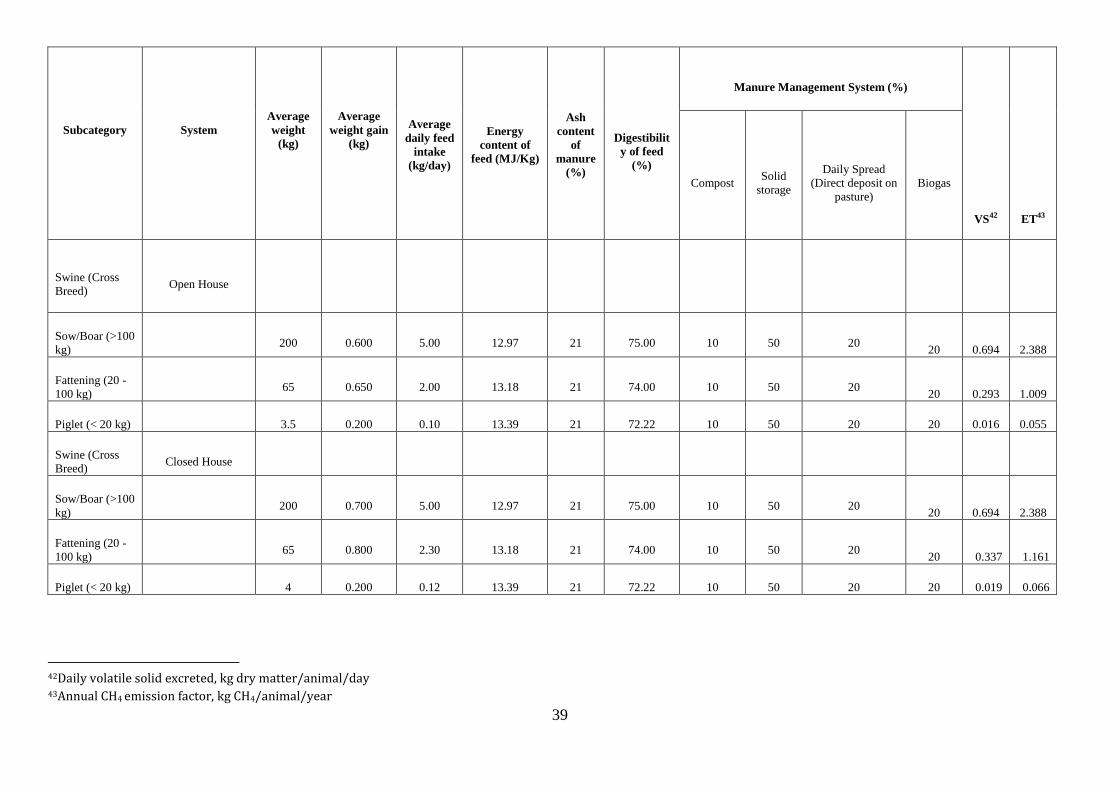
39
Subcategory
System
Average
weight
(kg)
Average
weight gain
(kg)
Average
daily feed
intake
(kg/day)
Energy
content of
feed (MJ/Kg)
Ash
content
of
manure
(%)
Digestibilit
y of feed
(%)
Manure Management System (%)
VS42
ET43
Compost Solid
storage
Daily Spread
(Direct deposit on
pasture)
Biogas
Swine (Cross
Breed) Open House
Sow/Boar (>100
kg)
200 0.600 5.00 12.97 21 75.00 10 50 20 20 0.694 2.388
Fattening (20 -
100 kg)
65 0.650 2.00 13.18 21 74.00 10 50 20 20 0.293 1.009
Piglet (< 20 kg)
3.5 0.200 0.10 13.39 21 72.22 10 50 20 20 0.016 0.055
Swine (Cross
Breed) Closed House
Sow/Boar (>100
kg)
200 0.700 5.00 12.97 21 75.00 10 50 20 20 0.694 2.388
Fattening (20 -
100 kg) 65 0.800 2.30 13.18 21 74.00 10 50 20
20 0.337 1.161
Piglet (< 20 kg) 4 0.200 0.12 13.39 21 72.22 10 50 20 20 0.019 0.066
42Daily volatile solid excreted, kg dry matter/animal/day 43Annual CH4 emission factor, kg CH4/animal/year
40
N2O emission from manure management
There are both direct and indirect N2O emissions from livestock manure. The former occurs
via combined nitrification and denitrification of nitrogen content in the manure. The latter results from
volatile nitrogen losses that occur primarily in the form of ammonia and NOx.
To estimate direct N2O emission from manure management, we need information on nitrogen
excretion rate per head for each livestock category or subcategory, and information on manure
management practices – the faction of total nitrogen excretion for each livestock category or
subcategory managed in each management system. However, collected information from the four
countries did not have the latter information. Therefore, it is not possible to estimate N2O emission
factors from each manure management system for comparison with default N2O emission factors
proposed by IPCC (2006). Further studies or data collection on manure management practices and N
partition of each livestock category and sub-category is necessary to develop N2O emission factor for
each country (Tier 2).
To estimate indirect N2O emission from manure management, we need information on the
two factions of N losses due to volatilization and leaching and two indirect N2O emissions factors
associated with these losses (EF4 and EF5). The collected information from the four countries did not
allow calculating the two fractions of N losses. To improve the certainty of estimation, each country is
encouraged to develop their own EF4 and EF5 values rather than using the default values of IPCC
(2006), however collected information from the four countries did not have information on ammonia
and NOx emission to the air from manure in each manure management system. It is therefore,
necessary to conduct studies on ammonia and NOx emission and N leaching from different manure
management systems.
The major forms of economic land use activities generating emissions of N2O and other trace
gases include livestock and crop production. Livestock production is the most complex system. To
estimate N2O emissions from animal manure during and after application as a fertilizer, the following
information is required: the number of animals in each category (e.g. dairy cattle), N excretion per
head by animal type, and the mode and amount of manure application, together with the emission
factors. For proper estimates of the ammonia and nitrogen oxides loss from animal waste, it is
essential to know the weather conditions during spreading (turbulence, air temperature, air humidity
and rainfall), the properties of the soil to which the manure is applied, the amount of manure per unit
area, and the period between application and cultivation. Data on animal populations by category, and
within a category (according to age and weight class) are almost non-existent. The four countries in
this study only have the total number of animals within a category is available for a specific year and
minimal sub-categories. Estimates for regions within countries may be available, but do not always
correspond to the official statistics or are outdated.
In many countries it is difficult to obtain data on the amount and composition (mineral N,
organic N, recalcitrant N) of animal waste for different age classes within animal categories.
Therefore, these data have to be estimated from the "average" animal in a particular country or
production system. Geographic data on the application rate and timing of manure application, soil
conditions, and weather conditions during application are not available. In addition to spatial
variability, manure application rates, and mode and timing of application, show a strong inter annual
variability, which is not easy to include in scaling exercises.
Data on crop production systems that are essential for estimating trace gas fluxes include
fertilizer use (including animal manure and other organic inputs), mass of residues ploughed into the
soil (in units of N), or the amount of crop produced whose residues are ploughed under (in units of
biomass). Such data may be available for regions within countries but may not always correspond to
the official statistics or may be outdated.
41
The current IPCC method for estimating direct N2O emissions from agricultural soils may not
capture all of the emission impacts for possible national mitigation measures, depending upon how the
method is implemented. Implementation depends, in part, upon the clarity and detail of the
methodology described in the IPCC Guidelines. The current IPCC method for estimating N2O
emissions from this source utilises three types of primary activity data:
Additions of nitrogen to soils from fertilizer application (synthetic and organic, including
animal wastes), cultivation of nitrogen-fixing crops, and incorporation of crop residues;
Mineralisation of soil organic matter (humus) through cultivation of histosols, and
Additions of nitrogen to soils from grazing animals.
Mitigation activities that directly reduce the magnitude of these activities (e.g., reduced
national consumption of fertilizers, reduced national populations of grazing animals) will be reflected
in national inventories because the underlying primary activity data will reflect these changes.
However, mitigation measures that affect, a) the conversion factors that are applied to the primary
activity data, or b) the emission factors that are applied to the final activity data, may not be reflected
in national inventories unless the inventory calculations incorporate these changes accurately. This
may be particularly problematic if mitigation measures are implemented to reduce a different GHG
source than N2O from agricultural soils, and the effects on sources that are not being targeted directly
are not evaluated or monitored. For example, if livestock feed practices are altered to improve
livestock productivity (and reduce associated CH4 emissions from digestion), and this results in a
change in nitrogen excretion per head, new nitrogen excretion rates will need to be developed and
used in the inventory calculations.
GHG emission from enteric fermentation and manure management of livestock in South East
Asian countries by using IPCC default emission factors
Table 11 presents methane emissions (t/y) from domestic livestock enteric fermentation of the
four countries in 2011.The estimation is based tier 1 method, using IPCC default emission factors. It
can be seen from the table that Indonesia occupies about 52.7% total methane emission from livestock
enteric fermentation with around 969,275 tone/year. It is reasonable, because Indonesia has a large
livestock population, especially beef cattle, sheep and goat compared to other countries in the region.
Methane emission from livestock enteric fermentation of Vietnam, Thailand and Malaysia occupies
23.5, 21.2 and 2.57% of total methane emissions from enteric fermentation of the four countries,
respectively (Figure 2). Malaysia has a very low methane emission from livestock domestic
fermentation due to their small livestock population.
Non-dairy cattle are the main source of methane emission from enteric fermentation, about
69% of the total methane emission from enteric fermentation. In Vietnam methane emission from
enteric fermentation of buffaloes takes a rather high part, about 35% of the total methane enteric
fermentation; however, it is not much in the other countries of Indonesia, Malaysia and Thailand;
about 7%, 14% and 18%, respectively. In Vietnam methane emission from dairy cattle enteric
fermentation is not much, about 2% in total enteric fermentation. This can be explained because
Vietnam has a small dairy cattle population.
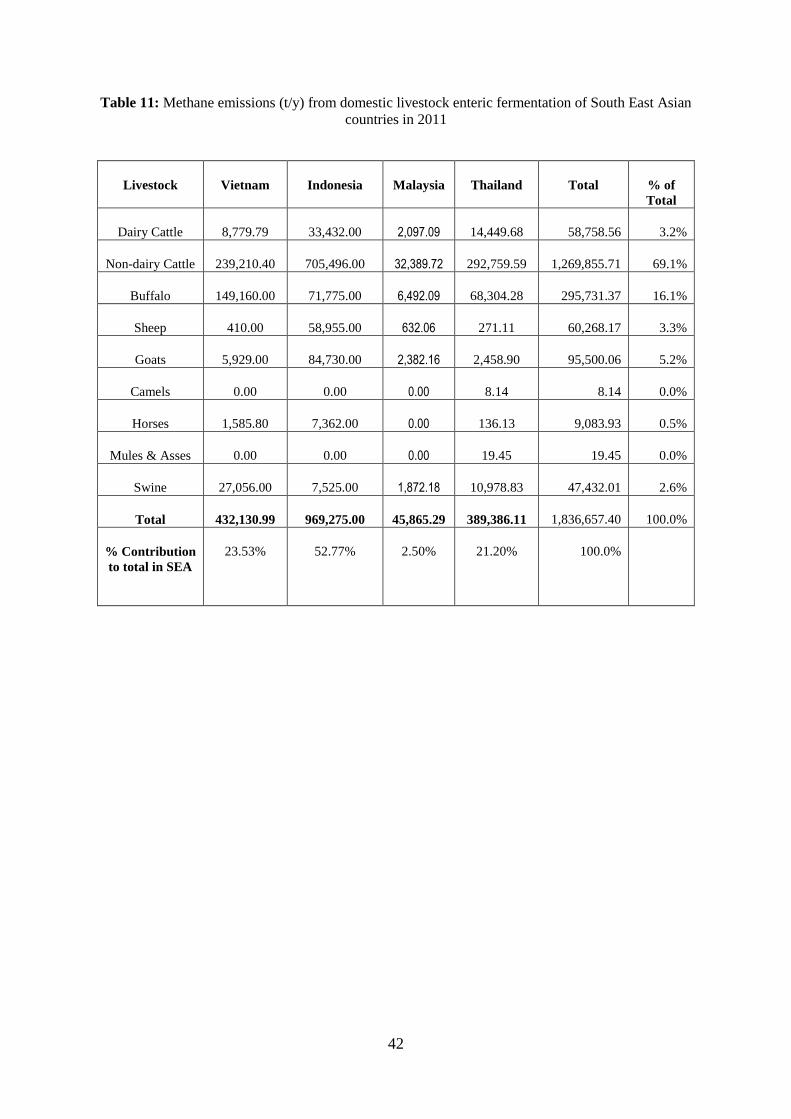
42
Table 11: Methane emissions (t/y) from domestic livestock enteric fermentation of South East Asian
countries in 2011
Livestock Vietnam Indonesia Malaysia Thailand Total % of
Total
Dairy Cattle 8,779.79 33,432.00 2,097.09 14,449.68 58,758.56 3.2%
Non-dairy Cattle 239,210.40 705,496.00 32,389.72 292,759.59 1,269,855.71 69.1%
Buffalo 149,160.00 71,775.00 6,492.09 68,304.28 295,731.37 16.1%
Sheep 410.00 58,955.00 632.06 271.11 60,268.17 3.3%
Goats 5,929.00 84,730.00 2,382.16 2,458.90 95,500.06 5.2%
Camels 0.00 0.00 0.00 8.14 8.14 0.0%
Horses 1,585.80 7,362.00 0.00 136.13 9,083.93 0.5%
Mules & Asses 0.00 0.00 0.00 19.45 19.45 0.0%
Swine 27,056.00 7,525.00 1,872.18 10,978.83 47,432.01 2.6%
Total 432,130.99 969,275.00 45,865.29 389,386.11 1,836,657.40 100.0%
% Contribution
to total in SEA
23.53% 52.77% 2.50% 21.20% 100.0%
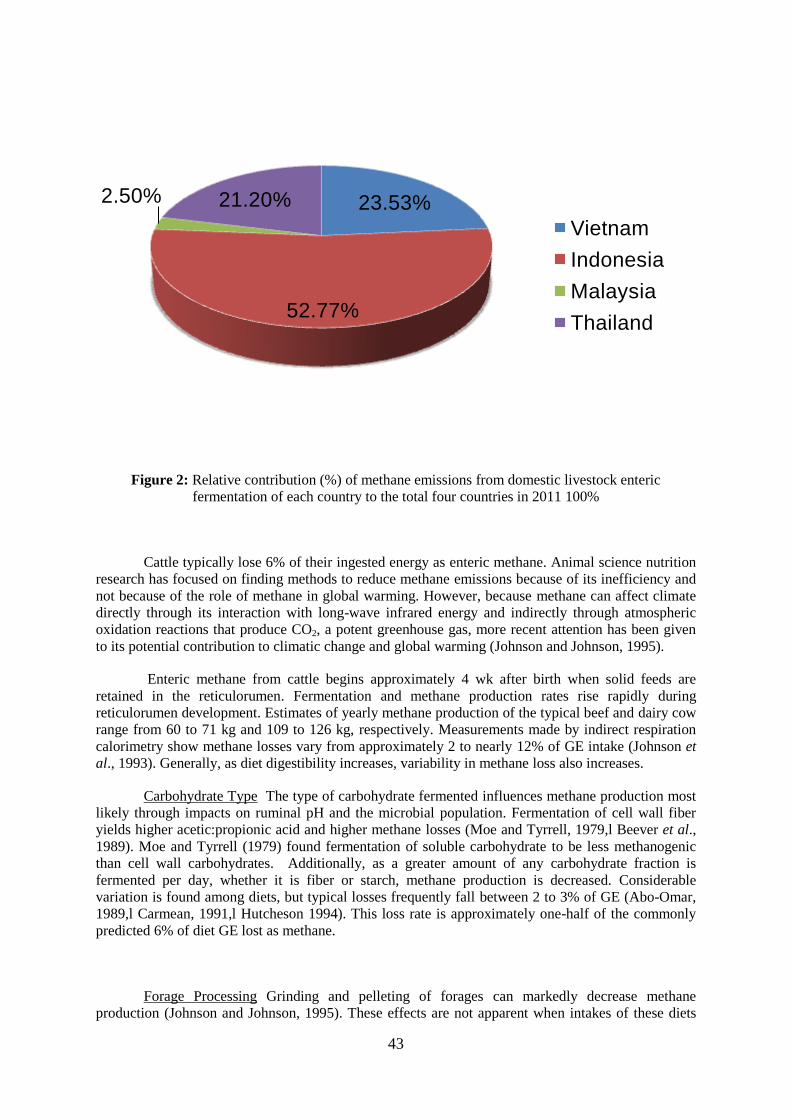
43
23.53%
52.77%
2.50% 21.20%
Vietnam
Indonesia
Malaysia
Thailand
Figure 2: Relative contribution (%) of methane emissions from domestic livestock enteric
fermentation of each country to the total four countries in 2011 100%
Cattle typically lose 6% of their ingested energy as enteric methane. Animal science nutrition
research has focused on finding methods to reduce methane emissions because of its inefficiency and
not because of the role of methane in global warming. However, because methane can affect climate
directly through its interaction with long-wave infrared energy and indirectly through atmospheric
oxidation reactions that produce CO2, a potent greenhouse gas, more recent attention has been given
to its potential contribution to climatic change and global warming (Johnson and Johnson, 1995).
Enteric methane from cattle begins approximately 4 wk after birth when solid feeds are
retained in the reticulorumen. Fermentation and methane production rates rise rapidly during
reticulorumen development. Estimates of yearly methane production of the typical beef and dairy cow
range from 60 to 71 kg and 109 to 126 kg, respectively. Measurements made by indirect respiration
calorimetry show methane losses vary from approximately 2 to nearly 12% of GE intake (Johnson et
al., 1993). Generally, as diet digestibility increases, variability in methane loss also increases.
Carbohydrate Type The type of carbohydrate fermented influences methane production most
likely through impacts on ruminal pH and the microbial population. Fermentation of cell wall fiber
yields higher acetic:propionic acid and higher methane losses (Moe and Tyrrell, 1979,l Beever et al.,
1989). Moe and Tyrrell (1979) found fermentation of soluble carbohydrate to be less methanogenic
than cell wall carbohydrates. Additionally, as a greater amount of any carbohydrate fraction is
fermented per day, whether it is fiber or starch, methane production is decreased. Considerable
variation is found among diets, but typical losses frequently fall between 2 to 3% of GE (Abo-Omar,
1989,l Carmean, 1991,l Hutcheson 1994). This loss rate is approximately one-half of the commonly
predicted 6% of diet GE lost as methane.
Forage Processing Grinding and pelleting of forages can markedly decrease methane
production (Johnson and Johnson, 1995). These effects are not apparent when intakes of these diets
44
are restricted. At high intakes, methane loss of diet can be reduced 20 to 40%. Okine et al. (1989)
reported a significant reduction in methane production (2.9%) when weights were added to the rumen.
Ammoniation (Birkelo et al., 1986) or protein supplementation of low-quality forages will increase
the methane losses proportional to the improvement in digestibility.
Lipid Additions Fat additions to ruminant diets impact methane losses by several
mechanisms, including biohydrogenation of unsaturated fatty acids, enhanced propionic acid
production, and protozoal inhibition. Czerkawski et al. (1966) demonstrated that addition of long-
chain polyunsaturated fatty acids decreased methanogenesis by providing an alternative metabolic
hydrogen acceptor to reduction of CO2. Sheep or cattle fed supplemental fat sources such as animal
tallow or soybean oil had decreased methane production compared with controls fed isocaloric diets
(Swift et al., 1948,l Haaland, 1978,l Van der Honing et al., 1981).
Ionophore Addition Ionophore additions to beef cattle diets, particularly monensin, reduces
feed intake 5 to 6%, decreases acetic:propionic acid ratio and decreases methane losses (Goodrich et
al., 1984). However, recent investigations indicate that the decrease in methane production is short-
lived (Abo-Omar, 1989,l Carmean, 1991,l Saa et al., 1993). Methane production per unit of diet by
cattle fed either grain or forage diets returned to initial levels within 2 wk. Therefore, the reduction
seen in methane production by ionophore supplemented cattle is likely to be related to the reduction in
feed intake and not a direct effect on methanogenesis.
Microbial Flora Alterations Ruminal protozoa may also play an important role in methane
production, particularly when cattle are fed high-concentrate diets. Ruminal methanogens have been
observed attached to protozoal species suggesting possible interspecies hydrogen transfer (Stumm et
al., 1982). Defaunation of the rumen of cattle fed a barley diet decreased methane production by
approximately one half (Whitelaw et al., 1984). At least three different acetogenic bacterial species
have been isolated from the rumen of cattle. Although these species possess the ability to reduce CO2
to acetate, they also have the ability to utilize other substrates including formate, glucose, cellobiose,
and fructose. The implication for most of the world is that the best strategy for mitigation of cattle
methane is likely to be enhancing the efficiency of feed energy use. Assuming a constant percentage
of methane loss, this strategy will decrease methane loss per unit of product and likely decrease
methane emissions by cattle over the long term.
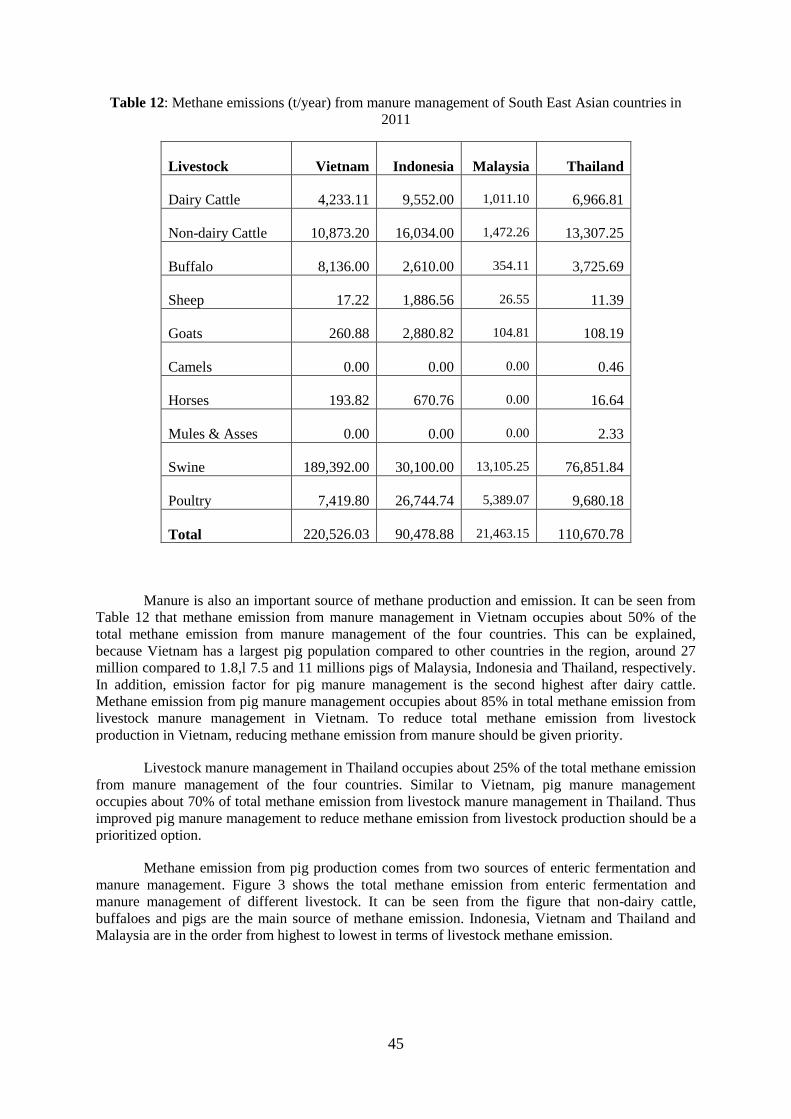
45
Table 12: Methane emissions (t/year) from manure management of South East Asian countries in
2011
Livestock Vietnam Indonesia Malaysia Thailand
Dairy Cattle 4,233.11 9,552.00 1,011.10 6,966.81
Non-dairy Cattle 10,873.20 16,034.00 1,472.26 13,307.25
Buffalo 8,136.00 2,610.00 354.11 3,725.69
Sheep 17.22 1,886.56 26.55 11.39
Goats 260.88 2,880.82 104.81 108.19
Camels 0.00 0.00 0.00 0.46
Horses 193.82 670.76 0.00 16.64
Mules & Asses 0.00 0.00 0.00 2.33
Swine 189,392.00 30,100.00 13,105.25 76,851.84
Poultry 7,419.80 26,744.74 5,389.07 9,680.18
Total 220,526.03 90,478.88 21,463.15 110,670.78
Manure is also an important source of methane production and emission. It can be seen from
Table 12 that methane emission from manure management in Vietnam occupies about 50% of the
total methane emission from manure management of the four countries. This can be explained,
because Vietnam has a largest pig population compared to other countries in the region, around 27
million compared to 1.8,l 7.5 and 11 millions pigs of Malaysia, Indonesia and Thailand, respectively.
In addition, emission factor for pig manure management is the second highest after dairy cattle.
Methane emission from pig manure management occupies about 85% in total methane emission from
livestock manure management in Vietnam. To reduce total methane emission from livestock
production in Vietnam, reducing methane emission from manure should be given priority.
Livestock manure management in Thailand occupies about 25% of the total methane emission
from manure management of the four countries. Similar to Vietnam, pig manure management
occupies about 70% of total methane emission from livestock manure management in Thailand. Thus
improved pig manure management to reduce methane emission from livestock production should be a
prioritized option.
Methane emission from pig production comes from two sources of enteric fermentation and
manure management. Figure 3 shows the total methane emission from enteric fermentation and
manure management of different livestock. It can be seen from the figure that non-dairy cattle,
buffaloes and pigs are the main source of methane emission. Indonesia, Vietnam and Thailand and
Malaysia are in the order from highest to lowest in terms of livestock methane emission.
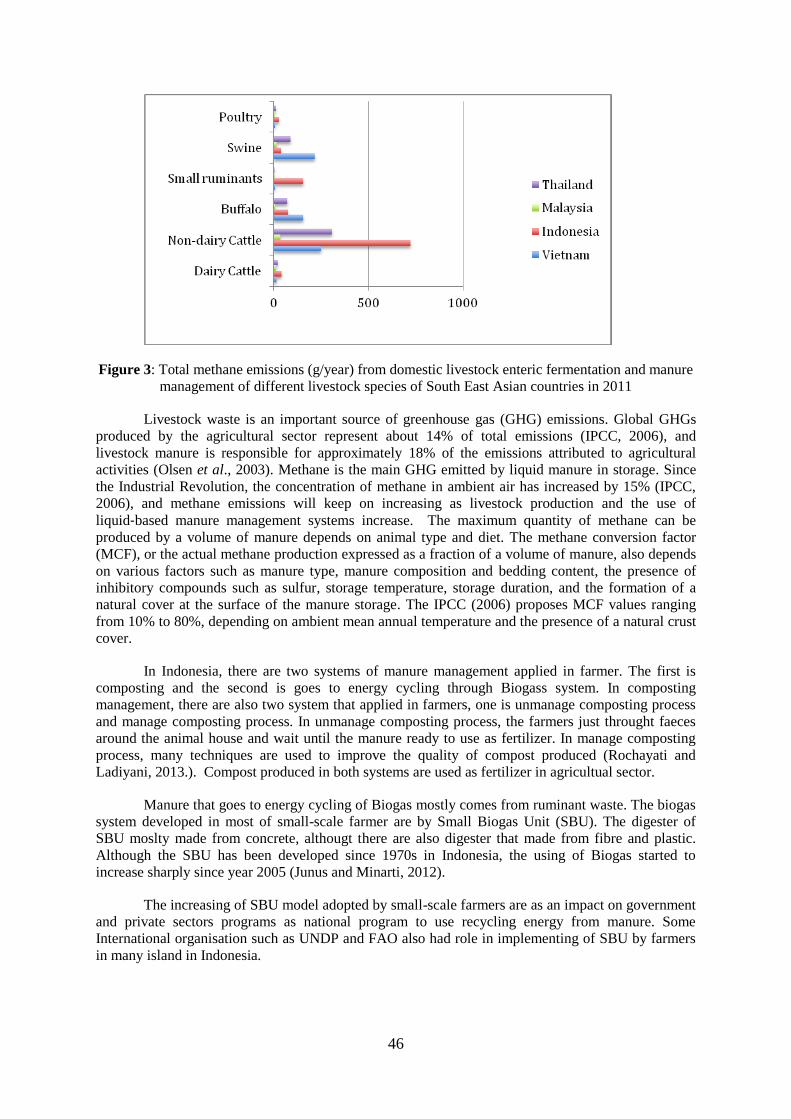
46
Figure 3: Total methane emissions (g/year) from domestic livestock enteric fermentation and manure
management of different livestock species of South East Asian countries in 2011
Livestock waste is an important source of greenhouse gas (GHG) emissions. Global GHGs
produced by the agricultural sector represent about 14% of total emissions (IPCC, 2006), and
livestock manure is responsible for approximately 18% of the emissions attributed to agricultural
activities (Olsen et al., 2003). Methane is the main GHG emitted by liquid manure in storage. Since
the Industrial Revolution, the concentration of methane in ambient air has increased by 15% (IPCC,
2006), and methane emissions will keep on increasing as livestock production and the use of
liquid‐based manure management systems increase. The maximum quantity of methane can be
produced by a volume of manure depends on animal type and diet. The methane conversion factor
(MCF), or the actual methane production expressed as a fraction of a volume of manure, also depends
on various factors such as manure type, manure composition and bedding content, the presence of
inhibitory compounds such as sulfur, storage temperature, storage duration, and the formation of a
natural cover at the surface of the manure storage. The IPCC (2006) proposes MCF values ranging
from 10% to 80%, depending on ambient mean annual temperature and the presence of a natural crust
cover.
In Indonesia, there are two systems of manure management applied in farmer. The first is
composting and the second is goes to energy cycling through Biogass system. In composting
management, there are also two system that applied in farmers, one is unmanage composting process
and manage composting process. In unmanage composting process, the farmers just throught faeces
around the animal house and wait until the manure ready to use as fertilizer. In manage composting
process, many techniques are used to improve the quality of compost produced (Rochayati and
Ladiyani, 2013.). Compost produced in both systems are used as fertilizer in agricultual sector.
Manure that goes to energy cycling of Biogas mostly comes from ruminant waste. The biogas
system developed in most of small-scale farmer are by Small Biogas Unit (SBU). The digester of
SBU moslty made from concrete, althougt there are also digester that made from fibre and plastic.
Although the SBU has been developed since 1970s in Indonesia, the using of Biogas started to
increase sharply since year 2005 (Junus and Minarti, 2012).
The increasing of SBU model adopted by small-scale farmers are as an impact on government
and private sectors programs as national program to use recycling energy from manure. Some
International organisation such as UNDP and FAO also had role in implementing of SBU by farmers
in many island in Indonesia.
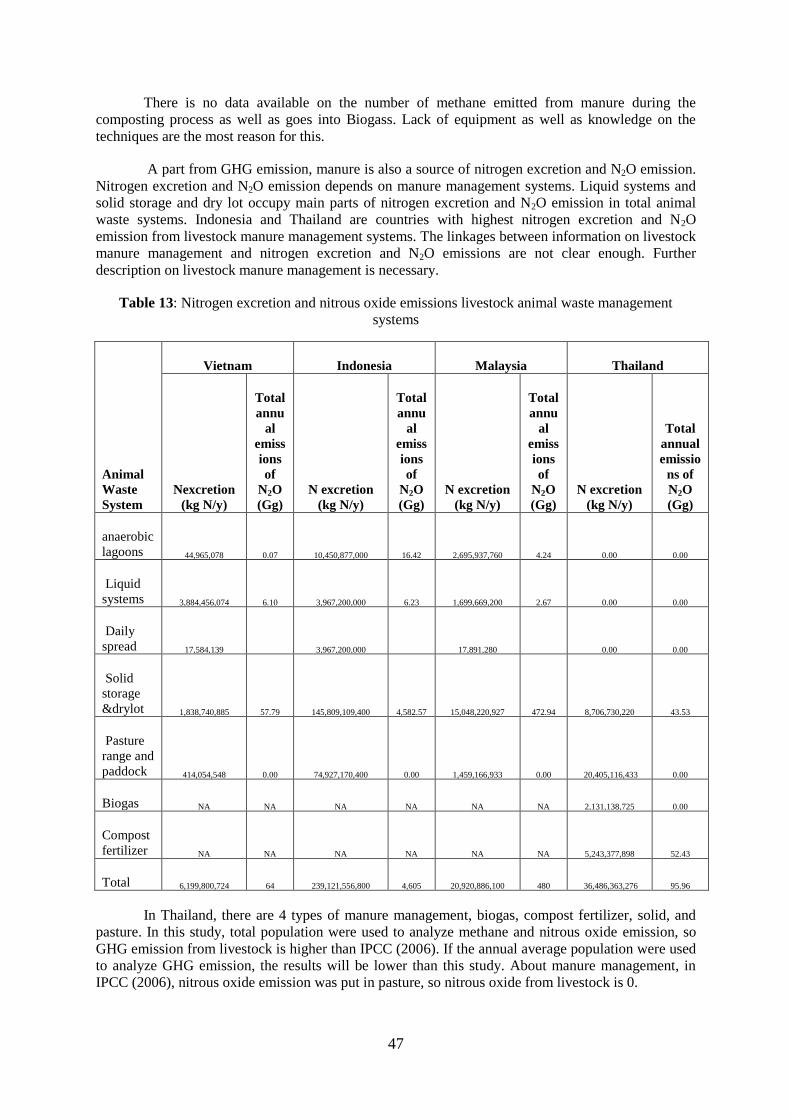
47
There is no data available on the number of methane emitted from manure during the
composting process as well as goes into Biogass. Lack of equipment as well as knowledge on the
techniques are the most reason for this.
A part from GHG emission, manure is also a source of nitrogen excretion and N2O emission.
Nitrogen excretion and N2O emission depends on manure management systems. Liquid systems and
solid storage and dry lot occupy main parts of nitrogen excretion and N2O emission in total animal
waste systems. Indonesia and Thailand are countries with highest nitrogen excretion and N2O
emission from livestock manure management systems. The linkages between information on livestock
manure management and nitrogen excretion and N2O emissions are not clear enough. Further
description on livestock manure management is necessary.
Table 13: Nitrogen excretion and nitrous oxide emissions livestock animal waste management
systems
Animal
Waste
System
Vietnam Indonesia Malaysia Thailand
Nexcretion
(kg N/y)
Total
annu
al
emiss
ions
of
N2O
(Gg)
N excretion
(kg N/y)
Total
annu
al
emiss
ions
of
N2O
(Gg)
N excretion
(kg N/y)
Total
annu
al
emiss
ions
of
N2O
(Gg)
N excretion
(kg N/y)
Total
annual
emissio
ns of
N2O
(Gg)
anaerobic
lagoons 44,965,078 0.07 10,450,877,000 16.42 2,695,937,760 4.24 0.00 0.00
Liquid
systems 3,884,456,074 6.10 3,967,200,000 6.23 1,699,669,200 2.67 0.00 0.00
Daily
spread 17,584,139
3,967,200,000
17,891,280
0.00 0.00
Solid
storage
&drylot 1,838,740,885 57.79 145,809,109,400 4,582.57 15,048,220,927 472.94 8,706,730,220 43.53
Pasture
range and
paddock 414,054,548 0.00 74,927,170,400 0.00 1,459,166,933 0.00 20,405,116,433 0.00
Biogas NA NA NA NA NA NA 2,131,138,725 0.00
Compost
fertilizer NA NA NA NA NA NA 5,243,377,898 52.43
Total 6,199,800,724 64 239,121,556,800 4,605 20,920,886,100 480 36,486,363,276 95.96
In Thailand, there are 4 types of manure management, biogas, compost fertilizer, solid, and
pasture. In this study, total population were used to analyze methane and nitrous oxide emission, so
GHG emission from livestock is higher than IPCC (2006). If the annual average population were used
to analyze GHG emission, the results will be lower than this study. About manure management, in
IPCC (2006), nitrous oxide emission was put in pasture, so nitrous oxide from livestock is 0.
48
Nitrification and denitrification are the most significant to production of GHG from manure
storage. Nitrification occurs under aerobic conditions and follows two steps where ammonium is first
oxidized to nitrite, and nitrite is then converted to nitrate. Bacteria involved in nitrification are
generally chemoautotrophic and require CO2, H2O, O2 and either NH4 + or NO2
– for growth, as well as
a pH above 5. Denitrification is the reduction of nitrate to dinitrogen gas according to: NO3– , NO2
–,
NO, N2O, N2. The process occurs under anaerobic conditions, and nitrogen products are used as the
terminal electron acceptor instead of oxygen. Nitrous oxide is produced when reduction is incomplete.
This process has been observed at temperatures between 2 and 50ºC, but every 10ºC rise in substrate
temperature may double the rate of denitrification. Denitrification will be minimal in fresh manures
where NO3– levels are low, but will increase as NH4
+ is oxidized to NO3
–. Incorporating straw into
manure caused bulk density to decrease and aeration to increase, allowing for easier diffusion of O2
into the manure pile and of N2O out of it. Manure samples that produced little or no N2O had low
concentrations of nitrate throughout the incubation and high levels of NH4+. N2O release from stored
manure was low when NH3 was high (FAO, 2013).
There are several techniques that have been suggested to reduce gas fluxes from manure
storage,l composting, anaerobic digestion, diet manipulation, covers and solid-liquid separation.
Compost Compost can be defined as “an aerobic process of decomposition of organic matter
into humus-like substances and minerals by the action of microorganisms with chemical and physical
reactions”. Composting has been shown to decrease odours, pathogens and weed seeds, as well as to
increase ease of transport by reducing weight and volume of manure.
In swine, after active composting of liquid hog manure with wheat straw, one study found
GHG emissions were reduced to 30% compared to untreated manure (FAO, 2013). However,
contributions to air and water pollution during processing via ammonia volatilization and nitrate
leaching may reduce its utility as a fertilizer and thereby its desirability as a mitigation measure. In
addition, studies that quantify all environmentally important gas emissions associated with
composting, including after field application, to determine if flux reductions during composting
counterbalance potential increases in emissions after application are lacking. Management applied
during the composting processes appears to have an important role in determining GHG emissions.
Anaerobic Digestion “Anaerobic digestion is a natural process whereby bacteria existing in
oxygen-free environments decompose organic matter”, resulting in a biogas of CH4 and CO2 and a
sludge that is stable and nearly odourless. In addition, organic acids accumulating while manure
temperatures are low may decrease pH inhibiting methanogenic bacteria even when temperatures
return to normal. When testing the efficacy of different inocula on a substrate of swine manure, it is
found that, of those tested, cattle manure proved to be the best inoculum due to its high soluble
chemical oxygen demand. The length of time before methanogenesis began did not affect the total
CH4 produced over the 100-d study. In addition, GHG emissions after anaerobic digestion treatment,
including during storage and application of treated manure to soils, need to be considered. In
Thailand, 1-20% of total manure was conducted as anaerobic digestion to produce biogas for
household in dary cattle and beef cattle, and for CDM and carbon credit in swine farm.
Diet Very little is known about the effects of diet on emissions from stored manure. In the
case of ruminants, research has focussed on reduction of CH4 emission due to enteric fermentation as
discussed above. Most studies on swine diet manipulation have tried to reduce odours or N content
and NH3 emission. In a review of the effects of diet manipulation on odour and GHG reduction from
swine, it is suggested that while most research has focussed on nutrient efficiency and digestion, these
factors are in fact related to GHG reduction. Total amount of N in the urine is also related to the
amount of dietary N-intake. 1998). Hence, as N2O emissions are related to the amount of N in the
manure, they should potentially be reduced with lower N excretion. Examining the effect of dietary
protein and non-starch polysaccharide on emissions from swine manure, it was found that no effect of
the latter, except in combination with low protein treatments. It was found that increasing non-starch
polysaccharide corresponded to increasing CH4. CO2 and CH4 were affected by protein content, with
higher emissions resulting from lower protein treatments, corroborating similar findings with dairy
49
cattle. Perhaps mention of studies utilizing local plants that have potential to reduce methanogenesis
in the rumen may be useful.
Covers In Europe, covers have been built in an attempt to reduce odour or capture biogas.
This is done by trapping the gas so that it cannot escape, and by preventing wind from removing the
gas and increasing the vapour pressure difference that would bring more gas to diffuse from lower
depths in the manure tank toward the surface. Captured biogas can be burned off or used as a fuel, and
reduce net GHG emissions as CH4 is oxidized to CO2, whose global warming potential is 21 times
lower than that of CH4.
Solid-liquid Separation The agricultural practice of solid-liquid separation of manure has been
used in part to increase the ease of handling and transporting effluent and to reduce odour, but may
also be used as a tactic to reduce GHG. Separated solids can be used in conjunction with anaerobic
digestion for biogas production. In Thailand, in swine farms, separate liquid and solid manure. They
use liquid manure to produce biogas in farm and solid manure as fertilizer in pasture, fruit orchard,
paddy rice, and crop land.
Pasture, where manure is left untreated, is often used for dairy cattle, beef cattle, sheep, and
goat, but detailed estimates of the proportion of manure excreted at pasture are lacking. The emission
estimates from excreta in grazing animals are less than 1% of enteric fermentation, and much smaller
than the emission from manure managed predominantly in liquid form. On the other hand, dung and
urine deposited at pasture, and manure applied to cropped fields, including grasslands, have been
shown to be important sources of N2O. In the Thailand GHG inventory based on IPCC (2006), these
emissions are listed under “soils”. (ONEP, 2000), or approximately 3% of Thai agricultural emissions.
Measurement of N2O emissions from soils has also been the subject of considerable attention (IPCC,
2006).
Livestock inventory improvement and biases reduction in regional emission estimates
Table 14 shows information on the contribution of livestock production to the total GHG
emission and the main sources of GHG emission in the four countries. It can be seen from the table
that livestock production in Vietnam contributes up to 45% of total GHG emission of the country,
however they are very small in the other countries, about 12%, 23% and 2% in Thailand, Malaysia
and Indonesia, respectively. The largest sources of GHG emission from livestock production are
enteric fermentation and manure management. In the four countries, livestock with main emission
from manure management are pigs, poultry, cattle and buffaloes while livestock with main emission
from enteric fermentation are cattle, goat and sheep.
In the four countries, Ministry of Natural Resources and Environment and Ministry of
Agricultural and Rural Development are responsible for publishing up the inventories. In Malaysia
and Indonesia, there have not been any inventory researches on GHG emissions from livestock
production. In Vietnam and Thailand, conducting inventory research is the responsibility of
universities, research institutes and departments of livestock development of the ministry of
agriculture and rural development.
In Thailand, livestock production emitted GHG 6% of total emission, 4% from enteric
methane and 2% from manure management (ONEP, 2000). In 2000, some sub category is not
complete. Inventory system of GHG emission from livestock is needed to be improved for corrected
analysis. Research work to improve inventory system is very necessary.
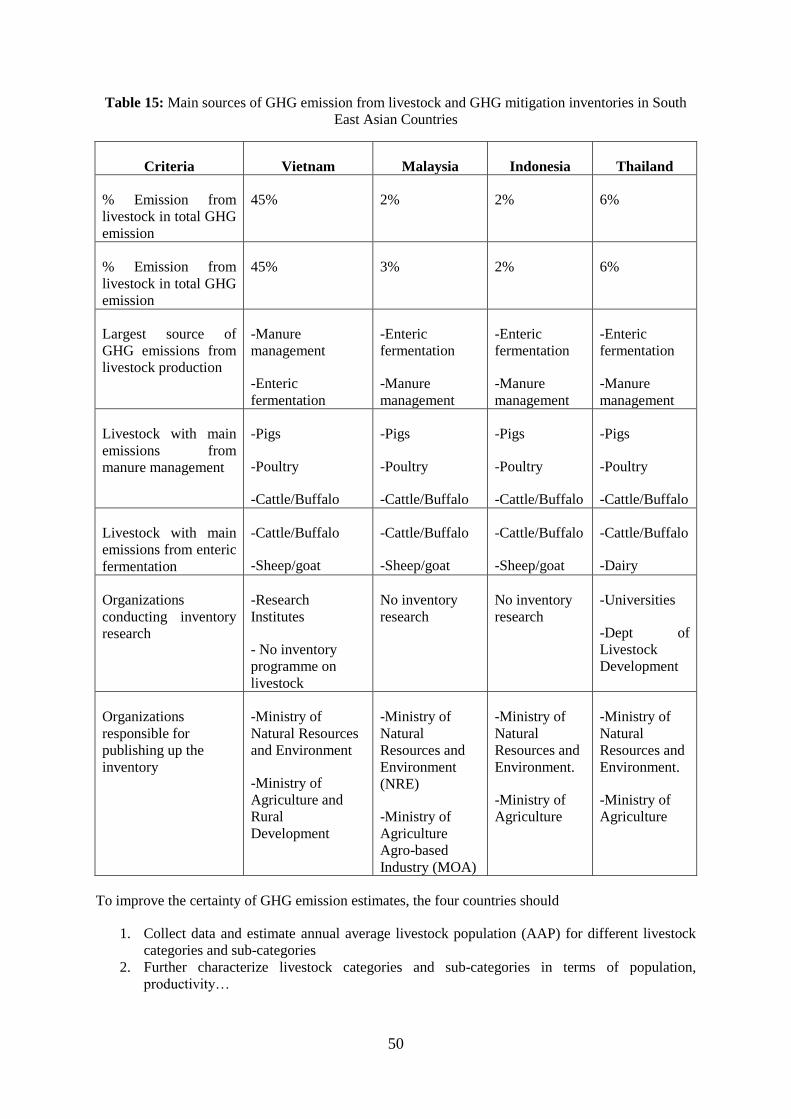
50
Table 15: Main sources of GHG emission from livestock and GHG mitigation inventories in South
East Asian Countries
Criteria Vietnam Malaysia Indonesia Thailand
% Emission from
livestock in total GHG
emission
45% 2% 2% 6%
% Emission from
livestock in total GHG
emission
45% 3% 2% 6%
Largest source of
GHG emissions from
livestock production
-Manure
management
-Enteric
fermentation
-Enteric
fermentation
-Manure
management
-Enteric
fermentation
-Manure
management
-Enteric
fermentation
-Manure
management
Livestock with main
emissions from
manure management
-Pigs
-Poultry
-Cattle/Buffalo
-Pigs
-Poultry
-Cattle/Buffalo
-Pigs
-Poultry
-Cattle/Buffalo
-Pigs
-Poultry
-Cattle/Buffalo
Livestock with main
emissions from enteric
fermentation
-Cattle/Buffalo
-Sheep/goat
-Cattle/Buffalo
-Sheep/goat
-Cattle/Buffalo
-Sheep/goat
-Cattle/Buffalo
-Dairy
Organizations
conducting inventory
research
-Research
Institutes
- No inventory
programme on
livestock
No inventory
research
No inventory
research
-Universities
-Dept of
Livestock
Development
Organizations
responsible for
publishing up the
inventory
-Ministry of
Natural Resources
and Environment
-Ministry of
Agriculture and
Rural
Development
-Ministry of
Natural
Resources and
Environment
(NRE)
-Ministry of
Agriculture
Agro-based
Industry (MOA)
-Ministry of
Natural
Resources and
Environment.
-Ministry of
Agriculture
-Ministry of
Natural
Resources and
Environment.
-Ministry of
Agriculture
To improve the certainty of GHG emission estimates, the four countries should
1. Collect data and estimate annual average livestock population (AAP) for different livestock
categories and sub-categories
2. Further characterize livestock categories and sub-categories in terms of population,
productivity…
51
3. Further characterize livestock production systems of different livestock categories and
subcategories in terms of scale, feed and feeding, management….
4. Further characterize manure management systems of different livestock categories and
subcategories in the sense that the amount of volatile solids, nitrogen partitioned in to
different manure management systems is quantified…
5. Study ammonia and NOx emission and N leaching from different manure management
systems of different livestock categories and sub-categories
6. There is a high variation between livestock subcategories and between countries in terms of
estimated methane emission factors (both enteric fermentation and manure management) and
there is a high deviation from IPCC default emission factors. Thus, it is necessary to develop
specific emission factors for each country. This will increase the certainty of the estimation.
7. To be able to summarize/analyze the date, the four countries should develop and use a
template form which must be understood similarly by the partners in the four countries.
In Vietnam, Indonesia44
, Malaysia, and Thailand research and practices on GHG emission and
on mitigation options have been focusing on
1. Waste/manure management: Biogas is the most common options to reduce environmental
pollution and GHG emission. In addition, biogas systems provide a substantial energy source for
farmers, especially in the rural areas. Different research has been focusing on
- Improving biogas efficiency,
- The use of gases produced by biogas systems, especially the surplus gases which are
normally released directly to the atmosphere,
- The use of waste products after biogas for crop production
- Effects of different additives, substrates on gas production efficiency of biogas systems
2. Manipulating diets to reduce GHG and other compound production and emission: Research
has been focusing on replacing different sources of N in ruminant diets. For pigs, research has
focusing on changing protein, fermentable carbohydrates levels and types, supplementing additives,
phase feeding…
3. Animal house design to reduce GHG emission and environmental pollution such as urine
and feces separation systems in the animal houses.
4. Identify manure characteristics and describe manure management systems of different
livestock categories.
5. Some in vitro and in vivo experiments have focused on evaluating enteric methane
fermentation of livestock fed by various feed types.
6. Investigation of the availability of annual data for the DE and crude protein values of
specific diet and feed components for foraging and feedlot animals.
7. Updating input variables that are from older data sources, such as beef births by month and
beef cow lactation rates and do research of GHG emission in each sub category of animal age, feed
type, manure management.
8. Reevaluation of the appropriate age to begin inclusion of enteric fermentation emissions
from calves.
44The other countries did not provide information on GHG emission and mitigation options
52
9. Given the many challenges in characterizing dairy diets, further investigation will be
conducted on additional sources or methodologies for estimating DE for dairy.
10. The possible breakout of other animal types (i.e., sheep, swine, goats, horses) from
national estimates to state-level estimates or updating to Tier 2 methodology,l and
11. The investigation of methodologies for including enteric fermentation emission estimates
from poultry.
There are available facilities such as respiratory chambers, GCs, face masks… for measuring
GHG emission from livestock. It is more important to standardize measurement methods, which allow
data comparison among studies.
In Vietnam, there are some funding streams for doing research on GHG emission reduction
and environmental pollution. They are mainly managed by ministry of science technology, ministry of
natural resources and environment and ministry of agriculture and rural development. There are a few
bilateral cooperation between countries on climate change mitigation and adaptation for example the
Danish support program. Many non-government organizations have been focusing on climate change
but mainly on improving adaptation capacity of the local residents. GHG mitigation is still a new
topic in the research agenda, and training curriculums of the universities and research institutes.
In Indonesia, related to inventory data activity, Indonesian Planning Agencies (BAPPENAS)
and Departement of Agricultural are running some programs in inventory data activities and also
implementing the mitigation and adaptation technologies for GHG in all Indonesia region. Lack of
data on inventory of GHG emission from many regions in Indonesia is due to the less-knowledge
about the IPCC. A program of socialisation about a simple calcluation of GHG emission based on
IPCC 2006 has been running in 2013 centraled in 8 big provinces of Indonesia. The program was lead
by Departement of Agriculture with researchers as speaker and the trainees were from local
government officers and local researchers.
Departement of Agriculture undertake some workshops following by colaboration between
Research Institutes and Universities produced books related to the information on local feed sources
and they potency to reduce methane emission, mitigation techniques and procedure of inventory data.
In Malaysia, at present all methods for estimation of GHG are based on IPCC Tier 1 which is
solely based on animal species and numbers. Nevertheless, there are initiatives to improve the
estimation protocol based on the assimilation of more production data parameters. The Ministry of
Natural Resources is responsible for reporting GHG inventories and the Ministry of Agriculture, in
particular MARDI is the secretariat for the agricultural sector. It is expected that the country would be
moving towards the Tier 2 approach in the coming years.
53
Appendix 1
IMPROVED INVENTORY AND MITIGATION OF GREENHOUSE GASES IN LIVESTOCK PRODUCTION IN
SOUTH EAST ASIA:
Central Research Institute for Animal Science, Indonesia
Malaysia Agriculture Research and Development Institute (MARDI)
Department of Livestock Development, Ministry of Agriculture and cooperation, Thailand
Institute of Agricultural Sciences of South Viet Nam (IAS)
A PROPOSAL FOR FUNDING TO THE NEW ZEALAND GOVERNMENT
54
Table of Contents
Background: ...................................................................................................................................... 55
Overall goal:...................................................................................................................................... 56
Stage One Project: ............................................................................................................................. 56
Aim: .................................................................................................................................................. 56
Objectives: ........................................................................................................................................ 56
Methodology: ...................................................................................................................................... 2
Objective 1: ..................................................................................................................................... 2
Objective 2: ..................................................................................................................................... 2
Objective 3: ..................................................................................................................................... 3
Objective 4: ..................................................................................................................................... 3
Objective 5: ..................................................................................................................................... 3
Objective 6: ..................................................................................................................................... 4
Time frame for Stage One: ............................................................................................................... 59
Resources required for Stage One:.................................................................................................... 59
Funding for Stage One: ..................................................................................................................... 59
55
Improved inventory and mitigation of greenhouse gases in livestock production in South East
Asia
Background:
The Governments of Thailand and New Zealand jointly hosted a 2-day workshop on measurement
and mitigation of greenhouse gases (GHGs) in South-East Asian livestock systems, on 14/15 March
2012 in Bangkok, Thailand. Four countries from the region participated in the workshop: Thailand,
Indonesia, Malaysia and Viet Nam. The workshop was held under the auspices of the Livestock
Research Group (LRG) of the Global Research Alliance on agricultural greenhouse gases (the
Alliance), as part of a broader set of activities by the LRG to build regional capacity in developing
countries. The workshop was sponsored by the New Zealand government through its Ministry for
Primary Industries as part of its support for the Alliance.
The workshop participants identified and agreed a set of four activities that would help build regional
capacity and advance knowledge on emissions and mitigation options:
1) Inventories:
a) to develop a common classification of production systems that better represents
regional practices and existing activity data, and
b) to identify key areas within those production systems where region/country-specific
emission factors could be developed via measurements, and to undertake priority
measurements across the region
2) Mitigation (feed systems): to explore options for improved animal feeding to improve
productivity and reduce emissions intensity, based on locally relevant feeding systems,
species, and pasture management options
3) Mitigation (feed additives): to identify potential locally appropriate feed additives to
mitigate enteric CH4
4) Mitigation (manure): to explore options for improving manure management systems (both
biogas and manure treatment), with consideration of options that suit small-holder farms
Concept notes were developed for each activity,l led, as follows by, Thailand (inventories), Indonesia
(mitigation – feed systems), Malaysia (mitigation – feed additives), Viet Nam (mitigation – manure).
The concept notes summarised the goals, benefits, existing capacity, relevant institutions and
individuals, and critical capacity and support needs in each country and collectively in the region.
Based on the concept notes, an initial project (stage one of an anticipated much larger project) was
identified to develop a full understanding of livestock systems in south-east Asia and use this to
identify priority areas for improving the quantification and mitigation of non-CO2 GHG emissions.
56
The New Zealand Government agreed to fund this first stage in principle. This document outlines the
project and serves as a proposal for funding for the project to the New Zealand Government.
Overall goal:
Improved inventory and mitigation of greenhouse gases in livestock production in South East
Asia
Stage One Project:
Aim:
To develop, for the South East Asia region, a full understanding of the diversity of livestock systems
and from that identify priority areas for improving the quantification and mitigation of non CO2 GHG
emissions.
Objectives:
1. Describe the key livestock systems and the main associated livestock emissions in the SE
Asia region.
2. Analyse the data set to identify common and, where relevant, country-specific priority areas
for improvement of emissions estimates.
3. Identify specific and realistic steps by which livestock emissions inventories can be improved
or modified to better reflect regional systems and practices for the identified priority areas and
to reduce biases and uncertainties in regional emissions estimates.
4. Convene a workshop to discuss options, identify common priority actions, and agree on the
final recommendations.
5. Submit a report to the New Zealand Ministry for Primary Industries via the New Zealand
Agricultural Greenhouse Gas Research Centre.
6. Deliver a poster/paper at the GGAA conference in June 2013 looking at the process of the
project (and/or the ATCWG agriculture working group of APEC (Indonesia 2013)).
Methodology:
Objective 1:
Describe the key livestock systems and the main associated livestock emissions in the SE Asia region.
Tasks:
4. Develop a template to collect and report regional data on livestock systems and estimated
emissions that is agreed to by all participants.
5. Each participating country to collect comprehensive regional data on livestock systems and
emissions using the agreed common template.
6. Each participating country to submit their data set to Viet Nam (and to NZAGRC) to compile
the data for use in Objective 2 and to Thailand for use in the final report.
Timeline: October – November 2012
57
Objective 2:
Analyse the data set to identify common and, where relevant, country-specific priority areas for
improvement of emissions estimates.
Tasks:
3. Analyse the collected data to identify the common livestock systems across the region and
identify the common and, where relevant, country-specific priority areas – where most gains
can be made to improve inventories. The analysis will be coordinated by Viet Nam in
collaboration with all participating countries.
4. Viet Nam to submit the analysis to all country representatives (and NZAGRC) for use in
Objective 3 and to Thailand for use in the final report.
Timeline: December – February 2013
Objective 3:
Identify specific and realistic steps by which livestock inventories can be improved or modified to
better reflect regional systems and practices for the identified priority areas and to reduce biases and
uncertainties in regional emissions estimates.
Tasks:
3. Each country to gather more detailed data for the common priority areas for each country
4. Each country will consider the following for their own country, and report on its findings
using an agreed template (to be developed with the assistance of NZAGRC):
viii. Assess the appropriateness of the current methodologies used.
ix. Assess the validity of the IPCC default emission factors for the common priority areas.
x. Assess availability and robustness of available activity data for current livestock
classification systems used in emissions inventories.
xi. Determine where the default classifications and Emission Factors differ most significantly
from the actual livestock systems present in the region.
xii. Identify the options for improving activity data or the targeted measurement of Emission
Factors for more accurate emission estimates.
xiii. Identify the available mitigation options and the current research being undertaken in the
identified priority areas.
xiv. Identify potential funding streams and time frames for funding rounds (national funding
streams, university fellowship programmes, international/regional development banks
etc).
58
Timeframe: March – April 2013
Objective 4:
Convene a workshop to discuss options, identify common priority actions and agree on the final
recommendations for future work to enhance regional capacity, improve inventories and mitigation of
GHG emissions from livestock systems in south-east Asia.
Tasks:
6. Discuss the individual country priority areas and determine the regional priority framework to
obtain the balance between individual country priorities and regional priorities.
7. Discuss and agree on the final recommendations for the next stage of the project.
8. Agree the outline and content of the final report.
9. Develop a two-page concept note for each of the agreed priority areas.
10. A workshop report (compiled by NZAGRC) to be submitted to Thailand within 10 days for
use in the final report.
Timeline: April 2013
Objective 5:
Submit a report to the New Zealand Ministry for Primary Industries.
Tasks:
8. Thailand to draft a report for circulation to all country representatives for review and
comment.
9. All country representatives to approve the final report following modifications based on
feedback.
Timeline: May - June 2013
Objective 6:
Deliver a poster/paper at the GGAA conference in June 2013 looking at the process of this project.
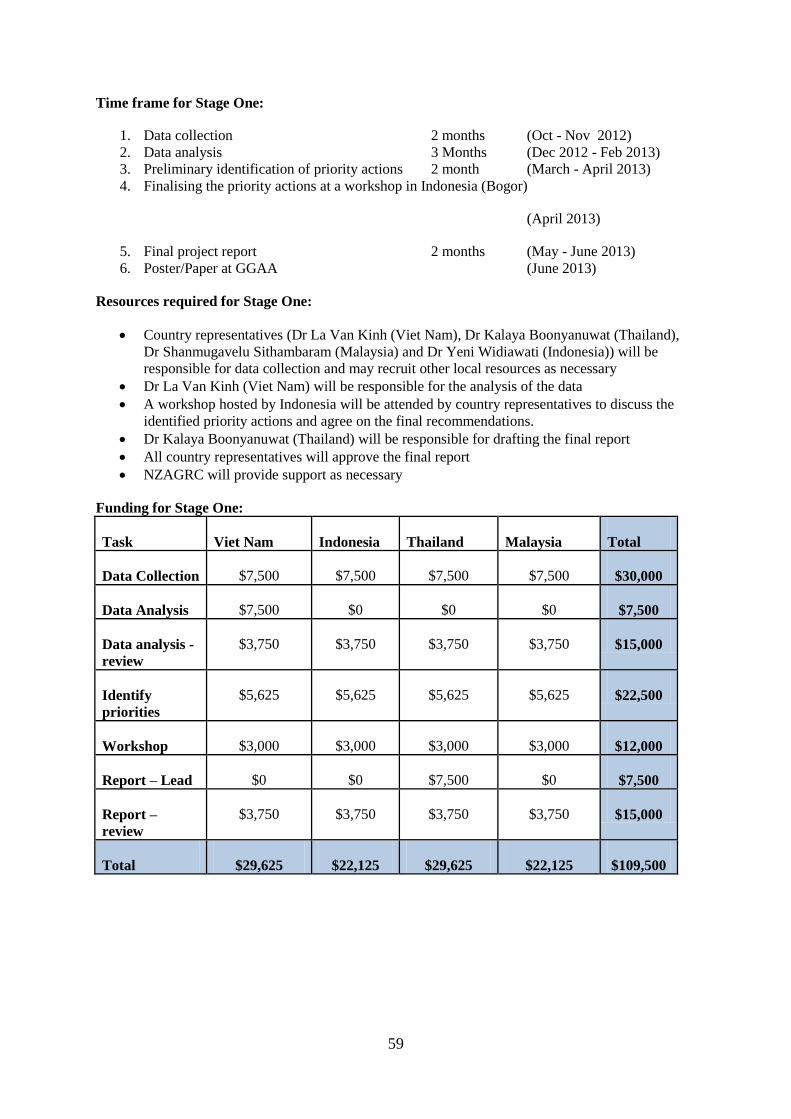
59
Time frame for Stage One:
1. Data collection 2 months (Oct - Nov 2012)
2. Data analysis 3 Months (Dec 2012 - Feb 2013)
3. Preliminary identification of priority actions 2 month (March - April 2013)
4. Finalising the priority actions at a workshop in Indonesia (Bogor)
(April 2013)
5. Final project report 2 months (May - June 2013)
6. Poster/Paper at GGAA (June 2013)
Resources required for Stage One:
Country representatives (Dr La Van Kinh (Viet Nam), Dr Kalaya Boonyanuwat (Thailand),
Dr Shanmugavelu Sithambaram (Malaysia) and Dr Yeni Widiawati (Indonesia)) will be
responsible for data collection and may recruit other local resources as necessary
Dr La Van Kinh (Viet Nam) will be responsible for the analysis of the data
A workshop hosted by Indonesia will be attended by country representatives to discuss the
identified priority actions and agree on the final recommendations.
Dr Kalaya Boonyanuwat (Thailand) will be responsible for drafting the final report
All country representatives will approve the final report
NZAGRC will provide support as necessary
Funding for Stage One:
Task Viet Nam Indonesia Thailand Malaysia Total
Data Collection $7,500 $7,500 $7,500 $7,500 $30,000
Data Analysis $7,500 $0 $0 $0 $7,500
Data analysis -
review
$3,750 $3,750 $3,750 $3,750 $15,000
Identify
priorities
$5,625 $5,625 $5,625 $5,625 $22,500
Workshop $3,000 $3,000 $3,000 $3,000 $12,000
Report – Lead $0 $0 $7,500 $0 $7,500
Report –
review
$3,750 $3,750 $3,750 $3,750 $15,000
Total $29,625 $22,125 $29,625 $22,125 $109,500
60
Reference
Abo-Omar,J.M. 1989. Methane losses by steers fed ionophores singly or alternatively. W.D.
Dissertation. Colorado State Univ., Fort Collins.
Alimon, A.R., Abubakr, A.R., Yaakub. H., Abdullah, N. Ivan, M. 2012. Digestibility, rumen protozoa
population and rumen fermentation in goats received palm oil by-products. Proceedings of the
5th International Conference on Animal Nutrition 2012. Malacca, Malaysia, 24th-26th April
2012 pp. 138-142.
Antonius. 2009. Pemanfaatan jerami padi fermentasi sebagai subtitusi rumput gajah dalam ransum
sapi. JITV :14:270-277.
Bal,M.A., R.D.Shaver, A.G.Jirovec, K.J.Shinners and J.G.Coors. 2000. Crop processing and chop
length of corn silage: effects on intake, digestion, and milk production by dairy cows. J. Dairy
Sci. 83:1264-1273.
Beauchemin, K.A. 1991. Effects of dietary neutral detergent fiber concentration and alfalfa hay
quality on chewing, rumen function, and milk production of dairy cows. J. Dairy Sci.
74:3140-3151.
Beauchemin,K.A., D.Colombatto, D.P.Morgavi and W.Z.Yang. 2003. Use of exogenous fibrolytic
enzymes to improve feed utilization by ruminants. J. Anim. Sci. 81:E37-E47.
Beever,D.E., S.B.Camrnell, J.D.Sutton, M.C.Spooner, M.J.Haines, and J.I.Harland. 1989. The effect
of concentrate type on energy utilization in lactating cows. Proc. 11th Symp. on Energy
Metabolism EAAP Publication No. 43:33.
Berger,L.L., G.C.Fahey,Jr., L.D.Bourquin and E.C.Titgemeyer. 1994. Ch.23 in Forage Quality,
Evaluation, and Utilization. Madison, WI; American Society of Agronomy, Inc.
Birkelo,C.P., D.E.Johnson, and G.M.Ward. 1986. Net energy value of ammoniated wheat straw. J.him
Sci. 63:2044.
Carmean,B.R. 1991. Persistence of monensin effects on nutrient flux in steers. M.S. Thesis. Colorado
State Univ., Fort Collins.
Campling, R.C. 1991. Processing cereal grains for cattle. a review. Livestock Prod. Sci. 28:223-234.
Choo, P.Y. and H.K. Ong. 2000. Environmental issues of livestock production. In: Malaysian
Livestock and Veterinary Industries Directory, Dept. of Veterinary Services and Trans-Events
Sdn. Bhd., p.42-46
COES. 2012. Compendium of environment statistics, Malaysia 2012, Department Of Statistics,
Malaysia. December 2012.
Czerkawski,J.W., K.L.Blaxter, and F.W.Wainman. 1966. The metabolism of oleic, linoleic, and
linolenic acids by sheep with reference to their effects on methane production. Br. J. Nutr.
20:349.
DAN. 2011. Dasar Agromakanan Negara (DAN), 2011-2020, Kementerian Pertanian dan Industri
Asas Tani, ISBN 978-983-9863-39-0.
61
DanT. Thi, T. AnhHoa, L. Quang Hung, B. Minh Tri, H. T. Kim Hoa, L. ThanhHien, N. Ngoc Tri, P.
Gerber, H. Menzi 2008. Animal waste management in Vietnam-problems. Sustainable
Organic Waste Management for Environmental Protection and Food Safety p 337-340
Dau Van Hai, Bui Nhu Mac. 2006. Genetic improvement of local goat breed at Than Luong village,
Binh Long district, BinhPhuoc province. http://www.giasuclonrrtc.com/tin-tuc/chi-tiet/19-cai-
tien-di-truyen-giong-de-diA-phuong--tai-xa-thAnh-luong-huyen-binh-long-tinh-binh-
phuoc.htm.
Department of Livestock Development. 1981. Report of Nutrition Research. Available :
http://www.dld.go.th/nutrition/Research_Knowlage/LIBRARY/LIBRARY3_2528.htm, June
15, 2013.
Department of Statistics Malaysia. 2011. Livestock and Animal Health Statistics.
Department of Statistics Malaysia. 2012. Livestock and Animal Health Statistics.
Dinh Van Cai. 2003. Reproductive and milk production of pure Holstein Friesian to be raised around
Hochiminh city. Journal of Science and Technics animal Husbandry No 4/2003. Institute of
National Animal Husbandry
Dinh Van Cai, Hoang ThiNgan. 2006. Using some high productivity goat to improve productivity of
local goat. http://vndocs.docdat.com/docs/index-13752.html.
Dinh Van Cai, Hoang ThiNgan. 2007. Study on nutritive ration of managing system of female
Holstein for breeding. Dairy Vietnam
DinhXuan Tung, Hang Anh Tuan 2011. Effective comparison of farming systems, farm sizes in pig
production. Meeting in animal husbandry with emphasized in smallholder and big farm. Ha
Noi
DLD. 2012. Thailand livestock statistics. Department of Livestock Development. Available:
http://www.dld.go.th/ict/th/index.php?option=com_content&view=article&id=629:2554&cati
d=253:-2554-&Itemid=123, September 15, 2013.
DOS. 2011. Selected indicators for agriculture, crops and livestock 2006-2010. Department of
Statistics, December 2011
DVS. 2011. Department Of Veterinary Services, Ministry of Agriculture & Agro-Based Industry
Malaysia.
Dwi Yulistiani., W. Puastuti, E. Wina, dan Supriati. 2012. Pengaruh berbagai pengolahan terhadap
nilai nutrisi tongkol jagung: Komposisi kimia dan kecernaan in vitro. JITV:17:59-66.
FAO. 2013. Mitigation of greenhouse gas emissions in livestock production. FAO, Rome, Italy. 206
pp.
FAOSTAT. 2013. FAO Statistical Yearbook, World Food and Agriculture, Food and Agriculture
Organization of the United Nations, Rome, 2013. ISBN 978-92-5-107396-4.
Firkins,J.L., M.L.Eastridge, N.R.St-Pierre, and S.M.Noftsger. 2001. Effects of grain variability and
processing on starch utilization by lactating dairy cattle. J. Anim. Sci. 79:E218-E238.
62
Francisco,R.V. 1997. Greenhouse gas sources and sinks fromPhilippine agriculture, land use and
forestry. In: Moya, T.B. (Ed.), Greenhouse Gas Emissions, Aerosols, Land Use and Cover
Changes in Southeast Asia. The Environmental Research Institute, Chulalongkorn University,
Bangkok, Thailand, pp. 7–17.
General Statistics Office Of Thailand. 2007. National statistic. General Statistics Office Of Thailand.
General Statistics Office Of Thailand. 2008. National statistic. General Statistics Office Of Thailand.
General Statistics Office Of Thailand. 2009. National statistic. General Statistics Office Of Thailand.
General Statistics Office Of Thailand. 2010. National statistic. General Statistics Office Of Thailand.
General Statistics Office Of Thailand. 2011. National statistic. General Statistics Office Of Thailand.
General Statistics Office Of Viet Nam 2007. National statistic. General Statistics Office Of Viet Nam.
General Statistics Office Of Viet Nam 2008. National statistic. General Statistics Office Of Viet Nam.
General Statistics Office Of Viet Nam 2009. National statistic. General Statistics Office Of Viet Nam.
General Statistics Office Of Viet Nam 2010. National statistic. General Statistics Office Of Viet Nam.
General Statistics Office Of Viet Nam 2011. National statistic. General Statistics Office Of Viet Nam.
Ginting, S. 2013. Limbah Perkebunan Untuk Pakan Ternak Ruminansia Dan Potensinya Menurunkan
Emisi Gas Metana. In : Potensi bahan Pakan Lokal untuk Menurunkan Gas Metana Ternak
Ruminansia. Pp. 43-66. IAARD Press.
Goodrich,R.D., J.E.Garrett, D.R.Gast, M.A.Rick, D.A.Larson, and J.C.Mieske. 1984. Influence of
monensin on the performance of cattle. J. Anim. Sci. 58:1484.
Goopy,J.P., and R.S.Hegarty. 2004. Repeatability of methane production in cattle fed concentrate and
forage diets. J. Anim. Feed Sci. 13: 75–78.
Grainger,C., R.Williams, T.Clarke, A.D.G.Wright, and R.J.Eckard. 2010. Supplementation with
whole cottonseed causes long-term reduction of methane emissions from lactating dairy cows
offered a forage and cereal grain diet. J. Dairy Sci. 93: 2612–2619.
Haaland,G.L. 1978. Protected fat in bovine rations. Ph.D. Dissertation. Colorado State University,
Fort Collins.
Herd,R.M., and P.F.Arthur. 2009. Physiological basis for residual feed intake. J. Anim. Sci. 87(E.
Suppl.):E64-E71.
Hilliard, E.P., Beard, J., and Pearce, G.R. (1979). Utilization of piggery waste I. The chemical
composition and in vitro organic matter digestibility of pig faeces from commercial piggeries
in south-eastern Australia. Agriculture and Environment, 4: 171-180
Hutcheson,J.P. 1994. Anabolic implant effects on body composition, visceral organ mass and
energeticosf beef steers. PhD. Dissertation. Colorado State Univ. Fort Collins.
International Development Research Centre. 1992. Pig waste management and recycling: the
Singapore experience. International Development Research Centre. PO Box 8500, Ottawa,
Ont., Canada K1G 3119
63
IPCC. 2006. Guidelines for National Greenhouse Gas Inventories. Chapter 10: Emissions from
Livestock and Manure Management. Prepared by the National Greenhouse Gas Inventories
Programme. 87 pp.
Isermann,K., 1994. Agricultures share in the emission of trace gases affecting the climate and some
cause-oriented proposals for sufficiently reducing this share. Environment Pollution 83, 95–
111.
Jalaluddin, S. and R.A.Halim. 1998. Development of the Livestock Industry in Malaysia, in: Ho,
Y.W. & Chan, Y.K. Proceedings of the Regional Workshop on Area-Wide Integration of
Crop-Livestock Activities, FAO Regional Office, Bangkok Thailand.
Jan W Brouwer and Steve Sutherland. 2012. Improved ruminant nutrition on dairy farms and beef
feedlots in Malaysia. Proceedings of the 5th International Conference on Animal Nutrition
2012. Malacca, Malaysia, 24th-26th April 2012. pp 81-86.
Jayanegara, A. 2009. Ruminal methane production on simple phenolic acids addition in in vitro gas
production method. Med. Pet: 32: 53–62.
Jayanegara, A. 2013. Potensi Tanin Sebagai Bahan untuk Mitigasi Gas Metana dari Ruminansia.
Dalam buku : Potensi bahan pakan lokal untuk menurunkan produksi gas metana ternak
ruminansia. Badan Litbang Pertanian. Pp. 147-165.
Jayanegara, A., Goel, G., Makkar, H.P.S., and Becker, K. 2010. Reduction in methane emissions from
ruminants by plant secondary metabolites: effects of polyphenols and saponins. In: Odongo,
N.E., Garcia, M., Viljoen, G.J. (eds). Sustainable Improvement of Animal Production and
Health. Food and Agriculture Organization of the United Nations, Rome, pp. 151–157.
Johnson,D.E., C.L.Ferrell, and T.G.Jenkins. 2003. The history of energetic efficiency research: Where
have we been and where are we going? J. Anim. Sci.81: E27–E38.
Johnson, K.A. and D.E.Johnson 1995. Methane emissions from cattle. J ANIM SCI , 73:2483-2492.
Armsby,H.P. 1882. Manual of Cattle-Feeding, 2nd ed. New York, NY; John Wiley & Sons,
pp. 243-273.
Johnson,K., M.Huyler, H.Westberg, B.Lamb, and P.Zimmerman. 1994. Measurement of methane
emissions from ruminant livestock using a SF6 tracer technique. Environ. Sci. Technol. 28:
359–362.
Junus, M dan S. Minarti, 2012. Eksistensi Unit Biogas di Masyarakat dalam mendukung penyusunan
roadmap Desa Mandiri Energi berbasis unit biogas ternak. Kementerian Koordinator
Perekonomian -Fakultas Peternakan Universitas Brawijaya.
Kinsman, R., F.D.Sauer, H.A.Jackson, M.S.Wolynetz. 1995. Methane and carbon dioxide emissions
from dairy cows in full lactation monitored over a six-month period. Journal of Dairy
Sciences 78, 2760–2766.
Kirchgessner, W.Windisch and H.L. Muller. 1994. Nutritional factors for quantification of methane
production. Proc. Of the 8 th Intl. Symp. Ruminant Physiology. Willingen, Hesse,
Germany, 25-30 Sept. 1994. Pp. 333-348.
Koch,R.M., L.A.Swiger, D.Chambers, and K.E.Gregory. 1963. Efficiency of feed use in beef cattle. J.
Anim. Sci. 22:486–494.
64
Lassey,K.R., C.S.Pinares-Pati, R.J.Martin, G.Molano, and A.M.S.McMillan. 2011. Enteric methane
emission rates determined by the SF6 tracer technique: Temporal patterns and averaging
periods. Anim. Feed Sci. Technol. 166–167, 183–191.
Lassey,K.R., M.J.Ulyatt, R.J.Martin, C.F.Walker, and I.D.Shelton. 1997. Methane emissions
measured directly from grazing livestock in New Zealand. Atmos. Environ. 31: 2905–2914.
Lee, C.F., T.F.Shiao, and C.P.Chen. 2001. Enteric methane production of Holstein dry cows and
growing Heifers in Taiwan. In: Yang, S.S. (Ed.), Flux and Mitigation of Greenhouse Gases
(III). Global Change Research Center, Department of Agricultural Chemistry and Agriculture
Exhibition Hall, National Taiwan University, Taipei, Taiwan, pp. 157–172.
Lindau, C.W., P.K.Bollich, R.D.DeLaune, A.R.Mosier, and K.F.Bronson. 1993. Methane mitigation
in flooded Louisiana rice field. Biology and Fertility of Soils 136, 195–203.
Liu, C.M., S.S.Yang, and C.C.Hong. 1996. Estimation of methane and nitrous oxide emissions in
Taiwan area in 1990. Journal of the Biomass Energy Society of China 15, 1–8.
McCaughey,W.P., K.Wittenberg, and D.Corrigan. 1997. Methane production by steers on pasture.
Can.J. Anim. Sci. 77: 519–524.
Madsen,J., B.S.Bjerg, T.Hvelplund, M.R.Weisbjerg, and P.Lund. 2010. Methane and carbondioxide
ration in excreted air for quantification of the methane prodction from ruminants. Livest.
Sci.129: 223–227.
Mcginn,S.M., Y.H.Chung, K.A.Beauchemin, A.D.Iwaasa, C.Grainger. 2009. Use of corn distillers’
dried grains to reduce enteric methane loss from beef cattle. Can. J. Anim. Sci.89: 409–413.
Mclean, J.A. and G.Tobin. 1987. Animal and Human Calorimetry; Cambridge University Press:
Cambridge, UK, 1987.
Moe,P.W. and H.F.Tyrrell. 1979. Methane production in dairy cows. J. Dairy Sci. 62: 1583–1586.
Rumpler,W.V., D.E.Johnson, and D.B.Bates. 1986. The effect of high dietary cation
concentration on methanogenesis by steers fed diets with and without ionophores. J. Anim.
Sci. 62:1737.
Mohd Fairuz, M.S., I.Shuhaimen, M.Y.Roslan, A.Kamarul Azwan. 2010. A survey of cattle farming
in Peninsular Malaysia: Feed Management Practices and their potential impact on methane
emission. Proceedings of the 4th International Conference on Animal Nutrition (ICAN) 2010.
21-23 September 2010, Persada Johor International Convention Centre, Johor Bahru, Johor,
Malaysia. pp. 409-412.
Navarro-Villa,A., M.O’Brien, S.Lopez, T.M.Boland, and P.O’Kiely. 2011. Modifications of a gas
production technique for assessing in vitro rumen methane production from feedstuffs. Anim.
Feed Sci. Technol. 2011, 166–167, 163–174.
NC2. 2011. Malaysia’s Second National Communication (NC2) submitted to the United Nations
Framework Convention on Climate Change (UNFCCC). Ministry Of Natural Resources and
Environment Malaysia, ISBN 978-983-44294-9-2.
Nes,S.K., T.Garmo, A.V.Chaves, O.M.Harstad, A.D.Iwaasa, S.J.Krizsan, K.A.Beauchemin, T.A.
McAllister, L.Norell, E.Thuen, D.Vedres, and H.Volden. 2010. Effects of Neutral Detergent
Fiber (aNDF) Digestibility of Grass Silage on Enteric Methane Emissions from Dairy Cows.
In Proceedings of Inteternational Conference Greenhouse Gases in Animal Agriculture,
Banff, AB, Canada, 3 October 2010; p. 110.
65
Nguyen Ba Mui, Dang Thai Hai 2010. Characteristic of appearance and growing ability of Co Goat,
F1(Bach Thao x Co) and Crossbred Boer x F1 (Bach Thao x Co) Raised NinhBinhProvine.
Journal of science and development 2010: No 1: 82-89
NRC. 2001. Nutrient Requirements of Dairy Cattle, 7th revised ed. Washington, DC; National
Academy Press.
ONEP. 2000. Thailand’s Second National Communication under the United Nations Framework
Conversation on Climate Change. The Ministry of Natural Resources and Environment.
Okelly,J.C., and W.G.Spiers. 1992. Effect of monensin on methane and heat productions of steers fed
lucerne hay either ad-libitum or at the rate of 250 g/hour. Aust. J. Agric. Res. 43, 1789–1793.
Okine,E.K., G.W.Mathison, and R.T.Hardin. 1989. Effects of changes in frequency of reticular
contractions on fluid and particulate passage rates in cattle. J. him. Sci. 67:3388.
Olson,K.M., B.G.Cassell, and M.D.Hanigan. 2010. Energy balance in first-lactation Holstein, Jersey,
and reciprocal F1 crossbred cows in a planned crossbreeding experiment. J. Dairy Sci.
93:4374-4385.
Ong, H.K. 2002. Livestock waste management is Southeast Asia, in: Ong, H.K., Zulkifli, I., Tee, T.P.,
and Liang, J.B., Proceedings of the 4th International Livestock Waste Management
Symposium, pp. 59-67 (Penang, Malaysia, Malaysian Society of Animal Production).
Ong, H.K. 2008. Managing Nutrients In Pig Production To Minimize Environmental Pollution.
Proceedings 3rd International Conference on Animal Nutrition (ICAN) 2008, 29-31 July
2008, Hotel Equatorial Bangi, Selangor, Malaysia. pp. 25-32.
Ong, H.K., M.Suhaimi, and A.Mohd. Yusoff. 2005. Assessment of greenhouse gases emission from
waste treatment facilities in a centralized pig farming area. Proc. Of 2nd Int. Conference on
Greenhouse Gases and Animal Agriculture, 20-24 Sept. 2005, Zurich, Switzerland, p. 51-54
Ong,H.K., P.Y.Choo, S.S.Teoh, and S.Shanmugavelu. 1989. In house handling of pig waste in
bacteria-assisted deep litter under tropical conditions. Symposium on waste management and
recycling in pig farms. Singapore pp 1-12.
Ong,H.K et.al. 1999. Environmental fate of dietary phosphorus from pig farms in Malaysia, National
congress on animal health and production, 1999 (Ong, H.K et. al); Environmental impact and
removal of phosphates in swine farm effluent - (H.K. Ong, Y.S. Lim and M. Suhaimi) - J.
Trop. Agric. and Fd. Sc. 34(2)2006: 355–364
Owens, F. N., and A. L. Goetsch. (1988). Ruminal Fermentation. In: D. C. Church (ed.) The Ruminal
Animals, Digestive Physiology and Nutrition. p 145-171. Prentice Hall, New Jersey.
Patel,M., E.Wredle, G.Borjesson, R.Danielsson, A.D.Iwaasa, E.Sporndly, and J.Bertilsson. 2011.
Enteric methane emissions from dairy cows fed different proportions of highly digestible
grass silage. Acta Agric. Scand. A Anim.61: 128–136.
Pellikaan,W.F., W.H.Hendriks, G.Uwimana, L.J.G.M.Bongers, P.M.Becker, and J.W.Cone. 2011.
A novel method to determine simultaneously methane production during in vitro gas
production using fully automated equipment. Anim. Feed Sci. Technol. 168: 196–205.
Phonbumrung,T. 2012. Modeling carbon sequestration of grazing pastures in Thailand used STELLA.
Department of Livestock Development. Copy paper. 8 pp.
66
Pig growth performance data using the Loudong Bio-fermentation waste treatment technology in
closed house system. Malaysian Journal of Veterinary Research Volume 3 No. 1 JANUARY
2012, pp 55-61.
Proma,S., S.Tuikampee, V.Himarat, N.Vidhyakorn. 1982. Production responses of lactating cows
fed urea-treated rice straw compared to untreated rice straw supplemented with leucaena
leaves. Available :
http://www.dld.go.th/nutrition/Research_Knowlage/LIBRARY/LIBRARY3_2528.htm, June
15, 2013.
Purnomoadi, 2013. Pakan Lokal, Derajat Konversi Metana (Methane Conversion Rate) dan
Produktivitas Ternak Potong di Indonesia. Presented in Workshop of in Book : Potensi bahan
pakan lokal untuk menurunkan produksi gas metana ternak ruminansia. Badan Litbang
Pertanian. Pp. 15-17.
Purnomoadi, A., E. Rianto and F. Terada. 2002. Methane Emission from buffalo fed rice straw in
Indonesia. Proc. The 3rd International Seminar on Tropical Animal Production, Part 2.
Supporting Papers. Faculty of Animal Science, Gadjah Mada University, Yogyakarta,
Indonesia. 190-194.
Ragnavolo,O. and I.Misztal. 2000. Genetic component of heat stress in dairy cattle, parameter
estimation. J. Dairy Sci. 83:2126-2130.
Rauw,W.M., E.Kanis, E.N.Noordhuizen-Stassen and F.J.Grommers. 1998. Undesirable side effects of
selection for high production efficiency in farm animals: A review. Livest. Prod. Sci. 56:15-
33.
Raymond A.K. and D.Ratnakumar. 1997. Genetic improvement of cattle, buffalo and small ruminants
in Malaysia. In: Report on breeding programmes for ruminants in Asia. Expert discussion
held in Kandalama (Matale), Sri Lanka, 31 March – 4 April 1997. MLD & RI, Sri Lanka and
GTZ, Germany. pp 77-91
Rochayati, S and Ladiyani 2013. Nitrogen Cycling From Livestock Waste And Technology On
Composting. Presented in International Workshop on GHG Emission. April 2013. Jakarta
Indonesia.
Rotz,C.A. and R.E.Muck. 1994. Changes in forage quality during harvest and storage. Ch. 20 in
Forage Quality, Evaluation, and Utilization. Madison, WI; American Society of Agronomy,
Inc.
Rymer,C., J.A.Huntington, B.A.Williams, D.I.Givens. 2005. In vitro cumulative gas production
techniques: History, methodological considerations and challenges. Anim. Feed Sci.
Technol.123–124, 9–30.
Saa,C.F., T.M.Hill, and D.E.Johnson. 1993. Persistence of methane suppression by ionophore and
glycopeptide in steers fed a brome hay diet. CSU Beef Program Report.
Shamnugavelu, S., E.A.Engka Azahan, and A.R.Azizan. 2002. Enclosed animal housing system as a
potential method for reducing wastewater production in swine farms in the humid tropics, in:
Ong, H.K., Zulkifli, I., Tee, T.P., & Liang, J.B., Proceedings of the 4th International
Livestock Waste Management Symposium, pp. 119-126 (Penang, Malaysia, Malaysian
Society of Animal Production).
67
Shuhaimen, I., M.S.Mohd Fairus, and H.K.Ong. 2010. Recent greenhouse gasses emission from
domestic livestock in Malaysia. Proceedings of the 4th International Conference on Animal
Nutrition (ICAN) 2010. 21-23 September 2010, Persada Johor International Convention
Centre, Johor Bahru, Johor, Malaysia. pp. 155-160
Sivarajasingam S. and M.Wan Zahari. 1985. Breeds of dairy cattle and their performance in Malaysia.
Livestock Technology (MARDI) 1(2):145-153.
Sivarajasingam S. and R.A.Kumar. 1989. Distribution and production characteristics of Friesian
crossbred cattle in Malaysia. MARDI Res. J. 17(1):91-106
STANDARDS MALAYSIA. 2011. Malaysian Standard for Swine Feeds. STANDARDS
MALAYSIA. SIRIM.
St-Pierre,N.R., and C.S.Thraen. 1999. Animal grouping strategies, sources of variation, and economic
factors affecting nutrient balance on dairy farms. J. Dairy Sci. 82(2):72-83.
Stumm,C.K., H.J.Gijzen, and G.D.Vogels. 1982. Association of methanogenic bacteria with ovine
ciliates. Br. J. Nutr. 47:95.
Suharyono dan Y. Widiawati. 2007. Pengaruh Pemberian Supplemen Pakan Multinutrient Terhadap
Konsumsi Pakan dan Ekosistem Rumen Sapi Po yang Diberi Pakan Silase dari Tanaman
Jagung Yang Mulai Berbunga. Prosiding Seminar National AiniVi “Kearifan Lokal dalam
Penyediaan Serta Pengembangan Pakan Dan Ternak Di Era Globalisasi”. Fakultas
Peternakan, Universitas Gadjah Mada dan Asosiasi Ahli Nutrisi dan Pakan Indonesia, 26 – 27
Juli 2007, Yogyakarta, Indonesia. 2007. 393-397.
Suharyono, Winugroho, M., and Widiawati, Y. 2006. The Effect Of Feed Suplement Multi Nutrient
Supplementation To Corn Leaves Silage Basal Diet On Methane Production And Productivity
Of Ongole Generation Cattle. Proceedings Of The 4th Istap “Animal Production And
Suistinable Agriculture In The Tropic”. Faculty Of Animal Science, 236-241.
Sukmawati, N.M.S., I.G. Permana, A.Thalib, S. Kompiang. 2011. Pengaruh Complete Rumen
Modifier (CRM) dan Calliandra calothysus terhadap produktivitas dan gas metan enteric pada
kambing perah PE. JITV 16: 173-183.
Swift,R.W., J.W.Bratzler, W.H.James, A.D.Tillman, and D.C.Meek. 1948. The effect of dietary fat on
utilization of the energy and protein of rations by sheep. J.him. Sci. 7:475.
Tan, H.Y., C.C.Sieo, J.B.Liang, N.Abdullah, X.D.Huang, and Y.H.Ho. 2010. Condensed tannins from
Leucaena leucocephala hybrid and its potential in the manipulation of methanogenesis.
Proceedings of the 4th International Conference on Animal Nutrition (ICAN) 2010. 21-23
September 2010, Persada Johor International Convention Centre, Johor Bahru, Johor,
Malaysia. pp. 299-301.
Tekippe,J.A., A.N.Hristov, K.S.Heyler, T.W.Cassidy, V.D.Zheljazkov, J.F.S.Ferreira, S.K.Karnati,
and G.A.Varga. 2011. Rumen fermentation and production effects of Origanum vulgare L.
leaves in lactating dairy cows. J. Dairy Sci. 94:5065–5079.
Thailand Meteorological Department. 2007. Climate statistic. Thailand.
Thailand Meteorological Department. 2008. Climate statistic. Thailand.
Thailand Meteorological Department. 2009. Climate statistic. Thailand.
68
Thailand Meteorological Department. 2010. Climate statistic. Thailand.
Thailand Meteorological Department. 2011. Climate statistic. Thailand.
Thalib,A. 2004. In vitro study of effectiveness of saponin from Sapindusrarak fruit as methanogenesis
inhibitor on ruminal digestion system. JITV 9: 164-171 .
Thalib, A. and Y. Widiawati. 2008. Effect of Acetoanaerobium noterae bacteria addition in the diet on
methane production and performance of sheep. JITV 13: 273-278.
Thalib, A. and Y. Widiawati. 2008. Effect of Acetoanaerobiumnoterae bacteria addition in the diet on
methane production and performance of sheep. JITV 13: 273-278.
Thalib, A., Y. Widiawati dan H. Hamid. 2004. Uji efektivitas isolat bakteri hasil isolasi mikroba
rumen dengan media asetogen sebagai inhibitor metanogenesis. JITV, 9 (4): 233-238.
Thalib, A., Y. Widiawati, dan B. Haryanto. 2010. Penggunaan complete rumen modifier (CRM) pada
ternak domba yang diberi hijauan pakan berserat tinggi. JITV 15(2): 97-104
Tran QuangHanh, Dang Vu Binh. 2009. Evaluated ability growth of female Holstein Friensian and
F1, F2, F3, F4 crossbred in Lam Dong province. Journal of Science and Development, 2009:
No 3, Pg: 262 - 268
Uribe,H.A., B.W.Kennedy, S.W.Martin and D.F.Kelton. 1995. Genetic parameters for common health
disorders of Holstein cows. J. Dairy Sci. 78:421-430.
Van der Honing,Y., B.J.Wieman, A,Steig, and B.van Donselaar. 1981. The effect of fat
supplementation of concentrates on digestion and utilization of energy by productive dairy
cattle. Neth. J.Agnc. Sci. 29:79
Van Raden,P.M. 2004. Invited Review: Selection on net merit to improve lifetime profit. J. Dairy Sci.
87:3125:3131.
Vogel,K.P. and D.A.Sleper. 1994. Alteration of plants via genetics and plant breeding. Ch. 22 in
Forage Quality, Evaluation, and Utilization. Madison, WI; American Society of Agronomy,
Inc.
Wan Zahari, M., H.K.Wong and S.A.S. Hussain. 2009. Utilization of animal feedstuffs in Malaysia.
Animal Feedstuffs in Malaysia – Issues, Strategies and Opportunities, Academy of Sciences
Malaysia, 108pp.
Wan Zahari, M., O.M.Ariff, I.Mohd Sukri, A.Oshibe and H.Hayakawa. 2000. Oil palm by-products
and urea molasses mineral blocks as feed resources for buffaloes in Malaysia, Third Asean
Buffalo Congress, Kandy, Sri Lanka.
Wan Zahari, M., J.Sato, S.Furuichi, A.R.Azizan and Mohd Yunus. 2003. Commercial Processing Of
Oil Palm Fronds Feed In Malaysia, 8th Meeting Workshop of the Regional Working Group
on Grazing and Feed Resources for South East Asia, Cititel Century Hotel, Kuala Lumpur,
Malaysia, 22 - 27 Sept 2003.
Wan Zahari, M., M.S.Nor Ismail, I.Mohd Sukri, C.Abu Bakar, K.Subramaniam, A.Rashidah and I.
Mohd Yunus. 2002. Long term feeding of complete feeds based on ground OPF in pellet or
cube form to growing beef crossbred heifers. Proc. 24th. MSAP. Conf., 19-23 May 2002,
Penang, Malaysia.
69
Widiawati, Y. 2004. Utilization of Shrub Leguminous Leucaena leucocephala, Gliricidia sepium and
Calliandra cllothyrsus for growing Sheep. Disertasi. James Cook University, Townsville
Australia
Wina, E.S. Muetzel, and K. Becker. 2006. Effects of daily and interval feeding of Sapindusrarak
saponins on protozoa, rumen fermentation and digestibility in sheep. Asian Aust. J. Anim.Sci
19:1580-1587.
Wisri Puastuti, D. Yulistiani, dan I.W. Mathius. 2012. Respon fermentasi rumen dan retensi nitrogen
dari domba yag diberi protein tahan degradasi dalam rumen. JITV:17:67-72.
Wisri Puastuti, D. Yulistiani, I.W. Mathius, F. Giyai, dan E. Dihansih. 2010. Ransum berbasis kulit
buah kakao yang disuplemetasi Zn organik: Respon Pertumbuhan pada Domba. JITV:15:269-
277.
Wanapat,M. 1999. Feeding of Ruminants in The Tropics Based on Local Feed Resources. Khon Kaen
Publishing Company Ltd., Khon Kaen, Thailand, 236p.
Wanapat,M. 2000. Rumen manipulation to increase the efficiency use of local feed resources
and productivity of ruminants in topic. AJAS. 13(Suppl.): 59-67.
Wanapat,M. 2005. Research priorities for improving animal nutrition and health of dairy cattle in
Thailand. Proceedings of International Conference “Integrating Livestock-Crop Systems to
Meet The Challenges of Globalisation”, (Eds. P. Rowlinson, P. Pakdee, C. Wachirapakorn
and M. Wanapat), Vol 1:85-92. November 14-18, 2005, held at Sofitel Raja Orchid, Khon
Kaen, Thailand, British Society of Animal Science, pp 510.
Wanapat,M., C.Wachirapakorn, S.Chanthai, and K.Sommart. 1992. Utilization of cassava leaf
(Manihot esculenta, Crantz) in concentrate mixture for swamp buffaloes. Paper presented at
the final coordination meeting on “The Development of Feeding Strategies for Improving
Ruminant Productivity in Areas of Fluctuating Nutrient Supply through the Use of Nuclear
and Related Techniques” Vienna, Austria. 30 Mar.-3 Apr.
Wanapat,M., S.Duangchan, S.Pongpairote, T.Anakewit, and P.Tongpanung. 1986. Effects of various
levels of concentrates fed with urea-treated rice straw for pure bred American Brahman
yearling cattle. In R.M. Dixon, ed. Ruminant Feeding Systems Utilizing Fibrous Agricultural
Residues, p. 149-153. Canberra, IDP.
Wanapat,M., S.Praserdsuk, and S.Chanthai. 1983. Effects of ensiling of rice straw with urea and
supplementing with dried cassava leaves on digestion by water buffaloes. Proc. 5th World
Conference on Animal Production VII. (397-398), Japanese Soc. Zootech. Sci., Japan.
Weiss,W.P. 1993. Predicting energy values of feeds. J. Dairy Sci. 76:1802-1811.
Whitelaw,F.G., W.J.Eadie, L.A.Bruce, and W.A.Shand. 1984. Methane formation in faunated and
ciliate-free cattle and its relationship with rumen volatile fatty acid proportions. Br. J.Nutr.
52:261.
Yang,S.S. 1997. Greenhouse gas emissions from agriculture in Taiwan. In: Moya, T.B. (Ed.),
Greenhouse Gas Emissions, Aerosols, Land Use and Cover Changes in Southeast Asia. The
Environmental Research Institute, Chulalongkorn University, Bangkok, Thailand, pp. 26–35.
Yang,S.S. and H.L.Chang. 2001. Effect of green manure amendment and flooding on methane
emission from paddy fields. Chemosphere, Global Change Science 3, 41–49.
70
Yusuf, R.O., Z.Z.Noor, A.H.Abba, M.A.A.Hassan and M.F.M.Din. 2012. Greenhouse gas emissions:
Quantifying methane emissions from livestock. Am. J. Eng. Applied Sci., 5: 1-8
Zimmerman,P.R. 1993. System for Measuring Metabolic Gas Emissions from Animals. US Patent
5,265,618, 30 December 1993.
Zwald,N.R., K.A.Weigel, Y.M.Chang, R.D.Welper and J.S.Clay. 2004. Genetic slection for health
traits using producer-redocred data. I. Incidence rates, heritability estimates, and sire breeding
values. J. Dairy Sci. 87:4287-4294.