Embed Size (px)
Citation preview

Sabinus et al., J Geol Geophys 2018, 7:4DOI: 10.4172/2381-8719.1000443
Open AccessResearch Article
Jour
nal o
f Geology & Geophysics
ISSN: 2381-8719
Journal of Geology & Geophysics
Volume 7 • Issue 4 • 1000443J Geol Geophys, an open access journalISSN: 2381-8719
*Corresponding author: Ibeneme Sabinus I, Department of Geology, Federal University of Technology Owerri, Nigeria, Tel: +2348026182505; E-mail: [email protected]
Received April 02, 2018; Accepted June 01, 2018; Published June 08, 2018
Citation: Ibeneme Sabinus I, Oha Ifeanyi A, Abdulsalam Nasir N, Onuoha Mosto K (2018) Improved Mapping of the Structural Disposition of Some Younger Granite Ring Complexes of Nigeria Using High Resolution Aeromagnetic Data. J Geol Geophys 7: 443. doi: 10.4172/2381-8719.1000443
Copyright: © 2018 Ibeneme Sabinus, et al. This is an open-access article distributed under the terms of the Creative Commons Attribution License, which permits unrestricted use, distribution, and reproduction in any medium, provided the original author and source are credited.
Abstract Surface and subsurface structural interpretation over a part of the Younger Granite province of Northern Nigeria
using Aeromagnetic data was carried out to demonstrate the use of recently available high resolution aeromagnetic data in mapping precisely the Younger Granite. State of the art software packages were used in data reduction, processing/analysis and interpretation. Results of the aeromagnetic study show that the distinct magnetic anomalies clearly revealed in the area coincide spatially with outcropping ring complexes. Apart from outcropping ring complexes, some ring complexes without surface exposures (unexposed ring complexes) were also delineated. One of such ring complexes was studied in greater details and its lateral dimensions with that of the adjoining ring complexes were better resolved. The unexposed ring complex was found to have a surface area extent of approximately 169.5 km2 which is similar to that of Ririwai (180 km2), Banke (128 km2), Kudaru (174 km2) and Zuku (121 km2). The results of the 3D Euler solutions indicate that the depths of the ring complexes range from outcrop to 1800 m. For the inferred unexposed ring complex, the depth ranges from 5 to 1200 m. The Younger Granites show low Source Parameter Imaging (SPI) depth values of about 4 km below the sea level indicating deeper magnetic sources. Three (3) profiles drawn along the NE-SW, NNW-SSE and E-W directions on the Analytic Signal map of the study area gave an overburden thickness of less than 20 m that masked the unexposed ring complex with its mappable root situated at approximately 200 m below the sea level. The Ririwai, Tibchi, Banke, Amo, Kudaru and Zuku ring complexes have outcrops of approximately 1300 m, 950 m, 920 m, 1400 m, 1150 m and 1220 m respectively above mean sea level with their mappable roots situated at approximately 400 m, 180 m, 400 m, 800 m, 10 m and 300 m respectively below the sea level. It delineated numerous lineaments as structural features whose major trend is along the NE-SW direction. It was equally observed that the ring complexes of Northern Nigeria display diverse surface plans/shapes and exhibit both inward and outward dipping structural orientations with depth. The likely reason for the unexposed nature of the newly proposed ring complex could be as a result of partial subsidence of the enclosed block on which the extrusive edifice of the central volcano originally rested probably occasioned by excess space (much subsurface accommodation) for continuously rising magma within the country rock. Its geometry is supportive of this assertion as it revealed majorly outward dipping trend with depth along different axes. Another reason could be due to incomplete fluidization along the already formed ring fracture and poor assimilation of the country rock by the fluidizing agent amidst a slow/near quiescent piece meal stopping process during the central granite intrusion phase which usually marks the end of ring complex formation. Finally, this research has demonstrated the efficacy of aeromagnetic data in delineating both outcropping ring complexes as well as those without surface exposures (outcrops).
Improved Mapping of the Structural Disposition of Some Younger Granite Ring Complexes of Nigeria Using High Resolution Aeromagnetic DataIbeneme Sabinus I1*, Oha Ifeanyi A2, Abdulsalam Nasir N3 and Onuoha Mosto K2
1Department of Geology, Federal University of Technology Owerri, Nigeria2Department of Geology, University of Nigeria, Nsukka3Department of Physics, University of Abuja, Nigeria
Keywords: Analytic Signal; Euler Deconvolution; Magnetic Anomaly; Stoping; Ring complex; Younger Granite.
IntroductionThe Younger Granite province of Northern Nigeria occurred as an
extension of the North-South trend of igneous activities which started during the Precambrian at Hoggar in Algeria [1]. It extended southwards during the Ordovician where it appeared within the Tuarreg region of the Niger Republic, being clearly emplaced within the Andrear Bous in Northern Niger Republic and Air Massive in the Southern Niger Republic [2]. It continued in its southwardly appearance into the Tibesti Massive in Northwest of Chad Republic and South of Libya where it was dated Ordovician to early Silurian [3]. Its continuous southerly extension intruded the Nigerian basement complex during the Jurassic age. The oldest of the Nigerian ring complexes is the Dutse complex in Kano State dated Early Jurassic while the youngest is the Afu ring complex located near Nasarawa Egon in Niger State and was dated Late Jurassic (Figure 1). The eroded volcanic complexes of the northern Nigeria are either isolated (e.g. Ririwai, Banke etc.) or coalesced into groups owing to the migration of the centre of magmatism e.g., Ningi-Burra [4], Tibchi [5]. Mineralogically and Geochemically, the Younger Granite ring complexes of Nigeria have been studied by the likes of Bowden [6-15]. Geophysically, the likes of Ajakaiye [16,17] Kogbe [18] and Etim
[19] have made useful contributions in studying the ring complexes of Nigeria. Structurally, Ike, Abaa, Turner and Odia [5,11,20,21] have carried out worthwhile researches on the ring complexes. Subsurface resource potentials of individual ring complexes like Jos-Bukuru cassiterite mineralization and groundwater studies have been carried out by Ologun, Samaila and Solomon, Akanbi and Opara [15,22-24]. Ririwai, Zaranda, Banke, Jarawa, Kagoro and Ganawuri ring complexes have respectively been studied by researchers like Olasehinde and Ashano, Ibe, Adubok, Olasehinde, Alkali and Ibeneme [25-30].

Citation: Ibeneme Sabinus I, Oha Ifeanyi A, Abdulsalam Nasir N, Onuoha Mosto K (2018) Improved Mapping of the Structural Disposition of Some Younger Granite Ring Complexes of Nigeria Using High Resolution Aeromagnetic Data. J Geol Geophys 7: 443. doi: 10.4172/2381-8719.1000443
Page 2 of 13
Volume 7 • Issue 4 • 1000443J Geol Geophys, an open access journalISSN: 2381-8719
Geophysical methods have been variously applied in the study of diverse range of geological structures. Various techniques are employed in the estimation of such parameters like location, magnetization, depth and size of buried magnetic bodies. These interpretation techniques include curves matching [31-33], Fourier transform [34], Hilbert transforms [35], monograms [36], least squares minimization [37,38], characteristic points and distance approaches [39,40], correlation factors between successive least-squares residual anomalies [41], Henkel transform [42], linearized least squares [43], normalized local wave number [44], analytic signal derivatives [45-47], Euler deconvolution [48], Source Parameter Imaging [49], Fair function minimization [50], Deconvolution technique [51], second horizontal derivatives [52], Simplex algorithm [53], Simulated annealing [54], very fast simulated annealing [55-62], Global nonlinear optimization [63-65].
Previous geological and geophysical studies that were carried out within the Younger Granite province of Nigeria focused mainly on ring complexes with surface exposure with none taking into cognizance their possible subsurface geometry just as little is known about those without surface exposure, a lacunae which this study wants to close. In the current study, Horizontal Derivative, Analytic Signal, Euler Deconvolution and Source Parameter Imaging techniques were used to precisely map the Younger Granite ring complexes of Nigeria and estimate their surface and subsurface structural dispositions.
Location and Physiography of the Study AreaFor this research, aeromagnetic sheets 103, 104, 105, 125, 126, 127,
146, 147, 148, 167, 168, 169, 188, 189 and 190 were used which were published on a scale of 1:100,000 and enclosed within the fifteen (15) aeromagnetic maps of the Nigerian Geological Survey Agency (NGSA) with important provinces which include Jemaa, kura, Pankshin, Maijuju, Naraguta, Kafanchan, Geshere, Lere, Toro, Kalatu, Ririwai, Dutsen Wai, Birnin Kudu, Burumburum and Ikara. The study area is
part of the Younger Granite province of Northern Nigeria which lies between Latitudes 9°00´N to 11°30´N and Longitudes 8°00´E to 9°30´E covering an area of approximately 27,622.44 km2. The elevation of the area ranges from 200 m (in low lying areas occupied by the weathered and undifferentiated basements) to about 1800 m above sea level (for high rising areas occupied majorly by the ring complexes) (Figures 2 and 3). The drainage pattern is dendritic with the major river sources originating from the base of the uplifted hills in the area (Figure 4).
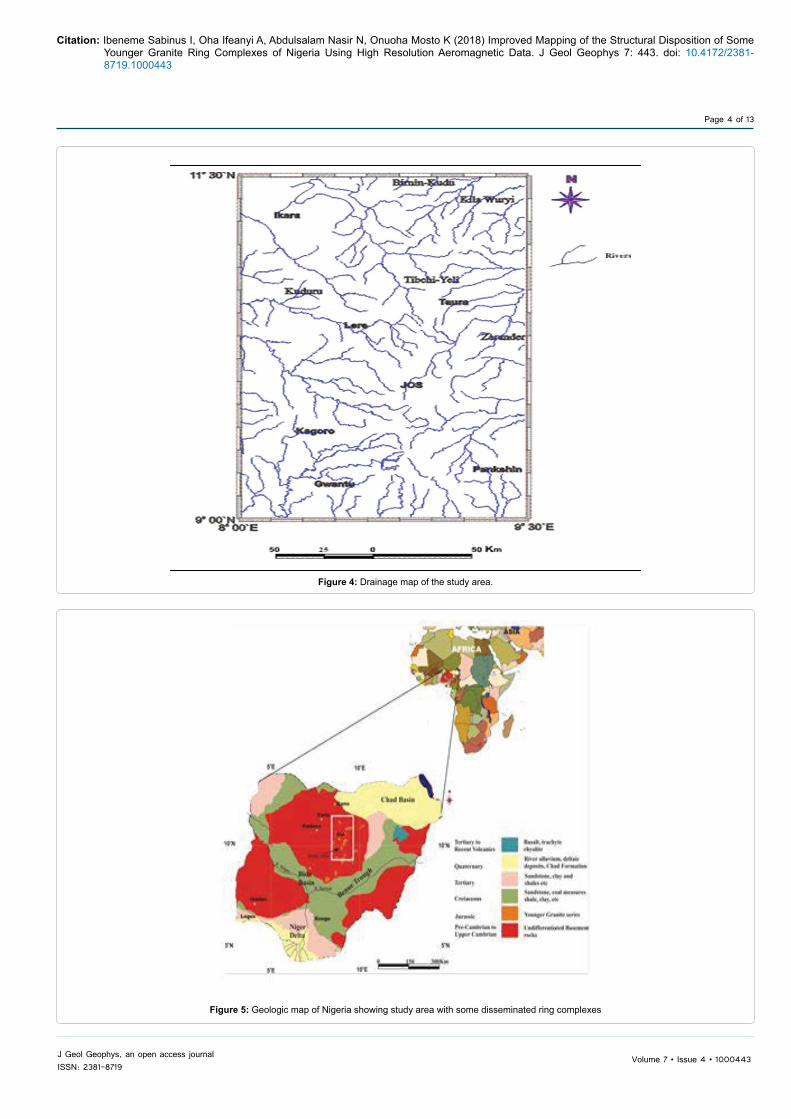
Geology of the Study AreaIn Nigeria about fifty two separate Younger Granite ring
complexes are recognized with a total area of 7511 km2 (Figure 5). The origin and formation of the Younger Granite ring complexes in Nigeria and beyond were not related to any orogeny and thus are often referred to as being anorogenic in nature. The Younger Granites appear to have been subject to two distinct processes of differentiation resulting in divergent trends viz: a normal series and an alkaline series [66]. The Younger Granites exhibit a large variety of rock types but those that remain remarkably constant in character throughout the whole province are Rhyolites, Hornblende-fayalite-granites and porphyries, Hornblende-biotite granites, Biotite granites, Riebeckite and Riebeckite-biotite granites, Aegirine-arfvedsonite granites, Syenites and Trachytes and Basic rocks (Gabbros, dolerites, basalts etc). Details of occurrence, character and petrography of the rock associations are discussed in MacLeod [66]. Some of the Younger Granite ring complexes within the study area are Ririwai, Banke, Sara fier, Jos Bukuru, Amo, Kigom, Tibchi etc (Figure 6).
MethodologyData source
The data used for this research forms part of the new high
Figure 1: Major Younger Granite Localities in Nigeria.

Citation: Ibeneme Sabinus I, Oha Ifeanyi A, Abdulsalam Nasir N, Onuoha Mosto K (2018) Improved Mapping of the Structural Disposition of Some Younger Granite Ring Complexes of Nigeria Using High Resolution Aeromagnetic Data. J Geol Geophys 7: 443. doi: 10.4172/2381-8719.1000443
Page 3 of 13
Volume 7 • Issue 4 • 1000443J Geol Geophys, an open access journalISSN: 2381-8719
Figure 2: Digital Elevation Model (DEM) map of the study area.
Figure 3: Topographic map of the study area showing some prominent towns.
Citation: Ibeneme Sabinus I, Oha Ifeanyi A, Abdulsalam Nasir N, Onuoha Mosto K (2018) Improved Mapping of the Structural Disposition of Some Younger Granite Ring Complexes of Nigeria Using High Resolution Aeromagnetic Data. J Geol Geophys 7: 443. doi: 10.4172/2381-8719.1000443
Page 4 of 13
Volume 7 • Issue 4 • 1000443J Geol Geophys, an open access journalISSN: 2381-8719
Figure 4: Drainage map of the study area.
Figure 5: Geologic map of Nigeria showing study area with some disseminated ring complexes

Citation: Ibeneme Sabinus I, Oha Ifeanyi A, Abdulsalam Nasir N, Onuoha Mosto K (2018) Improved Mapping of the Structural Disposition of Some Younger Granite Ring Complexes of Nigeria Using High Resolution Aeromagnetic Data. J Geol Geophys 7: 443. doi: 10.4172/2381-8719.1000443
Page 5 of 13
Volume 7 • Issue 4 • 1000443J Geol Geophys, an open access journalISSN: 2381-8719
Figure 6: Geologic map of the study area.
Figure 7: Workflow for aeromagnetic data analysis and interpretation.
EDGE/SOURCE DETECTION
RTP RTE VD HG AS SED
RAW TMI DATA
ENHANCEMENTS
INTERPRETATION MAPS PROFILES
GIS
DEPTH ESTIMATION EULER SPI
resolution digital airborne data acquired between 2005 and 2009. The entire data included 1,930,000 line km of magnetic survey flown at 500 m line spacing and 80 m terrain clearance. Data acquisition was carried out by Fugro Airborne Surveys while the processing and preliminary interpretation was contracted to Paterson, Grant & Watson Limited (PGW) [67]. A subset of the nationwide grid covering the study area
(Lat 9o00’N-Lat 11o30’N and Long 8o00’E-Long 9o30’E) was made available in GDB (Geosoft Database) format by the Nigerian Geological Survey Agency (NGSA) [67]. The geomagnetic gradient was removed from the data using the International Geomagnetic Reference Field (IGRF) formula for 2005. This new data offers a lot of advantages in resolution and format over the old data in which most of the earlier

Citation: Ibeneme Sabinus I, Oha Ifeanyi A, Abdulsalam Nasir N, Onuoha Mosto K (2018) Improved Mapping of the Structural Disposition of Some Younger Granite Ring Complexes of Nigeria Using High Resolution Aeromagnetic Data. J Geol Geophys 7: 443. doi: 10.4172/2381-8719.1000443
Page 6 of 13
Volume 7 • Issue 4 • 1000443J Geol Geophys, an open access journalISSN: 2381-8719
interpretations were made. Table 1: compares 2011 with the 1974 data. Oasis Montaj. Ver 7.1 Mapping and Processing System with geosoft executable (GX) plugins, USGS Potential Field Software version 2.2, GM-SYS V. 5.0 and ArcGis Ver 10.2, were the softwares used for the interpretation. Figure 7 describe the methodology used for processing, analysis and interpretation.
Analytic signal
The Analytic signal method is very useful for delineating magnetic source location [46]. The analytic signal image simplifies the interpretation by placing the anomaly peaks directly above the source. The magnitude of the analytic signal of the total magnetic field produces maxima over magnetic contacts regardless of the direction of magnetization and is always positive [46]. These magnetic contacts could result from differences in magnetic susceptibility between an intrusive rock and a country rock, between geologic contacts and according to Odia [21] across a fracture zone due to the oxidation of the magnetite or infilling of the fracture zone by magma thus forming intrusive bodies whose magnetic susceptibility is different from the host rock. This method is very useful at low magnetic latitudes as it is independent of the inclination of the magnetic field. This quantity is defined as a complex function that its real component is the horizontal gradient and its imaginary component is the vertical gradient. It can be proven that imaginary component is Hilbert transform of real component [45,68].
Nabighian [45,68] developed the concept of 2D analytic signal, or energy envelope, of magnetic anomalies. The amplitude of the 3D analytic magnetic field signal at location (x,y) can be expressed as:
( )22 2T T T/A x, y /
x y z ∂ ∂ ∂ = + + ∂ ∂ ∂
(1)
where, A(x, y) is the amplitude of the analytic signal at (x,y); T is the observed magnetic field at (x,y). The purpose of the reduction to the pole is to take an observed total magnetic field map and produce a magnetic map that would result, had an area been surveyed at the magnetic pole.
Euler deconvolution
Thompson expressed the Euler homogeneity as
( ) ( ) ( ) ( )0 0 0 – – T T Tx x y y z z N B Tx y z
∂ ∂ ∂− + + = −
∂ ∂ ∂ (2)
Where xo, yo, zo are the positions of the magnetic body. T is total field measured at (x, y, z). N is the degree of homogeneity which can be interpreted as the Structural Index (SI). B is background value of the TMI. The standard 3D Euler method is based on Euler’s homogeneity equation, which relates the potential field and its gradient components to the location of the source, by the degree of homogeneity N. The method makes use of a structural index in addition to producing depth estimates [69]. The structural index combined with depth estimates have the potential to identify and compute depth estimate for a variety of geologic structures such as faults, magnetic contacts, dykes, and sills [70]. The algorithm uses a least squares method to solve Euler’s equation for each grid position within a sub-grid. A square window of predefined dimensions is moved over the grid along each row. At each point a system of predefined equation is solved, from which x, y and z and their uncertainties are obtained for a predefined Structural Index. A solution is only recorded if the depth uncertainty of the solution is
within a limiting distance from the center of the data window [71]. Though Euler Deconvolution is applicable to all geologic models and is intensive to magnetic remanence and its initial assumption of the source geometry has to be made. This is done by selecting a structural index [72].
Source parameter imaging
The Source Parameter Imaging (SPI) technique (sometimes referred to as the local wave number method) was developed by Smith [73] and Thurston [74,75]. The technique is based on the principle of complex analytic signal and computes source parameters from gridded magnetic data. The SPI method requires first and second order derivatives and is thus susceptible to noise in the data and interference effect. The wave number theory is that for vertical contacts the poles of the local wave number define the inverse of depth. In other words depth is giving by the expression.
Where Kmax is the peak value of the local wave number K over the step source? It can be shown that
1Depth=kmax (3)
22
maxTilt TiltKx y
∂ ∂ = + ∂ ∂ (4)
22
TVDR zAnd Tilt = arctan = arctan
HGRAD T Tx y
∂
∂ ∂ ∂ + ∂ ∂
(5)
Solution grids using the SPI technique show the edge locations, depths, dip and susceptibility contrasts. Hence the SPI map shows more close resemblance to geology than either the Total Magnetic Intensity or its derivatives. The technique works best for isolated 2D source such as contacts, thin sheet edges, or horizontal cylinder [45].
Result Presentation and InterpretationThe TMI image is characterized by regions of long wavelength and
shows high amplitude around the axis of the Younger Granite ridges. The pockets of low magnetic values observed separating Younger Granite ridges (basement rocks) are due to the position of the study area on the globe (low magnetic latitude). Thus the anomalies are inverted, i.e. basement areas containing metamorphic and igneous rocks show low magnetic values. The TMI requires further processing in order to simplify interpretation.
As can be observed on the TMI image (Figure 8), the anomalies related to the source geometry are often not apparent at low magnetic latitudes (just as the study area), hence the need to reduce to pole or equator. One Reduction to Pole (RTP) image was generated with Amplitude Correction Inclination (ACI) of 40 referred to as RTP (40). The visual observation of its precursor (RTP 20) which was generated prior to generating the RTP (40) image displays a major limitation of the RTP procedure. North-South anomalies are highly distorted; consequently interpretations are obscured. The RTP (40) image appears better (Figure 9), despite the high amplitude correction applied. The RTP transformation has correctly placed the peaks over the source, magnetic highs are observed within the peripheries of the Younger Granite ridges with Jos-Bukuru, Ririwai, Kagaro, Kila-Wuji and Rishua displaying the highest. Prominent magnetic lows are observed within the Northern part of the study area. First and second vertical derivatives (1VD and 2VD) of the TMI were performed in order to

Citation: Ibeneme Sabinus I, Oha Ifeanyi A, Abdulsalam Nasir N, Onuoha Mosto K (2018) Improved Mapping of the Structural Disposition of Some Younger Granite Ring Complexes of Nigeria Using High Resolution Aeromagnetic Data. J Geol Geophys 7: 443. doi: 10.4172/2381-8719.1000443
Page 7 of 13
Volume 7 • Issue 4 • 1000443J Geol Geophys, an open access journalISSN: 2381-8719
Figure 8: Total Magnetic Intensity (TMI) Image of the study area.
Figure 9: RTP image of the study area with ACI = 40.
Figure 10: First Vertical Derivative image of the study area.
enhance shallow sources. Figure 10 shows the distribution of basement rocks, volcanoes, hyperbysal rocks and intrusives in the study area (blue patterns). The 2VD image tends to reveal more features distinctively, but is noisier (Figure 11). The 2VD image shows the Younger Granite ring complexes as pockets of intrusive structures displayed in blue pattern. The horizontal gradient display is characteristically employed in the enhancement of linear features from aeromagnetic data. The magmatic induced patterns in the study area are observed and are accompanied by numerous linear features (Figure 12). Within the Younger Granite areas, there is high density of these linear structures indicating intense structural perturbation during emplacement [28]. Lineaments extracted from aeromagnetic data (Figure 13) are generally few (about 1529) and are deep seated structures. The persistence of the NE-SW dominant trend on the First Vertical Derivative (1VD) map (Figure 13) shows that this trend represents the dominant structural trend in the area. A closer look at these maps shows that there is high density of lineaments of the order of 50-100 km within the areas occupied by the Younger Granite ring complexes. This typifies intense deformation by faulting and fracturing of the country rock that permitted the emplacement of these Younger Granites.
The Analytic Signal of the Total Intensity data is computed to understand the distribution of magnetic sources in the study region. Figure 14 shows the magnitude of the analytic signal of the residual magnetic intensity data (Figure 15) of the study area in the space domain. The maxima or peak of the magnitude of analytic signal represents the magnetic contacts between igneous intrusions (mainly the Younger Granite intrusions in the form of dykes and/or granite plutons) and the surrounding basement rocks within the area. The magnitude of analytic signal within the study area depends on the magnetic susceptibility contrast between Younger Granite intrusions and the Older Basement rocks (Older Granites, Migmatites and Gneisses). Basic igneous rocks have a higher magnetic susceptibility than acidic igneous rocks. In this study, the peaks in magnitude of analytic signal could result from magnetic susceptibility contrast between the rocks of the Younger

Citation: Ibeneme Sabinus I, Oha Ifeanyi A, Abdulsalam Nasir N, Onuoha Mosto K (2018) Improved Mapping of the Structural Disposition of Some Younger Granite Ring Complexes of Nigeria Using High Resolution Aeromagnetic Data. J Geol Geophys 7: 443. doi: 10.4172/2381-8719.1000443
Page 8 of 13
Volume 7 • Issue 4 • 1000443J Geol Geophys, an open access journalISSN: 2381-8719
Figure 11: Second Vertical Derivative image of the study area.
Figure 12: First Horizontal Derivative image of the study area.
Granite Complex (being mainly acidic in composition) and that of the Older Basement rocks mainly composed of Migmatites and Migmatitic gneisses which contain more of mafic minerals. Comparing Figures 13 and 15, it can also be observed that the maxima or peaks in the analytic signal are more within the Jos-Bukuru, Kila Wuji, Ningi Bura and Gamawa complexes when compared with other complexes in the study area. This implies that there may be more Younger Granite intrusions
Figure 13: Lineament extracted from Aeromagnetic map draped on 1VD map of the area.
Figure 14: Analytic Signal image of the study area.
Figure 15: Residual Magnetic map of the study area.

Citation: Ibeneme Sabinus I, Oha Ifeanyi A, Abdulsalam Nasir N, Onuoha Mosto K (2018) Improved Mapping of the Structural Disposition of Some Younger Granite Ring Complexes of Nigeria Using High Resolution Aeromagnetic Data. J Geol Geophys 7: 443. doi: 10.4172/2381-8719.1000443
Page 9 of 13
Volume 7 • Issue 4 • 1000443J Geol Geophys, an open access journalISSN: 2381-8719
within the Older Basement rocks in these complexes than the other complexes within the study area. Areas with question marks on the Analytic Signal map (Figure 15) are locations with signatures and patterns similar to that of the Younger Granite ring complexes without a record of the presence of such in that localities.
3D Euler map is displayed in Figure 16 with Structural Index (S.I) value of 2.0. The technique was applied to the upward continued aeromagnetic anomaly data to determine depth of ring complexes in the study area. Structural Index 2.0, which represents cylindrical shaped body, was chosen because magnetic field of alkaline intrusions (like ring complexes) can simply and accurately be inferred with cylindrical shaped body. Just like in the Analytic Signal map, those localities that display some signatures and patterns similar to that of the Younger Granite ring complexes wherein the occurrence of that in such an area has not been well documented are enclosed in white boxes with question marks on the 3D Euler Deconvolution map (Figure 16). One of such areas which fell within the Ririwai Sheet 126 (Figure 17), which has been studied by Raimi et al, revealed more information concerning these anomalies and as such referred to as unexposed ring complex, and was equally identified in
this work and extensively studied.
The Source Parameter Imaging (SPI) map of the study area (Figure 17) shows that 85 to 90% of the study area contains sources that are relatively shallow. The shape, orientation and vertical extent of these ring complexes as mapped along profiles A-B, C-D and E-F on the Analytic Signal map are shown in Figures 18-21.
Table 2 summarizes the findings of the depth estimates using both the SPI and Euler techniques while Table 3 shows the approximate surface geometry of some notable ring complexes within the study area as extracted from the Analytic Signal map.
Discussion & Results
Analysis and study of the magnetic data revealed that the Younger Granite province of Nigeria is punctuated by pockets of distinct magnetic anomalies with diverse shapes/plans. The first horizontal derivative map of the study area is characterized by majorly NE-SW
Figure 16: 3D Euler Deconvolution on Analytic Signal image of the study area (SI=2.0).
Figure 17: Source Parameter Imaging (SPI) map of the study area.
Figure 18: Analytic Signal map of the area showing Profile Directions.
Figure 19: Geologic profile along NE-SW direction passing through the unexposed ring complex and two other Complexes.

Citation: Ibeneme Sabinus I, Oha Ifeanyi A, Abdulsalam Nasir N, Onuoha Mosto K (2018) Improved Mapping of the Structural Disposition of Some Younger Granite Ring Complexes of Nigeria Using High Resolution Aeromagnetic Data. J Geol Geophys 7: 443. doi: 10.4172/2381-8719.1000443
Page 10 of 13
Volume 7 • Issue 4 • 1000443J Geol Geophys, an open access journalISSN: 2381-8719
trending structural pattern. This pattern is similar to that pointed out by Alkali Oluyide, Alkali and Gaiya [29,76,77] as relating to the Pan African structural trend of the basement complex. The distinct magnetic anomalies, clearly revealed in Figure 15, coincide spatially with outcropping ring complexes of the area and their surface geometry accurately measured (Table 3). Some anomalies with the same feature with the anomalies of the ring complexes were also revealed (indicated with question marks within white boxes) but without an associated surface manifestation (outcrop). These anomalies are believed to be intrusions, probably ring complexes without surface exposures, similar to that suggested by Ajakaiye [78] in the north eastern part of the province, Raimi [79] within the Ririwai sheet and by Mantovani, Dutra and Marangoni, Dutra, Louro and Mantovani in central Brazil [80-83]. The pattern/position of the unexposed ring complex and the approximate thickness of overburden covering it were clearly displayed on the 3D-Euler Deconvolution map. The results of the Euler solutions indicate that the depths of the ring complexes range from outcrop to 1800 m. For the inferred unexposed ring complex, the depth ranges
from 5 to 1200 m. using the Source Parameter Imaging (SPI) technique, it was observed that the basement areas (undifferentiated basement and the older basement rocks) are generally exposed, where buried they rarely exceed depths of 124 m thereby accounting for the high magnetic responses observed within these areas. The Younger Granite ring complexes show low SPI depth values of about 4 km below the sea level indicating deeper magnetic sources (Figure 17). Three (3) profiles (A-B, C-D and E-F) were respectively taken along the NE-SW, NNW-SSE and E-W directions on the Analytic Signal map (Figure 18) to estimate the possible depth of burial and subsurface structure of the unexposed ring complex and the nearby known Younger Granite ring complexes. From profile A-B, it was observed that overburden thickness of less than 20 m masked the unexposed ring complex with its root situated at approximately 200 m below the sea level (Figure 19). The Ririwai ring complex was observed to have an outcrop of approximately 1300 m above mean sea level with its mappable root situated at approximately more than 400 m below the sea level. Similarly, the Tibchi ring complex was observed to have an outcrop of approximately 950 m above sea level with its root resting at approximately 180 m below the sea level (Figure 19). Along profile C-D, the Banke ring complex was observed to have an outcrop of approximately 920 m above mean sea level with its root situated at approximately more than 400 m below the sea level whereas the Amo ring complex has an outcrop of approximately 1400 m above mean sea level with its root situated at approximately more than 800 m below the sea level (Figure 20). Profile E-F displayed Kudaru ring complex having a surface exposure of approximately 1150 m above mean sea level with its root situated at approximately 10 m below the sea level; just as the Zuku ring complex has an outcrop of approximately 1220 m above mean sea level with its mappable root situated at an approximate depth of 300 m below the sea level (Figure 21). Thus the two depth estimating techniques (3D Euler Deconvolution and Source Parameter Imaging) utilized in this research gave similar depth estimates for the studied outcropped Younger Granite ring complexes and the unexposed ring complex. On the subsurface orientation of some of the ring complexes, it was observed that along NE-SW direction (Figure 19), both the unexposed ring complex and the Tibchi complex were outward dipping with depth whereas the Ririwai ring complex was inward dipping with depth. Along the NNW-SSE direction (Figure 20), both Banke, Amo and the unexposed ring complexes were all outward dipping with depth. Similarly too, it was observed that along the E-W direction (Figure 21), Kudaru ring complex was inward dipping, the Zuku complex was outward dipping while the unexposed ring complex was near vertical to inward dipping with depth.
From the 2D model of the subsurface geometries and orientations of the studied ring complexes, it could be deduced that the likely reason for the unexposed nature of the newly proposed ring complex could be as a result of partial subsidence of the enclosed block on which the extrusive edifice of the central volcano originally rested probably occasioned by excess space (much subsurface accommodation) for continuously rising magma within the country rock. Its geometry is supportive of this assertion as it revealed majorly outward dipping trend with depth along different axis. Another reason could be due to incomplete fluidization along the already formed ring fracture and poor assimilation of the country rock by the fluidizing agent amidst
Figure 20: Geologic profile along NNW-SSE direction passing through the unexposed ring complex and two other Complexes.
Figure 21: Geologic profile along E-W direction passing through the unexposed ring complex and two other Complexes.

Citation: Ibeneme Sabinus I, Oha Ifeanyi A, Abdulsalam Nasir N, Onuoha Mosto K (2018) Improved Mapping of the Structural Disposition of Some Younger Granite Ring Complexes of Nigeria Using High Resolution Aeromagnetic Data. J Geol Geophys 7: 443. doi: 10.4172/2381-8719.1000443
Page 11 of 13
Volume 7 • Issue 4 • 1000443J Geol Geophys, an open access journalISSN: 2381-8719
Data Date Available Line Spacing Terrain Clearance Flight line direction Data format
Old data 1974 2000m 200m E-W Hard copy contour maps on a scale of 1:100,000
New data 2011 500m 80m NW-SE Digital formats in gdb, xls (excel), PDF, JPEG etc.
Sources: Old Data (GSN 1974); New Data (GSN 2011).Table 1: Old data versus New data.
Ring Complexes Latitude (N) Longitude (E) Approximate Surface Elevation amsl (m)
Approximate Depth of Root bmsl (m)
Depth to Anomaly
Source- Euler (m)
Depth to Anomaly
Source- SPI (m)
Unexposed 10035/ 8035/ NIL 200 5-1200 10-1000Ririwai 10045/ 8038/ 1300 400 Outcrop-1800 Outcrop-1200
Tibchi Yeli 10043/ 9000/ 950 180 Outcrop-1200 Outcrop-900Banke 10051/ 8031/ 920 400 Outcrop-1800 Outcrop-1200Amo 10000/ 8056/ 1400 400 Outcrop-2200 Outcrop-2400
Kudaru 10040/ 8025/ 1150 200 Outcrop-1200 Outcrop-900Zuku 10035/ 8055/ 1220 200 Outcrop-1800 Outcrop-1500
Table 2: Depth to Anomaly sources using Euler and SPI techniques.
Ring Complexes Approximate Maximum Diameter (Km)
Approximate Minimum Diameter (Km)
Approximate Surface Area (km2) Surface shape/plan
Tibchi 27 17 344.5 Elliptical Ririwai 17 16 180 Oval
Ningi-Burra 67Ningi centre (20)
436 Coalesced with oval and elliptical plans.Bura centre (23.3)
Mada 26.5 15 271 Oval Buji 10 7 112 Nearly circular
Geshere 12.5 4 48 Lenticular Zaranda 31 10 100 EllipticalBanke 11 8 128 Sub-circular
Saiya-Shokobo 18 14 251 Elliptical Jere-Sanga 30 12 102 Elliptical
Tongolo 18 14 130 Crescent Junguru 19 8 3 Roughly OblongSutumi 3.2 2.6 3 Oval Kofani 4.8 2.4 5.2 Elliptical
Buji 9.7 6.2 78 Circular Jos-Bukuru 48 21 430 Elliptical
Jarawa 27 22 66 Circular Ganawuri kigom 16 14.7 181 Circular
Kagoro 21 10 232 Elliptical Ropp 35 16 181 Polygonal
Sara-Fier 48 13 287 LenticularNingishi 6.5 4.8 28.5 Elliptical
Amo 22.4 19.7 357 CircularKudaru 13 7.1 135 EllipticalZuku 21 11 172 Elliptical
Table 3: Surface Geometry of some Ring Complexes extracted from the Analytic Signal map.
a slow/near quiescent piece meal stoping process during the central granite intrusion phase which usually marks the end of ring complex formation [84,85].
ConclusionThis study area has demonstrated that the methodology supports
shared cognitive responsibility for decision-making in structural interpretation. The Younger Granite ring complexes of Northern Nigeria are characterized by majorly NE-SW trending structural pattern. The surface shapes (plans) as well as the subsurface geometries of some of
the Younger Granite ring complexes have been precisely mapped. The ring complexes appear in diverse shapes like elliptical, oval, circular, lenticular, oblong, polygonal and the fascinating cum admiring shape of Tongolo ring complex similar to the shape of a new moon (crescent). From this research, it was encapsulated that the ring complexes of Northern Nigeria exhibit both inward and outward dipping structural orientations with depth. Finally, it could be concluded that this research has demonstrated the efficacy of aeromagnetic data in delineating both outcropping ring complexes as well as those without surface exposures (outcrops).

Citation: Ibeneme Sabinus I, Oha Ifeanyi A, Abdulsalam Nasir N, Onuoha Mosto K (2018) Improved Mapping of the Structural Disposition of Some Younger Granite Ring Complexes of Nigeria Using High Resolution Aeromagnetic Data. J Geol Geophys 7: 443. doi: 10.4172/2381-8719.1000443
Page 12 of 13
Volume 7 • Issue 4 • 1000443J Geol Geophys, an open access journalISSN: 2381-8719
References
1. Bowden P, Kinnaird JA (1984) Geology and mineralization of the Nigerian anorogenic ring complexes: with a geological map at the scale of 1:500,000. Geologisches Jahrb (Hannover) B Vol. 56: 3-65.
2. Karche JP, Vachette M (1976) Mineralisation associated with the Nigerian Mesozoic ring complexes. CR Acad Sci Paris 282: 2033-2036.
3. Martin RF, Bowden P (1981) Peraluminous granite produced by rock fluid interaction in Ririwai non-orogenic Ring Complex, Nigeria: Mineralogical evidence. Can Min 19: 65-82.
4. Turner DC, Bowden P (1979) The Ningi-Burra complex, Nigeria: dissected calderas and migratory magmatic centres. J Geol Soc London 136: 105-119.
5. Ike EC (1983) The structural evolution of the Tibchi ring complex: A case study for the Nigerian younger granite province. Geol Soc London 140: 781-788.
6. Bowden P, Black R, Martin RF, Ike EC, Kinnaird JA, et al. (1986) Niger-Nigerian alkaline ring complexes: A classic example of African Phanerozoic Anorogenic Mid-Plate Magmatism. African Geol 30: 357-339.
7. Bowden P, Whitley JE, Breemen OV (1989) Geochemical studies on the Younger Granites of Nigeria” in Geology of Nigeria KOGBE CA 209-225.
8. Kinnaird JA, Bowden P, Ixer RA, Odling NWA (1985) Mineralogy, geochemistry and mineralization of the ririwai complex, northern Nigeria. J Afr Earth Sci 3: 185-122.
9. Olade MA (1978) Early cretaceous basalt volcanism and initial continental rifting in the Benue Trough Nigeria. Nature 273: 458-459.
10. Ike EC, Bowden P, Martin RF (1984) Fayalite and clinopyroxene in the porphyries of the Tibchi anorogenic ring-complex, Nigeria: postmagmatic initiation of a paralkaline trend. Canad Mineral 22: 401-409.
11. Abaa SI (1985) The structure and petrography of alkaline rocks of the mada younger granite complex, Nigeria. J African Earth Sci 3: 107-113.
12. Ogunleye PO, Ike EC, Garba I (2004) Multivariate statistical analysis of major and trace element data for niobium exploration in the peralkaline granites of the anorogenic ring-complex province of Nigeria. J Min Geol 40: 107-117.
13. Ogunleye PO, Garba I, Ike EC (2006) Factors contributing to enrichment and crystallization of niobim in pyrochlore in the Kaffo albite arfvedsonite granite, Ririwai Complex, Younger Granites province of Nigeria. J Afr Sci 372-382.
14. Shehu SM, Robert FM, Echefu CI, Awajiokan EI (2011) The Geshere syenite-peralkaline granite pluton: A key to understanding the anorogenic Nigerian Younger Granites and analogues elsewhere. Periodico di Mineralogia 80: 199-215.
15. Akanbi ES, Ugodulunwa FXO, Gyang BN (2012) Mapping potential cassiterite deposits of naraguta area, North Central, Nigeria using geophysics and geographic information system (GIS). J Nat Sci Res 2: 8.
16. Ajakaiye DE (1968) A gravity interpretation of the Lurei younger granite ring complex of northern Nigeria. Geol Mag 105: 256-263.
17. Ajakaiye DE (1985) Deep structures of alkaline ring complexes from geophysical data. J African Earth Sci 3: 273.
18. Kogbe CA (1985) Landsat imagery interpretation map of curve-linear structures in North-Central Nigeria. J Afr Ear Sci 3: 269-270.
19. Etim ON (1985) Symmetrical resistivity and magnetic field measurements in the Banke and Daga Allah ring complexes in Nigeria. J Afr Earth Sci 3: 274.
20. Turner DC (1989) Structure and petrology of the younger granite ring complexes. Geology of Nigeria [2nd Edn] 227-244.
21. Odia BE (1989) Regional magnetic lineaments in the younger granite province of Northern Nigeria. J Min Geol 25: 233-240.
22. Ologun JAA (2004) Geological mapping of parts of Jos Plateau using Nigeria Sat-1 Image; NASRDA News Bulletin 35-37.
23. Samaila CA, Solomon NY (2011) Groundwater potential on the Jos-Bukuru Plateau, North Central Nigeria, using lineaments from gravity measurements. J Water Res & Pro 3: 628-633.
24. Opara AI, Udoete RL, Emberga TT, Echetama HN, Ugwuegbu IE, et al. (2015) Structural interpretation of the Jos-Bukuru Younger Granite Ring Complexes Inferred from Landsat-TM Data. J Geosci & Geom 3: 56-67.
25. Olasehinde A, Ashano EC (2013) Geological lineaments and pattern analysis in mineral exploration: A case study of ririwai complex. Earth Resour 1: 110-118.
26. Ibe KK, Ajakaiye DE, Ojo SB (1985) Gravity interpretation of the Zaranda Younger Granite ring Complex, Nigeria. J Afr Earth Sci 3: 253-259.
27. Adubok AS (2008) Evolutionary trend of the Jarawa younger granites ring complex Jos plateau, Central Nigeria. Sci Wor J 3: 121-126.
28. Olasehinde A, Ashano EC, Singh GP (2012) Analysis of magnetic anomaly over the riruwai younger granite ring complex: A geodynamic implication. Continental J Earth Sci 7: 9-18.
29. Alkali SC (2013) Mapping and analysis of the density of lineaments around kagoro younger granite rocks in North Central Nigeria. Glob Advan Res J Eng, Technol & Inn 2: 295-303.
30. Ibeneme SI, Nwosu CO, Selemo AOI, Ibe KK (2014) Application of geoelectrical technique in delineating geological structures around ganawuri area, North Central Nigeria. Int Res J Nat Sci 2: 18-26.
31. Gay SP (1963) Standard curves for the interpretation of magnetic anomalies over long tabular bodies. Geophys 28: 161–200.
32. Gay SP (1965) Standard curves for the interpretation of magnetic anomalies over long horizontal cylinders. Geophys 30: 818–828.
33. McGrath H (1970) The dipping dike case: a computer curve-matching method of magnetic interpretation. Geophys 35: 831-848.
34. Bhattacharyya BK (1965) Two-dimensional harmonic analysis as a tool for magnetic interpretation. Geophys 30: 829–857.
35. Mohan NL, Sundararajan N, Seshagiri Rao SV (1982) Interpretation of some two-dimensional magnetic bodies using Hilbert transforms. Geophys 46: 376–387.
36. Prakasa Rao TKS, Subrahmanyan M, Srikrishna Murthy A (1986) Monograms for direct interpretation of magnetic anomalies due to long horizontal cylinders. Geophys 51: 2150–2159.
37. McGrath PH, Hood PJ (1973) An automatic least-squares multi-model method for magnetic interpretation. Geophys 38: 349–358.
38. Silva JBC (1989) Transformation of nonlinear problems into linear ones applied to the magnetic field of a two-dimensional prism. Geophys 54: 114–121.
39. Grant RS, West GF (1965) Interpretation theory in applied geophysics. Bull Seismolog Soc Am 583.
40. Abdelrahman EM (1994) A rapid approach to depth determination from magnetic anomalies due to simple geometrical bodies. J Univ Kuwait Sci 21: 109–115.
41. Abdelrahman EM, Sharafeldin SM (1996) An iterative least-squares approach to depth determination from residual magnetic anomalies due to thin dikes. J Appl Geophys 34: 213–220.
42. Singh NP, Lal T, Banerjee M (2000) Application of Hankel transform in the interpretation of magnetic anomaly over semi-infinite vertical rod. Acta Geod Geophys Hungarica 35: 143–148.
43. Salem A, Ravat D, Martin FM, Ushijima K (2004) Linearized least squares method for interpretation of potential-field data from sources of simple geometry. Geophys 69: 783–788.
44. Salem A, Smith R (2005) Depth and structural index from normalized local wave number of 2D magnetic anomalies. Geophys Prospect 53: 83–89.
45. Nabighian MN (1984) Toward a three-dimensional automatic interpretation of potential field data via generalized Hilbert transforms: Fundamental relations. Geophys 49: 780-786.
46. Roest WR, Verhoef J, Pilkington M (1992) Magnetic interpretation using the 3D analytic signal. Geophys 57: 116-125.
47. Salem A (2005) Interpretation of magnetic data using analytic signal derivatives. Geophys Prospect 53: 75–82.
48. Salem A, Ravat D (2003) A combined analytic signal and Euler method (AN-EUL) for automatic interpretation of magnetic data. Geophys 68: 1952–1961.
49. Nabighian MN, Grauch VJS, Hansen RO, LaFehr TR, Li Y, et al. (2005) The historical development of the magnetic method in exploration. Geophys 70: 33ND–61ND.
50. Tlas M, Asfahani J (2011a) Fair function minimization for interpretation of magnetic anomalies due to thin dikes, spheres and faults. J Appl Geophys 75: 237–243.

Citation: Ibeneme Sabinus I, Oha Ifeanyi A, Abdulsalam Nasir N, Onuoha Mosto K (2018) Improved Mapping of the Structural Disposition of Some Younger Granite Ring Complexes of Nigeria Using High Resolution Aeromagnetic Data. J Geol Geophys 7: 443. doi: 10.4172/2381-8719.1000443
Page 13 of 13
Volume 7 • Issue 4 • 1000443J Geol Geophys, an open access journalISSN: 2381-8719
51. Tlas M, Asfahani J (2011b) A new-best-estimate methodology for determining magnetic parameters related to field anomalies produced by buried thin dikes and horizontal cylinder-like structures. Pure Appl Geophys 168: 861–870.
52. Abdelrahman EM, Essa KS (2015) A new method for depth and shape determinations from magnetic data. Pure Appl Geophys 172: 439–460.
53. Tlas M, Asfahani J (2015) The simplex algorithm for best-estimate of magnetic parameters related to simple geometric-shaped structures. Math Geosci 47: 301–316.
54. Gokturkler G, Balkaya C (2012) Inversion of self-potential anomalies caused by simple geometry bodies using global optimization algorithms. J Geophys Eng 9: 498–507.
55. Sharma SP, Biswas A (2013) Interpretation of self-potential anomaly over a 2D inclined structure using very fast simulated-annealing global optimization—an insight about ambiguity. Geophys 78: WB3–15.
56. Biswas A, Sharma SP (2014a) Resolution of multiple sheet-type structures in self-potential measurement. J Earth Syst Sci 123: 809–825.
57. Biswas A, Sharma SP (2014b) Optimization of self-potential interpretation of 2-D inclined sheet-type structures based on very fast simulated annealing and analysis of ambiguity. J Appl Geophys 105: 235–247.
58. Biswas A (2015) Interpretation of residual gravity anomaly caused by a simple shaped body using very fast simulated annealing global optimization. Geosci Front 6: 875–893.
59. Biswas A, Tapas A (2016) A very fast simulated annealing method for inversion of magnetic anomaly over semi-infinite vertical rod-type structure. Model Earth Syst Environ 2: 198.
60. Biswas A, Sharma SP (2016a) Interpretation of self-potential anomaly over 2-D inclined thick sheet structures and analysis of uncertainty using very fast simulated annealing global optimization. Acta Geod Geophys 52: 439-455.
61. Biswas A (2016b) A comparative performance of least square method and very fast simulated annealing global optimization method for interpretation of self-potential anomaly over 2-D inclined sheet type structure. J Geol Soc India 88: 493–502.
62. Biswas A (2016) Interpretation of gravity and magnetic anomaly over thin sheet-type structure using very fast simulated annealing global optimization technique. Model Earth Syst Environ 2: 30.
63. Biswas A, Sharma SP (2015) Interpretation of self-potential anomaly over idealized body and analysis of ambiguity using very fast simulated annealing global optimization. Near Surface Geophys 13: 179–195.
64. Biswas A (2017) Inversion of source parameters from magnetic anomalies for mineral/ore deposits exploration using global optimization technique and analysis of uncertainty. Nat Resou Res 27: 77-107.
65. Biswas A, Parija MP, Kumar S (2017) Global nonlinear optimization for the interpretation of Source Parameters from total gradient of gravity and magnetic anomalies caused by thin dyke. Ann Geophys 60: 1-17.
66. MacLeod WN, Turner DC, Wright EP (1965) The geology of the Jos Plateau. General Geol Survey Niger Bull 1: 118.
67. GSN (2011) Digital airborne magnetometer survey data of total magnetic intensity. GSN airborne Geophysical Series 117.
68. Nabighian MN (1972) The analytic signal of two-dimensional magnetic bodies with polygonal cross-section – Its properties and use for automated anomaly interpretation. Geophys 37: 507-517.
69. Reid AB, Allsop JM, Granser H, Millett AJ, Somerton IW (1990) Magnetic interpretation in three di- mensions using euler deconvolution. Geophys 55: 80-91.
70. Bello YA, Lawal KM (2015) Interpretation of aeromagnetic data over the Geshere and Rishiwa Ring Complexes of North-Western Nigeria. Asian J Multidisciplinary studies 3: 1-9.
71. Whitehead N, Musselman C (2008) Montaj Grav/Mag Interpretation: Processing, analysis and visualization system for 3D Inversion of potential field data for oasis montaj V 6.3. Geosoft Incorporated, 85 Richmond St. W. Toronto, Ontario, M5H 2C9, Canada.
72. Thompson DT (1982) EULDPH – A new technique for making computer-assisted depth estimates from magnetic data. Geophys 47: 31-37.
73. Thurston JB, Smith RS (1997) Automatic conversion of magnetic data to depth, dip, susceptibility contrast using the SPITM method. Geophys 62: 807-813.
74. Thurston J, Guillion JC, Smith RS (1999) Model-independent depth estimation with the SPI method. SEG Technical Program Expanded Abstracts 403-406.
75. Thurston J, Smith RS, Guillion JC (2002) A multimodel method for depth estimation from magnetic data. Geophys 67: 555-561.
76. Oluyide PO (1988) Structural trends in the Nigerian basement complex. Precambrian Geology of Nigeria, Geological Survey of Nigeria 93-98.
77. Alkali SC, Gaiya S (2011) Delineation of linear structures from digitized aeromagnetic data of the western part of the younger granite complex of North Central Nigeria. New York Sci J 4: 56-62.
78. Ajakaiye DE (1989) A gravity survey over the Nigerian younger granite province. [2nd Ed] Elizabethan Publ Co, Lagos 227-244.
79. Raimi J, Dewu BBM, Sule P (2014) An interpretation of structures from the aeromagnetic field over a region in the Nigerian younger granite province. Int J Geosci 5: 313-323.
80. Mantovani MSM, Rugenski A, Diogo LA, Shukowsky W (2005) Integrated geophysical investigation of a possible new alkaline occurrence in SE Brazil. J South Am Earth Sci 20: 259-266.
81. Dutra AC, Marangoni YR (2009) Gravity and magnetic 3d inversion of morro do engenho complex, Central Brazil. J Sou Am Earth Sci 28: 193-203.
82. Dutra AC, Marangoni YR, Junqueira-Brod TC (2011) Investigation of the Goiás alkaline province, Central Brazil: Application of gravity and magnetic methods. J Sou Am Earth Sci 33: 43-55.
83. Louro VHA, Mantovani MSM (2012) 3D Inversion and modeling of magnetic and gravimetric data characterizing the geophysical anomaly source in pratinhai in the southeast of Brazil. J App Geophys 80: 110-120.
84. GSN (1974) Airborne magnetometer survey map of contours of total magnetic intensity. GSN airborne Geophysical Series 189.
85. Singh A, Biswas A (2016) Application of global particle swarm optimization for inversion of residual gravity anomalies over geological bodies with idealized geometries. Nat Resour Res 25: 297–314.


![Improved [0.2] Persistent Grid Mapping](https://img.pdfslide.net/doc/110x75/6181695e554f9720c0104372/improved-02-persistent-grid-mapping.jpg)