Embed Size (px)
Citation preview
IMPROVED PREDICTABILITY OF IN-SITU COMBUSTION ENHANCED OILRECOVERY
A. R. KOVSCEK, L.M. CASTANIER, AND M. G. GERRITSEN
Abstract. In-situ combustion (ISC) possesses advantages over surface-generated steam injectionfor deep reservoirs in terms of wellbore heat losses and generation of heat above the critical pointof water. Additionally, ISC has drastically lower requirements for water and natural gas, andpotentially a smaller surface footprint in comparison to steam. In spite of its apparent advantages,prediction of the likelihood of successful ISC is unclear. Conventionally, combustion tube tests ofa crude-oil and rock are used to infer that ISC works at reservoir scale and estimate the oxygenrequirements. Combustion tube test results may lead to field-scale simulation on a coarse gridwith upscaled Arrhenius reaction kinetics. As an alternative, we suggest a comprehensive workflowto predict successful combustion at the reservoir scale. The method is based on experimentallaboratory data and simulation models at all scales. In our workflow, a sample of crushed reservoirrock or an equivalent synthetic sample is mixed with water/brine and the crude-oil sample. Themixture is placed in a kinetics cell reactor and oxidized at different heating rates. An isoconversionalmethod is used to estimate kinetic parameters versus temperature and combustion characteristicsof the sample. Results from the isoconversional interpretation provide a first screen of the likelihoodthat a combustion front is propagated successfully. Then, a full-physics simulation of the kineticscell experiment is used to predict the flue gas composition. The model combines a detailed PVTanalysis of the multiphase system and a multistep reaction model. A mixture identical to thattested in the kinetics cell is also burned in a combustion tube experiment. Temperature profilesalong the tube and also the flue gas compositions are measured during the experiment. A high-resolution simulation model of the combustion tube test is developed and validated. Finally, thehigh-resolution model is used as a basis for upscaling the reaction model to field dimensions. Field-scale simulations do not employ Arrhenius kinetics. As a result, significant stiffness is removed fromthe finite difference simulation of the governing equations. Preliminary field-scale simulation showslittle sensitivity to grid-block size and the computational work per time step is much reduced.
Introduction
During in-situ combustion (ISC) air is injected into the reservoir with the intent of oxidizing asmall fraction of the hydrocarbon in place. The significant heat generated by combustion reactionsmainly contributes to enhanced oil recovery by reducing crude-oil viscosity and increasing driveenergy through pressurization that results in a vigorous gas drive (Prats, 1982). Large temperaturedifference signifies heat transfer and results in phase change. Thus, ISC is a strongly coupled reactivetransport process whose modelling is challenging. Compounding difficulties, crude-oil components,reactive intermediate products, and the reactions cannot be characterized exhaustively.
Conventionally, combustion tube tests are used to infer the likelihood of combustion at field scaleand design the ISC process (Moore. et al., 1997). A combustion tube test gives an understandingof parameters affecting ISC such as air requirement, fuel deposition, and front propagation speed(Sarathi, 1999). The study of reaction kinetics in the combustion tube, however, is not appropriate.Likewise, there is interplay of transport, phase behavior, and reaction (Lin. et al., 1984) in acombustion tube that needs to be deconvoluted. Combustion tube tests are typically designedto operate in the so-called high-temperature oxidation (HTO) mode and feature the products of
1
2 A. R. KOVSCEK, L.M. CASTANIER, AND M. G. GERRITSEN
bond-breaking reactions including CO2, CO, and H2O. Low temperature oxidation (LTO) andfuel formation reactions, while occurring in the combustion tube, are not easy to discern fromcombustion tube results. The products of LTO are partially oxygenated hydrocarbons and H2Owhereas fuel formation produces coke-like species. An ISC coke is a carbon-rich, hydrogen poor,high-molecular weight reaction product. Clearly, effective fuel formation is vital for successfulcombustion in the HTO mode.
Based on the air requirement obtained from combustion tube experiments and a selection of wellpatterns, the required air compression is estimatable and a project can be designed. Moore. et al.(1997) have suggested to use a line-drive pattern and restricted well-spacing to provide sufficientair to the field. Semi-empirical and analytical models, such as the Gates and Ramey (1980)methodand Brigham et al. (1980), were developed to aid design without requiring extensive computation.
Prediction of field performance using reservoir simulation remains difficult, however. See, forexample, Zhu. et al. (2011). Commercial and research thermal simulators have been developed tomodel and predict the in-situ combustion process (Coats, 1980; Eclipse, 2009; STARS, 2009). In allcommercial thermal simulators, mass and energy conservation equations are solved coupled withchemical reaction terms calculated using Arrhenius kinetics. It is well known that for increasingthe length scale to full field from laboratory, severe grid-size effects are encountered during in-situcombustion simulations (Coats, 1983; Gutierrez et al., 2009; Kristensen et al., 2007). That is, weare not able to achieve consistent predictions at field scale using typical large grid blocks.
To mitigate the grid-size effects in ISC simulations, various empirical techniques have beendeveloped. In many cases, the reaction kinetics parameters were changed or tuned to force the oil toburn in field-scale simulations. This can be achieved, for example, by adjusting the activation energyto small or even zero values, thereby lowering the threshold crude oil burning energy requirement.In some cases, the temperature values in Arrhenius kinetics are also adjusted to make the oil easierto burn (Coats, 1983). A comprehensive summary of all these techniques is presented in Marjerrisonand Fassihi (1992). Specialized numerical methods such as adaptive mesh refinement (Christensenet al., 2004) and operator splitting (Kristensen, 2008) have also been applied, leading to someimprovement in simulator performance. Despite such improvements, there is a lack of applicabilityfor field-scale simulation.
Motivated by the potential of ISC and the need for predictive capability, we propose a workflowand describe through example application the steps at each phase of the workflow. The scope of theworkflow extends from laboratory measurement to upscaling of equivalent reaction effects withinlarge volume grid blocks. Our goal is to develop laboratory procedures to measure indicators ofcombustion performance and to demonstrate a methodology for simulation of the effect of in-situcombustion reactions on the field scale accurately and without severe grid-size effects.
Our research efforts, to date, have aimed at developing the experimental and reservoir simulationcomponents of the workflow. The intent of this paper is to present the workflow employing thesecomponents and illustrate it through example. This paper proceeds with a description of theworkflow. Then each element of the workflow is illustrated and discussed. We pay special attentionto the linkage of experimental data with numerical models to create a predictive mechanistic modelof in-situ combustion. Succeeding sections discuss experimental tests to assess crude-oil oxidationkinetics, the calibration of a numerical model for kinetics, implementation of the kinetic model intoa simulator to describe front propagation in a combustion tube, and the use of fine-scale mechanisticmodels to generate upscaled simulation input. Discussion and conclusions complete the paper.
IMPROVED PREDICTABILITY OF IN-SITU COMBUSTION ENHANCED OIL RECOVERY 3
Workflow
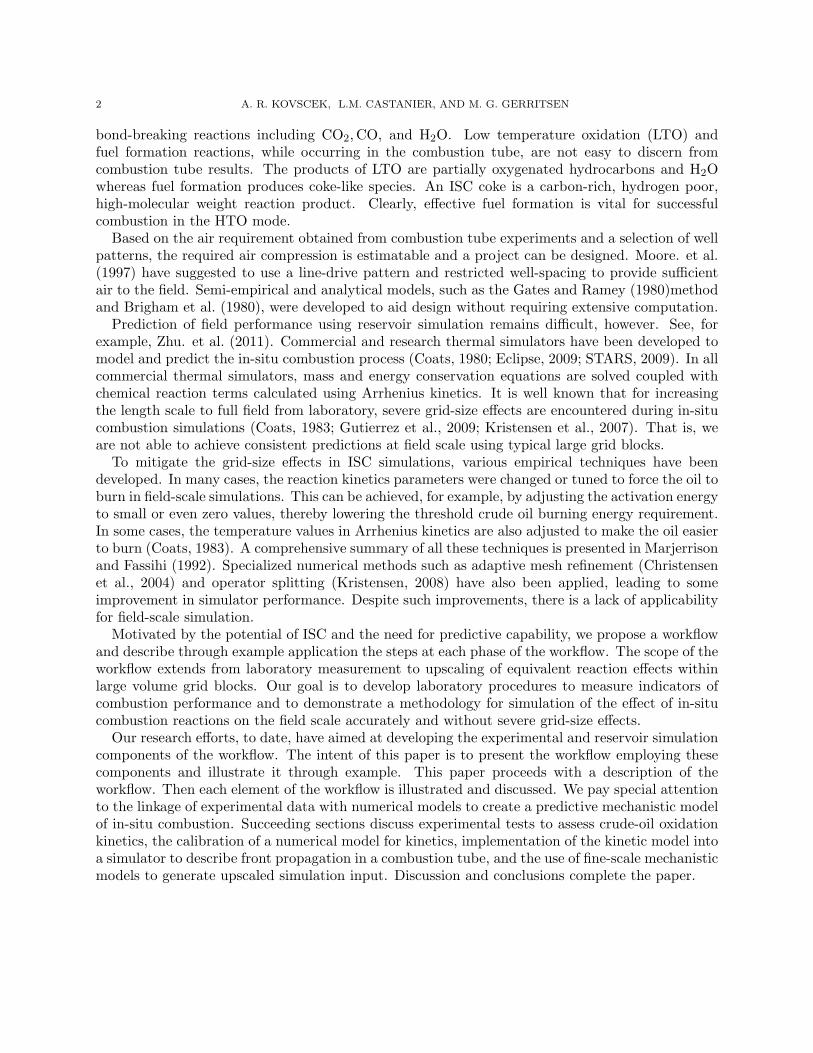
As an alternative to current ISC engineering and design (Moore. et al., 1997; Sarathi, 1999),we suggest a workflow (Fig.1) that integrates ramped temperature oxidation (RTO) experimentsof crude-oil (referred to here as kinetics cell experiments), combustion tube experiment, composi-tional analysis of crude-oil, high resolution mechanistic models and combustion-specific upscalingto predict ISC at reservoir scale. In our approach, the kinetics cell experiment is used to probe thekinetics of combustion rather than a combustion tube (Cinar. et al., 2009, 2011; Lapene. et al.,2011-a) . This workflow transitions naturally across length and time scales integrating experimentand numerical modeling. In this sense, the workflow for ISC is mulitscale and multiphysics. Al-though ISC is applicable to heavy and light oils, this workflow was constructed from a heavy-oilperspective. We have yet to consider the extension to light oils.
We first prepare a sample of crushed reservoir rock or an equivalent synthetic sample mixed withbrine/water and crude-oil. The mixture is put in the kinetic cell and oxidized at a given heatingrate. The test is then repeated at different heating rates. We take advantage of the isoconversionalmethod (Cinar. et al., 2011; Cinar et al., 2011-b) to distinguish different regions of reaction duringcombustion. The isoconversional interpretation provides a first screen of the likelihood that acombustion front can be propagated successfully. If the crude-oil sample shows a positive sign ofbeing a good candidate for ISC, then the detailed compositional description and PVT propertiesof the crude-oil sample is obtained.
The isoconversional method also provides us with a plot of effective activation energy versustemperature. A reaction model (or models) is developed and tested to reproduce effluent gas pro-duction from the kinetics cell at various heating rates and the isoconversional fingerprint obtainedexperimentally. An optimization method is used to find the reaction parameters in a way that itmatches the kinetics cell result. This provides a high-resolution reaction model to be used in thecombustion tube simulation.
The next steps in the combustion study are combustion tube experiments that are performedon al mixture identical to that in the kinetic cell experiment. By understanding the multi-scalenature of ISC, we present a methodology for reaction upscaling. The reaction model is validatedby comparing prediction and experimental result. The reaction model and/or the results fromcombustion tube experiments are then useful to provide quantities such as the amount of fuelformed during combustion. The high-resolution reaction model also, naturally, provides referencesolutions for upscaling in the final stages of the work flow.
The remainder of this paper lays out the workflow. Throughout this paper, the heavy crude oilanalyzed and characterized is from Venezuela. This sample is a so-called well-burning sample asshall be illustrated.
Kinetics Cell Experiment
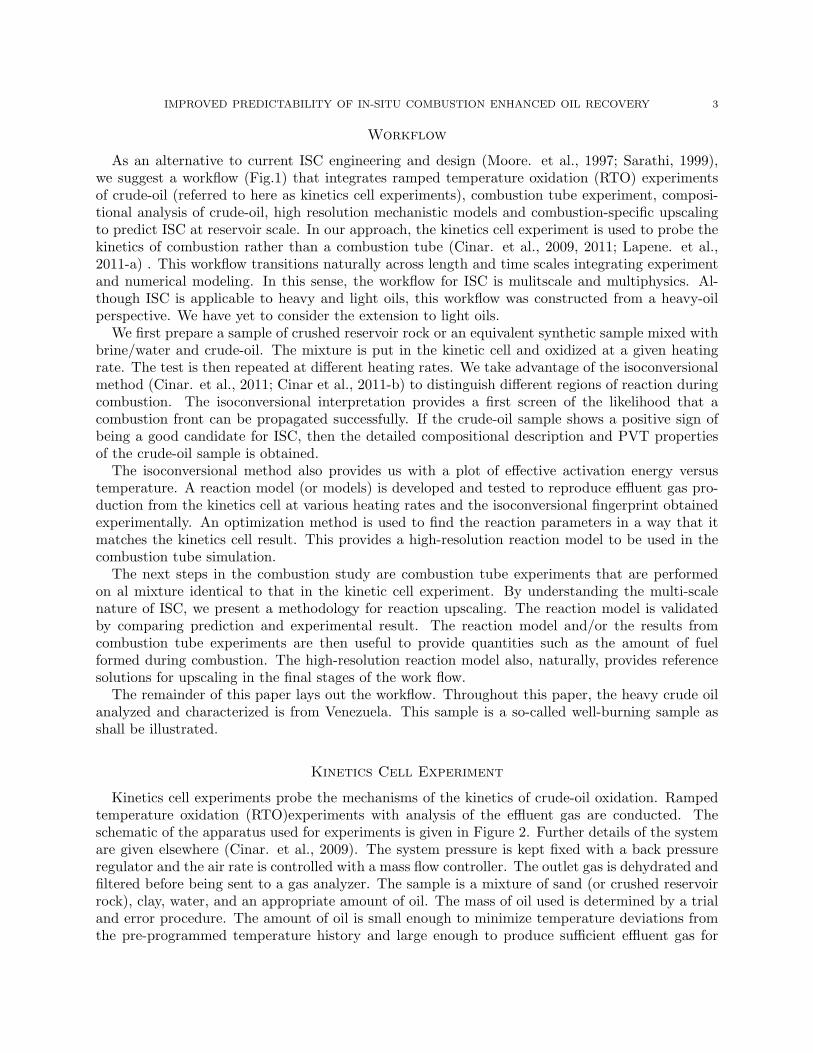
Kinetics cell experiments probe the mechanisms of the kinetics of crude-oil oxidation. Rampedtemperature oxidation (RTO)experiments with analysis of the effluent gas are conducted. Theschematic of the apparatus used for experiments is given in Figure 2. Further details of the systemare given elsewhere (Cinar. et al., 2009). The system pressure is kept fixed with a back pressureregulator and the air rate is controlled with a mass flow controller. The outlet gas is dehydrated andfiltered before being sent to a gas analyzer. The sample is a mixture of sand (or crushed reservoirrock), clay, water, and an appropriate amount of oil. The mass of oil used is determined by a trialand error procedure. The amount of oil is small enough to minimize temperature deviations fromthe pre-programmed temperature history and large enough to produce sufficient effluent gas for
4 A. R. KOVSCEK, L.M. CASTANIER, AND M. G. GERRITSEN
Figure 1. Proposed workflow.
analysis. Typically, about 2 g of oil are used. Then, the sample is packed into the kinetics cell andthe cell is placed in the furnace. Temperature at various points in the cell and in the furnace aremeasured using thermocouples. While increasing the temperature linearly, air (or sometimes aninert gas) is passed through the cell. The pressure at the inlet and the outlet of the cell, exit flowrate, temperature in the cell at various points and furnace, and effluent gas composition of CO2,CO, CH4, and O2 are recorded continuouslyThe isoconversional interpretation technique requires a series of experiments to be conducted at
Figure 2. Experimental apparatus for ramped temperature oxidation experiments.
IMPROVED PREDICTABILITY OF IN-SITU COMBUSTION ENHANCED OIL RECOVERY 5
different heating rates (Vyazovkin, 1997, 2001). All the other parameters, such as pressure, flowrate, initial temperature and so on are held fixed for all tests. Therefore, each experiment isconducted with great care to achieve satisfactory and consistent results with the proposed analysistechnique. At least five consistent experiments are necessary for the isoconversional analysis toproduce reliable results (Cinar. et al., 2009). Once the set is complete, the isoconversional analysisis applied.
Isoconversional Method. ISC reaction rates are commonly described as a function of fuel con-centration and oxygen partial pressure (Bousaid. et al., 1968). Assuming Arrhenius behavior forthe rate constant, this model is
−dCf
dt= Ae−
ERT P a
O2Cb
f(1)
where a and b represent exponents for oxygen partial pressure and fuel concentration, respectively,E is the activation energy (J/mol), T is absolute temperature (K), R is the gas constant (J/mol-K)and A is a pre-exponential factor sometimes referred to as the Arrhenius constant. Similar formsare applied by various authors (Bousaid. et al. (1968), Burger and Sahuquet (1972), Fassihi. et al.(1984)).
Beyond its wide application, Eq. (1) is the simplest form of a combustion rate equation. In reality,oxidation of hydrocarbons involves a set of series and parallel reactions leading to a complicatedreaction scheme with an overall reaction expression that may not be entirely represented by Eq.(1). The isoconversional method provides a way to bypass such complex, unknown reaction models.Numerous experiments at different heating rates are performed to probe and parameterize thereaction. Here, we lay out the general methodology for applying the isoconversional method tocrude oils. Substantial details are available in the literature (Cinar. et al., 2009, 2011).
In a more general expression, the reaction rate is written as a product of rate constant andreaction model. The former is a function of temperature and the latter is a function of concentrationor conversion. Representing the reaction model with f(X), we have
−dX
dt= K(T )f(X)(2)
where K(T ) is the rate constant (units depends on reaction model). The rate constant is expressedas a function of temperature. Assuming Arrhenius behavior we have,
−dX
dt= Ae−
ERT f(X)(3)
The isoconversional principle states that at constant extent of conversion, the reaction rate isonly a function of the temperature. Eq. (3) is the basis of all isoconversional methods discussed inthis work. Taking the logarithm of Eq. (3) gives,
ln(dX
dt) = ln(A) + ln[f(X)]− E
RT(4)
At constant values of conversion, f(X) is assumed to be constant. This is analogous to assumingthat the chemistry of the process is independent of temperature and dependent only on the level ofconversion (Friedman, 1964). As a consequence, for different temperatures at the same conversionlevels or isoconversional values, f(X) is identical. Then,
ln(dXx
dtx) = m− Ex
RTx(5)
6 A. R. KOVSCEK, L.M. CASTANIER, AND M. G. GERRITSEN
where
m = ln(A) + ln[f(X)](6)
here tx and Tx are time and temperature, respectively, for any particular experiment at conversion,X. The symbol Ex is activation energy at conversion X. For different constant temperatures, weplot the left hand side (LHS) of Eq. (6) with respect to −1/Tx. The slope of the graph gives E/Rand the intercept is m. This method was first introduced by Friedman (1964) and is referred tothe differential isoconversional method. This method needs reaction rate values to be obtained andthe rate values are usually calculated by numerical differentiation. It is well known that numericaldifferentiation amplifies error in experimental data. Therefore results are sensitive to experimen-tal noise (Vyazovkin, 1997). In order to avoid numerical differentiation, integral isoconversionalmethods were developed (Kissinger (1957), Akahira and Sunose (1971), Ozawa (1965), Flynn andWall (1966), Vyazovkin (1997) and Vyazovkin (2001)). These different methods are described andcompared in their applicability to ISC kinetics by Cinar. et al. (2009). Based on synthetic examplesand experimental analysis they concluded that Vyazovkin (2001) and Friedman (1964) methodswork well for the kinetics analysis of ISC.
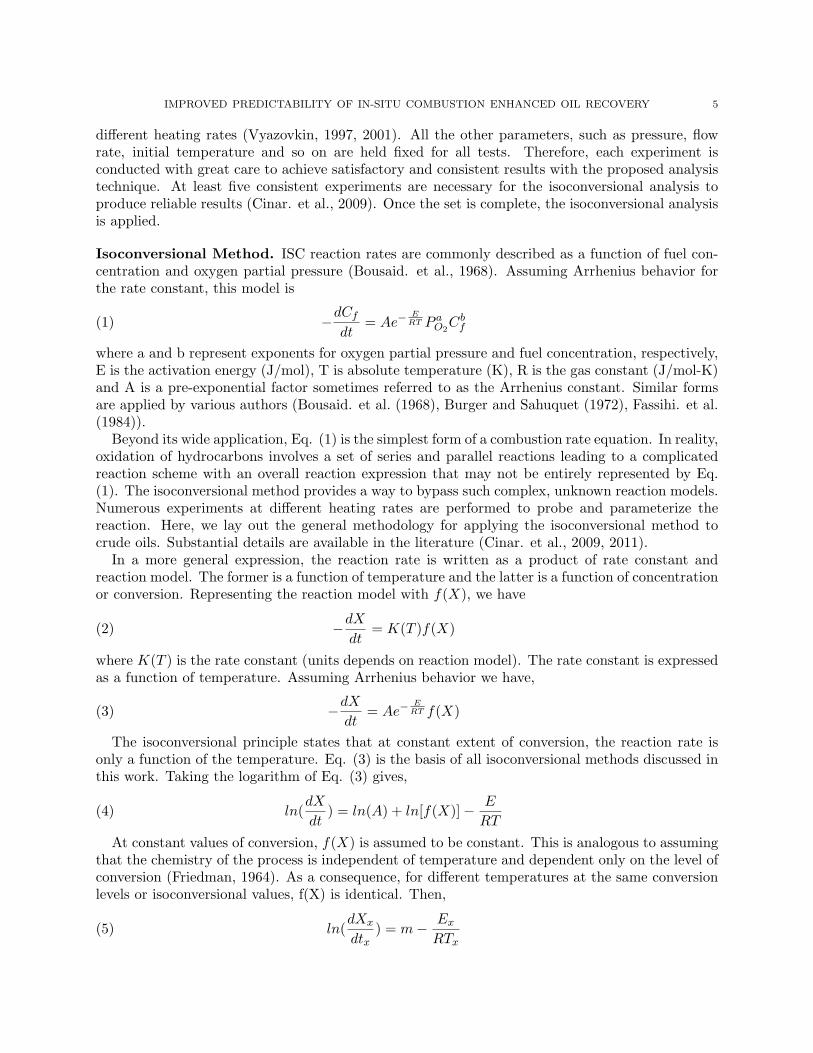
Isoconversional analysis yields effective activation energy versus conversion (or temperature).The plots show how effective activation energy changes with the extent of conversion and providesinitial estimates for reaction parameters. Figure 3 shows the isoconversional fingerprint of a crude-
Figure 3. Sample one, isoconversional fingerprint of a well-burning crude oil. Ef-fective activation energy versus conversion (left) and temperature (right) (Cinar. etal., 2011).
oil sample (Cinar. et al., 2009). It is a typical example of a well-burning oil and encompasses thefeatures of an isoconversional fingerprint. The LTO and HTO reaction regimes identified are shownin Fig.3. Also the valley in the figure is associated with the negative temperature gradient region(NTGR) (Cinar. et al., 2009). Isoconversional methods are useful as a diagnostic tool to recognizethe underlying mechanisms of complex multi-step reactions.
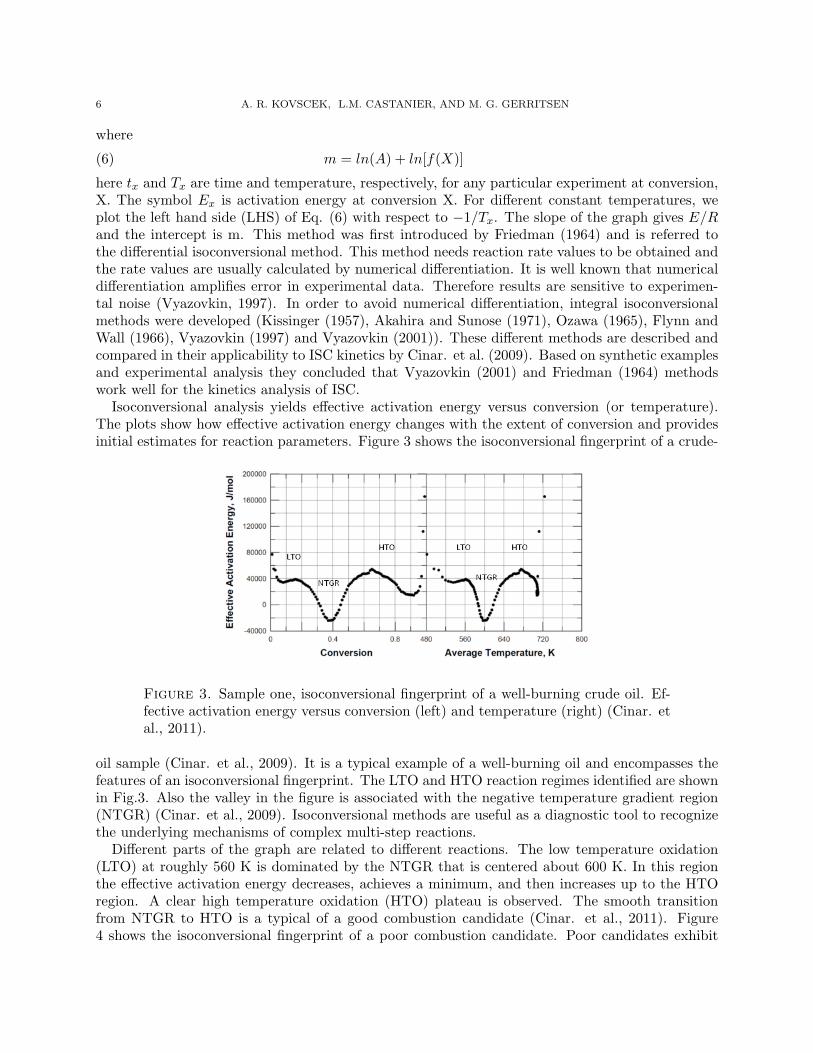
Different parts of the graph are related to different reactions. The low temperature oxidation(LTO) at roughly 560 K is dominated by the NTGR that is centered about 600 K. In this regionthe effective activation energy decreases, achieves a minimum, and then increases up to the HTOregion. A clear high temperature oxidation (HTO) plateau is observed. The smooth transitionfrom NTGR to HTO is a typical of a good combustion candidate (Cinar. et al., 2011). Figure4 shows the isoconversional fingerprint of a poor combustion candidate. Poor candidates exhibit
IMPROVED PREDICTABILITY OF IN-SITU COMBUSTION ENHANCED OIL RECOVERY 7
significant energy barriers in the low temperature region as shown by their fingerprints whereas goodcombustion candidates exhibit a smoother transition and, in general, smaller activation energiesin the low temperature region (Cinar. et al., 2011). Thus, isoconversional method provides a firstscreening of combustion candidates.
Figure 4. Sample two, isoconversional fingerprint of a poor combustion candidate.Effective activation energy versus conversion (left) and temperature (right) (Cinar.et al., 2011).
Phase Behavior. If the interpretation of the result of the isoconversional method suggests thata crude-oil sample is potentially a good candidate for ISC, then a compositional description andPVT analysis of the crude-oil sample is obtained. For the purposes of compositional simulationof ISC and of kinetics cell results, a good characterization of the heavy components is desirable(Lapene. et al., 2011-a).
Simulation of Kinetics Cell Experiment. The governing equation system that models thekinetic cell experiment is composed of classical mass conservation equations. We have followedtwo parallel routes to simulate kinetics cell experiments to discern reaction schemes and pathways.In the first effort, the crude oil is treated in a fully compositional manner, reaction schemes arepostulated, and a multiobjective match to kinetics cell effluent gas history is obtained using a geneticalgorithm. The details of this first effort are reported by Lapene. et al. (2011-a) and Lapene. et al.(2011-b). The second effort employed extensive investigation of reaction intermediates and reactionproducts to infer a lumped reaction model consistent with observation (Cinar et al., 2011-b). Whilewe have had excellent results from these complementary efforts, for reasons of space, this sectionfocuses upon the second approach.
Based on experimental observations, the following simplified reaction scheme is proposed tomimic the experimental observations for oxidation of heavy oil including the isoconversional fin-gerprint. Cinar et al. (2011-b) explains how such a simplified reaction model was obtained. Atleast two different coke formation reactions are necessary because coke precipitated under nitrogen(inert gas) and under air flow have been demonstrated to be different. Thus, there should be twodifferent coke species for LTO and HTO reactions. In combustion tube experiments, ignition isinitiated under nitrogen flow so oxidation of Coke1 is necessary. The transformation of Coke1 toCoke2 was found to be a necessary reaction to obtain the correct response in the NTGR. Coketransformation is unique to such a simplified reaction scheme.
8 A. R. KOVSCEK, L.M. CASTANIER, AND M. G. GERRITSEN
Oil + 4O2 −→ 10Coke1 + 22.3888H2O(7)Coke1 + 1.5O2 −→ CO + CO2(8)
Coke1 −→ 2Coke2(9)Coke2 + 1.4375O2 −→ 0.5CO + CO2(10)
where Oil is an oil species, Coke1 is a coke species, and Coke2 is a coke species. Coke species arehydrogen deficient and produce only carbon oxides during oxidation. For all of the reactions, theArrhenius form of the rate constant is assumed.
There are two significant features of this reaction scheme. First, the scheme does not include anyoil directly burning as experimental data strongly suggest that heavy oil does not burn directly.Second, it includes a reaction that represents the transformation of coke formed in the LTO regioninto the fuel (coke) that burns in HTO region.
Based on the reactions given above, kinetic cell simulations are carried out with a commercialsimulator. A radial model with one grid block in the z direction and 4 blocks in the r directionis built. The details for the grid blocks used in the r direction are given in Cinar et al. (2011-b).The first grid block in the r direction represents the sample, the second the stainless steel tube,the third the spacing between the furnace wall and reactor and, the fourth the furnace. These gridblocks were necessary to mimic the exact programmed heating schedule in the experiments. Theinjected fluid temperature is increased at each time step according to the heating schedule. Thisis similar to the experiments where tubing is tightly coiled and placed within the furnace to allowheating of the inlet gas. Thus, the injected gas reaches the furnace temperature before it reacts.The challenge in modeling the kinetic experiments was to impose a linear heating rate. There isnot an option in the version of the simulator that we used. This problem is solved by changing thetarget temperature for the heaters at each time step. Therefore, we impose a linear heating withdifferent rates with pre calculated target temperature based on the rate. Note that this is doneonly for the pre-programmed temperature history not for the deviations resulting from reactions orwater changing phase. These are a direct result of reaction enthalpy and enthalpy of vaporization.All parameters used in the simulations are given by Cinar et al. (2011-b). The molecular weightsof the lumped components are shown in Table 1. The reaction parameters for the synthetic model1 are given in Table 2.
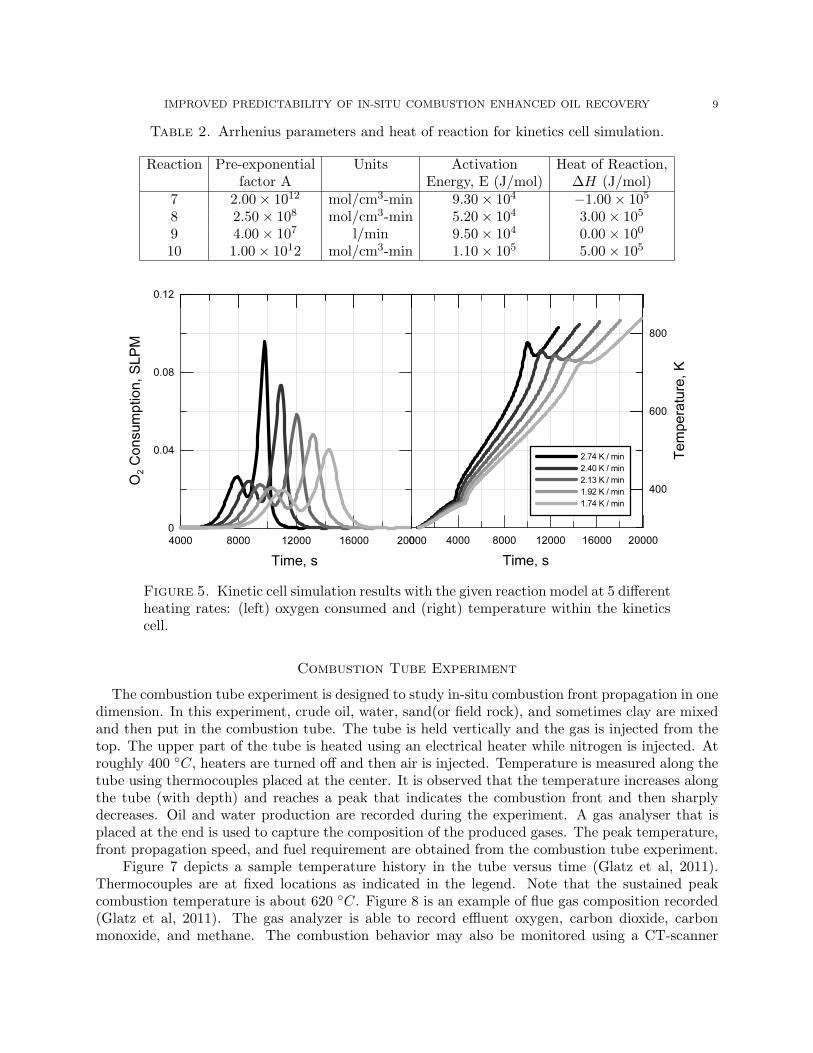
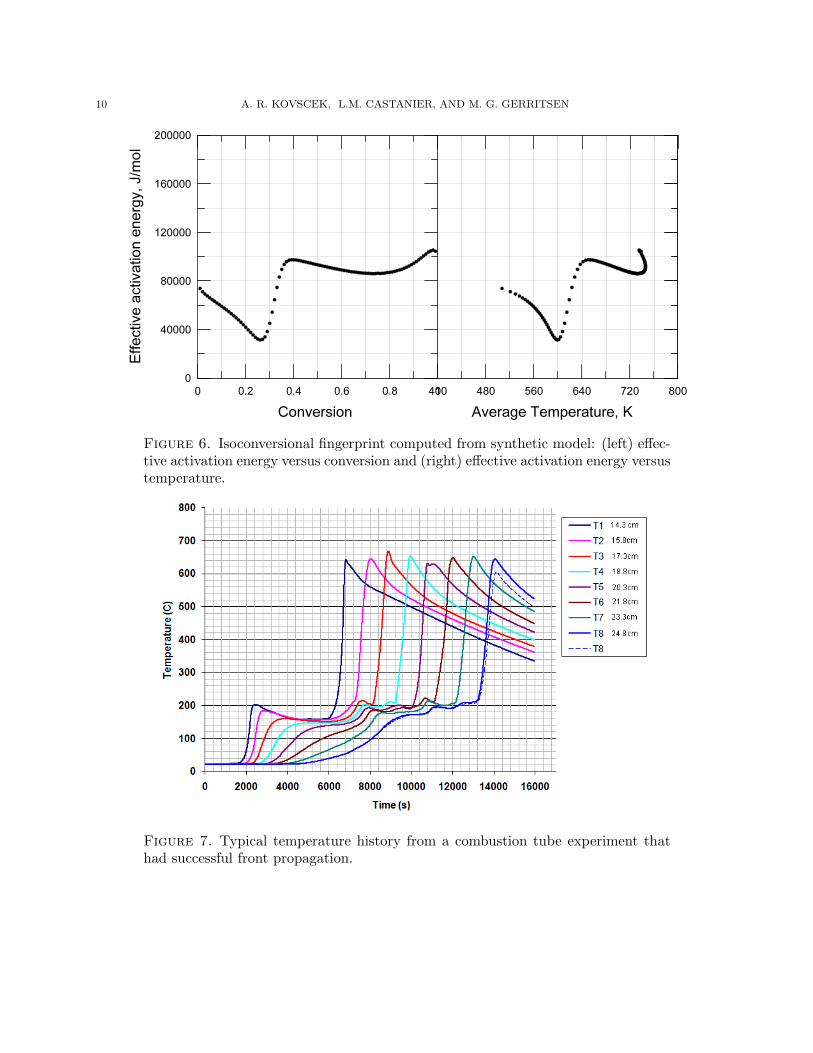
Figure 5 shows the simulation results for the runs with heating rates spanning from 1.74 to 2.74K/min. The first peak in O2 consumption and temperature is representative of LTO while thesecond peak is representative of HTO. This figure indicates that the general trends observed inthe experimental data are conserved in numerical simulations. Based on these simulated data, theisoconversional fingerprint is estimated and given in Figure 6. Compare this result to that in Fig.3 for a well-burning experimental sample.
Table 1. Molecular weights of lumped components
Component MolecularWeight (g/mole)
Oil 515Coke1 24Coke2 12
IMPROVED PREDICTABILITY OF IN-SITU COMBUSTION ENHANCED OIL RECOVERY 9
Table 2. Arrhenius parameters and heat of reaction for kinetics cell simulation.
Reaction Pre-exponential Units Activation Heat of Reaction,factor A Energy, E (J/mol) ∆H (J/mol)
7 2.00× 10¹² mol/cm3-min 9.30× 10⁴ −1.00× 10⁵
8 2.50× 10⁸ mol/cm3-min 5.20× 10⁴ 3.00× 10⁵
9 4.00× 10⁷ l/min 9.50× 10⁴ 0.00× 100
10 1.00× 10¹² mol/cm3-min 1.10× 10⁵ 5.00× 10⁵
!
Figure 5. Kinetic cell simulation results with the given reaction model at 5 differentheating rates: (left) oxygen consumed and (right) temperature within the kineticscell.
Combustion Tube Experiment
The combustion tube experiment is designed to study in-situ combustion front propagation in onedimension. In this experiment, crude oil, water, sand(or field rock), and sometimes clay are mixedand then put in the combustion tube. The tube is held vertically and the gas is injected from thetop. The upper part of the tube is heated using an electrical heater while nitrogen is injected. Atroughly 400 ◦C, heaters are turned off and then air is injected. Temperature is measured along thetube using thermocouples placed at the center. It is observed that the temperature increases alongthe tube (with depth) and reaches a peak that indicates the combustion front and then sharplydecreases. Oil and water production are recorded during the experiment. A gas analyser that isplaced at the end is used to capture the composition of the produced gases. The peak temperature,front propagation speed, and fuel requirement are obtained from the combustion tube experiment.
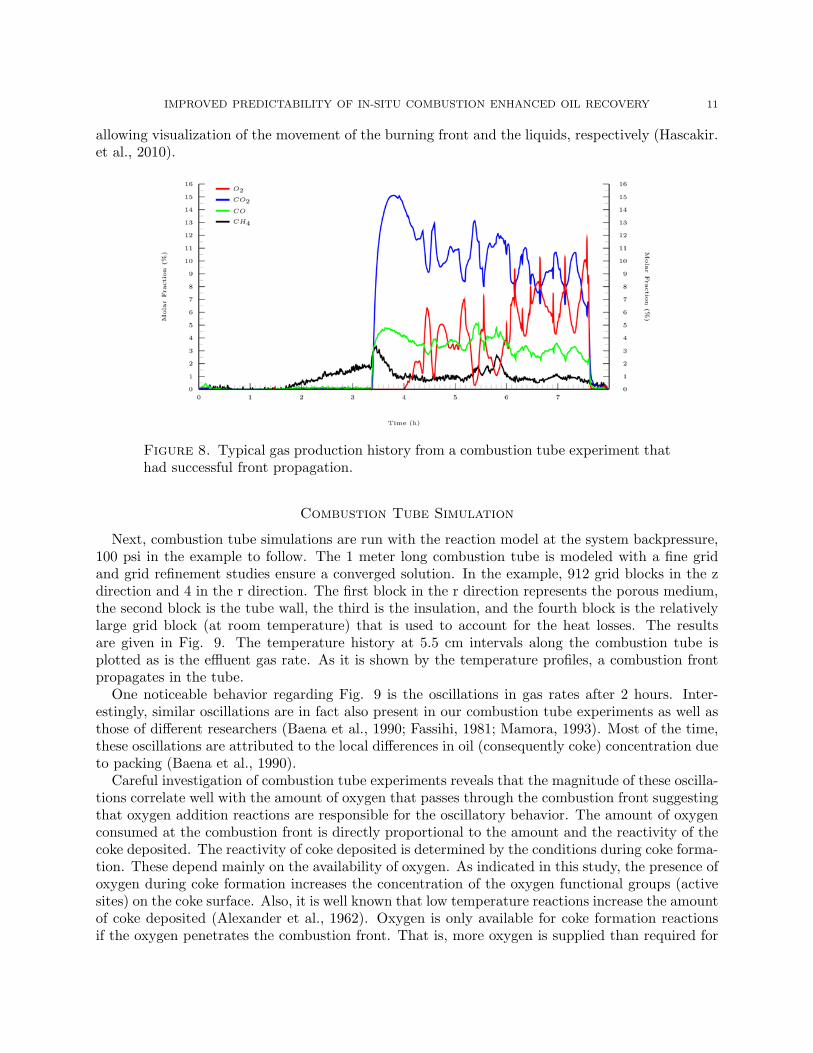
Figure 7 depicts a sample temperature history in the tube versus time (Glatz et al, 2011).Thermocouples are at fixed locations as indicated in the legend. Note that the sustained peakcombustion temperature is about 620 ◦C. Figure 8 is an example of flue gas composition recorded(Glatz et al, 2011). The gas analyzer is able to record effluent oxygen, carbon dioxide, carbonmonoxide, and methane. The combustion behavior may also be monitored using a CT-scanner
10 A. R. KOVSCEK, L.M. CASTANIER, AND M. G. GERRITSEN
Figure 6. Isoconversional fingerprint computed from synthetic model: (left) effec-tive activation energy versus conversion and (right) effective activation energy versustemperature.
Figure 7. Typical temperature history from a combustion tube experiment thathad successful front propagation.
IMPROVED PREDICTABILITY OF IN-SITU COMBUSTION ENHANCED OIL RECOVERY 11
allowing visualization of the movement of the burning front and the liquids, respectively (Hascakir.et al., 2010).
Figure 8. Typical gas production history from a combustion tube experiment thathad successful front propagation.
Combustion Tube Simulation
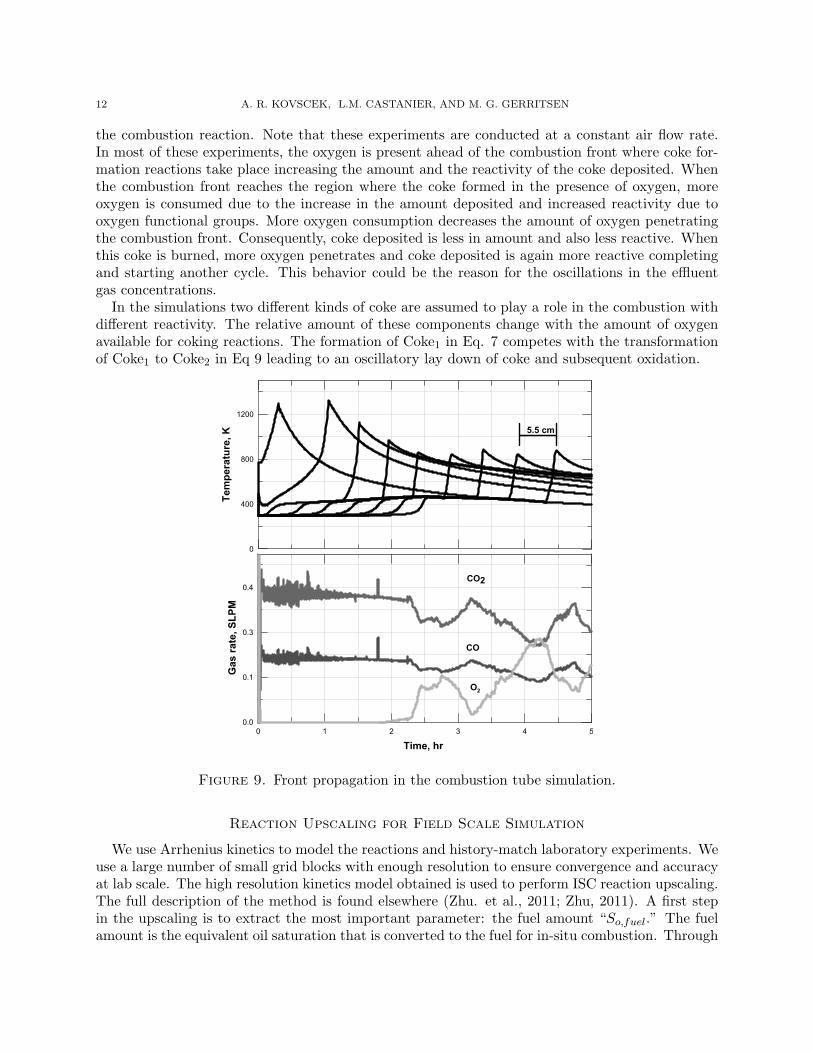
Next, combustion tube simulations are run with the reaction model at the system backpressure,100 psi in the example to follow. The 1 meter long combustion tube is modeled with a fine gridand grid refinement studies ensure a converged solution. In the example, 912 grid blocks in the zdirection and 4 in the r direction. The first block in the r direction represents the porous medium,the second block is the tube wall, the third is the insulation, and the fourth block is the relativelylarge grid block (at room temperature) that is used to account for the heat losses. The resultsare given in Fig. 9. The temperature history at 5.5 cm intervals along the combustion tube isplotted as is the effluent gas rate. As it is shown by the temperature profiles, a combustion frontpropagates in the tube.
One noticeable behavior regarding Fig. 9 is the oscillations in gas rates after 2 hours. Inter-estingly, similar oscillations are in fact also present in our combustion tube experiments as well asthose of different researchers (Baena et al., 1990; Fassihi, 1981; Mamora, 1993). Most of the time,these oscillations are attributed to the local differences in oil (consequently coke) concentration dueto packing (Baena et al., 1990).
Careful investigation of combustion tube experiments reveals that the magnitude of these oscilla-tions correlate well with the amount of oxygen that passes through the combustion front suggestingthat oxygen addition reactions are responsible for the oscillatory behavior. The amount of oxygenconsumed at the combustion front is directly proportional to the amount and the reactivity of thecoke deposited. The reactivity of coke deposited is determined by the conditions during coke forma-tion. These depend mainly on the availability of oxygen. As indicated in this study, the presence ofoxygen during coke formation increases the concentration of the oxygen functional groups (activesites) on the coke surface. Also, it is well known that low temperature reactions increase the amountof coke deposited (Alexander et al., 1962). Oxygen is only available for coke formation reactionsif the oxygen penetrates the combustion front. That is, more oxygen is supplied than required for
12 A. R. KOVSCEK, L.M. CASTANIER, AND M. G. GERRITSEN
the combustion reaction. Note that these experiments are conducted at a constant air flow rate.In most of these experiments, the oxygen is present ahead of the combustion front where coke for-mation reactions take place increasing the amount and the reactivity of the coke deposited. Whenthe combustion front reaches the region where the coke formed in the presence of oxygen, moreoxygen is consumed due to the increase in the amount deposited and increased reactivity due tooxygen functional groups. More oxygen consumption decreases the amount of oxygen penetratingthe combustion front. Consequently, coke deposited is less in amount and also less reactive. Whenthis coke is burned, more oxygen penetrates and coke deposited is again more reactive completingand starting another cycle. This behavior could be the reason for the oscillations in the effluentgas concentrations.
In the simulations two different kinds of coke are assumed to play a role in the combustion withdifferent reactivity. The relative amount of these components change with the amount of oxygenavailable for coking reactions. The formation of Coke1 in Eq. 7 competes with the transformationof Coke1 to Coke2 in Eq 9 leading to an oscillatory lay down of coke and subsequent oxidation.
!
Figure 9. Front propagation in the combustion tube simulation.
Reaction Upscaling for Field Scale Simulation
We use Arrhenius kinetics to model the reactions and history-match laboratory experiments. Weuse a large number of small grid blocks with enough resolution to ensure convergence and accuracyat lab scale. The high resolution kinetics model obtained is used to perform ISC reaction upscaling.The full description of the method is found elsewhere (Zhu. et al., 2011; Zhu, 2011). A first stepin the upscaling is to extract the most important parameter: the fuel amount “So,fuel.” The fuelamount is the equivalent oil saturation that is converted to the fuel for in-situ combustion. Through
IMPROVED PREDICTABILITY OF IN-SITU COMBUSTION ENHANCED OIL RECOVERY 13
fine-scale calibration tests or experiment, we generate a table for fuel amount, So,fuel, with respectto different operating conditions such as pressure, initial condition, type of porous media, and soon. This information is then fed into field-scale reservoir simulation.
For field-scale simulation, nonArrhenius kinetics are used. In a sense, So,fuel is assumed to burninstantaneously. This simplifying assumption appears to be warranted in large grid blocks wherethe rates of reaction are quite large relative to the rate of fluid movement. The method treats thein-situ combustion reaction front as a sub-grid phenomenon. We focus on the equivalent reactioneffects on a large field-scale simulation grid. That is, the amount of heat released, oil burned,and reaction products generated on a field-scale simulation grid block. In this way, we achieveconsistency when scaling up from lab to field.
Although this approach requires calibration of the above mentioned input parameters, it isattractive because it significantly reduces grid-size dependencies. In this way, the reaction termsare insensitive to grid size. This approximate approach also removes the severe stiffness encounteredin the traditional ISC simulation, and can be effectively used for large field-scale simulation andoptimization studies.
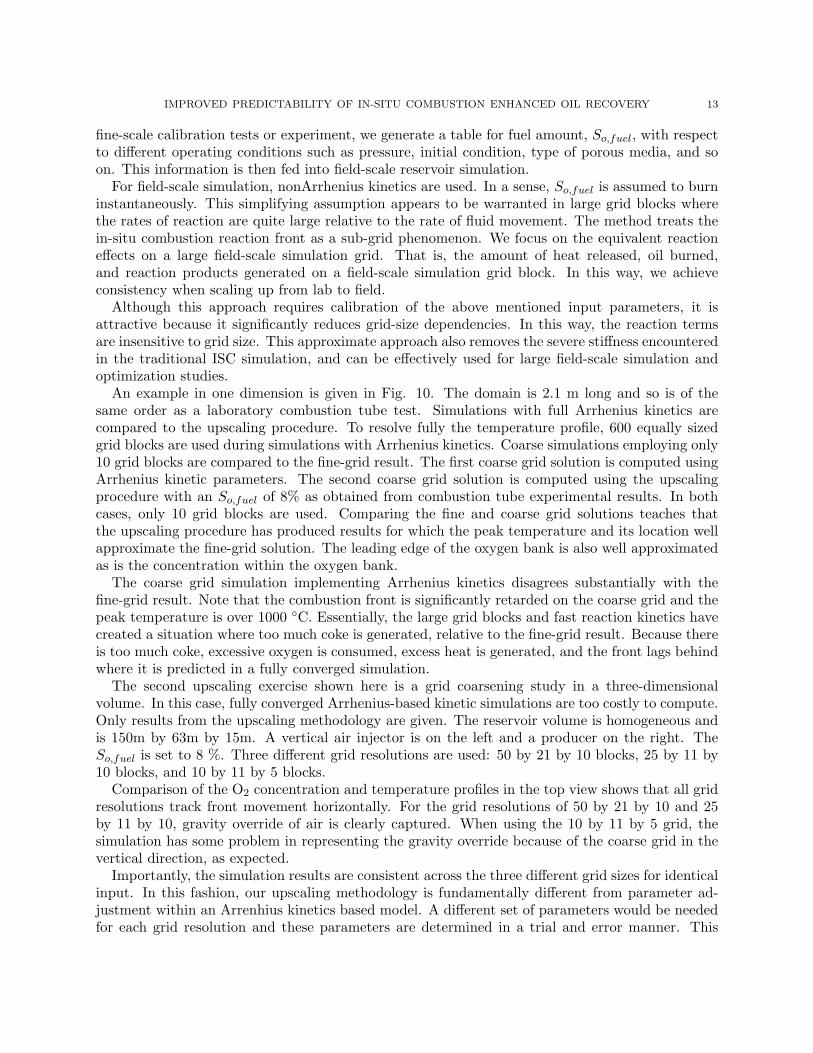
An example in one dimension is given in Fig. 10. The domain is 2.1 m long and so is of thesame order as a laboratory combustion tube test. Simulations with full Arrhenius kinetics arecompared to the upscaling procedure. To resolve fully the temperature profile, 600 equally sizedgrid blocks are used during simulations with Arrhenius kinetics. Coarse simulations employing only10 grid blocks are compared to the fine-grid result. The first coarse grid solution is computed usingArrhenius kinetic parameters. The second coarse grid solution is computed using the upscalingprocedure with an So,fuel of 8% as obtained from combustion tube experimental results. In bothcases, only 10 grid blocks are used. Comparing the fine and coarse grid solutions teaches thatthe upscaling procedure has produced results for which the peak temperature and its location wellapproximate the fine-grid solution. The leading edge of the oxygen bank is also well approximatedas is the concentration within the oxygen bank.
The coarse grid simulation implementing Arrhenius kinetics disagrees substantially with thefine-grid result. Note that the combustion front is significantly retarded on the coarse grid and thepeak temperature is over 1000 ◦C. Essentially, the large grid blocks and fast reaction kinetics havecreated a situation where too much coke is generated, relative to the fine-grid result. Because thereis too much coke, excessive oxygen is consumed, excess heat is generated, and the front lags behindwhere it is predicted in a fully converged simulation.
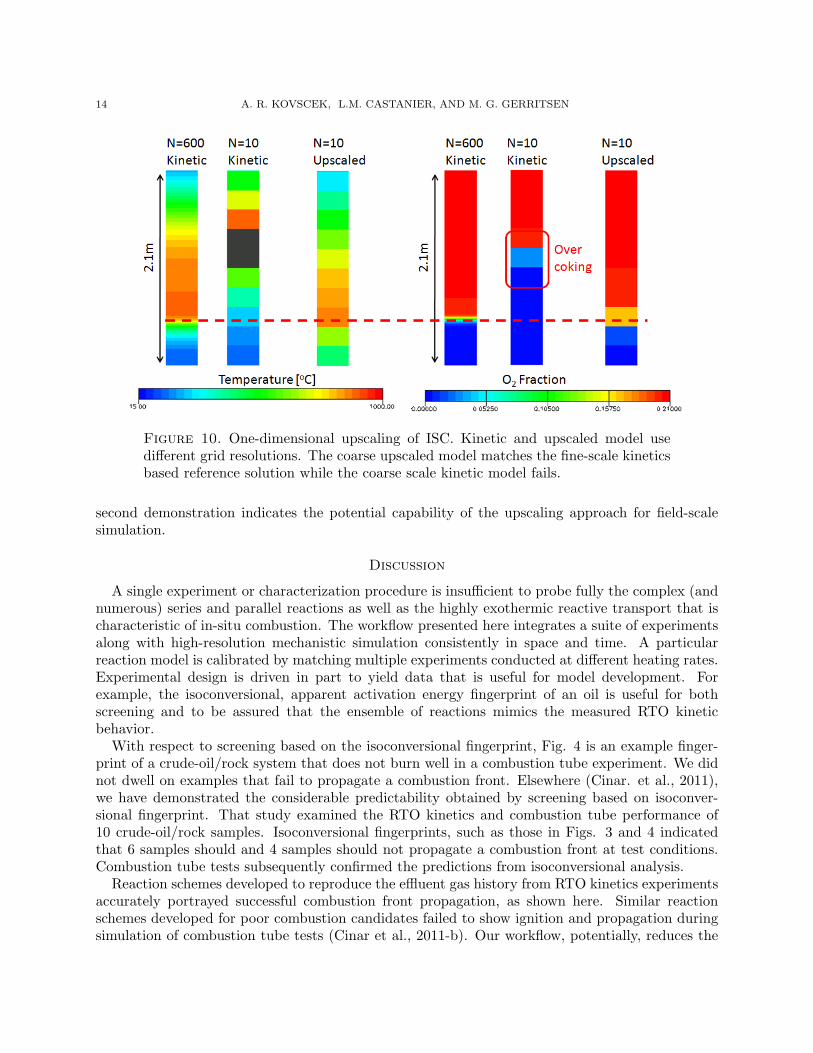
The second upscaling exercise shown here is a grid coarsening study in a three-dimensionalvolume. In this case, fully converged Arrhenius-based kinetic simulations are too costly to compute.Only results from the upscaling methodology are given. The reservoir volume is homogeneous andis 150m by 63m by 15m. A vertical air injector is on the left and a producer on the right. TheSo,fuel is set to 8 %. Three different grid resolutions are used: 50 by 21 by 10 blocks, 25 by 11 by10 blocks, and 10 by 11 by 5 blocks.
Comparison of the O2 concentration and temperature profiles in the top view shows that all gridresolutions track front movement horizontally. For the grid resolutions of 50 by 21 by 10 and 25by 11 by 10, gravity override of air is clearly captured. When using the 10 by 11 by 5 grid, thesimulation has some problem in representing the gravity override because of the coarse grid in thevertical direction, as expected.
Importantly, the simulation results are consistent across the three different grid sizes for identicalinput. In this fashion, our upscaling methodology is fundamentally different from parameter ad-justment within an Arrenhius kinetics based model. A different set of parameters would be neededfor each grid resolution and these parameters are determined in a trial and error manner. This
14 A. R. KOVSCEK, L.M. CASTANIER, AND M. G. GERRITSEN
Figure 10. One-dimensional upscaling of ISC. Kinetic and upscaled model usedifferent grid resolutions. The coarse upscaled model matches the fine-scale kineticsbased reference solution while the coarse scale kinetic model fails.
second demonstration indicates the potential capability of the upscaling approach for field-scalesimulation.
Discussion
A single experiment or characterization procedure is insufficient to probe fully the complex (andnumerous) series and parallel reactions as well as the highly exothermic reactive transport that ischaracteristic of in-situ combustion. The workflow presented here integrates a suite of experimentsalong with high-resolution mechanistic simulation consistently in space and time. A particularreaction model is calibrated by matching multiple experiments conducted at different heating rates.Experimental design is driven in part to yield data that is useful for model development. Forexample, the isoconversional, apparent activation energy fingerprint of an oil is useful for bothscreening and to be assured that the ensemble of reactions mimics the measured RTO kineticbehavior.
With respect to screening based on the isoconversional fingerprint, Fig. 4 is an example finger-print of a crude-oil/rock system that does not burn well in a combustion tube experiment. We didnot dwell on examples that fail to propagate a combustion front. Elsewhere (Cinar. et al., 2011),we have demonstrated the considerable predictability obtained by screening based on isoconver-sional fingerprint. That study examined the RTO kinetics and combustion tube performance of10 crude-oil/rock samples. Isoconversional fingerprints, such as those in Figs. 3 and 4 indicatedthat 6 samples should and 4 samples should not propagate a combustion front at test conditions.Combustion tube tests subsequently confirmed the predictions from isoconversional analysis.
Reaction schemes developed to reproduce the effluent gas history from RTO kinetics experimentsaccurately portrayed successful combustion front propagation, as shown here. Similar reactionschemes developed for poor combustion candidates failed to show ignition and propagation duringsimulation of combustion tube tests (Cinar et al., 2011-b). Our workflow, potentially, reduces the
IMPROVED PREDICTABILITY OF IN-SITU COMBUSTION ENHANCED OIL RECOVERY 15
Figure 11. Three-dimensional field-scale case using the upscaled reaction model atthree different grid resolutions. Plan and cross-section views are given. Consistencyis achieved between the different grids.
number of more difficult and time intensive combustion tube tests through our novel screeningprocess.
Due to space considerations, we only described one method to obtain a calibrated reaction model.Elsewhere (Lapene. et al., 2011-a,-), we describe the parallel approach whereby a reaction modelwith initial estimation of reaction parameters is introduced to a fully compositional simulationmodel of the kinetics cell experiment. A multiobjective genetic algorithm optimization is used toobtain the reaction parameters such that the simulation result matches the kinetics cell experiment.An inherent advantage in this alternate approach is that the optimization produces multiple reactionmodels that match the data equally well. As these different reaction models are easily propagatedforward in the workflow, a natural approach to uncertainty evaluation is available.
16 A. R. KOVSCEK, L.M. CASTANIER, AND M. G. GERRITSEN
The literature documents the clear limitations and numerical errors associated with simulationof ISC at reservoir scale employing large grid blocks and Arrhenius kinetics (Gutierrez et al., 2009).The literature also makes clear that it is difficult to extract parameter values from laboratorytests to use in field and laboratory-scale simulations. The upscaling methodology eliminates adhoc treatment of reaction kinetics and in-situ combustion at reservoir scale. The multireactionmechanistic model of one-dimensional combustion provides a means to explore combustion successat conditions not investigated experimentally. Such mechanistic models also provide the means topredict the fuel amount under a variety of oxygen partial pressure and temperature histories. Thefuel amount is the main parameter needed in the upscaled, nonArrhenius model of combustion.
Summary
A workflow combining experimental measurements, full-physics mechanistic simulation, and up-scaling is proposed to predict the likelihood of successful and unsuccessful ISC at field scale. Thedevelopment of useful simulation parameters is a natural feature of the workflow. Measurementsof crude-oil combustion characteristics at lab scale are important to the overall effort and, im-portantly, the combination of RTO kinetics and combustion tube measurements suggests a highresolution pseudo-reaction model that is predictive of combustion at lab scale. Successively, thishigh-resolution model is used to provide the oil saturation that is converted to fuel and subsequentlyburned as a function of oxygen partial pressure, oxygen flux, rock type and heterogeneities and soon. Field-scale simulations do not employ Arrhenius kinetics. As a result, significant stiffness isremoved from the finite difference simulation of the governing equations. Accordingly, field-scalesimulations run quickly in comparison to cases employing Arrhenius kinetics. Results employingthe new upscaling methodology show very little sensitivity to grid block size.
1. Acknowledgment
Financial support was provided generously by Schlumberger and the Stanford University PetroleumResearch Institute Affiliates (SUPRI-A). Many coworkers contributed to the development of thisworkflow and its components including M Bazargan, M Cinar, G Glatz, B. Hascakir, A. Lapene,F. Ogunbanwo, and Z. Zhu. Their contributions are acknowledged gratefully.
References
Akahira, T., and Sunose, T., 1971. Res. Report, Chiba Inst. Technol., Vol.16, 22.Alexander, J. D.; Martin, W. L.; Dew, J. N., 1962. Factors affecting fuel availability and composition
during in situ combustion, Journal of Petroleum Technology, 14(10):11541164.Baena, C. J.; Castanier, L. M.; Brigham, W. E., 1990. Effect of metallic additives on in situ com-
bustion of Huntington Beach crude experiments. US DOE report, Stanford University, Stanford,California, February 1990. DOE/BC/14126-26; SUPRI-TR78.
Bousaid, I. S., and Ramey, H.J. Jr., 1984. Oxidation of Crude Oil in Porous Media, Soc. of Pet.Eng. J.,137-148.
Brigham, W.E., Satman, A., and Soliman, M.Y., 1980. Recovery Correlations for In-Situ Combus-tion Field Projects and Application to Combustion Pilots, J. Petr. Tech., 32(12) 2132-2138.
Burger, J. G., and Sahuquet, B.C., 1972. Chemical Aspects of In-Situ Combustion-Heat of Com-bustion and Kinetics, SPEJ 410-422.
Christensen J., Darche G., Dechelette B., Ma H., and Sammon P. 2004. Applications of DynamicGridding To Thermal Simulations, SPE86969 presented at SPE International Thermal Opera-tions and Heavy Oil Symposium and Western Regional Meeting, Society of Petroleum Engineers
IMPROVED PREDICTABILITY OF IN-SITU COMBUSTION ENHANCED OIL RECOVERY 17
Cinar, M., Castanier, L. M., and Kovscek, A. R., 2009. Isoconversional Kinetic Analysis of theCombustion of Heavy Hydrocarbons, Energy and Fuels, 23(8):4003-4015.
Cinar, M., Castanier, L. M., and Kovscek, A. R., 2011. Predictability of Crude Oil In-Situ Com-bustion by the Isoconversional Kinetic Approach, SPE Journal 16(3) 537-547.
Cinar, M,L.M. Castanier, and A.R. Kovscek,2011 Combustion Kinetics of Heavy Oils in PorousMedia, to appear Energy and Fuels.
Coats, K.H, 1980. In-Situ Combustion Model, SPE Journal 20(6): 533554.Coats, K.H, 1983. Some observations on field-scale simulation of the in-situ combustion process,
SPE12247, presented at the SPE Reservoir Simulation Symposium. Society of Petroleum Engi-neers.
Eclipse, 2009. Eclipse Version 2009 Software Manual, Schulumberger Ltd.Fassihi, M. R., 1981. Analysis of Fuel Oxidation in In-Situ Combustion Oil Recovery, PhD thesis,
Stanford University, http://pangea.stanford.edu/ERE/research/ERE-theses.html.Fassihi, . M. R., Brigham, W., and Ramey, H. J., 1984. Reaction Kinetics of In-Situ Combustion:
Part 2- Modeling, in Secondary Recovery of Oil in the United States, Principles and Practice,SPEJ, 9454, PA.
Flynn, J. H. and Wall, L. A., 1966. A Quick Direct Method for the Determination of ActivationEnergy from Thermogravimetric Data, Polym. Lett., 4, 323.
Friedman, H., L., 1964. Kinetics of Thermal Degradation, Journal of Polymer Science: Part C, No6: 183-195.
C.F. Gates and H.J. Ramey, 1980. A method for engineering in-situ combustion oil recoveryprojects, Journal of Petroleum Technology, 32(2):285294.
Glatz G.,Hascakir B., Castanier L.M., Clemens T., Kovscek A.R., 2011. Kinetic Cell and Combus-tion Tube Results for a Central European Crude Oil, SPE 146089, presented at the SPE AnnualTechnical Conference and Exhibition held in Denver, Colorado, USA, 30 October - 2 November
Gutierrez, D., Skoreyko, F., Moore, R.G., Mehta, S.A., and Ursenbach, M.G. The challenge of pre-dicting field performance of air injection projects based on laboratory and numerical modelling,Journal of Canadian Petroleum Technology, 48(4):2333.
Hascakir, B., Castanier, L. M., and Kovscek, A. R., 2011. In-Situ Combustion Dynamics VisualizedWith X-Ray Computed Tomography, SPE Journal, 16(3) 524-536.
Kissinger, H. E., 1957. Reaction Kinetics in Differential Thermal Analysis, Anal. Chem., 29(11),1702-1706.
Kristensen, M.R., Gerritsen, M.G., Thomsen, P.G., Michelsen, M.L., and Stenby, E.H., 2007. Effi-cient Integration of Stiff Kinetics With Phase Change Detection for Reactive Processes, Transportin Porous Media, 609 383-409.
Kristensen M.R., 2008. Development of Models and Algorithms for the Study of Reactive PorousMedia Processes, Ph.D. thesis, Technical University of Denmark.
Lapene, A., Debenest, G., Quintard, M., Castanier, L. M., Gerritsen, M. G., and Kovscek, A. R.,2011. Kinetics Oxidation of Heavy Oil - Part 1: A Compositional and Full Equation of StateModel, Submitted to Energy & Fuels.
Lapene, A., Debenest, G., Quintard, M., Castanier, L. M., Gerritsen, M. G., and Kovscek, A. R.,2011. Kinetics Oxidation of Heavy Oil - Part 2: Optimization by a Multi-Objective GeneticAlgorithm, to be Submitted.
Lapene, A., Nichita, D., Debenest, G., and Quintard, 2010. Three-Phase Free-Water Flash Calcu-lation using a New Modified Rachford-Ric Equation, Fluid Phase Equilibria 297(1) 121-128.
Lin, C. Y., Chen, W. H., Lee, S. T., and Culham, W. E., 1984. Numerical Simulation of CombustionTube Experiments and the Associated Kinetics of In-Situ Combustion Processes, SPEJ 657-666,
18 A. R. KOVSCEK, L.M. CASTANIER, AND M. G. GERRITSEN
Volume 24, Number 6.Marjerrison D. and Fassihi M., 1992. A Procedure for Scaling Heavy-Oil Combustion Tube Results
to a Field Model, SPE24175, presented at the SPE/DOE Enhanced Oil Recovery Symposium,Society of Petroleum Engineers.
Mamora, D. D., 1993. Kinetics of In-Situ Combustion, PhD thesis, Stanford University,http://pangea.stanford.edu/ERE/research/ERE-theses.html.
Moore, R. G., Ursenbach, M. G., Laureshen, C. J., and Mehta, S.A., 1997. Observation and DesignConsiderations for In-Situ Combustion, SPE, 97-100.
Ozawa, T., 1965. A new method of Analyzing Thermogravimetric Data, Bull. Chem. Soc. Japan,Vol. 38, Pages: 1881-1886.
Peng, D. Y., and Robinson, D. B., 1976 A new two parameters equation of state,Ind.Eng.Chem.Fundem, 15, 59-64.
Prats, M., 1982. Thermal Recovery, Society of Petroleum Engineers Monograph 7.Prautniz, J., Lichtenthaler, R., and Azevedo, E., 1964 Molecular Theory of Gases and Liquids ,
Wiley.Sarathi, P. S., 1999. In-Situ Combustion Handbook , Principles and Practices, National Petroleum
Technology Office,U.S. Department of Energy, Tulsa.STARS, 2009. STARS Version 2009 Users Guide, Computer Modeling Group Ltd., Calgary, Canada.Vyazovkin, S., 1997. Evaluation of Activation Energy of Thermally Simulated Solid-State Reactions
under Arbitrary Variation of Temperature, Journal of Computational Chemistry, Vol. 18 No 3,393-402.
Vyazovkin, S., 2001. Modification of the Isoconversional Method to Account for Variation in theActivation Energy, Journal of Computational Chemistry, Vol. 22 No 2, 178-183.
Zhu, Z., Bazargan, M., Lapene, A., Kovscek, A. R., Gerritsen, M. G., and Castanier, L. M., 2011.Upscaling for Field-scale In-situ Combustion Simulation, Western regional meeting conference,SPE 144554.
Zhu, Z., 2011. Efficient Simulation of Thermal Enhanced Oil Recovery Processes, PhD Thesis,Stanford University. http://pangea.stanford.edu/ERE/research/ERE-theses.html.
Energy Resources Engineering, 365 Panama St room 065, Stanford, CA 94305 USAE-mail address: [email protected]


![Combustion and Flame - Home - Alexei A. Mailybaevalexei.impa.br/data/_uploaded/file/papers/2016... · [3], downward buoyant filtration combustion [4] and the advance of in-situ combustion](https://img.pdfslide.net/doc/110x75/5e910c64098c6923ea742fd8/combustion-and-flame-home-alexei-a-3-downward-buoyant-iltration-combustion.jpg)