Embed Size (px)
Citation preview

1
Improved Representation of Investment Decisions in Assessments of CO2 Mitigation
Gokul C. Iyer, Leon E. Clarke, James A. Edmonds, Brian P. Flannery, Nathan E.
Hultman, Haewon C. McJeon, David G. Victor
Contents Supplementary Text ........................................................................................................................ 1
1 Background ............................................................................................................................. 1
1.1 Factors affecting investment ............................................................................................ 1
1.2 Special case: Investment in China .................................................................................... 4
2 The cost of capital ................................................................................................................... 5
3 Implications of the logit technology choice formulation ........................................................ 6
4 Sensitivity analyses ................................................................................................................. 7
4.1 Sensitivity of results to global emissions target ............................................................... 8
4.2 Sensitivity of results to FCR assumptions ....................................................................... 8
4.3 High investment risks for fossil-fuel technologies ........................................................... 9
Supplementary Figures ................................................................................................................. 11
Supplementary Tables ................................................................................................................... 33
References ..................................................................................................................................... 38
Supplementary Text
1 Background
1.1 Factors affecting investment Many factors can affect patterns of investment. The vast literature on institutional economics
discusses the impact of institutional quality on investment and economy-wide capital formation.
Institutions are the formal and informal rules that constrain individual behavior and shape human
interaction. Institutions are devised to create order and reduce uncertainty in exchange. A solid
institutional framework is necessary to encourage investment. Investors will be reluctant to risk
Improved representation of investment decisions in assessments of CO2 mitigation
SUPPLEMENTARY INFORMATIONDOI: 10.1038/NCLIMATE2553
NATURE CLIMATE CHANGE | www.nature.com/natureclimatechange 1© 2015 Macmillan Publishers Limited. All rights reserved.
2
their capital when property rights are weak and poorly protected, and if, as a result, they fear that
their returns may be appropriated by others.1 Empirical studies on the link between institutions
and investment have confirmed this theory. For example, Acemoglu and Zilibotti 2 showed that
in developing countries that lack large and efficient financial markets, investors tend to invest in
safer projects with lower return because the presence of indivisible projects limits the degree of
risk diversification. Not only does this slow down capital accumulation, but the inability to
diversify idiosyncratic risk also introduces a large amount of uncertainty in the overall economic
growth process. Empirical research also shows that institutional quality affects foreign direct
investment (FDI). Investors considering FDI may be particularly concerned about the likely
exposure to requests for bribes and the need to work through red-tape in host countries.3 In a
related strand of research, scholars have emphasized the importance of protection of investors’
rights in affecting investment. For example, La Porta, Lopez-de-Silanes 4 used a sample of 49
countries and showed that countries with poorer protection of investor rights (that include not
only the rights written into the laws and regulations but also the effectiveness of their
enforcement) have unsophisticated debt and equity markets. Similarly, Clague, Keefer 5 showed
that investment is adversely affected in countries that lack adequate third-party contract
enforcement. Finally, credibility and effectiveness of regulations and hence their ability to
facilitate private investment vary with a country’s institutions.6 For example, the government has
incentives to change taxes or regulations ex-post with the knowledge that investors cannot easily
withdraw.7 Therefore, investors can delay or forego investment, especially if they are large and
irreversible.
Idiosyncrasies related to specific sectors could influence returns to capital in such sectors thereby
affecting investment. The electricity sector is one example of a sector that is expected to require
large investments in the future, particularly in the context of climate change mitigation, and
therefore presents a useful case to investigate. Traditionally, due to network effects and
economies of scale that create high barriers to entry, the electricity sector had remained a natural
monopoly. In the last few decades, however, the electricity sector has undergone reforms all over
the world, leading in some cases, to unbundling of generation from transmission and distribution
which gives scope for competition and private investment in the sector. Nevertheless, because
outputs from this sector are consumed widely by households and industry, politicians, consumers
and interest groups are sensitive to the level of pricing.8, 9
Therefore, governments have
© 2015 Macmillan Publishers Limited. All rights reserved.
3
incentives to behave opportunistically with the investing company. Expropriation of sunk assets
may be profitable for a government if the direct costs (such as loss of reputation or reduced
investment in the future) are small compared to the short-term benefits of such action (such as
achieving re-election by reducing electricity prices for consumers or by attacking the monopoly),
and if the indirect institutional costs (such as disregard of the judiciary or not following the
proper administrative procedures) are not too large.9 This discourages investors by creating
additional risks. For example, using a sample of thirty-four independent power projects in
thirteen countries, Woodhouse 10
showed that regulatory credibility in host countries is
important for risk-averse investors because of the fear that unpredictable changes in regulations
will lead to expropriation of fixed assets. Note that investment patterns in other sectors may be
quite different than for the electricity sector. For example, at the geographical scale used in most
IAMs, investments in power production are likely to be domestic; that may not be the case in the
transportation sector where fuels and vehicles may be imported rather than produced
domestically. Similarly, investments in some sectors may primarily be self-financed by firms
rather than through commercial or development institutions.
Regulatory and policy uncertainty could affect investment in particular technologies. Currently
non-commercial and politically challenged technologies are subject to regulatory challenges (e.g.
safety, proliferation and environmental regulations for nuclear power plants and uncertainty
regarding safety and permanence of CO2 storage for CCS) that could add to risks through
construction delays and interruption or foreclosure of future operations.11
Likewise, scholars
have argued that volatility and uncertainty in carbon price will increase risks and delay
investments in low-carbon technologies.12-14
Newer technologies face a special investment
challenge – because investors are unaware about the performance of new technologies, they will
expect higher rates of return.15
Technologies whose cost structures are fuel-intensive face the
increased risk of exposure to market uncertainties.16
Technologies in the electricity sector face an
additional risk as wholesale electricity prices are volatile due to the homogenous nature of
electricity, its lack of storability, inelastic demand and the steepness of the supply curve as
electricity production nears system capacity.17, 18
Likewise, uncertainty in the price of
commodities and other inputs adds to investment risks. Further, increased penetration of
intermittent technologies such as wind may affect investment in other technologies. For example,
in a market with high penetration of wind which is typically characterized by long periods of low
© 2015 Macmillan Publishers Limited. All rights reserved.
4
prices and short periods of high wholesale prices, investments in other low carbon technologies
such as nuclear will be adversely affected because of its high capital costs and relative
inflexibility.19
Other factors affecting investment at the technology level include unplanned plant
closure, for example, due to unavailability of resources, plant damage or component failure, risk
of a fall in volume of electricity produced due to lack of wind or sunshine, etc. Such factors
affect investments in technologies differently and may lead to a re-ordering of the relative
attractiveness of the various investment options.
Finally, factors at the level of the firm such as ownership structure and size also affect
investment.20
For a public utility, money can be borrowed at relatively low rates because the risk
of default is low. On the other hand, the cost of money would be much higher for a private utility
which is exposed to the uncertainties of the market. This is closely tied with the type of financing
used by the firm. Corporate financing uses corporate credit and general assets of a corporation,
typically a utility, as the basis for credit and collateral. This is less risky compared to project
financing (typically used by independent power producers) in which lenders base credit
appraisals on the estimated cash flows from the facility rather than on the assets or credit of the
corporation.21
Apart from the above factors, several others at the level of the individual such as
information asymmetry between lenders and borrowers and principal-agent problems could
affect investment, especially in the demand-side of the energy sector.22, 23
In this paper, we focus
only on the supply side in the electricity generation sector; a detailed examination of factors in
the demand-side is beyond our scope.
Due to the factors reviewed above, investments may not take place at the socially optimal level.
However, under certain circumstances, investment risks can be mitigated and investment
encouraged. In the following subsection, we consider the case of China, in which investment in
energy is low-risk due to a combination of factors including favorable policy environment and
state-capitalism.
1.2 Special case: Investment in China
Among developing economies, China currently accounts for the largest share of investment
across all major technologies in the electricity sector. For example, in the year 2013, Chinese
investment in renewable energy was the highest, more than even the whole of Europe.24
China
accounts for more than a third of all proposed coal plants and more than a third of all proposed
© 2015 Macmillan Publishers Limited. All rights reserved.
5
nuclear power plants worldwide.25
From the perspective of an investor, investing in the Chinese
electricity sector is relatively low-risk because Chinese electricity demand will continue to grow
and any investment in the electricity sector will provide attractive returns. In addition, China’s
12th Five Year Plan lays emphasis on renewable energy and energy efficiency. This gives clear
signal that investment in these areas will be encouraged.26
Also, policies such subsidies, feed-in-
tariffs and income tax incentives encourage investment.27, 28
Most importantly, China’s system of
“state capitalism” that tries to juxtapose the powers of the state with the powers of capitalism,
allows for a different character of large-scale energy investment that bolsters capital-intensive
technologies and projects with higher market risks. First, the Chinese energy sector is dominated
by state-owned enterprises that are often able to manage risks by shifting them to the
government. Second, financing from Chinese “policy banks” such as the Chinese Development
Bank that finance the construction of new power plants including emerging technologies such as
solar through extremely low interest rates reduces financial risks considerably. In addition, state
support usually limits delays associated with acquiring rights of way or essential permits. Note,
however, that such advantages may not be unique to China, and they often arise when state-
backed firms raise debt; for example, Mexico’s Pemex.27
China is an interesting case because of
the large size of the market in addition to the above characteristics.
The factors reviewed here create nonuniformities in investment risks across regions, sectors and
technologies. Such nonuniformities will have important implications for the large-scale
investments in the energy system required to address the climate change problem because
investors could respond to them by expecting higher returns to invest in a risky project; delaying
or forgoing the investment or investing in existing, familiar technologies.
2 The cost of capital
In this section, we explain the different terms and concepts surrounding the cost of capital.
Typically, firms use a combination of debt and equity to finance their businesses. The cost of
debt is “the amount paid to the holders of debt securities for the use of their money”. 21
The
amount paid, which is the lending interest rate is set by banks. Since the interest is tax-
deductible, the cost of debt is usually calculated on an after-tax basis. The cost of equity refers to
the “the earnings expected by an investor when purchasing equity shares in a company”. 21
Note
that equity is a riskier form of financing compared to debt and so the cost of equity is greater
© 2015 Macmillan Publishers Limited. All rights reserved.
6
than the cost of debt. The expected return on any investment can be written as the sum of the
risk-free rate and a premium to compensate for the risk (the risk-free rate represents the time
value of money and compensates investors for placing money in any investment over a period of
time). The equity risk premium, thus refers to the premium added to the risk-free rate to estimate
the cost of equity. The overall cost of capital is derived from a weighted average of all capital
sources, widely known as the weighted average cost of capital (WACC). The WACC is used as
the discount rate, which reflects the fact that the value of a cash flow depends on the time in
which the flow occurs.
Finally, the Fixed Charge rate (FCR) represents “the before-tax revenue that a profit-maximizing
firm would require annually to cover its cost and carrying charges of an investment and to
achieve its desired after-tax return. Carrying charges include return on debt and equity, income
and property tax, book depreciation, and insurance.” The FCR is a function of the discount rate
and the lifetime of the capital investment and is given by the following expression: 𝐹𝐶𝑅 =
𝐷𝑖𝑠𝑐𝑜𝑢𝑛𝑡 𝑟𝑎𝑡𝑒
1−(1
1+𝐷𝑖𝑠𝑐𝑜𝑢𝑛𝑡 𝑟𝑎𝑡𝑒)𝑙𝑖𝑓𝑒𝑡𝑖𝑚𝑒
× 1−(𝑇 ∗ 𝑃𝑉𝑑𝑒𝑝𝑟𝑒𝑐𝑖𝑎𝑡𝑖𝑜𝑛)
1−𝑇, where T is the marginal income tax rate,
PVDepreciation is the present value of depreciation and lifetime refers to the lifetime of the capital
investment.21
3 Implications of the logit technology choice formulation
As explained in the Methods section, investment in GCAM depends on relative costs and the
distribution among technologies determined using a logit-choice formulation.29-31
The logit
technology choice representation assigns some market share to expensive technologies, which
allows the model to avoid an unrealistic “winner take all” responses based on the notion that
choices are based on other factors besides observed prices or that single observed prices do not
represent the full variation in prices across applications. The logit method is well documented in
the literature (see for example, 29-31
). In this paper, we investigate the impacts of nonuniform
investment risks across technologies and regions on costs and geography of climate change
mitigation. Specific to the present analysis, the logit technology choice formulation has the
following implication in the baseline as well as climate policy scenarios. Under nonuniform
investment risks, higher investment risks for low-carbon technologies (which are assigned higher
costs of capital) raise the costs of electricity generation from them. In spite of higher generation
© 2015 Macmillan Publishers Limited. All rights reserved.
7
costs, low-carbon technologies get deployed, raising electricity prices. This in turn reduces
demand for electricity, reducing overall investment in the electricity generation sector (Figure 2
A to D in the Main Text).
Note that that nonuniform investment risk is one factor among several others that affect
investment. As with other formulations of technology choice (e.g., linear optimization or
production function approaches), the logit representation assumes that investments in
technologies depend on relative costs. The logit approach does also, in theory, account for non-
modeled factors in the parameters of the logit function. However, even if these factors can
ostensibly be captured in the logit parameters, this representation does not provide a clear
structural representation of key social, behavioral and institutional factors that can affect future
investment (see for example, Iyer, Hultman 32
and Hultman, Malone 33
for a review of such
factors). Note that this limitation is equally applicable to all choice methods that are
fundamentally focused on explicit market costs. In this sense, the logit is no more limited or less
appropriate than these other methods. For example, in the case of nuclear energy, there are a
number of challenges to deployment apart from unfavorable economics such as public
perceptions, waste management and proliferation which affect investments in developed as well
as developing countries (see for example, Iyer, Hultman 34
for a review of challenges to
expansion of nuclear energy). One attempt to capture such “non-economic” factors is the study
by Iyer, Hultman 32
—a study that represents the diffusion of low-carbon technologies in a
nuanced manner by specifying a range of growth rates for low-carbon technology deployments
under the assumption that investments in low-carbon technologies may be constrained due to
several factors other than relative costs. Those are important issues, but the focus of the current
analysis is different—it aims to demonstrate improved modeling of one factor, namely
investment risks in IAMs.
4 Sensitivity analyses
Our analysis leads to two key findings. First, under nonuniform investment risks, global costs of
achieving a climate target are higher compared with a world with uniform investment risks
(Figure 3 in Main Text and Supplementary Figure 4). Second, most of the increased costs are
borne by regions with superior institutions (Figure 4 in Main Text and Supplementary Figures
8,10,11). In order to validate the consistency of our findings, we conduct a sensitivity analysis on
© 2015 Macmillan Publishers Limited. All rights reserved.
8
our assumptions. For this purpose, we focus on the following variables: i.) the global emissions
target ii.) assumptions about fixed charge rates (FCRs for low-risk technologies and risk
premium for high-risk technologies) and iii.) technologies considered high-risk. Finally, we also
consider a scenario in which investment risks are higher for fossil-fuel technologies compared to
low-carbon technologies. For the sake of presentation of results of the sensitivity analyses, we
focus on two metrics that summarize our key findings, namely, changes in global carbon prices
and regional mitigation costs under variation of investment risks across technologies and regions
relative to uniform investment risks scenarios.
4.1 Sensitivity of results to global emissions target
In the Main Text of the article, we specified a 50% reduction in 2050 global CO2 emissions from
fossil fuels and industry relative to 2005 levels. For the purpose of sensitivity analysis, we
specify 25% and 75% reductions. Global carbon prices and mitigation costs under the 25% and
75% targets are lower and higher respectively, compared to the 50% target (Supplementary
Figures 15 and 16). Nevertheless, under all global emissions targets, global carbon prices are
higher under nonuniform investment risks and increases in regional mitigation costs are higher
for regions with superior institutions.
4.2 Sensitivity of results to FCR assumptions
The findings of this study hinge on assumptions about technology costs and fixed charge rates
(FCRs). Previous studies have evaluated sensitivity to technology cost assumptions in the
GCAM model.35, 36
We focus this sensitivity analysis on assumptions regarding FCRs. The main
analysis of this study assumes an FCR of 13% for low-risk technologies and 17% for high-risk
technologies based on a survey of FCRs used for financial analyses in the US (Supplementary
Table 1). Uncertainties in the FCRs obtained for USA can arise due to a number of reasons
including assumptions about equity/debt shares, discount rates, lifespan of investments, tax rates
and depreciation schedules. For the sake of sensitivity analyses, we change the FCR assumptions
for low-risk technologies and the risk premium for high-risk technologies (Supplementary Table
4). Our results indicate that the changes in global and regional mitigation costs under
nonuniform investment risks relative to the uniform investment risks scenarios are more sensitive
to assumptions about the risk premium compared to assumptions about the FCR for low-risk
technologies (Supplementary Figures 17 and 18). For example, the spread in changes in 2050
© 2015 Macmillan Publishers Limited. All rights reserved.
9
global carbon prices under variation of investment risks with technologies and regions relative to
the uniform investment risks scenarios when the FCR for low-risk technologies are varied
between 10% and 16% is small (changes in carbon prices across sensitivity cases are 21%-22). In
contrast, when the risk premium for high-risk technologies is varied between 2% and 6%, the
spread in changes in carbon prices is greater (changes in carbon prices across sensitivity cases
are 15%-28%). This is because, investments in GCAM depend on relative economics of
technologies. Hence, the risk premium for high-risk technologies has a greater influence on the
competitive advantage of such technologies relative to low-risk technologies compared to the
FCR for low-risk technologies. Consequently, the risk premium has a greater influence on the
deployments of low-carbon technologies (which are high-risk) and hence on marginal abatement
costs and carbon prices. Nevertheless, in spite of changes in the magnitudes of the impacts on
carbon prices and regional mitigation costs, the two key findings of our analysis are consistent
across various assumptions about FCRs.
4.3 High investment risks for fossil-fuel technologies
In the investment risk scenarios considered in this study, we specified higher investment risks for
low-carbon technologies and lower investment risks for fossil-fuel technologies. Here, we
consider a scenario in which investment risks are higher for fossil-fuel technologies compared to
low-carbon technologies. Such a scenario is conceivable in a carbon-constrained world in which
a sustained and increasing price on carbon could make investments in fossil-fuel rather than low-
carbon technologies more risky. Governments might adopt policies that favor low-carbon
technologies—as many governments have done already—precisely with the ambition of making
investors view these technologies as less risky. The effect of higher investment risks for fossil-
fuel technologies is to reduce carbon prices relative to the uniform investment risks scenario
(Supplementary Figure 19). This is because, higher investment risks for fossil-fuel technologies
increase the costs of electricity generation from such technologies and improve the competitive
advantage of low-carbon technologies, thus decreasing marginal abatement costs. The effect is,
however, small compared to the increase in carbon prices due to higher investment risks for low-
carbon technologies. For example, the global carbon price in 2050 under higher investment risks
for low-carbon technologies along with variation across regions to achieve a 50% emissions
target is 22% higher compared with the uniform investment risks scenario. In contrast, the
carbon price under higher investment risks for fossil-fuel technologies along with variation
© 2015 Macmillan Publishers Limited. All rights reserved.

10
across regions is lower by only 3%. This is because, fossil-fuel technologies are less capital-
intensive compared to low-carbon technologies. Hence, a risk premium on fossil-fuel
technologies will have a smaller impact on marginal abatement cost curves compared with the
same risk premium on low-carbon technologies, even if the directions of the impacts will be
opposite.
© 2015 Macmillan Publishers Limited. All rights reserved.
11
Supplementary Figures
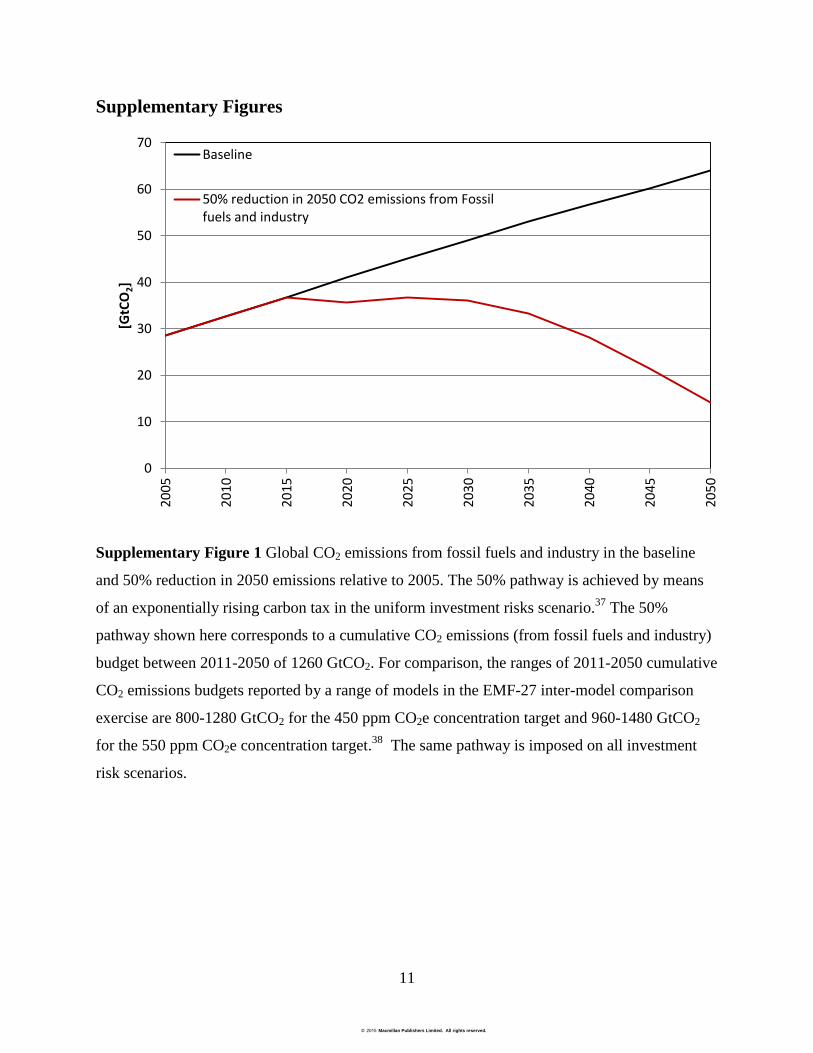
Supplementary Figure 1 Global CO2 emissions from fossil fuels and industry in the baseline
and 50% reduction in 2050 emissions relative to 2005. The 50% pathway is achieved by means
of an exponentially rising carbon tax in the uniform investment risks scenario.37
The 50%
pathway shown here corresponds to a cumulative CO2 emissions (from fossil fuels and industry)
budget between 2011-2050 of 1260 GtCO2. For comparison, the ranges of 2011-2050 cumulative
CO2 emissions budgets reported by a range of models in the EMF-27 inter-model comparison
exercise are 800-1280 GtCO2 for the 450 ppm CO2e concentration target and 960-1480 GtCO2
for the 550 ppm CO2e concentration target.38
The same pathway is imposed on all investment
risk scenarios.
0
10
20
30
40
50
60
7020
05
2010
2015
2020
2025
2030
2035
2040
2045
2050
[GtC
O2]
Baseline
50% reduction in 2050 CO2 emissions from Fossilfuels and industry
© 2015 Macmillan Publishers Limited. All rights reserved.
12
INVESMENT IN ELECTRICITY GENERATION BY TECHNOLOGY IN THE BASELINE CASES
(billion 2012 USD per year)
CHANGES WITH RESPECT TO UNIFORM INVESTMENT RISKS SCENARIO
UNIFORM INVESTMENT
RISKS
TECHNOLOGY
INVESTMENT RISKS
INSTITUTIONAL
INVESTMENT RISKS
TECHNOLOGY &
INSTITUTIONAL RISKS
IND
IA
CA
NA
DA
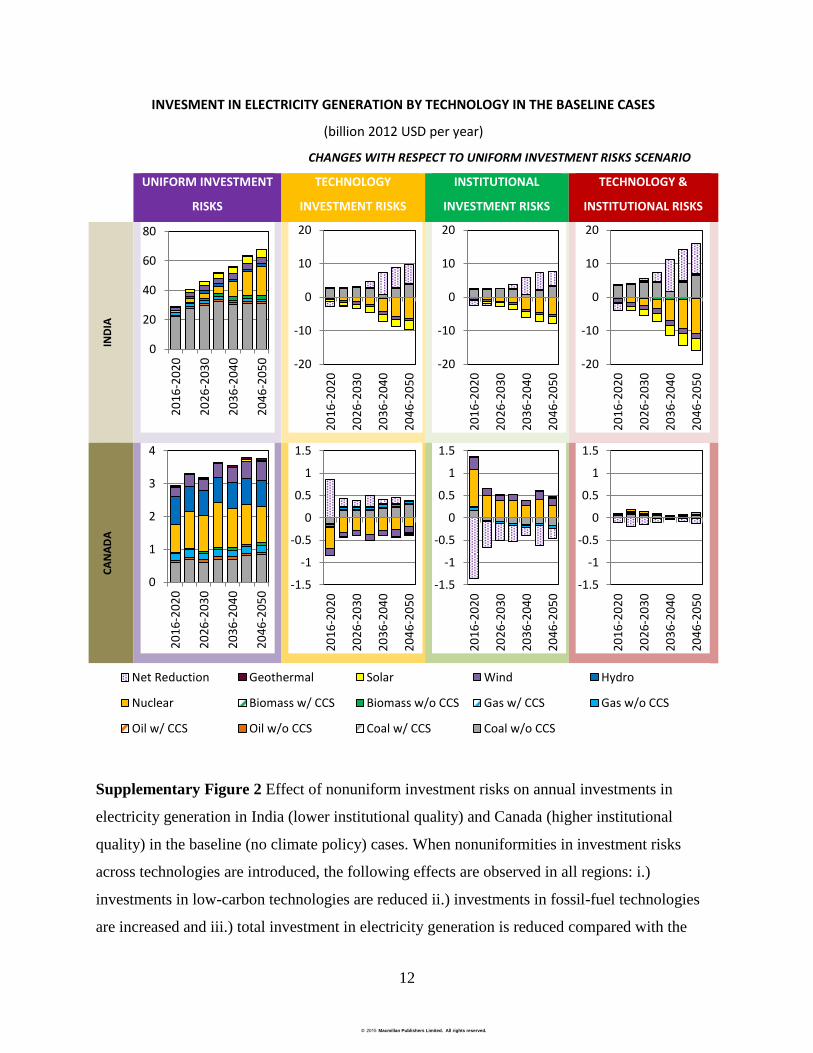
Supplementary Figure 2 Effect of nonuniform investment risks on annual investments in
electricity generation in India (lower institutional quality) and Canada (higher institutional
quality) in the baseline (no climate policy) cases. When nonuniformities in investment risks
across technologies are introduced, the following effects are observed in all regions: i.)
investments in low-carbon technologies are reduced ii.) investments in fossil-fuel technologies
are increased and iii.) total investment in electricity generation is reduced compared with the
0
20
40
60
80
2016
-202
0
2026
-203
0
2036
-204
0
2046
-205
0 -20
-10
0
10
20
2016
-202
0
2026
-203
0
2036
-204
0
2046
-205
0
-20
-10
0
10
20
2016
-202
0
2026
-203
0
2036
-204
0
2046
-205
0
-20
-10
0
10
20
2016
-202
0
2026
-203
0
2036
-204
0
2046
-205
0
0
1
2
3
4
2016
-202
0
2026
-203
0
2036
-204
0
2046
-205
0
-1.5
-1
-0.5
0
0.5
1
1.5
2016
-202
0
2026
-203
0
2036
-204
0
2046
-205
0
-1.5
-1
-0.5
0
0.5
1
1.5
2016
-202
0
2026
-203
0
2036
-204
0
2046
-205
0
-1.5
-1
-0.5
0
0.5
1
1.5
2016
-202
0
2026
-203
0
2036
-204
0
2046
-205
0Net Reduction Geothermal Solar Wind Hydro
Nuclear Biomass w/ CCS Biomass w/o CCS Gas w/ CCS Gas w/o CCS
Oil w/ CCS Oil w/o CCS Coal w/ CCS Coal w/o CCS
© 2015 Macmillan Publishers Limited. All rights reserved.
13
uniform investment risks scenario (see main text for details). When nonuniformities in
institutional qualities are introduced, the above effects are seen in regions with inferior
institutions such as India, where investing in low-carbon technologies is more risky. On the other
hand, in regions with superior institutions such as Canada, where investment risks for investing
in low-carbon technologies may be lower than fossil-fuel technologies, investments in low-
carbon technologies increase and those in fossil-fuel technologies decrease, with a net increase in
investments in electricity generation. The combined effect of nonuniformities across
technologies and regions is to reduce investments in India and increase investments in Canada.
The combined effect on the global level, however, is a decrease in investments in low-carbon
technologies because most of the investments occur in developing regions such as India and
China which have relatively inferior institutional qualities (see Figure 2D in the main text).
© 2015 Macmillan Publishers Limited. All rights reserved.
14
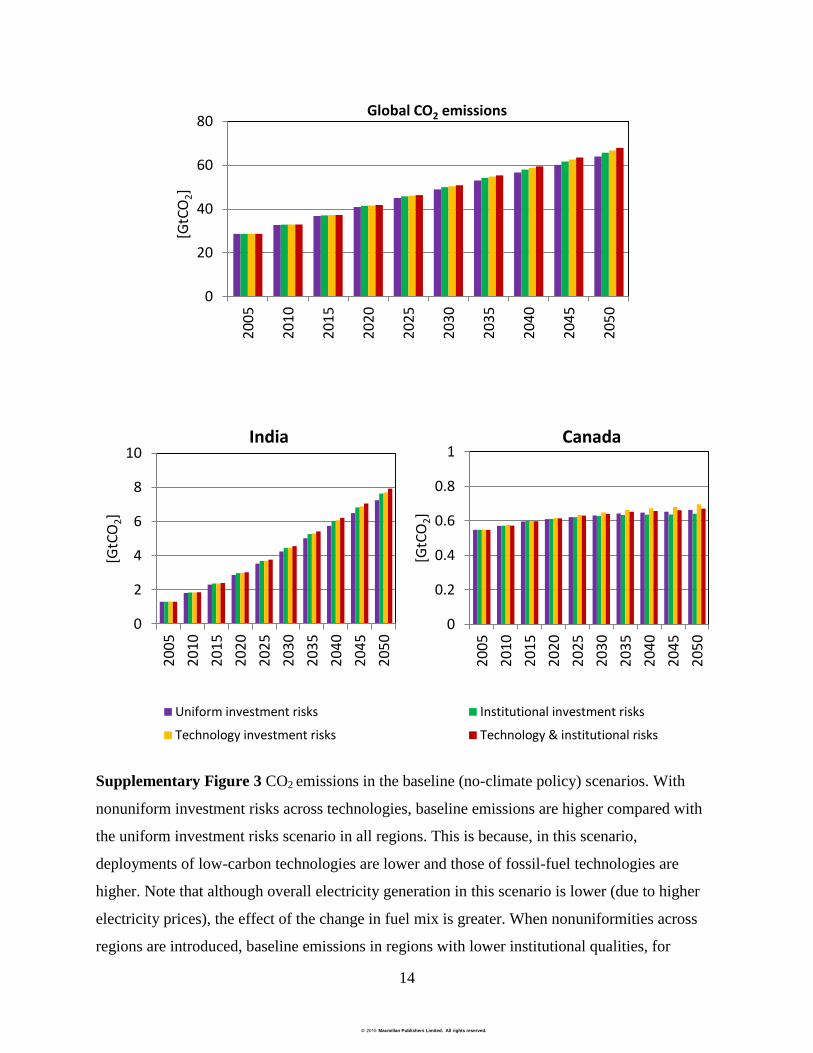
Supplementary Figure 3 CO2 emissions in the baseline (no-climate policy) scenarios. With
nonuniform investment risks across technologies, baseline emissions are higher compared with
the uniform investment risks scenario in all regions. This is because, in this scenario,
deployments of low-carbon technologies are lower and those of fossil-fuel technologies are
higher. Note that although overall electricity generation in this scenario is lower (due to higher
electricity prices), the effect of the change in fuel mix is greater. When nonuniformities across
regions are introduced, baseline emissions in regions with lower institutional qualities, for
0
20
40
60
80
2005
2010
2015
2020
2025
2030
2035
2040
2045
2050
[GtC
O2]
Global CO2 emissions
0
2
4
6
8
10
2005
2010
2015
2020
2025
2030
2035
2040
2045
2050
[GtC
O2]
India
0
0.2
0.4
0.6
0.8
1
2005
2010
2015
2020
2025
2030
2035
2040
2045
2050
[GtC
O2]
Canada
Uniform investment risks Institutional investment risks
Technology investment risks Technology & institutional risks
© 2015 Macmillan Publishers Limited. All rights reserved.

15
example, India are higher due to the effects described above. On the other hand, baseline
emissions in regions with higher institutional qualities, for example, Canada, are lower. This is
because, in these regions, deployments of low-carbon technologies increase and those of fossil-
fuel technologies decrease (see Supplementary Figure 2). The combined effect of
nonuniformities across technologies and regions is to increase baseline emissions in regions with
inferior institutions and decrease them in regions with superior institutions. On the global level,
the combined effect is an increase in baseline emissions as most of the emissions come from
developing regions such as India and China with lower institutional qualities.
© 2015 Macmillan Publishers Limited. All rights reserved.
16
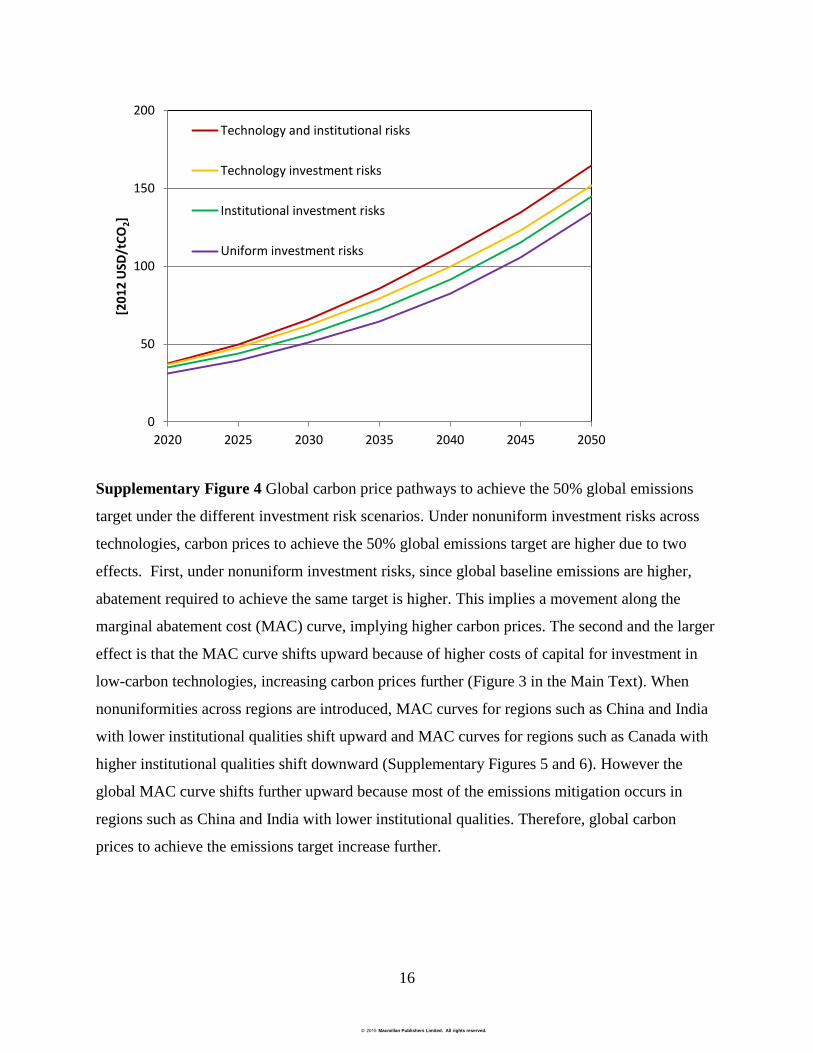
Supplementary Figure 4 Global carbon price pathways to achieve the 50% global emissions
target under the different investment risk scenarios. Under nonuniform investment risks across
technologies, carbon prices to achieve the 50% global emissions target are higher due to two
effects. First, under nonuniform investment risks, since global baseline emissions are higher,
abatement required to achieve the same target is higher. This implies a movement along the
marginal abatement cost (MAC) curve, implying higher carbon prices. The second and the larger
effect is that the MAC curve shifts upward because of higher costs of capital for investment in
low-carbon technologies, increasing carbon prices further (Figure 3 in the Main Text). When
nonuniformities across regions are introduced, MAC curves for regions such as China and India
with lower institutional qualities shift upward and MAC curves for regions such as Canada with
higher institutional qualities shift downward (Supplementary Figures 5 and 6). However the
global MAC curve shifts further upward because most of the emissions mitigation occurs in
regions such as China and India with lower institutional qualities. Therefore, global carbon
prices to achieve the emissions target increase further.
0
50
100
150
200
2020 2025 2030 2035 2040 2045 2050
[20
12
USD
/tC
O2]
Technology and institutional risks
Technology investment risks
Institutional investment risks
Uniform investment risks
© 2015 Macmillan Publishers Limited. All rights reserved.
17
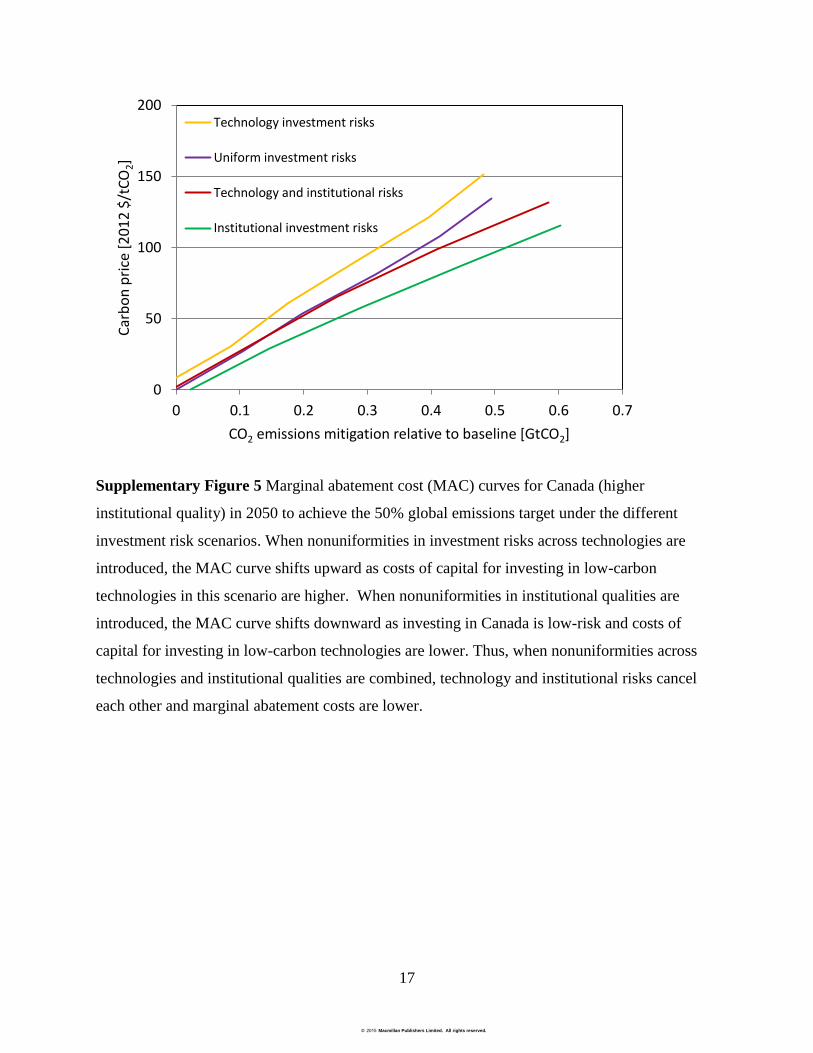
Supplementary Figure 5 Marginal abatement cost (MAC) curves for Canada (higher
institutional quality) in 2050 to achieve the 50% global emissions target under the different
investment risk scenarios. When nonuniformities in investment risks across technologies are
introduced, the MAC curve shifts upward as costs of capital for investing in low-carbon
technologies in this scenario are higher. When nonuniformities in institutional qualities are
introduced, the MAC curve shifts downward as investing in Canada is low-risk and costs of
capital for investing in low-carbon technologies are lower. Thus, when nonuniformities across
technologies and institutional qualities are combined, technology and institutional risks cancel
each other and marginal abatement costs are lower.
0
50
100
150
200
0 0.1 0.2 0.3 0.4 0.5 0.6 0.7
Carb
on p
rice
[201
2 $/
tCO
2]
CO2 emissions mitigation relative to baseline [GtCO2]
Technology investment risks
Uniform investment risks
Technology and institutional risks
Institutional investment risks
© 2015 Macmillan Publishers Limited. All rights reserved.
18
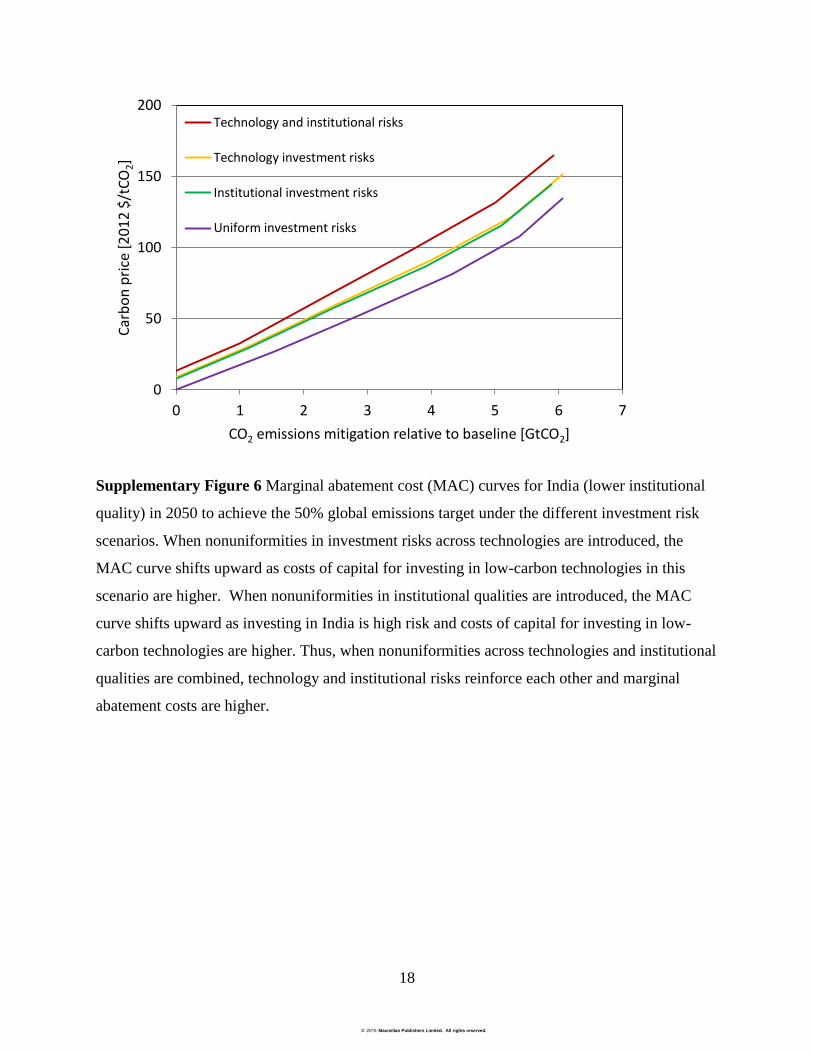
Supplementary Figure 6 Marginal abatement cost (MAC) curves for India (lower institutional
quality) in 2050 to achieve the 50% global emissions target under the different investment risk
scenarios. When nonuniformities in investment risks across technologies are introduced, the
MAC curve shifts upward as costs of capital for investing in low-carbon technologies in this
scenario are higher. When nonuniformities in institutional qualities are introduced, the MAC
curve shifts upward as investing in India is high risk and costs of capital for investing in low-
carbon technologies are higher. Thus, when nonuniformities across technologies and institutional
qualities are combined, technology and institutional risks reinforce each other and marginal
abatement costs are higher.
0
50
100
150
200
0 1 2 3 4 5 6 7
Carb
on p
rice
[201
2 $/
tCO
2]
CO2 emissions mitigation relative to baseline [GtCO2]
Technology and institutional risks
Technology investment risks
Institutional investment risks
Uniform investment risks
© 2015 Macmillan Publishers Limited. All rights reserved.
19
GLOBAL FINAL ENERGY CONSUMPTION
(EJ)
CHANGES WITH RESPECT TO UNIFORM INVESTMENT RISKS SCENARIO
UNIFORM INVESTMENT
RISKS
TECHNOLOGY
INVESTMENT RISKS
INSTITUTIONAL
INVESTMENT RISKS
TECHNOLOGY &
INSTITUTIONAL RISKS
50
% R
EDU
CTI
ON
IN 2
05
0 G
LOB
AL
CO
2
EMIS
SIO
NS
REL
ATI
VE
TO 2
00
5
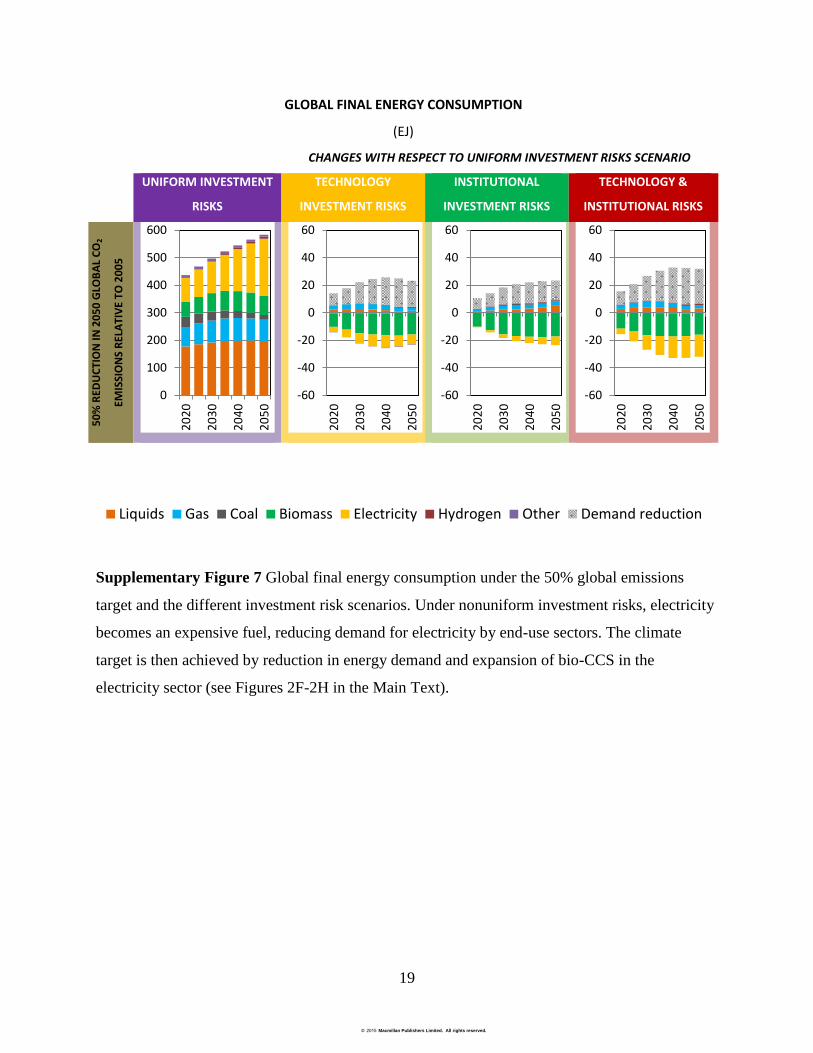
Supplementary Figure 7 Global final energy consumption under the 50% global emissions
target and the different investment risk scenarios. Under nonuniform investment risks, electricity
becomes an expensive fuel, reducing demand for electricity by end-use sectors. The climate
target is then achieved by reduction in energy demand and expansion of bio-CCS in the
electricity sector (see Figures 2F-2H in the Main Text).
0
100
200
300
400
500
600
2020
2030
2040
2050
-60
-40
-20
0
20
40
60
2020
2030
2040
2050
-60
-40
-20
0
20
40
60
2020
2030
2040
2050
-60
-40
-20
0
20
40
60
2020
2030
2040
2050
Liquids Gas Coal Biomass Electricity Hydrogen Other Demand reduction
© 2015 Macmillan Publishers Limited. All rights reserved.
20
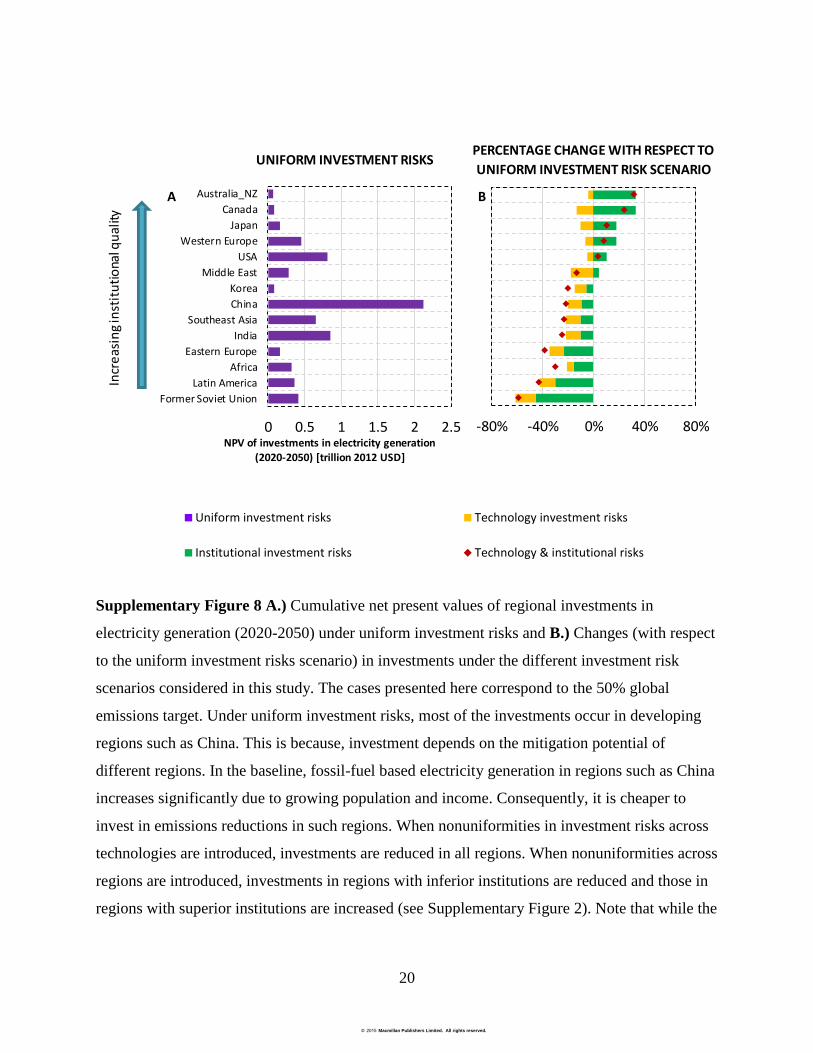
Supplementary Figure 8 A.) Cumulative net present values of regional investments in
electricity generation (2020-2050) under uniform investment risks and B.) Changes (with respect
to the uniform investment risks scenario) in investments under the different investment risk
scenarios considered in this study. The cases presented here correspond to the 50% global
emissions target. Under uniform investment risks, most of the investments occur in developing
regions such as China. This is because, investment depends on the mitigation potential of
different regions. In the baseline, fossil-fuel based electricity generation in regions such as China
increases significantly due to growing population and income. Consequently, it is cheaper to
invest in emissions reductions in such regions. When nonuniformities in investment risks across
technologies are introduced, investments are reduced in all regions. When nonuniformities across
regions are introduced, investments in regions with inferior institutions are reduced and those in
regions with superior institutions are increased (see Supplementary Figure 2). Note that while the
PERCENTAGE CHANGE WITH RESPECT TO
UNIFORM INVESTMENT RISK SCENARIOUNIFORM INVESTMENT RISKS
0 0.5 1 1.5 2 2.5
Former Soviet UnionLatin America
AfricaEastern Europe
IndiaSoutheast Asia
ChinaKorea
Middle EastUSA
Western EuropeJapan
CanadaAustralia_NZ
NPV of investments in electricity generation (2020-2050) [trillion 2012 USD]
A
-80% -40% 0% 40% 80%
B
Incr
easi
ng in
stitu
tiona
l qua
lity
Uniform investment risks Technology investment risks
Institutional investment risks Technology & institutional risks
© 2015 Macmillan Publishers Limited. All rights reserved.

21
effects of nonuniformities across technologies and institutions reinforce each other in regions
with inferior institutions, they act in opposite directions in regions with superior institutions.
© 2015 Macmillan Publishers Limited. All rights reserved.
22
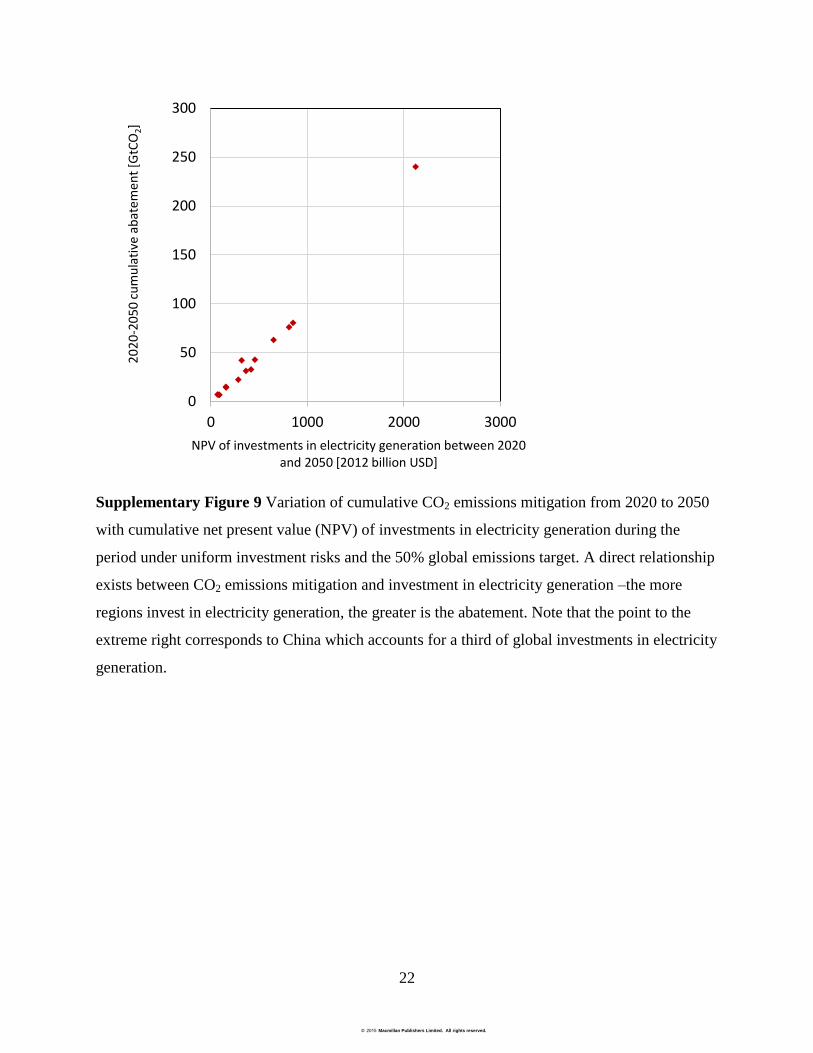
Supplementary Figure 9 Variation of cumulative CO2 emissions mitigation from 2020 to 2050
with cumulative net present value (NPV) of investments in electricity generation during the
period under uniform investment risks and the 50% global emissions target. A direct relationship
exists between CO2 emissions mitigation and investment in electricity generation –the more
regions invest in electricity generation, the greater is the abatement. Note that the point to the
extreme right corresponds to China which accounts for a third of global investments in electricity
generation.
0
50
100
150
200
250
300
0 1000 2000 3000
2020
-205
0 cu
mul
ativ
e ab
atem
ent [
GtCO
2]
NPV of investments in electricity generation between 2020 and 2050 [2012 billion USD]
© 2015 Macmillan Publishers Limited. All rights reserved.
23
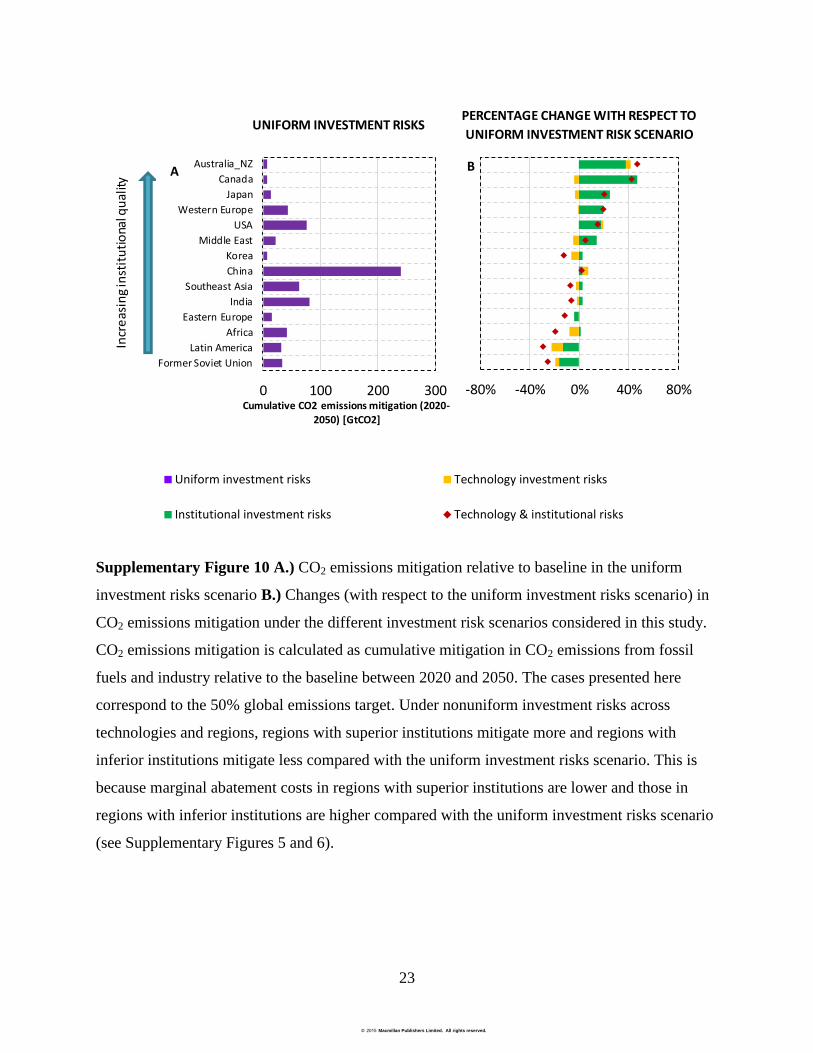
Supplementary Figure 10 A.) CO2 emissions mitigation relative to baseline in the uniform
investment risks scenario B.) Changes (with respect to the uniform investment risks scenario) in
CO2 emissions mitigation under the different investment risk scenarios considered in this study.
CO2 emissions mitigation is calculated as cumulative mitigation in CO2 emissions from fossil
fuels and industry relative to the baseline between 2020 and 2050. The cases presented here
correspond to the 50% global emissions target. Under nonuniform investment risks across
technologies and regions, regions with superior institutions mitigate more and regions with
inferior institutions mitigate less compared with the uniform investment risks scenario. This is
because marginal abatement costs in regions with superior institutions are lower and those in
regions with inferior institutions are higher compared with the uniform investment risks scenario
(see Supplementary Figures 5 and 6).
UNIFORM INVESTMENT RISKSPERCENTAGE CHANGE WITH RESPECT TO
UNIFORM INVESTMENT RISK SCENARIOIn
crea
sing
inst
itutio
nal q
ualit
y
0 100 200 300
Former Soviet UnionLatin America
AfricaEastern Europe
IndiaSoutheast Asia
ChinaKorea
Middle EastUSA
Western EuropeJapan
CanadaAustralia_NZ
Cumulative CO2 emissions mitigation (2020-
2050) [GtCO2]
A
-80% -40% 0% 40% 80%
B
Uniform investment risks Technology investment risks
Institutional investment risks Technology & institutional risks
© 2015 Macmillan Publishers Limited. All rights reserved.
24
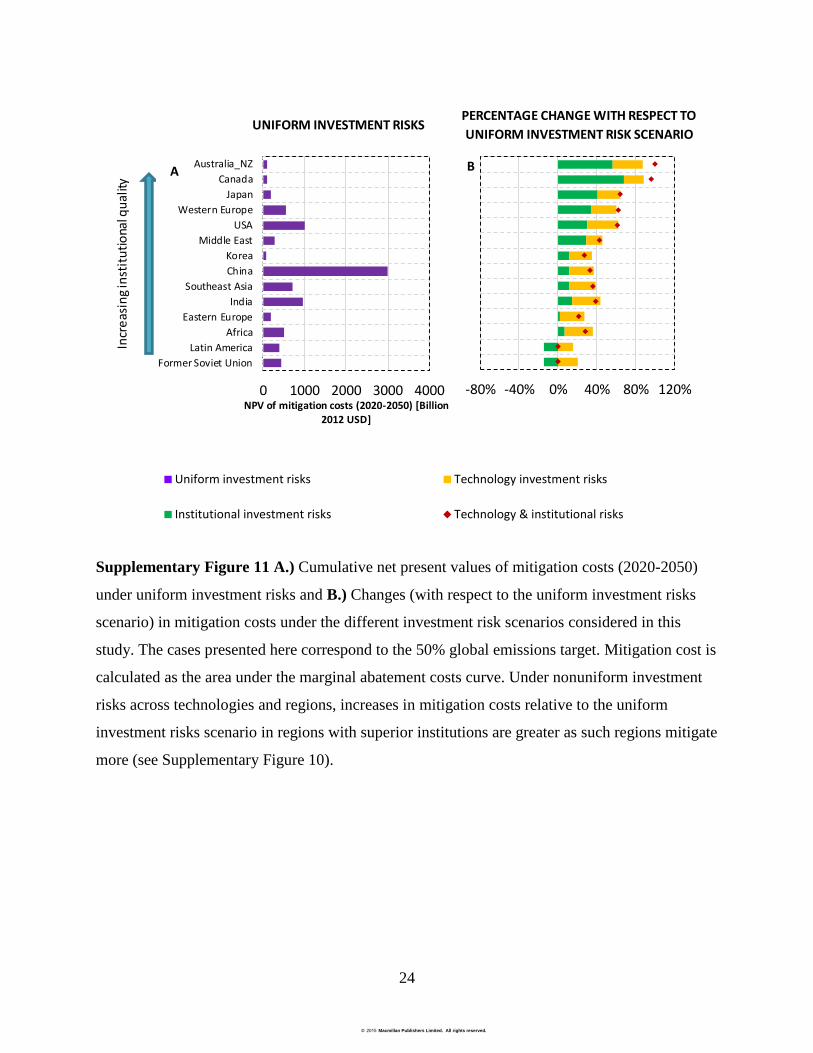
Supplementary Figure 11 A.) Cumulative net present values of mitigation costs (2020-2050)
under uniform investment risks and B.) Changes (with respect to the uniform investment risks
scenario) in mitigation costs under the different investment risk scenarios considered in this
study. The cases presented here correspond to the 50% global emissions target. Mitigation cost is
calculated as the area under the marginal abatement costs curve. Under nonuniform investment
risks across technologies and regions, increases in mitigation costs relative to the uniform
investment risks scenario in regions with superior institutions are greater as such regions mitigate
more (see Supplementary Figure 10).
UNIFORM INVESTMENT RISKSPERCENTAGE CHANGE WITH RESPECT TO
UNIFORM INVESTMENT RISK SCENARIOIn
crea
sing
inst
itutio
nal q
ualit
y
0 1000 2000 3000 4000
Former Soviet UnionLatin America
AfricaEastern Europe
IndiaSoutheast Asia
ChinaKorea
Middle EastUSA
Western EuropeJapan
CanadaAustralia_NZ
NPV of mitigation costs (2020-2050) [Billion 2012 USD]
A
-80% -40% 0% 40% 80% 120%
B
Uniform investment risks Technology investment risks
Institutional investment risks Technology & institutional risks
© 2015 Macmillan Publishers Limited. All rights reserved.
25
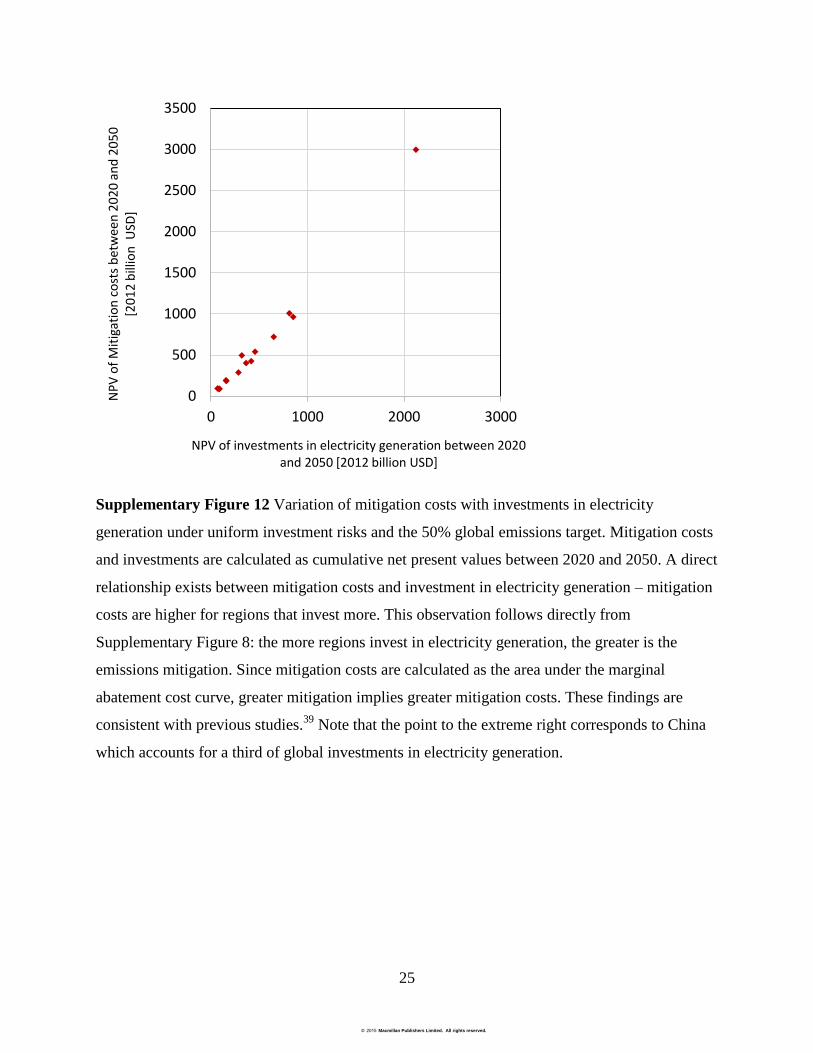
Supplementary Figure 12 Variation of mitigation costs with investments in electricity
generation under uniform investment risks and the 50% global emissions target. Mitigation costs
and investments are calculated as cumulative net present values between 2020 and 2050. A direct
relationship exists between mitigation costs and investment in electricity generation – mitigation
costs are higher for regions that invest more. This observation follows directly from
Supplementary Figure 8: the more regions invest in electricity generation, the greater is the
emissions mitigation. Since mitigation costs are calculated as the area under the marginal
abatement cost curve, greater mitigation implies greater mitigation costs. These findings are
consistent with previous studies.39
Note that the point to the extreme right corresponds to China
which accounts for a third of global investments in electricity generation.
0
500
1000
1500
2000
2500
3000
3500
0 1000 2000 3000
NPV
of M
itiga
tion
cost
s bet
wee
n 20
20 a
nd 2
050
[201
2 bi
llion
USD
]
NPV of investments in electricity generation between 2020 and 2050 [2012 billion USD]
© 2015 Macmillan Publishers Limited. All rights reserved.
26
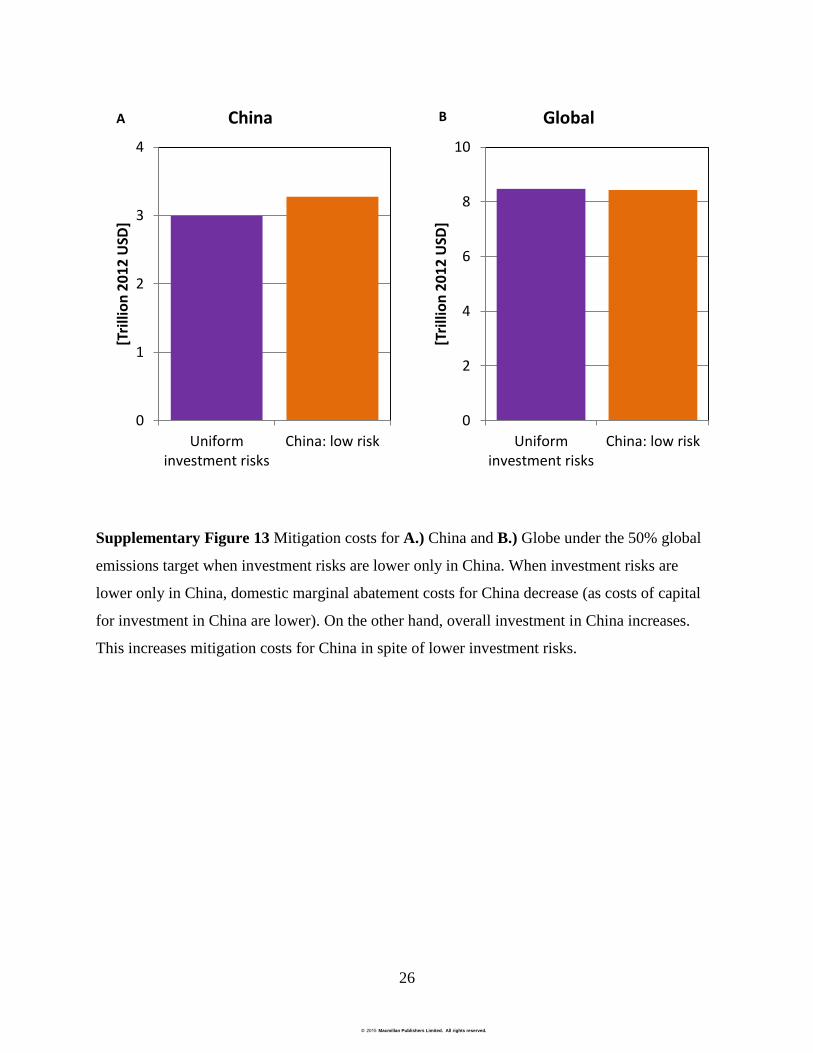
Supplementary Figure 13 Mitigation costs for A.) China and B.) Globe under the 50% global
emissions target when investment risks are lower only in China. When investment risks are
lower only in China, domestic marginal abatement costs for China decrease (as costs of capital
for investment in China are lower). On the other hand, overall investment in China increases.
This increases mitigation costs for China in spite of lower investment risks.
0
1
2
3
4
Uniforminvestment risks
China: low risk
[Tri
llio
n 2
01
2 U
SD]
China A
0
2
4
6
8
10
Uniforminvestment risks
China: low risk[T
rilli
on
20
12
USD
]
Global B
© 2015 Macmillan Publishers Limited. All rights reserved.
27
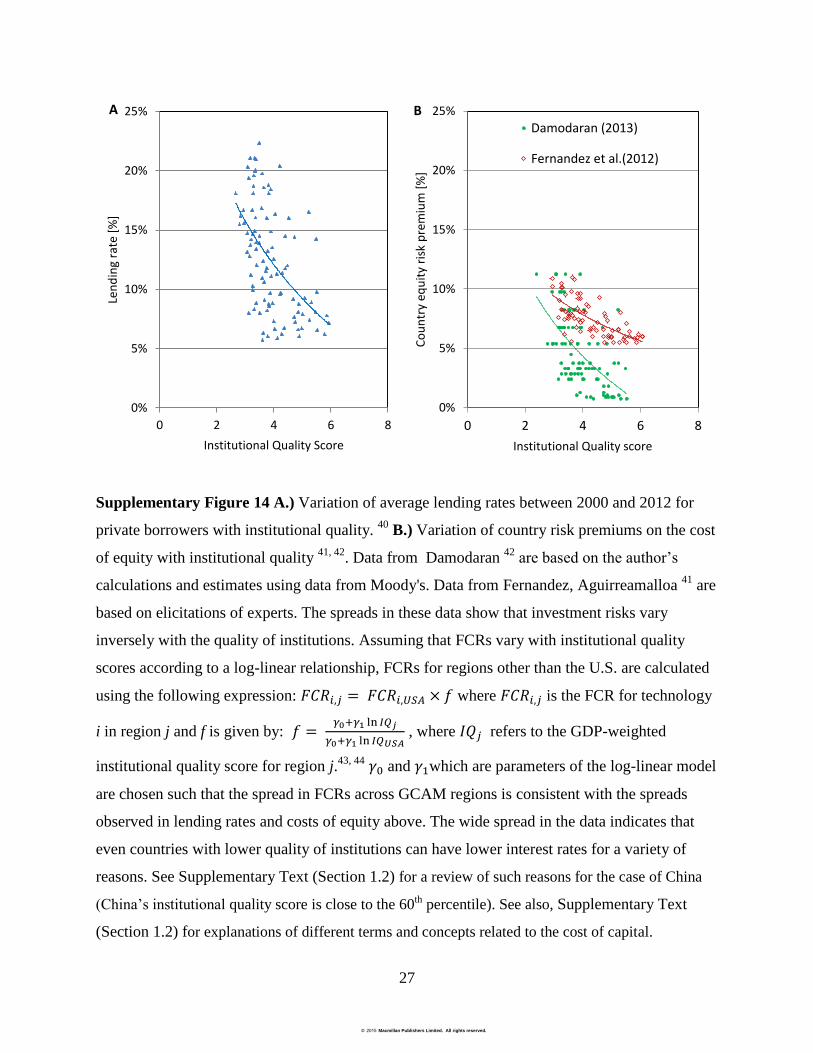
Supplementary Figure 14 A.) Variation of average lending rates between 2000 and 2012 for
private borrowers with institutional quality. 40
B.) Variation of country risk premiums on the cost
of equity with institutional quality 41, 42
. Data from Damodaran 42
are based on the author’s
calculations and estimates using data from Moody's. Data from Fernandez, Aguirreamalloa 41
are
based on elicitations of experts. The spreads in these data show that investment risks vary
inversely with the quality of institutions. Assuming that FCRs vary with institutional quality
scores according to a log-linear relationship, FCRs for regions other than the U.S. are calculated
using the following expression: 𝐹𝐶𝑅𝑖,𝑗 = 𝐹𝐶𝑅𝑖,𝑈𝑆𝐴 × 𝑓 where 𝐹𝐶𝑅𝑖,𝑗 is the FCR for technology
i in region j and f is given by: 𝑓 = 𝛾0+𝛾1 ln 𝐼𝑄𝑗
𝛾0+𝛾1 ln 𝐼𝑄𝑈𝑆𝐴 , where 𝐼𝑄𝑗 refers to the GDP-weighted
institutional quality score for region j.43, 44
𝛾0 and 𝛾1which are parameters of the log-linear model
are chosen such that the spread in FCRs across GCAM regions is consistent with the spreads
observed in lending rates and costs of equity above. The wide spread in the data indicates that
even countries with lower quality of institutions can have lower interest rates for a variety of
reasons. See Supplementary Text (Section 1.2) for a review of such reasons for the case of China
(China’s institutional quality score is close to the 60th percentile). See also, Supplementary Text
(Section 1.2) for explanations of different terms and concepts related to the cost of capital.
0%
5%
10%
15%
20%
25%
0 2 4 6 8
Lend
ing
rate
[%]
Institutional Quality Score
A
0%
5%
10%
15%
20%
25%
0 2 4 6 8Co
untr
y eq
uity
risk
pre
miu
m [%
]
Institutional Quality score
Damodaran (2013)
Fernandez et al.(2012)
B
© 2015 Macmillan Publishers Limited. All rights reserved.
28
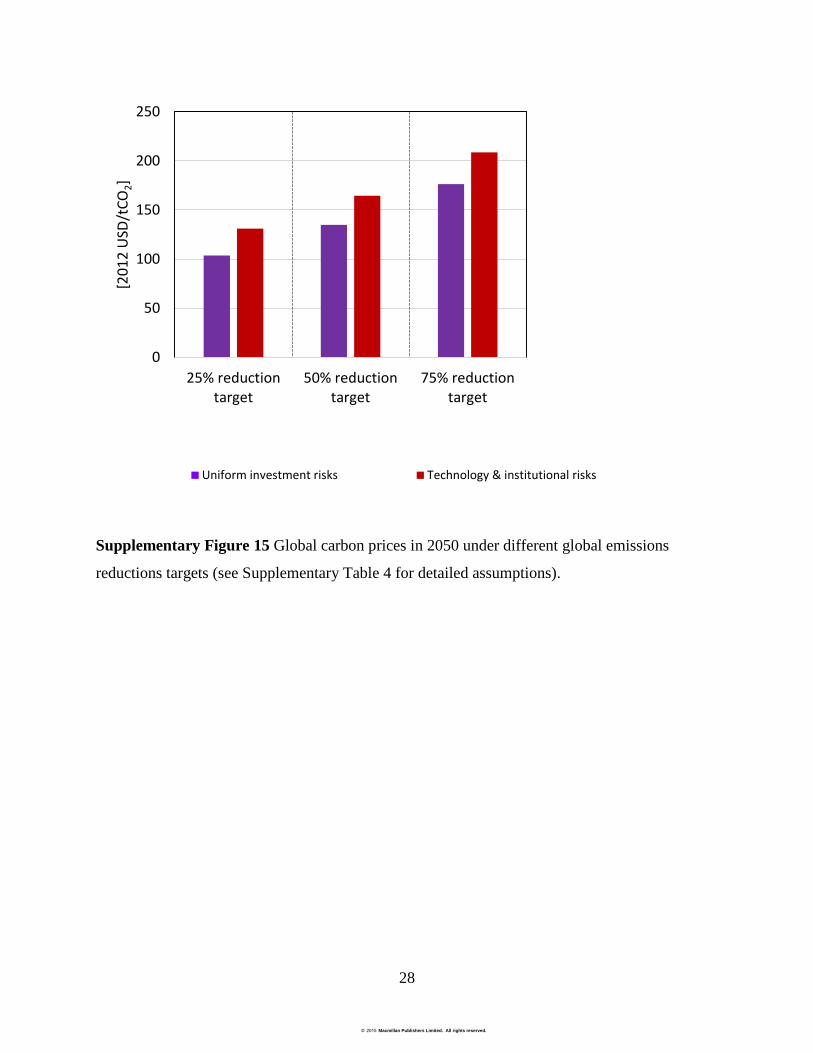
Supplementary Figure 15 Global carbon prices in 2050 under different global emissions
reductions targets (see Supplementary Table 4 for detailed assumptions).
0
50
100
150
200
250
25% reductiontarget
50% reductiontarget
75% reductiontarget
[201
2 U
SD/t
CO2]
Uniform investment risks Technology & institutional risks
© 2015 Macmillan Publishers Limited. All rights reserved.
29
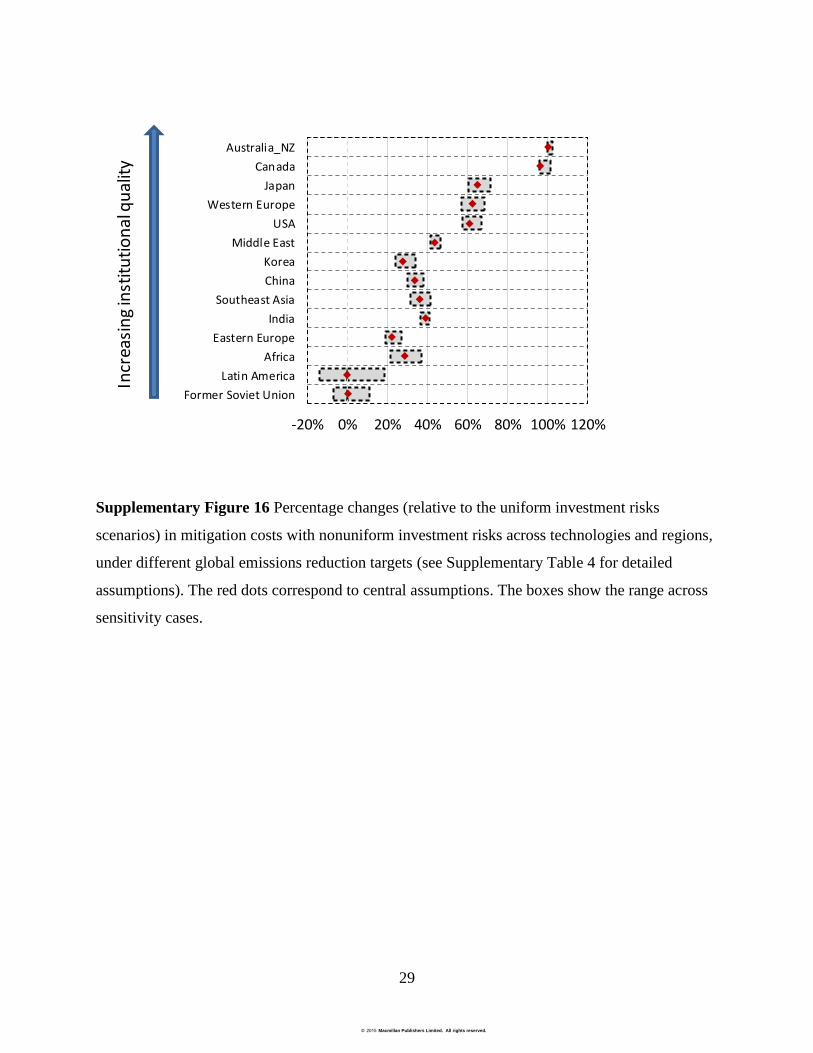
Supplementary Figure 16 Percentage changes (relative to the uniform investment risks
scenarios) in mitigation costs with nonuniform investment risks across technologies and regions,
under different global emissions reduction targets (see Supplementary Table 4 for detailed
assumptions). The red dots correspond to central assumptions. The boxes show the range across
sensitivity cases.
-20% 0% 20% 40% 60% 80% 100% 120%
Former Soviet UnionLatin America
AfricaEastern Europe
IndiaSoutheast Asia
ChinaKorea
Middle EastUSA
Western EuropeJapan
CanadaAustralia_NZ
Incr
easin
gins
titut
iona
l qua
lity
© 2015 Macmillan Publishers Limited. All rights reserved.
30
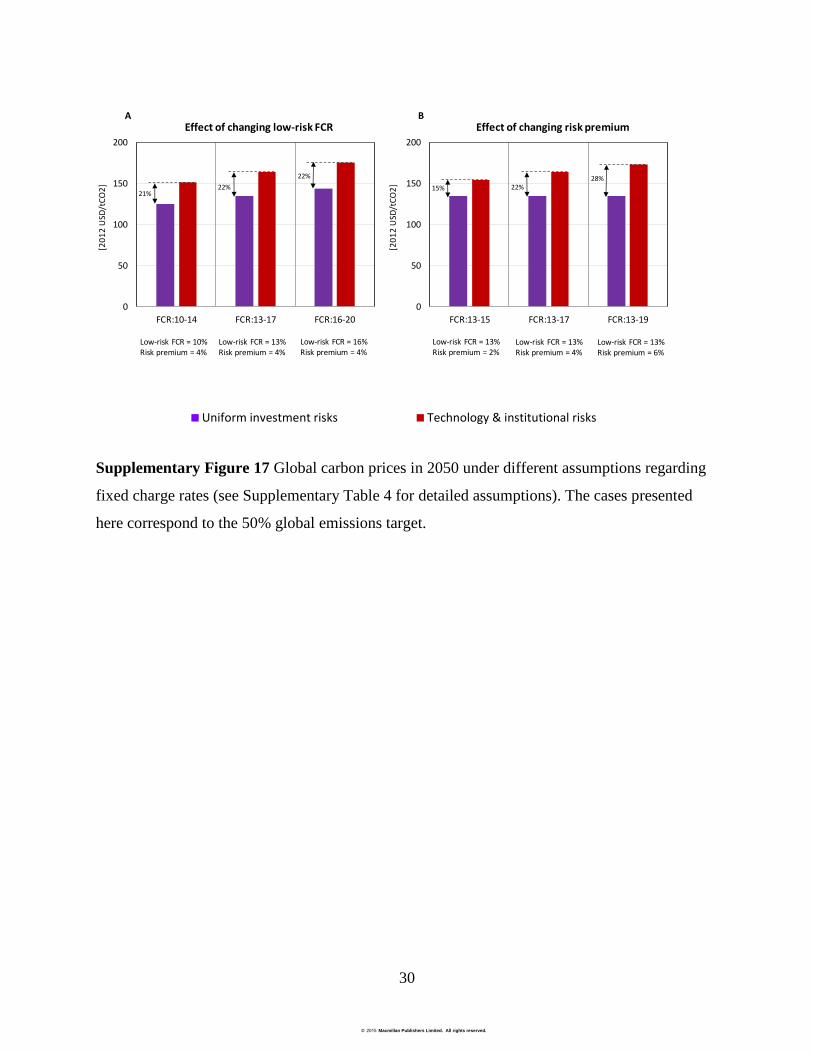
Supplementary Figure 17 Global carbon prices in 2050 under different assumptions regarding
fixed charge rates (see Supplementary Table 4 for detailed assumptions). The cases presented
here correspond to the 50% global emissions target.
B
[201
2 U
SD/t
CO2]
[201
2 U
SD/t
CO2]
A
0
50
100
150
200
FCR:10-14 FCR:13-17 FCR:16-20
21%22%
22%
0
50
100
150
200
FCR:13-15 FCR:13-17 FCR:13-19
15% 22%28%
Low-risk FCR = 10%Risk premium = 4%
Low-risk FCR = 13%Risk premium = 4%
Low-risk FCR = 16%Risk premium = 4%
Low-risk FCR = 13%Risk premium = 2%
Low-risk FCR = 13%Risk premium = 4%
Low-risk FCR = 13%Risk premium = 6%
Effect of changing low-risk FCR Effect of changing risk premium
Uniform investment risks Technology & institutional risks
© 2015 Macmillan Publishers Limited. All rights reserved.
31
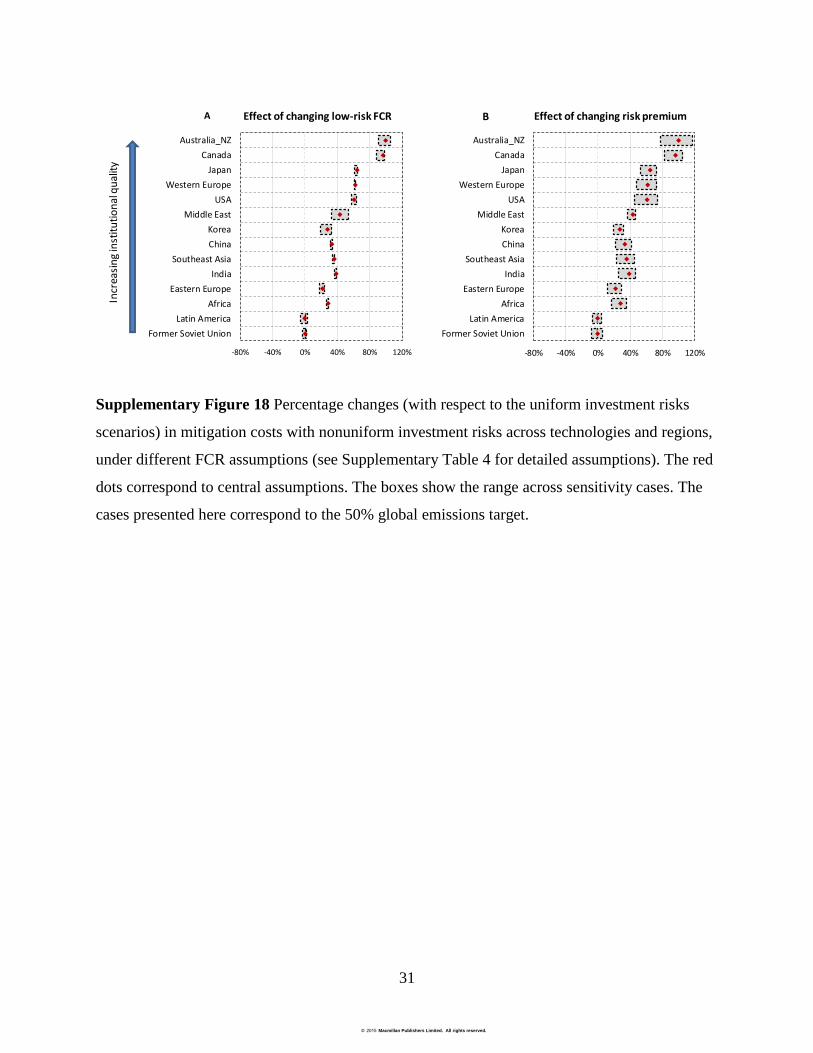
Supplementary Figure 18 Percentage changes (with respect to the uniform investment risks
scenarios) in mitigation costs with nonuniform investment risks across technologies and regions,
under different FCR assumptions (see Supplementary Table 4 for detailed assumptions). The red
dots correspond to central assumptions. The boxes show the range across sensitivity cases. The
cases presented here correspond to the 50% global emissions target.
BA Effect of changing low-risk FCR Effect of changing risk premiumIn
crea
sing
inst
itutio
nal q
ualit
y
-80% -40% 0% 40% 80% 120%
Former Soviet UnionLatin America
AfricaEastern Europe
IndiaSoutheast Asia
ChinaKorea
Middle EastUSA
Western EuropeJapan
CanadaAustralia_NZ
-80% -40% 0% 40% 80% 120%
Former Soviet UnionLatin America
AfricaEastern Europe
IndiaSoutheast Asia
ChinaKorea
Middle EastUSA
Western EuropeJapan
CanadaAustralia_NZ
© 2015 Macmillan Publishers Limited. All rights reserved.
32
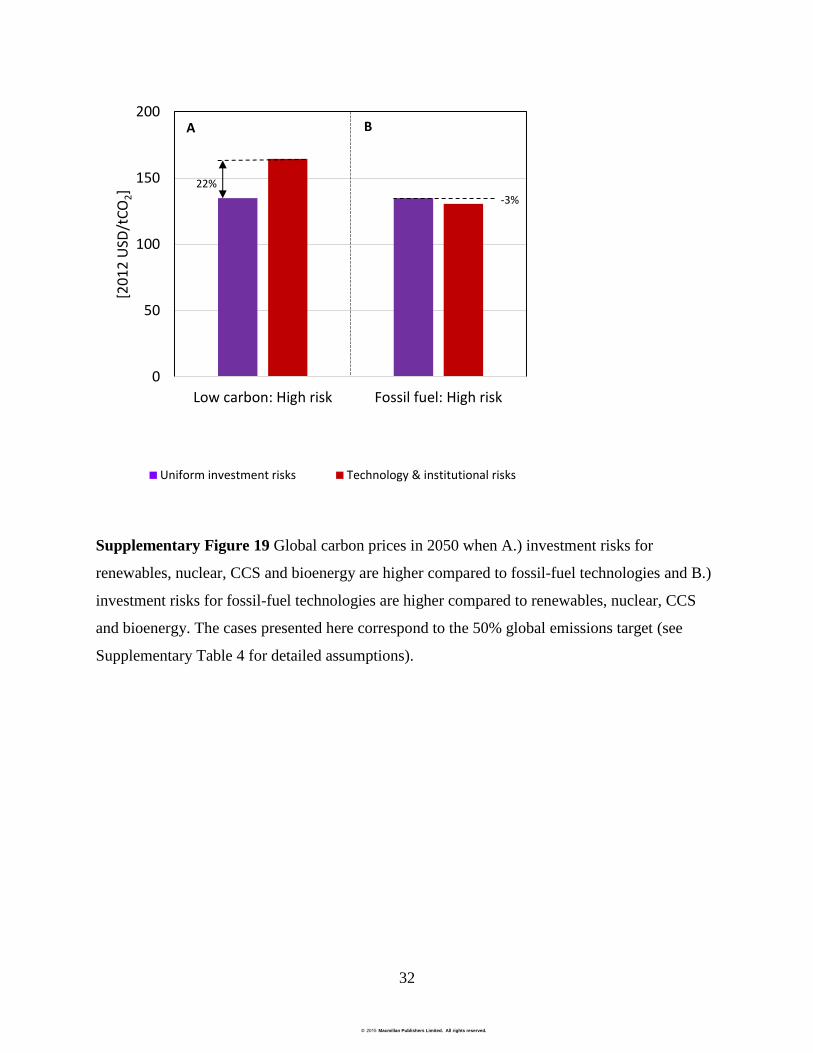
Supplementary Figure 19 Global carbon prices in 2050 when A.) investment risks for
renewables, nuclear, CCS and bioenergy are higher compared to fossil-fuel technologies and B.)
investment risks for fossil-fuel technologies are higher compared to renewables, nuclear, CCS
and bioenergy. The cases presented here correspond to the 50% global emissions target (see
Supplementary Table 4 for detailed assumptions).
0
50
100
150
200
Low carbon: High risk Fossil fuel: High risk
[201
2 U
SD/t
CO2]
22% -3%
A B
Uniform investment risks Technology & institutional risks
© 2015 Macmillan Publishers Limited. All rights reserved.
33
Supplementary Tables
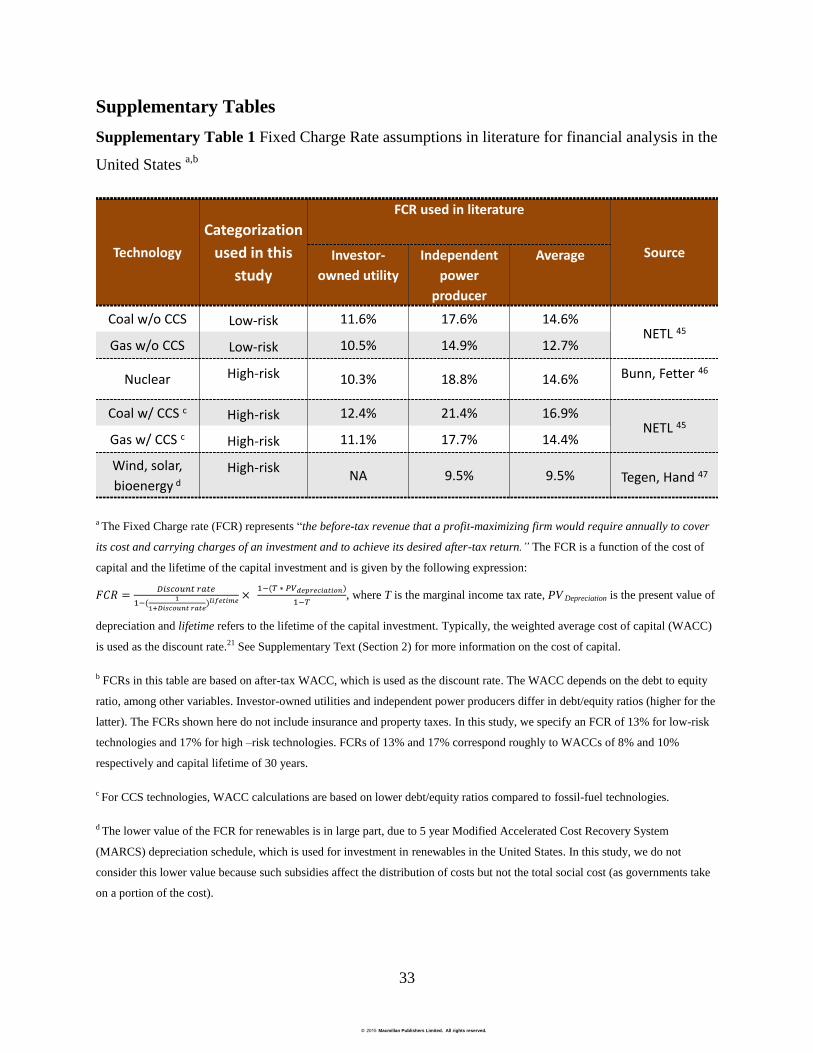
Supplementary Table 1 Fixed Charge Rate assumptions in literature for financial analysis in the
United States a,b
a The Fixed Charge rate (FCR) represents “the before-tax revenue that a profit-maximizing firm would require annually to cover
its cost and carrying charges of an investment and to achieve its desired after-tax return.” The FCR is a function of the cost of
capital and the lifetime of the capital investment and is given by the following expression:
𝐹𝐶𝑅 =𝐷𝑖𝑠𝑐𝑜𝑢𝑛𝑡 𝑟𝑎𝑡𝑒
1−(1
1+𝐷𝑖𝑠𝑐𝑜𝑢𝑛𝑡 𝑟𝑎𝑡𝑒)𝑙𝑖𝑓𝑒𝑡𝑖𝑚𝑒
× 1−(𝑇 ∗ 𝑃𝑉𝑑𝑒𝑝𝑟𝑒𝑐𝑖𝑎𝑡𝑖𝑜𝑛)
1−𝑇, where T is the marginal income tax rate, PV Depreciation is the present value of
depreciation and lifetime refers to the lifetime of the capital investment. Typically, the weighted average cost of capital (WACC)
is used as the discount rate.21 See Supplementary Text (Section 2) for more information on the cost of capital.
b FCRs in this table are based on after-tax WACC, which is used as the discount rate. The WACC depends on the debt to equity
ratio, among other variables. Investor-owned utilities and independent power producers differ in debt/equity ratios (higher for the
latter). The FCRs shown here do not include insurance and property taxes. In this study, we specify an FCR of 13% for low-risk
technologies and 17% for high –risk technologies. FCRs of 13% and 17% correspond roughly to WACCs of 8% and 10%
respectively and capital lifetime of 30 years.
c For CCS technologies, WACC calculations are based on lower debt/equity ratios compared to fossil-fuel technologies.
d The lower value of the FCR for renewables is in large part, due to 5 year Modified Accelerated Cost Recovery System
(MARCS) depreciation schedule, which is used for investment in renewables in the United States. In this study, we do not
consider this lower value because such subsidies affect the distribution of costs but not the total social cost (as governments take
on a portion of the cost).
Technology
Categorization
used in this
study
FCR used in literature
SourceInvestor-
owned utility
Independent
power
producer
Average
Coal w/o CCS Low-risk 11.6% 17.6% 14.6%NETL 45
Gas w/o CCS Low-risk 10.5% 14.9% 12.7%
Nuclear High-risk 10.3% 18.8% 14.6% Bunn, Fetter 46
Coal w/ CCS c High-risk 12.4% 21.4% 16.9%NETL 45
Gas w/ CCS c High-risk 11.1% 17.7% 14.4%
Wind, solar, bioenergy d
High-risk NA 9.5% 9.5% Tegen, Hand 47
© 2015 Macmillan Publishers Limited. All rights reserved.
34
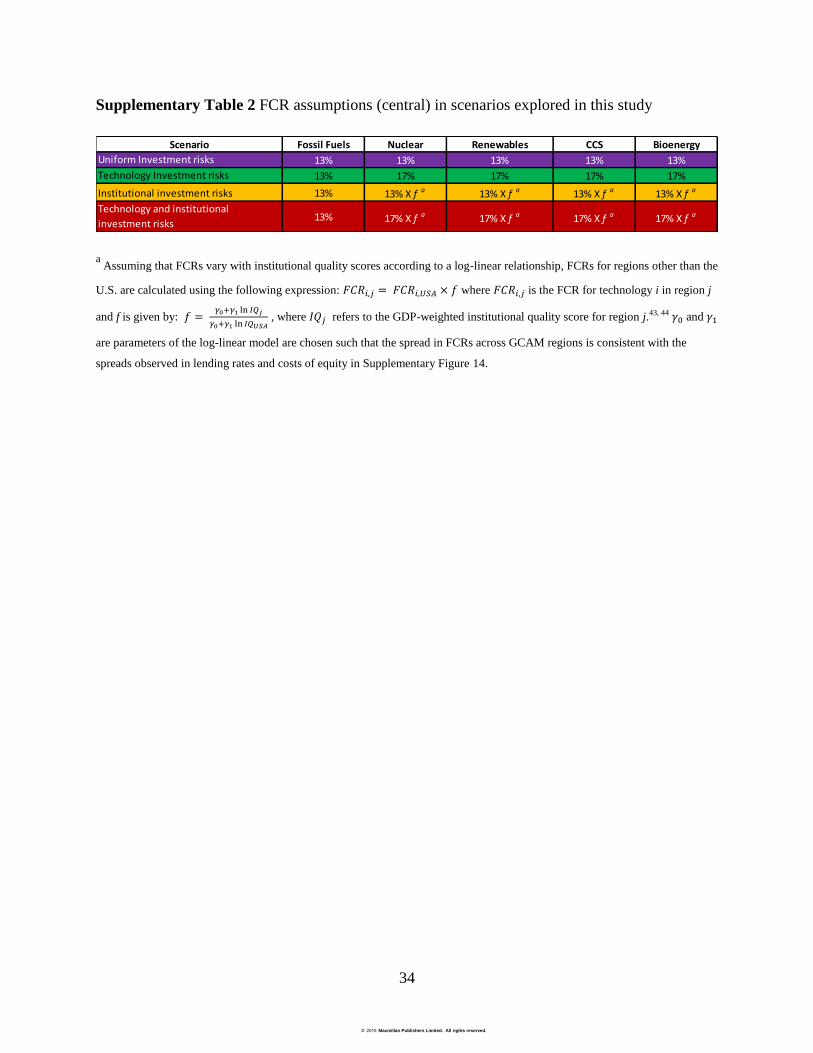
Supplementary Table 2 FCR assumptions (central) in scenarios explored in this study
a Assuming that FCRs vary with institutional quality scores according to a log-linear relationship, FCRs for regions other than the
U.S. are calculated using the following expression: 𝐹𝐶𝑅𝑖,𝑗 = 𝐹𝐶𝑅𝑖,𝑈𝑆𝐴 × 𝑓 where 𝐹𝐶𝑅𝑖,𝑗 is the FCR for technology i in region j
and f is given by: 𝑓 = 𝛾0+𝛾1 ln 𝐼𝑄𝑗
𝛾0+𝛾1 ln 𝐼𝑄𝑈𝑆𝐴 , where 𝐼𝑄𝑗 refers to the GDP-weighted institutional quality score for region j.43, 44 𝛾0 and 𝛾1
are parameters of the log-linear model are chosen such that the spread in FCRs across GCAM regions is consistent with the
spreads observed in lending rates and costs of equity in Supplementary Figure 14.
Scenario Fossil Fuels Nuclear Renewables CCS Bioenergy
Uniform Investment risks 13% 13% 13% 13% 13%Technology Investment risks 13% 17% 17% 17% 17%Institutional investment risks 13% 13% X f a 13% X f a 13% X f a 13% X f a
Technology and institutional investment risks 13% 17% X f a 17% X f a 17% X f a 17% X f a
© 2015 Macmillan Publishers Limited. All rights reserved.
35
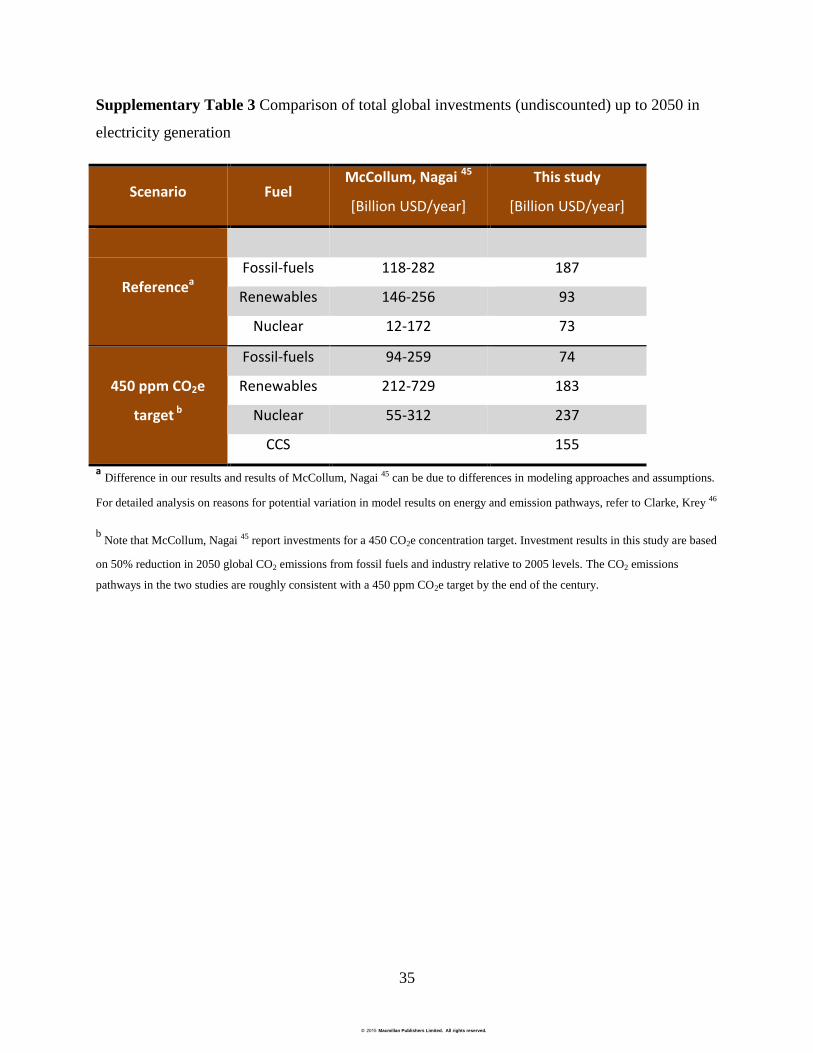
Supplementary Table 3 Comparison of total global investments (undiscounted) up to 2050 in
electricity generation
Scenario Fuel McCollum, Nagai 45
[Billion USD/year]
This study
[Billion USD/year]
Referencea
Fossil-fuels 118-282 187
Renewables 146-256 93
Nuclear 12-172 73
450 ppm CO2e
target b
Fossil-fuels 94-259 74
Renewables 212-729 183
Nuclear 55-312 237
CCS 155 a Difference in our results and results of McCollum, Nagai 45 can be due to differences in modeling approaches and assumptions.
For detailed analysis on reasons for potential variation in model results on energy and emission pathways, refer to Clarke, Krey 46
b Note that McCollum, Nagai 45 report investments for a 450 CO2e concentration target. Investment results in this study are based
on 50% reduction in 2050 global CO2 emissions from fossil fuels and industry relative to 2005 levels. The CO2 emissions
pathways in the two studies are roughly consistent with a 450 ppm CO2e target by the end of the century.
© 2015 Macmillan Publishers Limited. All rights reserved.
36
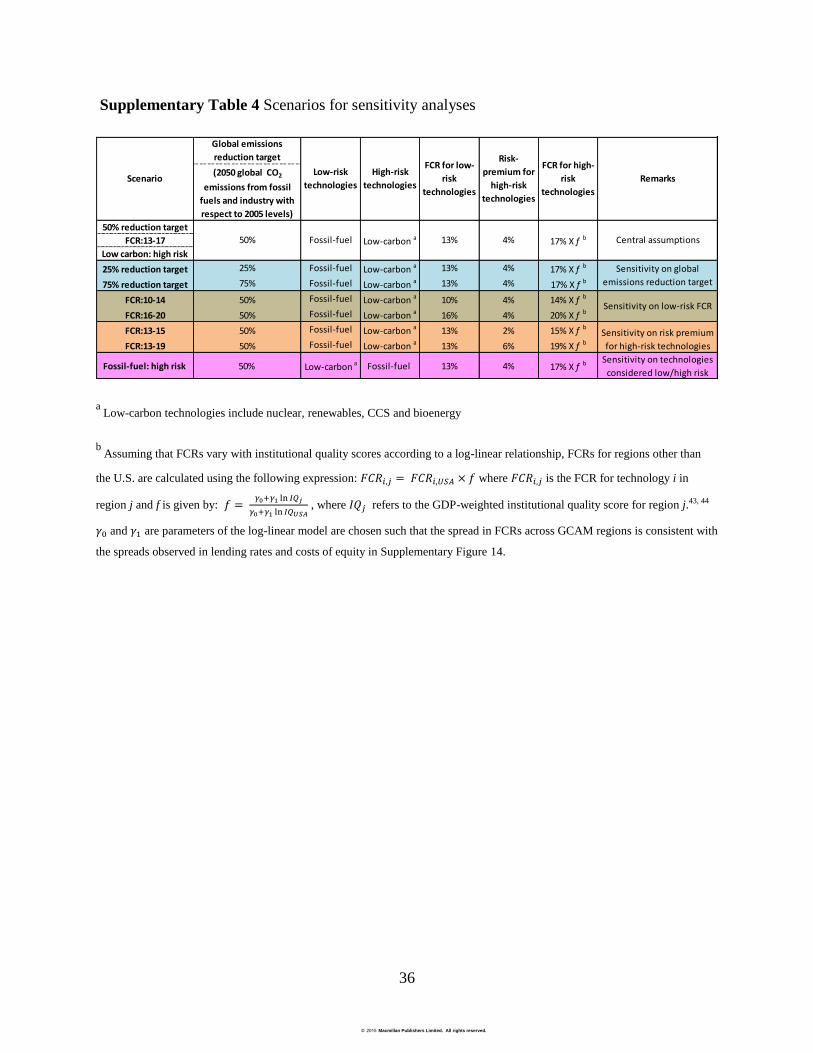
Supplementary Table 4 Scenarios for sensitivity analyses
a Low-carbon technologies include nuclear, renewables, CCS and bioenergy
b Assuming that FCRs vary with institutional quality scores according to a log-linear relationship, FCRs for regions other than
the U.S. are calculated using the following expression: 𝐹𝐶𝑅𝑖,𝑗 = 𝐹𝐶𝑅𝑖,𝑈𝑆𝐴 × 𝑓 where 𝐹𝐶𝑅𝑖,𝑗 is the FCR for technology i in
region j and f is given by: 𝑓 = 𝛾0+𝛾1 ln 𝐼𝑄𝑗
𝛾0+𝛾1 ln 𝐼𝑄𝑈𝑆𝐴 , where 𝐼𝑄𝑗 refers to the GDP-weighted institutional quality score for region j.43, 44
𝛾0 and 𝛾1 are parameters of the log-linear model are chosen such that the spread in FCRs across GCAM regions is consistent with
the spreads observed in lending rates and costs of equity in Supplementary Figure 14.
Global emissions
reduction target
(2050 global CO2
emissions from fossil
fuels and industry with
respect to 2005 levels)
50% reduction target
FCR:13-17
Low carbon: high risk
25% reduction target 25% Fossil-fuel Low-carbon a 13% 4% 17% X f b
75% reduction target 75% Fossil-fuel Low-carbon a 13% 4% 17% X f b
FCR:10-14 50% Fossil-fuel Low-carbon a 10% 4% 14% X f b
FCR:16-20 50% Fossil-fuel Low-carbon a 16% 4% 20% X f b
FCR:13-15 50% Fossil-fuel Low-carbon a 13% 2% 15% X f b
FCR:13-19 50% Fossil-fuel Low-carbon a 13% 6% 19% X f b
Fossil-fuel: high risk 50% Low-carbon a Fossil-fuel 13% 4% 17% X f bSensitivity on technologies
considered low/high risk
Scenario
Sensitivity on global emissions reduction target
Sensitivity on low-risk FCR
Low-risk
technologies
High-risk
technologies
FCR for low-
risk
technologies
Risk-
premium for
high-risk
technologies
FCR for high-
risk
technologies
Remarks
50% Fossil-fuel Low-carbon a 13%
Sensitivity on risk premium for high-risk technologies
4% 17% X f b Central assumptions
© 2015 Macmillan Publishers Limited. All rights reserved.
37
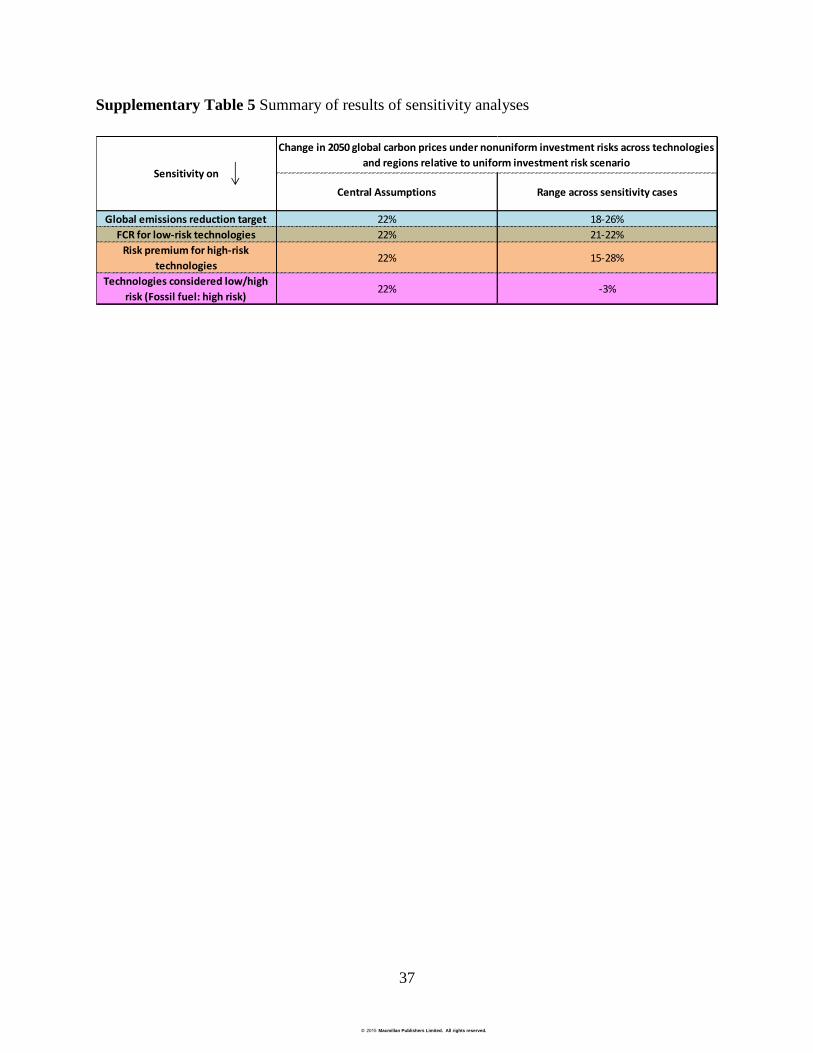
Supplementary Table 5 Summary of results of sensitivity analyses
Central Assumptions Range across sensitivity cases
Global emissions reduction target 22% 18-26%FCR for low-risk technologies 22% 21-22%
Risk premium for high-risk
technologies22% 15-28%
Technologies considered low/high
risk (Fossil fuel: high risk)22% -3%
Change in 2050 global carbon prices under nonuniform investment risks across technologies
and regions relative to uniform investment risk scenarioSensitivity on
© 2015 Macmillan Publishers Limited. All rights reserved.
38
References
1. North DC. Institutions, institutional change and economic performance. Cambridge
university press, 1990.
2. Acemoglu D, Zilibotti F. Was Prometheus Unbound by Chance? Risk, Diversification,
and Growth. Journal of Political Economy 1997, 105(4): 709-751.
3. Faria A, Mauro P. Institutions and the external capital structure of countries. Journal of
International Money and Finance 2009, 28(3): 367-391.
4. La Porta R, Lopez-de-Silanes F, Shleifer A, Vishny RW. Legal Determinants of External
Finance. The Journal of Finance 1997, 52(3): 1131-1150.
5. Clague C, Keefer P, Knack S, Olson M. Contract-intensive money: contract enforcement,
property rights, and economic performance. Journal of Economic Growth 1999, 4(2):
185-211.
6. Levy B, Spiller PT. The Institutional Foundations of Regulatory Commitment: A
Comparative Analysis of Telecommunications Regulation. Journal of Law, Economics,
& Organization 1994, 10(2): 201-246.
7. Stasavage D. Private investment and political institutions. Economics & politics 2002,
14(1): 41-63.
8. Bergara ME, Henisz WJ, Spiller PT. Political Institutions and Electric Utility Investment:
a cross-nation analysis. California management review 1998, 40(2): 18-35.
9. Spiller PT. A Positive Political Theory of Regulatory Instruments: Contracts,
Administrative Law or Regulatory Specificity. Southern California Law Review 1995,
69: 477–515.
10. Woodhouse EJ. Obsolescing Bargain Redux-Foreign Investment in the Electric Power
Sector in Developing Countries. New York University Journal of International Law and
Politics 2006, 38: 121-219.
© 2015 Macmillan Publishers Limited. All rights reserved.
39
11. Ekholm T, Ghoddusi H, Krey V, Riahi K. The effect of financial constraints on energy-
climate scenarios. Energy Policy 2013, 59: 562-572.
12. Fuss S, Szolgayová J, Khabarov N, Obersteiner M. Renewables and climate change
mitigation: Irreversible energy investment under uncertainty and portfolio effects. Energy
Policy 2012, 40: 59-68.
13. Laurikka H, Koljonen T. Emissions trading and investment decisions in the power
sector—a case study in Finland. Energy Policy 2006, 34(9): 1063-1074.
14. Laurikka H. The impact of climate policy on heat and power capacity investment
decisions. In: Antes R, Hansjürgens B, Letmathe P (eds). Emissions Trading and
Business. Physica-Verlag HD, 2006.
15. Jaffe AB, Newell RG, Stavins RN. Environmental policy and technological change.
Environmental and Resource Economics 2002, 22(1): 41-70.
16. Krohn S, Morthorst P-E, Awerbuch S. The Economics of Wind Energy -A report by the
European Wind Energy Association: European Wind Energy Association; 2009.
17. Roques FA, Newbery DM, Nuttall WJ. Investment incentives and electricity market
design: the British experience Review of Network Economics 2005, 4(2): 93-128.
18. Borenstein S. The trouble with electricity markets: understanding California's
restructuring disaster. The Journal of Economic Perspectives 2002, 16(1): 191-211.
19. Steggals W, Gross R, Heptonstall P. Winds of change: How high wind penetrations will
affect investment incentives in the GB electricity sector. Energy Policy 2011, 39(3):
1389-1396.
20. Rose NL, Joskow PL. The diffusion of new technologies: Evidence from the electric
utility industry. Rand Journal of Economics 1990, 21(3): 354-373.
21. Short W, Packey DJ, Holt T. A Manual for the Economic Evaluation of Energy
Efficiency and Renewable Energy Technologies. Golden, Colorado: National Reenwable
Energy Laboratory; 1995.
© 2015 Macmillan Publishers Limited. All rights reserved.
40
22. Stiglitz JE, Weiss A. Credit rationing in markets with imperfect information The
American economic review 1981, 393-410.
23. Jaffe AB, Stavins RN. The energy-efficiency gap - What does it mean? Energy policy
1994, 22(10): 804-810.
24. Frankfurt School-UNEP Centre/BNEF. Global Trends in Renewable Energy Investment
2014. Frankfurt, Germany: Frankfurt School-UNEP Collaborating Centre, the United
Nations Environment Programme (UNEP) and Bloomberg New Energy Finance (BNEF);
2014.
25. WNA. Plans For New Reactors Worldwide. 2013 [cited 2014 7-24]Available from:
http://www.world-nuclear.org/info/current-and-future-generation/plans-for-new-reactors-
worldwide/
26. Sullivan R. Investment-grade climate change policy: financing the transition to the low-
carbon economy; 2011.
27. Victor DG, Hults D, Thurber M. Oil and Governance: State-Owned Enterprises and the
World Energy Supply. Cambridge University Press: Cambridge, 2012.
28. Rong F, Victor DG. What does it cost to build a power plant? San Diego, USA:
Laboratory on International Law and Regulation; 2011.
29. Clarke JF, Edmonds J. Modelling energy technologies in a competitive market.
1993(August 1992): 123-129.
30. McFadden D. Econometric models for probabilistic choice among products. The Journal
of Business 1980, 53(3): S13-S29.
31. Train K. Qualitative choice analysis: theory, econometrics, and an application to
automobile demand MIT Press, 1993.
32. Iyer G, Hultman N, Eom J, McJeon H, Patel P, Clarke L. Diffusion of low-carbon
technologies and the feasibility of long-term climate targets. Technological Forecasting
and Social Change 2013.
© 2015 Macmillan Publishers Limited. All rights reserved.
41
33. Hultman NE, Malone EL, Runci P, Carlock G, Anderson KL. Factors in low-carbon
energy transformations: Comparing nuclear and bioenergy in Brazil, Sweden, and the
United States. Energy Policy 2012, 40: 131-146.
34. Iyer G, Hultman N, Fetter S, Kim SH. Implications of small modular reactors for climate
change mitigation. Energy Economics 2014, 45: 144-154.
35. McJeon HC, Clarke L, Kyle P, Wise M, Hackbarth A, Bryant BP, et al. Technology
interactions among low-carbon energy technologies: What can we learn from a large
number of scenarios? Energy Economics 2011, 33(4): 619-631.
36. Clarke LE, Wise MA, Edmonds JA, Placet M, Kyle P, Calvin K, et al. CO2 Emissions
Mitigation and Technological Advance: An Updated Analysis of Advanced Technology
Scenarios. Richland, WA, 2008: Pacific Northwest National Laboratory; 2008.
37. Peck SC, Wan YS. Analytic Solutions of Simple Optimal Greenhouse Gas Emissions
Models. In: van Ierland EC, Gorka K (eds). Economics of Atmospheric Pollution, vol. 14.
Springer Verlag: Berlin, Heidelberg, 1996, pp 113–121.
38. Kriegler E, Weyant JP, Blanford GJ, Krey V, Clarke L, Edmonds J, et al. The role of
technology for achieving climate policy objectives: overview of the EMF 27 study on
global technology and climate policy strategies. Climatic Change 2014, 123(3-4): 353-
367.
39. Carraro C, Favero A, Massetti E. “Investments and public finance in a green, low carbon,
economy”. Energy Economics 2012, 34: S15-S28.
40. The World Bank. International Debt Statistics. Washington D.C., USA: The World Bank;
2013.
41. Fernandez P, Aguirreamalloa J, Corres L. Market Risk Premium used in 82 countries in
2012: a survey with 7,192 answers IESE Business School; 2012.
42. Damodaran A. Country Default Spreads and Risk Premiums. 2014 [cited 2014 17th
July]Available from:
http://pages.stern.nyu.edu/~adamodar/New_Home_Page/datafile/ctryprem.html
43. Erb CB, Harvey CR, Viskanta TE. Expected returns and volatility in 135 countries. The
Journal of Portfolio Management 1996, 22(3): 46-58.
© 2015 Macmillan Publishers Limited. All rights reserved.
42
44. Benítez PC, McCallum I, Obersteiner M, Yamagata Y. Global potential for carbon
sequestration: Geographical distribution, country risk and policy implications. Ecological
Economics 2007, 60(3): 572-583.
45. McCollum D, Nagai Y, Riahi K, Marangoni G, Calvin K, Pietzcker R, et al. Energy
investments under climate policy: a comparison of global models Climate Change
Economics 2014.
46. Clarke L, Krey V, Weyant J, Chaturvedi V. Regional energy system variation in global
models: Results from the Asian Modeling Exercise scenarios. Energy Economics 2012,
34: S293-S305.
© 2015 Macmillan Publishers Limited. All rights reserved.