Embed Size (px)
Citation preview

Improved grading and survival prediction of human astrocyticbrain tumors by artificial neural network analysis ofgene expression microarray data
Lawrence P. Petalidis,1 Anastasis Oulas,2,3
Magnus Backlund,6 Matthew T. Wayland,4 Lu Liu,1
Karen Plant,1 Lisa Happerfield,1 Tom C. Freeman,5
Panayiota Poirazi,2 and V. Peter Collins1
1Division of Molecular Histopathology, Department of Pathology,University of Cambridge, Addenbrooke’s Hospital, Cambridge,United Kingdom; 2Institute for Molecular Biology andBiotechnology, Foundation for Research and Technology-Hellas;3Graduate Program in Molecular Biology and Biomedicine,Department of Biology, University of Crete, Heraklion, Crete,Greece; 4Cambridge Centre for Neuropsychiatric Research,University of Cambridge, Cambridge, United Kingdom; 5Divisionof Pathway Medicine, College of Medicine, University ofEdinburgh, Edinburgh, Scotland, United Kingdom; and6Department of Oncology-Pathology, Karolinska Hospital,Karolinska Institute, Stockholm, Sweden
AbstractHistopathologic grading of astrocytic tumors based oncurrent WHO criteria offers a valuable but simplifiedrepresentation of oncologic reality and is often insufficientto predict clinical outcome. In this study, we report a newastrocytic tumor microarray gene expression data set(n = 65). We have used a simple artificial neural networkalgorithm to address grading of human astrocytic tumors,derive specific transcriptional signatures from histopatho-logic subtypes of astrocytic tumors, and asses whetherthese molecular signatures define survival prognosticsubclasses. Fifty-nine classifier genes were identified andfound to fall within three distinct functional classes, thatis, angiogenesis, cell differentiation, and lower-gradeastrocytic tumor discrimination. These gene classes werefound to characterize three molecular tumor subtypesdenoted ANGIO, INTER, and LOWER. Grading of samples
using these subtypes agreed with prior histopathologicgrading for both our data set (96.15%) and an indepen-dent data set. Six tumors were particularly challenging todiagnose histopathologically. We present an artificialneural network grading for these samples and offer anevidence-based interpretation of grading results usingclinical metadata to substantiate findings. The prognosticvalue of the three identified tumor subtypes was found tooutperform histopathologic grading as well as tumorsubtypes reported in other studies, indicating a highsurvival prognostic potential for the 59 gene classifiers.Finally, 11 gene classifiers that differentiate betweenprimary and secondary glioblastomas were also identified.[Mol Cancer Ther 2008;7(5):1013–24]
IntroductionAstrocytic tumors of malignancy grades 2 to 4 arecollectively termed diffusely infiltrating astrocytomas andinclude diffuse astrocytoma (malignancy grade 2; ‘‘A’’),anaplastic astrocytoma (malignancy grade 3; ‘‘AA’’), andglioblastoma (malignancy grade 4; ‘‘GB’’). A total of fourmalignancy grades are recognized by the WHO system, withgrades 1 and 4 tumors being the biologically least and mostaggressive tumor grades, respectively (1, 2). Glioblastomacommonly occurs de novo (also called primary glioblastoma)but may also result from the progression of lower-gradetumors to higher malignancy grades. Glioblastoma showsthe greatest range of genetic abnormalities, with commonchanges in the de novo tumors, including homozygousdeletion of CDKN2A, CDKN2B , and p14ARF (9p21), loss ofone allele and mutation of the retained allele of PTEN(10q23), and amplification of the EGFR gene (7p12; ref. 2).
Use of expression microarray data in brain tumorclassification/clustering (3) and survival prognosis (4–6)has received significant interest in the last few years.Approaches include statistical methods for gene setidentification and tumor classification (7); principal com-ponent analysis and t test for the selection of differentiallyexpressed genes involved in astrocytoma progression (8);k means along with multidimensional scaling for discrim-inating between glioblastomas, lower-grade astrocytomas,and other glioma types, such as oligodendrogliomas (9);hierarchical clustering (3, 4, 9, 10); k nearest neighbor forclassification of high-grade gliomas and outcome prognosis(5); gene voting for survival prediction of the diffuselyinfiltrating gliomas (4); and others. Expression profiling hasidentified molecular as well as genetic subtypes associatedwith tumor grade, progression, and patient survival (8, 10).Although astrocytic tumors continue to be defined byhistologic criteria, reports that expression profiles predictsurvival better than histologic grade (4, 5, 11) provide
Received 3/13/07; revised 1/11/08; accepted 3/26/08.
Grant support: Cancer Research UK, UK Medical Research Council, TheJacqueline Seroussi Memorial Foundation for Cancer Research, SamanthaDickson Research Trust, Ludwig Institute for Cancer Research, GeneralSecretariat for Research and Technology, Hellas (project PENED03ED842), and EMBO Young Investigator Program.
The costs of publication of this article were defrayed in part by thepayment of page charges. This article must therefore be hereby markedadvertisement in accordance with 18 U.S.C. Section 1734 solely toindicate this fact.
Note: L. P. Petalidis, A. Oulas, P. Poirazi, and V.P. Collins contributedequally to this work.
Requests for reprints: Panayiota Poirazi, Institute for Molecular Biology andBiotechnology, Foundation for Research and Technology-Hellas, VassilikaVouton, P.O. Box 1385, GR 711 10 Heraklion, Crete, Greece.E-mail: [email protected]
Copyright C 2008 American Association for Cancer Research.
doi:10.1158/1535-7163.MCT-07-0177
1013
Mol Cancer Ther 2008;7(5). May 2008
on July 3, 2018. © 2008 American Association for Cancer Research. mct.aacrjournals.org Downloaded from
Published OnlineFirst April 29, 2008; DOI: 10.1158/1535-7163.MCT-07-0177

support for the hypothesis that tumors defined morpho-logically represent a mix of molecular genetic subtypes.Most of these studies, however, have compared diffuselyinfiltrating astrocytomas with tumors of mixed or non-astrocytic origin, have not included lower-grade (2) tumors(4, 5, 7, 11), or have limited their efforts to a single tumorgrade (3, 6). Several of these studies have also comparedtumor tissue to normal brain, a task of arguable relevancewhen taking into account the vast differences in cellularcomposition between the two tissues. Moreover, studieshave often focused on questions related more to the use ofexpression data toward general brain tumor classificationrather than malignancy grading of diffusely infiltratingastrocytic tumors per se. Finally, discordances betweenhistopathology and expression-based tumor classificationfor a given tumor set have seldom been interpreted orsubstantiated with thorough clinical and/or molecularevidence.
Using a new gene expression data set originating from65 highly annotated tumors and a simple artificial neuralnetwork (ANN) algorithm in the form of a single-layer per-ceptron, we address grading of human astrocytic tumors,derive specific transcriptional signatures from histopatho-logic subtypes of astrocytic tumors, and assess whetherthese molecular signatures define survival prognosticsubclasses. We validate our approach with several indepen-dent data sets and offer valuable insight into the tumor bio-logy and gene expression-based grading of astrocytomas.
Materials andMethodsTumor Samples, RNA Isolation, and Hybridization to
Affymetrix U133AGeneChipsThe tumor set consisted of 2 pilocytic astrocytomas
(WHO grade 1 ‘‘PA’’), 5 diffuse astrocytomas (WHO grade2 ‘‘A’’), 15 anaplastic astrocytomas (WHO grade 3 ‘‘AA’’),and 39 glioblastomas (WHO grade 4 ‘‘GB’’). This sampledistribution reflects tissue availability and relative frequen-cy of diagnosis per tumor grade. Four additional samplesgraded as AA that were exceptionally challenging to gradeby histopathology were treated as separate ‘‘problem’’cases. Histopathologic diagnoses were made according toWHO criteria (1) by V.P.C. RNA from the 65 humanastrocytic tumor samples was extracted using guanidineisothiocyanate ultracentrifugation as described previously(12). RNA quality was assessed using an Agilent Bioana-lyzer 2100 (Agilent Technologies). For each tumor sample,7 Ag RNA was used to generate double-stranded cDNA,which was subsequently in vitro transcribed to producebiotin-labeled cRNA using the ENZO BioArray HighYieldkit. cRNA (15 Ag) was fragmented and hybridized toAffymetrix HG-U133A GeneChips (Affymetrix). Gene-Chips were washed, stained, and scanned as described inthe manufacturer’s manual. Quality of prefragmentationand postfragmentation cRNA was assessed using anAgilent Bioanalyzer 2100 (Agilent Technologies).
ExpressionMicroarray Data AnalysisRaw data (CEL files) were imported into ‘‘R,’’ a freely
available environment for statistical computing (13). Nor-
malization and computation of expression measures wasdone using the justRMA function within the Affy packageof Bioconductor (14). All expression data have beensubmitted to GEO (15) in a MIAME-compliant fashion(accession no. GSE1993). Annotation of probe set lists wasdone using EASE (16).
Validation of Results Using Quantitative PCRQuantitative PCR (QPCR) was done on a LightCycler
machine (Roche) using DNA Master SYBR Green I (RocheMolecular Biochemicals or Sigma) according to the manu-facturer’s protocol. Primers were ordered from MWG.Double-stranded cDNA used as a template was the sameas that used for cRNA target preparation. One microliter ofthis cDNA was diluted 1:200 for generation of the finaltemplate used. Validation was done on a subset of 23 tumors(15 GB and 8 AA) that were part of the original tumor dataset assessed. Assays were done in duplicate. The raw dataproduced by QPCR referred to the number of cyclesrequired for reactions to reach exponential phase asdetermined using the RelQuant software (Roche). Expres-sion of MYO1C was used for normalization of the QPCRdata. Mean expression fold change differences betweentumor groups were calculated using the 2-DDCT method (17).Primer sequences: phosphoprotein enriched in astrocytes 15(PEA15) 5¶-GAGCAGCCAGCGTTAGATGC-3¶ and 3¶-GG-AGGTGTTCACAAGACCAGGG-5¶ and adrenomedullin(ADM ) 5 ¶-GCAGAAGAATCCGAGTGTTTGC-3¶ and3¶-AATCAGTTTGTGGGCGAGCACG-5¶.Tissue Array Generation and ImmunohistochemistryCores (n = 2 for 57 tumors from our data set) of 0.6 mm
diameter were taken from paraffin-embedded tumor tissueand arrayed into a fresh paraffin block using a manualtissue arrayer (Beecher Instruments). Areas identified onH&E-stained sections to have high tumor cell content wereused. Ten nonneoplastic tissue cores with minimal or notumor cell content were also included. Immunohistochem-istry for ADM (1:50; Abcam) and PEA15 (1:500) was doneas described previously (18, 19).
ANNModel and Statistical AnalysisA single-layer perceptron was used for grading the tumor
tissue samples. The number of inputs was equal to thenumber of classifier genes and the output layer consisted of asingle neuron with a sigmoidal activation function. Initialweight values were chosen randomly and training was doneusing a standard gradient descent learning rule (or Deltarule) with learning rate g = 0.05. Calibration was done vialeave-one-out cross-validation. The weight values wereupdated after every sample and the calibration wasterminated after 100 passes (epochs) through the entiretraining set. The resulting variables for a completed trainingdefine a ‘‘model’’ (also see Supplementary Data).7,8
7 Supplementary material for this article is available at Molecular CancerTherapeutics Online (http://mct.aacrjournals.org/).8 The source code for the ANN and visualization methods is available fromhttp://www.imbb.forth.gr/people/poirazi/software.html.
Grading of Astrocytic Tumors1014
Mol Cancer Ther 2008;7(5). May 2008
on July 3, 2018. © 2008 American Association for Cancer Research. mct.aacrjournals.org Downloaded from
Published OnlineFirst April 29, 2008; DOI: 10.1158/1535-7163.MCT-07-0177
The Kaplan-Meier method was used to estimate thesurvival distributions (20). Log-rank tests were used to testthe difference between survival groups. For all of theanalyses, a P < 5.0e-2 was accepted as significant. Statisticalanalyses were carried out with the freely available softwarepackage R.
ResultsSelection of Classifier GenesTraining the ANN to Distinguish between DifferentAstrocytic Tumor Grades and Concurrent Selection ofClassifier Genes. To train the neural network, tumorsamples were randomly split into two sets in a way thatapproximately preserves the sample distribution acrosseach tumor grade. The first 20 GB, 10 AA, and 3 A were usedas a training set and 19 GB, 5 AA, and 2 A were used as a testset. A further test group of 6 astrocytic tumors comprised4 AA that had proved difficult to grade histopathologicallyand two samples belonging to grade 1 PA.
Training/calibration was done in an all-pairs approachwhereby the single problem of learning to differentiatebetween three grades (GB, AA, and A) was narroweddown to multiple two-grade problems (SupplementaryFig. SA).7 The 33 training samples were split into threesample groups each comprising two tumor grades, that is,
(a) GB-AA, (b) AA-A, and (c) GB-A. Three different typesof ANN models (A, B, and C) were then trained, eachcorresponding to their respective sample groups. For eachof these model types, genes that showed differentialexpression between the two grades in question wereselected using the signal-to-noise method (21) on theentire U133A chip genome. Training performance andoptimum number of genes required for grading wereevaluated using leave-one-out cross-validation. For everyleave-one-out run, genes were ranked according to signal-to-noise (taken over all but the left out sample) and thenthe grading success rate was determined using increasingnumbers of these ranked genes. Leave-one-out cross-validation success rates optimized to 93.3%, 84.6%, and95.6% using a total of 44, 9, and 7 probe sets for the GB-AA, AA-A and GB-A grade comparisons, respectively (seeleave-one-out plots; Supplementary Fig. SB).7
Pooling of all probe sets and elimination of redundanciesresulted in a total of 59 unique probe sets. As anticipated,hierarchical clustering of all training samples using theabove probe sets revealed clear distinctions between theGB, AA, and A tumor grades and further defined threefunctional gene classes that delineate three moleculartumor subtypes (Fig. 1; see next section for details). Thetrained/calibrated ANN models (see Materials and Meth-ods) were subsequently used for grading of the test set.
Figure 1. Hierarchical clustering of 33 training samples (20GB, 10 AA, and 3 A) using 59 probe sets selected by S2N. MeV (33) was used to performhierarchical clustering using Euclidean distance and complete linkage algorithm. Samples are labeled with their respective grades and genes are labeledaccording to the molecular tumor subtype(s) (ANGIO, DIFFER , or INTER/LOWER ) that they characterize. Gene expression values are standardized to amean of 0 and SD of 1. Red, higher expression relative to green .
Molecular Cancer Therapeutics 1015
Mol Cancer Ther 2008;7(5). May 2008
on July 3, 2018. © 2008 American Association for Cancer Research. mct.aacrjournals.org Downloaded from
Published OnlineFirst April 29, 2008; DOI: 10.1158/1535-7163.MCT-07-0177

Table 1. Three sets of selected genes each derived form one of the three pairwise tumor grade comparisons
Gene symbol Gene name Bayesian P Mean expression fold change Gene class
(A) GB-AA (ANGIO/DIFFER genes)ADM Adrenomedullin 2.62E-05 11.79 ANGIOTIMP1 Tissue inhibitor of metalloproteinase 1 1.51E-08 11.56 ANGIOFABP5 Fatty acid binding protein 5 1.85E-04 9.41 ANGIOEMP3 Epithelial membrane protein 3 5.27E-07 7.58 ANGIOPDPN Podoplanin 3.22E-05 6.00 ANGIOLGALS3 Lectin galactoside binding soluble 3 (galectin 3) 1.02E-05 5.86 ANGIOLGALS1 Lectin galactoside binding soluble 1 (galectin 1) 1.02E-05 4.41 ANGIOPDGFA Platelet-derived growth factor a polypeptide 2.03E-05 4.09 ANGIOPLAT Plasminogen activator tissue 6.60E-05 3.97 ANGIOEFEMP2 EGF-containing fibulin-like extracellular matrix protein 2 2.20E-06 3.92 ANGIOCOL5A2 Collagen type V a 2 3.71E-05 3.72 ANGIOCOL5A2 Collagen type V a 2 1.02E-05 3.60 ANGIODDA3 Differential display and activated by p53 2.06E-05 3.53 ANGIOTAGLN2 Transgelin 2 3.15E-05 3.19 ANGIODUSP6 Dual-specificity phosphatase 6 5.49E-05 3.14 ANGIOLDHA Lactate dehydrogenase A 7.84E-05 2.84 ANGIOPLP2 Proteolipid protein 2 6.34E-05 2.74 ANGIOEFEMP2 EGF-containing fibulin-like extracellular matrix protein 2 7.34E-05 2.43 ANGIOCENTD3 Centaurin d3 2.57E-04 2.42 ANGIOKIAA0495 KIAA0495 1.69E-04 2.15 ANGIODAG1 Dystroglycan 1 (dystrophin-associated glycoprotein 1) 2.73E-05 1.80 ANGIOZYX Zyxin 1.46E-04 1.78 ANGIOOSBPL10 Oxysterol binding protein-like 10 2.63E-04 1.75 ANGIOCUTC cutC copper transporter homologue 1.74E-05 -1.59 DIFFERTNKS2 TRF1-interacting ankyrin-related ADP-ribose polymerase 2 6.60E-05 -1.67 DIFFERHSA9761 Dimethyladenosine transferase 8.27E-05 -1.71 DIFFERKIAA1279 KIAA1279 2.03E-05 -1.76 DIFFERRPL22 Ribosomal protein L22 2.83E-04 -1.81 DIFFERENAH Enabled homologue 6.26E-05 -1.82 DIFFERZMYND11 Zinc finger MYND domain containing 11 4.53E-05 -1.87 DIFFERHNRPH3 Heterogeneous nuclear ribonucleoprotein H3 3.65E-05 -1.88 DIFFERRPL22 Ribosomal protein L22 2.62E-05 -1.93 DIFFERCLASP2 Cytoplasmic linker-associated protein 2 2.81E-04 -2.05 DIFFERUSH1C Usher syndrome 1c (autosomal recessive severe) 1.02E-05 -2.10 DIFFERRAP2A RAP2A 7.90E-04 -2.10 DIFFERALCAM Activated leukocyte cell adhesion molecule 4.72E-03 -2.14 DIFFERABI1 Abl-interactor 1 8.27E-05 -2.16 DIFFERPARD3 par-3 partitioning defective 3 homologue 3.43E-06 -2.30 DIFFERCRYAB Crystallin aB 5.80E-05 -2.72 DIFFERNAP1L3 Nucleosome assembly protein 1-like 3 1.77E-04 -2.88 DIFFERNET1 Neuroepithelial cell transforming gene 1 2.20E-06 -2.93 DIFFERC20ORF42 Chromosome 20 open reading frame 42 2.87E-04 -3.09 DIFFERBMP2 Bone morphogenetic protein 2 5.49E-05 -3.27 DIFFERADCY2 Adenylate cyclase 2 (brain) 3.05E-05 -3.79 DIFFER
(B) GB-A (INTER/LOWER genes)SLC34A1 Solute carrier family 34 (sodium phosphate) member 1 1.46E-02 -1.35 LOWERRSNL2 Restin-like 2 1.88E-02 -1.39 LOWERREPS2 RALBP1-associated EPS domain containing 2 1.53E-03 -1.94 LOWERSLCO1A2 Solute carrier organic anion transporter family member 1A2 4.46E-03 -2.06 LOWERPEA15 Phosphoprotein enriched in astrocytes 15 1.93E-03 -2.12 LOWERUSH1C Usher syndrome 1C 1.53E-03 -3.49 LOWER
(C) AA-A (INTER/LOWER genes)B2M b2-microglobulin 3.69E-01 2.50 INTERSCP2 Sterol carrier protein 2 4.79E-01 1.81 INTER
(Continued on the following page)
Grading of Astrocytic Tumors1016
Mol Cancer Ther 2008;7(5). May 2008
on July 3, 2018. © 2008 American Association for Cancer Research. mct.aacrjournals.org Downloaded from
Published OnlineFirst April 29, 2008; DOI: 10.1158/1535-7163.MCT-07-0177
Expression Profiles of Gene Classifiers Selected duringTraining Define Three Molecular Tumor Subtypes. Athorough examination of the selected gene classifiers, mostof which were also identified using empirical Bayesiananalysis (Table 1 and Supplementary Data),7 revealed twointeresting features. Firstly, classifying genes were found tofall within three main functional classes and secondly,these functional classes could discriminate between threemolecular tumor subtypes. The first subtype showedsignificant increased expression of genes involved in (a)wound-healing (ADM, PDGFA , and EFEMP2), (b) extra-cellular matrix constituents and remodeling machinery(LGALS1, LGALS3, PLAT, TIMP1 , and COL5A2), and (c)cell adhesion (PARD3, DAG1, Kindlin1, ZYX , and ALCAM).As all of these functions are necessary for the angiogenicproperties of cells, this subtype was labeled ANGIO andwas characteristic of the grade 4 GB samples. The nextgroup was a mixture of histopathologic and molecularsubtypes and showed increased expression of genesinvolved in (a) cell signaling and growth (BMP2, ABI1,REPS2, ADCY2 , and NET1), (b) protein biosynthesis (RPL22and ZMYND11), and (c) cell cycle (PARD3, ZMYND11 , andCLASP2). This group, labeled as DIFFER , characterizes thegrades 2 and 3 samples, which while active in growth andneuronal differentiation have not yet acquired angiogenicproperties. This group was further analyzed using a set ofgenes coding for ankyrin repeat proteins (ANK3 andANKS1B), solute carrier proteins (SLCO1A2 and SLC34A1),a protein involved in apoptosis (DNAJA3), and PEA15 , a
cytostatic and antiapoptotic phosphoprotein enriched inastrocytes (22). This analysis lead to the separation of theDIFFER group into the INTER subtype, which wascharacteristic of the grade 3 samples, and the LOWERsubtype, which was characteristic of grade 2 samples.Gene Classifiers of Particular Biological Interest. In
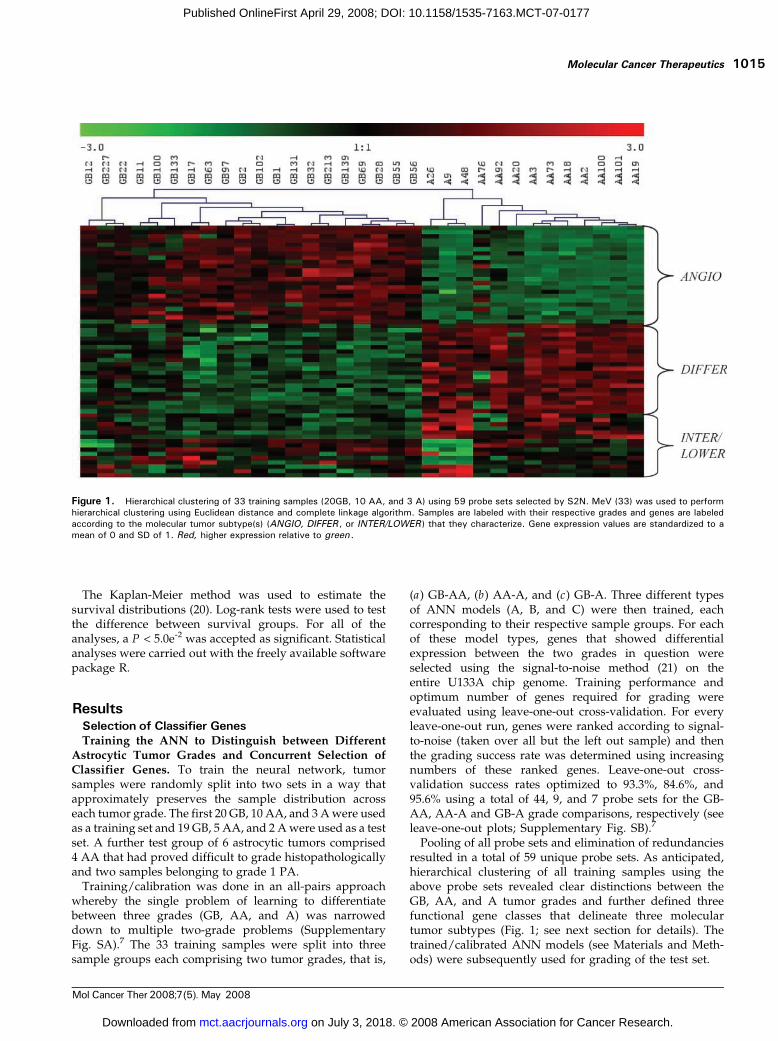
addition to the identification of three molecular tumorsubtypes, two classifiers, PEA15 (1q21.1, LOWER) andADM (11p15.4, ANGIO), were of particular biologicalinterest and/or novelty. These genes were also found tobe differentially expressed between GB-A and/or GB-AAtumor grades by empirical Bayesian analysis. Expressionchanges were validated by both QPCR and immunohisto-chemistry (Fig. 2). A further 23 differentially expressedgenes identified by Bayesian analysis were successfullyvalidated by QPCR. The correlation (R2) between Affyme-trix and QPCR GB/AA expression fold changes for thesegenes was >0.8 (data not shown).
Grading Using Trained ANNModelsGrading of Test Samples Using the Trained ANNModels into Tumor Subtypes Agrees with Prior Histo-pathologic Grading. Grading of the test set (n = 26) wasdone by passing each test sample through all models savedduring the training process (for details, see SupplementaryData).7 Through this way, the 59 genes/probes selectedduring training can be put to the test of grading a ‘‘blind’’set of tumor samples. For each test sample, an initial votingwas done by the ANGIO/DIFFER trained models. Thesamples that were graded as DIFFER received a follow-upgrading by the INTER/LOWER trained models to discrim-inate between INTER and LOWER subtypes (Supplemen-tary Table SA).7 Histopathologic grading of the test sampleswas found to agree with the tumor subtypes observedduring training. More specifically, all GB (except sampleGB154) and all lower-grade astrocytic tumors (A and AA)showed increased expression of ANGIO and DIFFERgenes, respectively. Furthermore, all A samples weredistinguished from AA by the differential expression ofINTER/LOWER genes. Overall, our ANN-defined tumorsubtypes were in agreement with prior histopathologicgrading, reporting 94.74%, 100%, and 100% accuracies for‘‘GB,’’ ‘‘AA,’’ and ‘‘A’’ grading, respectively Visualizationof network outputs using available clustering algorithms(23, 24) for all train and test samples (including annotationwith genomic metadata) is shown in Fig. 3A (also seeSupplementary Data).7
Grading of an Independently Published AstrocyticTumor Gene Expression Data Set Using Cross-Chip GeneClassifiers. To further validate the grading capacity of ourgene classifiers, we used an independent, astrocytic tumorgene expression data set published by Shai et al. (9). Of the59 probe sets selected during training from our HG-U133AGeneChips, 38 genes had >96% identity to probe sets on theU95Av2 GeneChip used by Shai et al. (9). Of these, weselected 20 genes that appeared more than once in ourleave-one-out cross-validation runs, thus ensuring that onlythe most significant probe sets were used in the cross-chipanalysis. Of these, 17 genes were differentially expressed inthe GB-AA comparison (ANGIO and DIFFER genes), 1 inthe GB-A comparison (INTER/LOWER gene), and 2 in theAA-A comparison (INTER/LOWER genes). We retrainedthe ANN models on our original training data using these
DDOST Dolichyl-diphosphooligosaccharide-protein glycosyltransferase 5.68E-01 1.79 INTERNPTN Neuroplastin 8.49E-01 1.39 INTERTAP2 Transporter 2 ATP-binding cassette subfamily B 6.92E-01 1.39 INTERDNAJA3 DnaJ (hsp40) homologue subfamily A, member 3 6.48E-01 1.25 INTERANKS1b Ankyrin repeat and sterile a motif domain containing 1b 5.17E-01 -1.21 LOWER— DKFZp434M083 5.68E-01 -1.22 LOWERANK3 Ankyrin 3 node of Ranvier 9.07E-02 -1.93 LOWER
Table 1. Three sets of selected genes each derived form one of the three pairwise tumor grade comparisons (Cont’d)
Gene symbol Gene name Bayesian P Mean expression fold change Gene class
(C) AA-A (INTER/LOWER genes)
Molecular Cancer Therapeutics 1017
Mol Cancer Ther 2008;7(5). May 2008
on July 3, 2018. © 2008 American Association for Cancer Research. mct.aacrjournals.org Downloaded from
Published OnlineFirst April 29, 2008; DOI: 10.1158/1535-7163.MCT-07-0177
20 probe sets (for gene names, see Supplementary Data).7
Due to the limited number of probe sets available for theGB-A assessment, we split the grading task into two pair-wise comparisons. ANN models of ‘‘type 1’’ were trainedto distinguish between grade 4 and lower-grade astrocytictumors using the 17 ANGIO/DIFFER genes and models of‘‘type 2’’ were trained to distinguish between grades 2 and3 tumors using the three INTER/LOWER genes. Onlysamples that were graded as lower-grade DIFFER tumorsby type 1 models required follow-up grading by type 2models. The 23 (18 GB, 3 AA, and 2 A) samples derivedfrom the Shai et al. data set were treated as a blind test setand were graded using our trained models. A remarkableconsistency was observed between the two expression datasets using the 20 common probe sets, whereby histopath-ologic and ANN-based subtyping resulted in an agreementaccuracy of 100% (2 of 2), 100% (3 of 3), and 88.89% (16 of 18)for the A (graded as LOWER), AA (graded as INTER), andGB (graded as ANGIO) tumors of the Shai et al. study,respectively (Supplementary Table SC).7
Grading of Additional Samples Difficult to GradeHistopathologically and Evaluation of ANN ResultsUsing Clinical, Histopathologic, and Genomic Annota-tion. After verifying the grading power of our molecularsignatures, we used them to identify the stage of certainsamples that were particularly challenging to diagnose byhistopathology. Histopathologic identification of PA (grade 1)and malignancy grading of astrocytic tumors that have beentreated with irradiation and/or chemotherapy can be ex-tremely difficult. We therefore examined the expression datafrom six such problem cases using the trained ANN models.
The two PA tumors (PA68 and PA67) were graded asANGIO (GB-rich) and INTER (AA-rich), respectively, byour trained ANN models (see Discussion). These tumorswere histologically typical (25) and were derived frompatients with excellent survival (alive at end of follow-up;see Supplementary Table SI).7 Samples AA49 and AA86were difficult to grade as they had received irradiation andchemotherapy. Two other AA tumors, AA29 and AA93,were also difficult to grade histologically. Grading thesesamples using our trained ANN models did not concurwith histopathologic grading and showed the grading of all4 AA samples as ANGIO (GB-rich subtype; SupplementaryTable SB).7
To investigate possible reasons for this discrepancy, weevaluated available annotation for all four ambiguoustumors in our data set as well as for the misgradedGB154 and the two grade 1 PA. In addition to histopath-ologic diagnosis, available annotation included (a) clinicaldata (age at operation, gender, primary or secondarytumor, and tumor location), (b) survival data, and (c)previously published genomic information for a total ofnine genes (CDKN2A, CDKN2B, p14ARF, CDK4, RB1,MDM2, EGFR, PTEN , and TP53) known to be affected inastrocytoma (see Supplementary Table SI).7
The histology of tumors AA49 and AA86 was difficult touse for malignancy grading as previous treatment compli-cated the findings significantly. AA49 shows a clear GB
Figure 2. Expression of ADM and PEA15 changes with astrocytictumor progression at both transcript and protein levels. A, GeneChip(chip ) expression values for ADM and PEA15 across tumor grades.Samples PA68 and PA67 (grade 1 tumors; see text) have not beenincluded in this analysis. Expression changes for both gene products arehighly statistically significant (for the AA-GB and A-GB tumor gradecomparisons, respectively: ADM, P = 1.1e-6 and 1.6e-4; PEA15, P =4.8e-5 and 8.3e-5). B, validation of expression changes using QPCR. Meanexpression fold changes between GB and AA tumor grades (Expressionfold change ) shown as assessed by both GeneChip and QPCR expressiontechnology. C, tissue array immunohistochemistry immunoreactivityintensities for ADM and PEA15 across tumor grades and nonneoplasticbrain (NT, normal tissue). Five-scale grading system used: 0, noimmunoreactivity; 4, intense immunoreactivity. For each tumor gradeand for the collection of normal tissues, an average immunoreactivitygrade was obtained from replicate tissue cores available on the tissuearray. Differences in immunohistochemistry immunoreactivity (Mann-Whitney nonparametric test, P < 5.0e-2) were significant for tumor groupcomparisons A-GB and A-AA (PEA15 ) and A-AA (ADM ).D, representativeimmunohistochemistry results for ADM and PEA15 on GB and A tumorsections. Immunoreactivity for both gene products was seen to be presentin tumor cells only. ADM showed cytoplasmic staining and PEA15 showedboth cytoplasmic and nuclear staining. The nuclear/cytoplasmic distribu-tion of PEA15 immunoreactivity was not constant for all tumor cells in agiven tumor sample.
Grading of Astrocytic Tumors1018
Mol Cancer Ther 2008;7(5). May 2008
on July 3, 2018. © 2008 American Association for Cancer Research. mct.aacrjournals.org Downloaded from
Published OnlineFirst April 29, 2008; DOI: 10.1158/1535-7163.MCT-07-0177
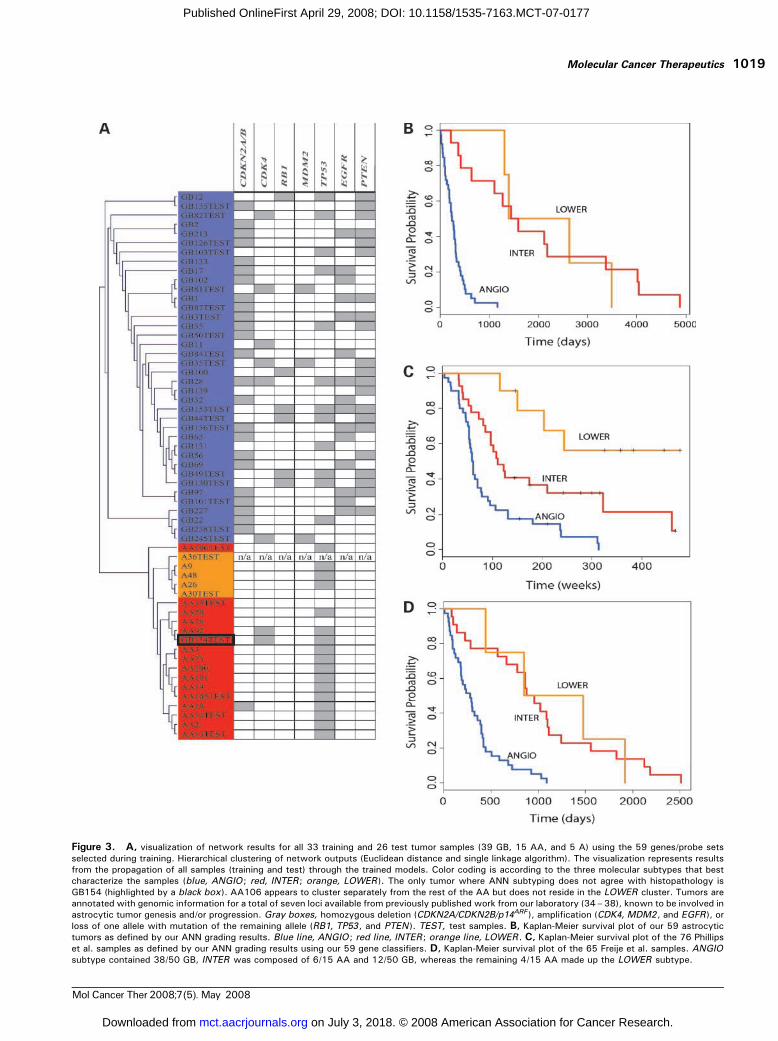
Figure 3. A, visualization of network results for all 33 training and 26 test tumor samples (39 GB, 15 AA, and 5 A) using the 59 genes/probe setsselected during training. Hierarchical clustering of network outputs (Euclidean distance and single linkage algorithm). The visualization represents resultsfrom the propagation of all samples (training and test) through the trained models. Color coding is according to the three molecular subtypes that bestcharacterize the samples (blue, ANGIO ; red, INTER; orange, LOWER ). The only tumor where ANN subtyping does not agree with histopathology isGB154 (highlighted by a black box ). AA106 appears to cluster separately from the rest of the AA but does not reside in the LOWER cluster. Tumors areannotated with genomic information for a total of seven loci available from previously published work from our laboratory (34–38), known to be involved inastrocytic tumor genesis and/or progression. Gray boxes, homozygous deletion (CDKN2A/CDKN2B/p14ARF ), amplification (CDK4, MDM2, and EGFR ), orloss of one allele with mutation of the remaining allele (RB1, TP53 , and PTEN ). TEST, test samples. B, Kaplan-Meier survival plot of our 59 astrocytictumors as defined by our ANN grading results. Blue line, ANGIO ; red line, INTER; orange line, LOWER. C, Kaplan-Meier survival plot of the 76 Phillipset al. samples as defined by our ANN grading results using our 59 gene classifiers. D, Kaplan-Meier survival plot of the 65 Freije et al. samples. ANGIOsubtype contained 38/50 GB, INTER was composed of 6/15 AA and 12/50 GB, whereas the remaining 4/15 AA made up the LOWER subtype.
Molecular Cancer Therapeutics 1019
Mol Cancer Ther 2008;7(5). May 2008
on July 3, 2018. © 2008 American Association for Cancer Research. mct.aacrjournals.org Downloaded from
Published OnlineFirst April 29, 2008; DOI: 10.1158/1535-7163.MCT-07-0177

genetic profile (homozygous deletion of CDKN2A,CDKN2B , and p14ARF, EGFR amplification, and no wild-type PTEN), whereas AA86 shows further genetic abnor-malities commonly seen in glioblastoma: lack of wild-typeCDKN2A, p14ARF , or TP53 . In the case of tumor AA29,clinical, histopathologic, and genomic evidence indicated asignificant resemblance to GB (suspicion of but no franknecrosis found and no wild-type PTEN). Tumor AA93 hada histologic and clinical appearance of an AA but sharedthe same classic GB-like genetic profile seen also for AA49.The only genetic difference between the two tumors relatedto the retention of one wild-type copy of PTEN .
The four ambiguous AA tumors classified by our ANNas ANGIO comprised 100% (2 of 2) of the EGFRamplifications, 100% (2 of 2) PTEN mutations, and 66%(2 of 3) of the CDKNA/CDKNB nullizygosity found across allthe AA samples assessed. With the exception of one INTERgraded AA tumor with CDKN2A/CDKNB nullizygosity,lesions for the cyclin inhibitor locus were totally absent in allremaining AA of our data set. All three of the AA cases,where survival data were available, died within 2 years.
No apparent reasons for the disagreement betweenhistopathology and ANN subtyping of the GB tumor(GB154) could be found. Although GB154 had somenonclassic GB characteristics, the presence of amplificationof CDK4 , necrosis, and microvascular proliferation, thelatter being major histologic criteria for glioblastoma,support the original histopathologic diagnosis. Survival inthis case was also under 2 years.
Survival AnalysisSurvival Analysis Using the Selected Gene ClassifiersReveals a Prognostic Value for Tumor Subtypes. Toinvestigate the survival prognostic capabilities of our geneclassifiers, we did survival analysis on our 59 samples asgraded by histopathology and then as defined by ourtrained ANN models into the three tumor subtypes.Although there was only a small difference betweenANN- and histopathology-based grading efforts (differenceof one sample: GB154), the survival analysis based on theANN grading proved to be more significant (P = 8.76e-7)than that based on purely histopathologic data (P = 2.088e-6)as defined by the log-rank test (Fig. 3B). Similar results wereobtained from survival analysis of the Shai et al. (9) data set.The prognostic value of our ANN defined subtypes wasequally significant (P = 6.0e-3) to that based on histopathol-ogy (P = 6.0e-3).Survival Analysis Substantiates Grading of Data SetsWhere ANN-Defined Subtypes Do Not Concur with PriorHistopathologic Grading. To our surprise, for two otherindependently published data sets, the ANN failed torecapitulate histopathologic grading. However, in bothcases, survival analysis favored the ANN-based grading.
The Phillips et al. (11) data set comprised 100 MDAsamples (76 for which survival information was available).In that study, the samples were divided into three‘‘subclasses’’ representing the progression of astrocytictumors. The subclasses were defined by the authors asproneural (PN), proliferative (Prolif), and mesenchymal
(Mes), with increasing malignancy from PN to Mes .Because those samples consisted of grades 3 and 4 tumors,we used the ANN models trained with ANGIO/DIFFERgenes to classify the 100 MDA samples into the respectivesubtypes. The ANGIO subtype consisted of 50/76 GB and4/24 AA, whereas the DIFFER subtype was comprised 22/76 GB and 12/24 AA. The ANGIO group consisted of 30/35of the Phillips et al. (11) Mes samples, in accordance topreviously published results that show that Mes tumorsdisplay overexpression of angiogenic markers (11). TheDIFFER group consisted of 33/37 of the PN samples, alsoin accordance to previous reports indicating that PNsamples display overexpression of markers of neuronaldifferentiation and growth. Further analysis of the DIFFERsurvival samples using our INTER/LOWER genes parti-tioned them into the INTER subtype, which consisted of18/76 GB and 4/76 AA, and the LOWER subtype, whichconsisted of 4/76 GB and 8/24 AA. This approach groupedthe Phillips et al. (11) samples into three very significantprognostic subclasses (Fig. 3C; P = 1.922e-7), once againoutperforming the previous subtyping defined in thePhillips et al. (11) study (P = 1.0e-4). The Phillips et al.(11) Prolif samples, which according to their studyrepresent the intermediate stage of the progression andare highly enriched for proliferative markers, were not sowell defined by our tumor subtypes. However, 20/28resided within the ANN-defined ANGIO subtype (whichwas rich in Mes samples) and 8/28 within our INTERsubtype (rich in PN samples; Supplementary Table SE).7
This was in accordance with previous published resultsthat show a very similar survival median for the Phillipset al. (11) Mes and Prolif groups and a higher angiogenicindex of the Prolif compared with the PN tumors (11). Inaddition, this concurs with the observation that the Prolifsignature is less exclusive and the proportion of astocytictumors with this signature varies across samples obtainedfrom different institutions (11).
Finally, a probe comparison between the 59 geneclassifiers used in this analysis and the final 35 probesidentified in Phillips et al. showed that there were nocommon probes between the two gene/probe sets, onceagain highlighting the novelty of our gene classifiers.
Similar results were obtained for another independentdata set containing 65 astrocytic tumors (15 grade 3 and 50grade 4) published by Freije et al. (4). More specifically, oursubtyping significantly outperformed (Fig. 3D; P = 8.13e-8)the final survival groups obtained by Freije et al. (4) in therespective publication (P = 2.2e-4).Genes Predictive of Survival versus Genes Predictive ofHistopathology. To investigate this unexpected perfor-mance on the Phillips et al. and Freije et al. data sets,whereby genes identified based on histopathology acted asprognostic signatures of survival, we decided to comparegenes predictive of survival (survival-correlated genes) andgenes predictive of histopathology (histopathology-basedgenes) within our own data set as well as within the othertwo large data sets. We initially did clustering using the top80 positively correlated and negatively correlated genes to
Grading of Astrocytic Tumors1020
Mol Cancer Ther 2008;7(5). May 2008
on July 3, 2018. © 2008 American Association for Cancer Research. mct.aacrjournals.org Downloaded from
Published OnlineFirst April 29, 2008; DOI: 10.1158/1535-7163.MCT-07-0177

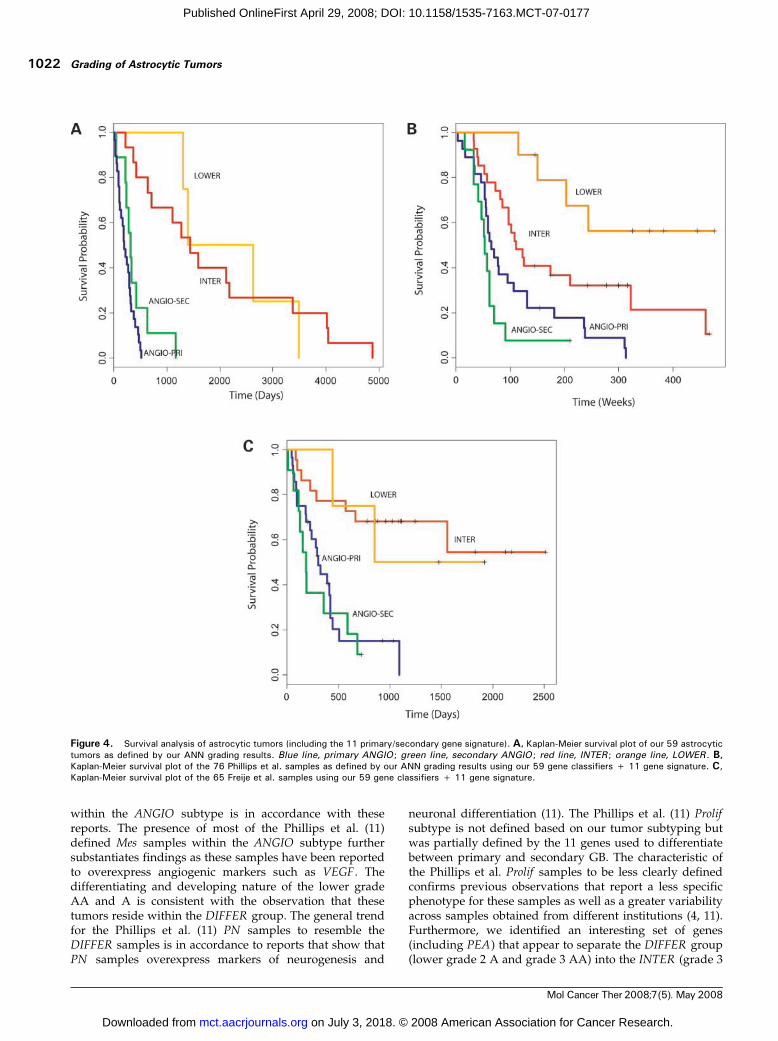
survival (Pearson’s correlation of expression values versussurvival times greater than 0.55 or less than -0.55) andobserved three major clusters. We then recalibrated ourANN to optimize leave-one-out cross-validation runsfor these clusters with survival correlated genes andresulted in an optimum set of 37 genes (see SupplementaryTable SG).7 We also did the same histologic-based analysison the two independent data sets as described earlier for ourown data set and selected the respective histopathology-based genes. Log-rank tests using histopathology-based orsurvival-correlated genes are shown in Table 2. Interesting-ly, we found that genes identified by signal-to-noise to bedifferentially expressed between histologic grades weremore successful than the respective survival-correlatedgenes in predicting survival in all data sets tested.TP53 Lesions Further Separate the Grade 4 GB into TwoSurvival Groups. TP53 mutations are observed in >65% ofsecondary GB and are considered a major hallmark thatdefines the separate molecular pathways, responsible forthe development of the secondary GB and the primary(de novo) GB. To identify genes with distinct signatures forthese two separate pathways, we did a leave-one-out cross-validation using only the GB separated into TP53 mutatedand wild-type and identified an optimum set of 11 probes(see Supplementary Table SF).7 Using these genes, the ANNseparated our ANGIO subtype into two groups denoted asANGIO-PRI and ANGIO-SEC . This distinction was moresignificant for survival prediction (P = 3.325e-2) than therespective TP53 separation (P = 7.082e-1). In the Phillips etal. data set, we found that the ANGIO-SEC group consistedof 16/28 Prolif samples and only 3/35 Mes samples,whereas the ANGIO-PRI group consisted of 12/28 Prolifand 32/35 Mes samples. This is in accordance to previousreports (26) showing that secondary GB undergo aggres-sive proliferation (as is the case with the Prolif samples) incontrast to primary GB, which show overexpression of
angiogenic genes (as is the case with the Mes samples).Survival analysis using our 59 gene classifiers and the 11gene signatures described here, for all three data sets, isshown in Fig. 4.
DiscussionIn this study, we used a simple, ANN-based approach toderive specific transcriptional signatures from histopatho-logic subtypes of astrocytic tumors and assessed whetherthese molecular signatures define survival prognosticsubclasses. We found that the classifier genes selected fallinto three distinct functional classes, which characterizethree molecular tumor subtypes, denoted ANGIO, INTER ,and LOWER . ANN-based grading into the three tumorsubtypes for our own as well as one independent data set(9) was found to accurately match prior histopathologicgrading. This was not the case for two other data sets(4, 11). To investigate this discrepancy, we did an extensivecomparison between survival correlated genes and histo-pathology-based genes. We showed that with respect tosurvival prediction (a) histopathology-based genes outper-form the respective survival-correlated genes in each dataset and (b) our histopathology-based genes outperformsurvival-correlated genes in all data sets tested. Finally,ANN analysis of TP53 mutated and wild-type samplesidentified a gene signature that appears to further separatethe ANGIO subtype into two groups reflecting primary andsecondary GB.
The prognostic nature of markers of angiogenesis andproliferation has been reported previously (27–30) withangiogenic markers (VEGF, flt1/VEGFR1, kdr/VEGFR2 , andPECAM1 ) and markers of proliferation (PCNA andTOP2A) commonly used by pathologists for astrocytictumor grading. Here, we provide a novel set of genes thatcharacterize the ANGIO subtype and appear to controlangiogenesis. The general trend for grade 4 GB to reside
Table 2. Comparison of histopathology genes and genes predicted by correlation to survival
Data set Genes used
Our 59 histopathology genes Phillips et al. histopathology genes* Freije et al. histopathology genes*
Survival ours P = 8.76e-7 P = 4.258e-5 P = 6.871e-6
Survival Phillips et al. P = 1.922e-7 P = 8.808e-8 P = 1.133e-4
Survival Freije et al. P = 8.13e-8 P = 4.55e-8 P = 2.318e-8
Our 37 surv corr genes Phillips et al. 35 surv corr genesc Freije et al. 44 surv corr genesb
Survival ours P = 4.377e-6 P = 1.871e-4 P = 4.431e-5
Survival Phillips et al. P = 2.081e-5 P = 1.0e-4 P = 3.169e-5
Survival Freije et al. P = 1.103e-5 P = 1.191e-1 P = 2.2e-4
NOTE: P values where predicted using the log-rank test after grouping the samples into survival groups.*These P values are the result of the grouping of the samples into two groups.cThese P values are the result of the grouping of the samples into three groups (23/35 genes were present on our GeneChip as we only used the HG-U133AGeneChip).bThese P values are the result of the grouping of the samples into three groups (41/44 genes were present on our GeneChip as we only used the HG-U133AGeneChip).
Molecular Cancer Therapeutics 1021
Mol Cancer Ther 2008;7(5). May 2008
on July 3, 2018. © 2008 American Association for Cancer Research. mct.aacrjournals.org Downloaded from
Published OnlineFirst April 29, 2008; DOI: 10.1158/1535-7163.MCT-07-0177
within the ANGIO subtype is in accordance with thesereports. The presence of most of the Phillips et al. (11)defined Mes samples within the ANGIO subtype furthersubstantiates findings as these samples have been reportedto overexpress angiogenic markers such as VEGF . Thedifferentiating and developing nature of the lower gradeAA and A is consistent with the observation that thesetumors reside within the DIFFER group. The general trendfor the Phillips et al. (11) PN samples to resemble theDIFFER samples is in accordance to reports that show thatPN samples overexpress markers of neurogenesis and
neuronal differentiation (11). The Phillips et al. (11) Prolifsubtype is not defined based on our tumor subtyping butwas partially defined by the 11 genes used to differentiatebetween primary and secondary GB. The characteristic ofthe Phillips et al. Prolif samples to be less clearly definedconfirms previous observations that report a less specificphenotype for these samples as well as a greater variabilityacross samples obtained from different institutions (4, 11).Furthermore, we identified an interesting set of genes(including PEA) that appear to separate the DIFFER group(lower grade 2 A and grade 3 AA) into the INTER (grade 3
Figure 4. Survival analysis of astrocytic tumors (including the 11 primary/secondary gene signature). A, Kaplan-Meier survival plot of our 59 astrocytictumors as defined by our ANN grading results. Blue line, primary ANGIO ; green line, secondary ANGIO ; red line, INTER ; orange line, LOWER . B,Kaplan-Meier survival plot of the 76 Phillips et al. samples as defined by our ANN grading results using our 59 gene classifiers + 11 gene signature. C,Kaplan-Meier survival plot of the 65 Freije et al. samples using our 59 gene classifiers + 11 gene signature.
Grading of Astrocytic Tumors1022
Mol Cancer Ther 2008;7(5). May 2008
on July 3, 2018. © 2008 American Association for Cancer Research. mct.aacrjournals.org Downloaded from
Published OnlineFirst April 29, 2008; DOI: 10.1158/1535-7163.MCT-07-0177
AA) and the LOWER (grade 2 A) subtypes and furtherdefine a prognostic class with the highest survivalprobability (LOWER).
Survival analysis suggests that histopathologic grading,although categorical and oversimplified, provides a generaltrend by which genes predictive of survival can beidentified, with prognostic value greater than histopatho-logic grading per se. Survival prognosis can be achievedeither independently or, as in the case of our data set, inconjunction with histopathology prediction. A comparisonof survival-correlated and histopathology-based genesshowed that the latter were more efficient in survivalprognosis. This was observed for our data set as well as twoother independent data sets tested. A possible explanationfor this unintuitive finding relates to the methodology usedto obtain survival prognostic groups. This involves theprediction of survival-correlated genes and the concurrentclustering of the tumor samples using these genes. Theclusters defined are considered as prognostic groups and aunique gene signature for each cluster is obtained. Thismethodology is highly dependent on clustering techniquesand may be less accurate than using histopathologic groupsto define gene expression signatures. Other reasons includethe numerous external factors that influence survivalprobability and do not directly relate to cancer, like thepatient’s age, physical and neurologic performance, etc.Genes encoding such factors will appear highly correlatedwith survival in small sample groups frequently used inmicroarray studies despite having no association withcancer per se. However, such genes may have limitedpredictive capacity when applied to other data sets.Expression profiles of histopathology-associated genes, onthe other hand, are directly linked to cancer and areexpected to be more consistent among different patients,thus having a better predictive capacity. Although there issignificant variability between different studies in speci-men processing, analysis, and tissue heterogeneity, whichis likely to affect the identification of classifier genes, ourfindings show that it is possible to use expression data toidentify genes with predictive capacity that extents acrossmultiple data sets.
Two genes of special interest have been selected forfurther analysis in this study, that is, PEA15 and ADM .Tumor-suppressing functions for PEA15 have been sug-gested (31). PEA15 suppresses DISC-mediated caspase-8 activation, limits entry to the cell cycle, and has not beenassociated previously with astrocytic tumor progression.Physiologic levels of PEA15 expressed in cultured astro-cytes are capable of restricting ERK to the cytosol, blockingERK-dependent c-Fos transcription and cell proliferation(22). Candidate tumor suppressor genes, such as PEA , mayact as major stalling points for tumor progression andperhaps the diminished expression of such genes maydirectly contribute to a cascade of events that lead to theprogression of early-grade tumors to later more malignantphenotypes. PEA15 was selected for further analysis toinvestigate its subcellular localization but also in apreliminary attempt to elucidate possible correlations
between PEA15 expression and astrocytic tumor cellprogrammed cell death. ADM is a 52–amino acid peptidesuggested to be capable of affecting tumor growth by bothdirect tumor cell-related mitogenic effects and indirectvasculature-related angiogenic mechanisms (32). ADMexpression in astrocytic tumors has been shown previously,whereas its increased expression with tumor gradeprogression was recently suggested by Tso et al. (26).ADM was selected to validate previous suggestionsrelating the peptide to regulation of angiogenesis andbecause very few publications commented on its exactsubcellular or tissue localization.
This work presents a large, new expression profiling dataset of astrocytic tumors and employs a novel ANN-basedgrading of these tumors into molecular subtypes. We showthat it is possible to derive transcriptome signatures fromthe tripartite histopathologic grading used to train theANN-model. Moreover, these signatures attain a moresignificant survival prognosis when compared with histo-pathologic grading as well as tumor subtyping reports fromother studies. We hope that the identification of the novelset of genes underlying this subtyping will enable tumordiagnosis to progress toward a more quantitative realm,where tumors are viewed within a malignancy spectrumthat includes samples from all stages of tumor progression.We also believe that the interpretation of grading andclassification efforts based on gene expression data must bedone using thorough tumor annotation on as many levelsas possible. It is the integration of such work with clinical,genotypic, and histopathologic annotation that can maxi-mize the value of gene expression data, increase ourunderstanding of tumor pathology, and further developcurrent diagnostic and therapeutic approaches.
Acknowledgments
We thank Francois Renault-Mihara, INSERM, Chaire de Neuropharmaco-logie, Paris, France, for his most generous PEA15 antibody gift.
References
1. Kleihues P, Cavenee WK. Pathology and genetics of tumours of thenervous system. Lyon: IARC Press; 2000.
2. Ichimura K, Ohgaki H, Kleihues P, Collins VP. Molecular pathogenesisof astrocytic tumours. J Neurooncol 2004;70:137–60.
3. Mischel P, Cloughesy T, Nelson S. DNA-microarray analysis of braincancer: molecular classification for therapy. Nat Rev Neurosci 2004;10:782–92.
4. Freije WA, Castro-Vargas FE, Fang Z, et al. Gene expression profiling ofgliomas strongly predicts survival. Cancer Res 2004;64:6503–10.
5. Nutt CL, Mani DR, Betensky RA, et al. Gene expression-basedclassification of malignant gliomas correlates better with survival thanhistological classification. Cancer Res 2003;63:1602–7.
6. Liang Y, Diehn M, Watson N, et al. Gene expression profiling revealsmolecularly and clinically distinct subtypes of glioblastoma multiforme.Proc Natl Acad Sci U S A 2005;102:5814–9.
7. Kim S, Dougherty ER, Shmulevich I, et al. Identification of combinationgene sets for glioma classification. Mol Cancer Ther 2002;1:1229–36.
8. van den Boom J, Wolter M, Kuick R, et al. Characterization of geneexpression profiles associated with glioma progression using oligonucle-otide-based microarray analysis and real-time reverse transcription-polymerase chain reaction. Am J Pathol 2003;163:1033–43.
9. Shai R, Shi T, Kremen TJ, et al. Gene expression profiling identifiesmolecular subtypes of gliomas. Oncogene 2003;22:4918–23.
Molecular Cancer Therapeutics 1023
Mol Cancer Ther 2008;7(5). May 2008
on July 3, 2018. © 2008 American Association for Cancer Research. mct.aacrjournals.org Downloaded from
Published OnlineFirst April 29, 2008; DOI: 10.1158/1535-7163.MCT-07-0177

10. Rickman DS, Bobek MP, Misek DE, et al. Distinctive molecular profilesof high-grade and low-grade gliomas based on oligonucleotide microarrayanalysis. Cancer Res 2001;61:6885–91.
11. Phillips HS, Kharbanda S, Chen R, et al. Molecular subclasses of high-grade glioma predict prognosis, delineate a pattern of disease progression,and resemble stages in neurogenesis. Cancer Cell 2006;9:157–73.
12. Ekstrand AJ, James CD, Cavenee WK, Seliger B, Pettersson RF,Collins VP. Genes for epidermal growth factor receptor, transforminggrowth factor a, and epidermal growth factor and their expression inhuman gliomas in vivo. Cancer Res 1991;51:2164–72.
13. Ihaka R, Gentleman R. R: a language for data analysis and graphics.J Comput Graph Stat 1996;5:299–314.
14. Gentleman RC, Carey VJ, Bates DM, et al. Bioconductor: opensoftware development for computational biology and bioinformatics.Genome Biol 2004;5:R80.
15. Barrett T, Suzek TO, Troup DB, et al. NCBI GEO: mining millions ofexpression profiles-database and tools. Nucleic Acids Res 2005;33.Database Issue: D562–6.
16. Hosack D, Dennis G, Sherman B, Lane H, Lempicki R. Identifyingbiological themeswithin lists of geneswith EASE.GenomeBiol 2003;4:R70.
17. Livak KJ, Schmittgen TD. Analysis of relative gene expression datausingreal-timequantitativePCRandthe22-DDCTmethod.Methods2001;25:25:402–8.
18. Oehler MK, Fischer DC, Orlowska-Volk M, et al. Tissue and plasmaexpression of the angiogenic peptide adrenomedullin in breast cancer. Br JCancer 2003;89:1927–33.
19. Sharif A, Renault F, Beuvon F, et al. The expression of PEA-15(phosphoprotein enriched in astrocytes of 15 kDa) defines subpopulationsof astrocytes and neurons throughout the adult mouse brain. Neuroscience2004;126:263–75.
20. Kaplan EMP. Nonparametric estimation from incomplete observa-tions. J Am Stat Assoc 1958;53:457–81.
21. Golub TR, Slonim DK, Tamayo P, et al. Molecular classification ofcancer: class discovery and class prediction by gene expressionmonitoring. Science 1999;286:531–7.
22. Renault F, Formstecher E, Callebaut I, Junier M-P, Chneiweiss H. Themultifunctional protein PEA-15 is involved in the control of apoptosis andcell cycle in astrocytes. Biochem Pharmacol 2003;66:1581–8.
23. Saitou N, Nei M. The neighbor-joining method: a new method forreconstructing phylogenetic trees. Mol Biol Evol 1987;4:406–25.
24. Eisen MB, Spellman PT, Brown PO, Botstein D. Cluster analysis anddisplay of genome-wide expression patterns. Proc Natl Acad Sci U S A1998;95:14863–8.
25. Burger PC, Scheithauer BW. Atlas of tumor pathology. Washington(DC): Armed Forces Institute of Pathology; 1994.
26. Tso CL, Freije WA, Day A, et al. Distinct transcription profiles ofprimary and secondary glioblastoma subgroups. Cancer Res 2006;66:159–67.
27. Ho DM, Hsu CY, Ting LT, Chiang H. MIB-1 and DNA topoisomerase IIacould be helpful for predicting long-term survival of patients withglioblastoma. Am J Clin Pathol 2003;119:715–22.
28. Hsu SC, Volpert OV, Steck PA, et al. Inhibition of angiogenesis inhuman glioblastomas by chromosome 10 induction of thrombospondin-1.Cancer Res 1996;56:5684–91.
29. Osada H, Tokunaga T, Nishi M, et al. Overexpression of the neuropilin1 (NRP1) gene correlated with poor prognosis in human glioma. AnticancerRes 2004;24:547–52.
30. Godard S, Getz G, Delorenzi M, et al. Classification of humanastrocytic gliomas on the basis of gene expression: a correlated group ofgenes with angiogenic activity emerges as a strong predictor of subtypes.Cancer Res 2003;63:6613–25.
31. Gaumont-Leclerc MF, Mukhopadhyay UK, Goumard S, Ferbeyre G.PEA-15 is inhibited by adenovirus E1A and plays a role in ERK nuclearexport and Ras-induced senescence. J Biol Chem 2004;279:46802–9.
32. Benes L, Kappus C, McGregor GP, Bertalanffy H, Mennel HD, HagnerS. The immunohistochemical expression of calcitonin receptor-likereceptor (CRLR) in human gliomas. J Clin Pathol 2004;57:172–6.
33. Saeed A, Sharov V, White J, et al. TM4: a free, open-source systemfor microarray data management and analysis. Biotechniques 2003;34:374–8.
34. Ichimura K, Bolin MB, Goike HM, Schmidt EE, Moshref A, Collins VP.Deregulation of the p14ARF/MDM2/p53 pathway is a prerequisite forhuman astrocytic gliomas with G1-S transition control gene abnormalities.Cancer Res 2000;60:417–24.
35. Reifenberger G, Reifenberger J, Ichimura K, Meltzer PS, Collins VP.Amplification of multiple genes from chromosomal region 12q13-14 inhuman malignant gliomas: preliminary mapping of the amplicons showspreferential involvement of CDK4, SAS, and MDM2. Cancer Res 1994;54:4299–303.
36. Ichimura K, Schmidt EE, Goike HM, Collins VP. Human glioblastomaswith no alterations of the CDKN2A (p16INK4A, MTS1) and CDK4 geneshave frequent mutations of the retinoblastoma gene. Oncogene 1996;13:1065–72.
37. Liu L, Ichimura K, Pettersson EH, Goike HM, Collins VP. Thecomplexity of the 7p12 amplicon in human astrocytic gliomas:detailed mapping of 246 tumors. J Neuropathol Exp Neurol 2000;59:1087–93.
38. Schmidt EE, Ichimura K, Goike HM, Moshref A, Liu L, Collins VP.Mutational profile of the PTEN gene in primary human astrocytictumors and cultivated xenografts. J Neuropathol Exp Neurol 1999;58:1170–83.
Grading of Astrocytic Tumors1024
Mol Cancer Ther 2008;7(5). May 2008
on July 3, 2018. © 2008 American Association for Cancer Research. mct.aacrjournals.org Downloaded from
Published OnlineFirst April 29, 2008; DOI: 10.1158/1535-7163.MCT-07-0177

2008;7:1013-1024. Published OnlineFirst April 29, 2008.Mol Cancer Ther Lawrence P. Petalidis, Anastasis Oulas, Magnus Backlund, et al. of gene expression microarray dataastrocytic brain tumors by artificial neural network analysis Improved grading and survival prediction of human
Updated version
10.1158/1535-7163.MCT-07-0177doi:
Access the most recent version of this article at:
Material
Supplementary
http://mct.aacrjournals.org/content/suppl/2008/08/28/1535-7163.MCT-07-0177.DC1
Access the most recent supplemental material at:
Cited articles
http://mct.aacrjournals.org/content/7/5/1013.full#ref-list-1
This article cites 35 articles, 16 of which you can access for free at:
Citing articles
http://mct.aacrjournals.org/content/7/5/1013.full#related-urls
This article has been cited by 8 HighWire-hosted articles. Access the articles at:
E-mail alerts related to this article or journal.Sign up to receive free email-alerts
Subscriptions
Reprints and
To order reprints of this article or to subscribe to the journal, contact the AACR Publications
Permissions
Rightslink site. (CCC)Click on "Request Permissions" which will take you to the Copyright Clearance Center's
.http://mct.aacrjournals.org/content/7/5/1013To request permission to re-use all or part of this article, use this link
on July 3, 2018. © 2008 American Association for Cancer Research. mct.aacrjournals.org Downloaded from
Published OnlineFirst April 29, 2008; DOI: 10.1158/1535-7163.MCT-07-0177